60 SEPT.-DIC. 1994 VOL. 10 N 3-4 SIMPOSIO COMISION VII ...
7
60 REVISTA SELPER VOL. 10 N" 3-4 SEPT.-DIC. 1994 SIMPOSIO COMISION VII - ISPRS: ECO-RIO '<)4 THE USE OF GEOPROCESSING TECHNIQUES FOR THE ENVIRONMENTAL PLANNING 017.THE FERNANDO DE NORONHA " ARCHIPELAGO, BRAZIL Mateus Batistella Núcleo de Monitoramento Ambiental (EMBRAPNNMA) Av. Dr. Júlio Soares de Arruda, 803 - 13088-300 Campinas, SP, BRAZIL Phone: 55-192-554332 - Fax: 55-192-541100 E-mail:[email protected] Evaristo Eduardo de Miranda Ecoforça Pesquisa e Desenvolvimento Rua José Inocêncio de Campos, 148 - 13024 230 Campinas, SP, BRAZIL Phone. 55-192-552284 - Fax: 55-192-540343 E-mail:[email protected] ISPRS; VII, WORKING GROUP 5 KEY WORDS: Geoprocessing, Ecological Cartography, Environmental Planning, Fernando de Noronha Archipelago, GIS Applications, Landscape Ecology Abstract This paper summarizes some results obtained by a research of five years about the Fernando de Noronha Archipelago.lt was carried out through the use of photointerpretation (1:10,000 scale) and digital mapping of ecological parameters, what could be done thanks to the recent development of geoprocessing in Brazil. After the delimitation of the physical envlronment and of the vegetation physiognomy, the data gathering envolved also field surveys, including the application of 618 pre-codified questionnaires with 54 variables each, and the collection of 128 soil samples. The cartographic treatment comprised the elabora- tion of a digital elevation model, conversion of topological formats, slicings, reclassifica- tions, overlays, and area measurements. The results included analytical and synthetic maps related to the main physical, vegetal and anthropic variables of the landscape. This contribuition intends to provide some scientific elements for the ecological conservation and economic development of the Fernando de Noronha Archipelago. 1. INTRODUCTION 01 the Archipelago became a Marine National Park, that included 70% 01 the terrestrial ecosystems. With the media appeal about the "Atlantic's Paradise", the touristic activities increased a lot, changing once more the local socioeconomic dynamics. However, there was lew inlormation about the biotic portion 01 the terrestrial ecosystems. Certanly, this paper does not intend to exhaust this subject, but to begin the discussion about lhe landscape ecology 01 Fernando de Noronha through the use 01 some geoprocessing tools. [ID ntil lew years ago, Fernando de Noronha was known as a distant land, just reached by lhe U local population, the researchers and the ad- rrurustrators. Since its discovering in 1503 by Americo Vespucci, this Equatorial Atlantic Archipelago has a history 01 drastic land use and ecological changes, victim 01 several economic, politic and personal interests. In the last decade, lor instance, the Archipelago was administrated by lhe Brazilian Army, the Department 01 Interior and also by the State 01 Pernambuco. Each one 01 these institutions had their own strategies and priorities lor the use 01 the renewable resources. The lirst attempl lor lhe land use planning 01 lhese islands occured in 1988 with an Agroecological Zoning, made by lhe Brazilian Agency lor Agriculture Research (EMBRAPA) and the NGO Ecolorça. Five months later, part 2. MATERIAL 2.1. Study area The Fernando de Noronha Archipelago is located at 3° 50' S and 32° 24' W geographic coordinates, 345 Km lar lrom lhe nearesl point on lhe Brazilian coast (Figure 1). Wilh 17 small islands (1926 ha), it represents lhe remainings 01 a 4000 m tall volcanic building (Almeida, 1958). ·--· •••• a Iifonltota",.".. tIO' SlCéI_ 81t11o*, AMTI
Transcript of 60 SEPT.-DIC. 1994 VOL. 10 N 3-4 SIMPOSIO COMISION VII ...

60 REVISTASELPERVOL. 10 N" 3-4SEPT.-DIC. 1994 SIMPOSIO COMISION VII - ISPRS: ECO-RIO '<)4
THE USE OF GEOPROCESSING TECHNIQUESFOR THE ENVIRONMENTAL PLANNING
017.THE FERNANDO DE NORONHA"
ARCHIPELAGO, BRAZILMateus Batistella
Núcleo de Monitoramento Ambiental (EMBRAPNNMA)Av. Dr. Júlio Soares de Arruda, 803 - 13088-300 Campinas, SP, BRAZIL
Phone: 55-192-554332 - Fax: 55-192-541100E-mail:[email protected]
Evaristo Eduardo de Miranda
Ecoforça Pesquisa e DesenvolvimentoRua José Inocêncio de Campos, 148 - 13024·230 Campinas, SP, BRAZIL
Phone. 55-192-552284 - Fax: 55-192-540343E-mail:[email protected]
ISPRS; VII, WORKING GROUP 5
KEY WORDS: Geoprocessing, Ecological Cartography, Environmental Planning, Fernando deNoronha Archipelago, GIS Applications, Landscape Ecology
AbstractThis paper summarizes some results obtained by a research of five years about the
Fernando de Noronha Archipelago.lt was carried out through the use of photointerpretation(1:10,000 scale) and digital mapping of ecological parameters, what could be done thanksto the recent development of geoprocessing in Brazil. After the delimitation of the physicalenvlronment and of the vegetation physiognomy, the data gathering envolved also fieldsurveys, including the application of 618 pre-codified questionnaires with 54 variables each,and the collection of 128 soil samples. The cartographic treatment comprised the elabora-tion of a digital elevation model, conversion of topological formats, slicings, reclassifica-tions, overlays, and area measurements. The results included analytical and synthetic mapsrelated to the main physical, vegetal and anthropic variables of the landscape. Thiscontribuition intends to provide some scientific elements for the ecological conservationand economic development of the Fernando de Noronha Archipelago.
1. INTRODUCTION 01 the Archipelago became a Marine National Park, thatincluded 70% 01 the terrestrial ecosystems.
With the media appeal about the "Atlantic's Paradise",the touristic activities increased a lot, changing once morethe local socioeconomic dynamics.
However, there was lew inlormation about the bioticportion 01 the terrestrial ecosystems. Certanly, this paperdoes not intend to exhaust this subject, but to begin thediscussion about lhe landscape ecology 01 Fernando deNoronha through the use 01 some geoprocessing tools.
[ID ntil lew years ago, Fernando de Noronha wasknown as a distant land, just reached by lheU local population, the researchers and the ad-rrurustrators.
Since its discovering in 1503 by Americo Vespucci, thisEquatorial Atlantic Archipelago has a history 01 drastic landuse and ecological changes, victim 01 several economic,politic and personal interests.
In the last decade, lor instance, the Archipelago wasadministrated by lhe Brazilian Army, the Department 01Interior and also by the State 01 Pernambuco. Each one 01these institutions had their own strategies and priorities lorthe use 01 the renewable resources.
The lirst attempl lor lhe land use planning 01 lheseislands occured in 1988 with an Agroecological Zoning,made by lhe Brazilian Agency lor Agriculture Research(EMBRAPA) and the NGO Ecolorça. Five months later, part
2. MATERIAL
2.1. Study area
The Fernando de Noronha Archipelago is located at 3°50' S and 32° 24' W geographic coordinates, 345 Km larlrom lhe nearesl point on lhe Brazilian coast (Figure 1). Wilh17 small islands (1926 ha), it represents lhe remainings 01a 4000 m tall volcanic building (Almeida, 1958).
·--· •••• aIifonltota",.".. tIO' SlCéI_
81t11o*,AMTI

REVISTA
SELPER SIMPOSIO COMISION VII - ISPRS: ECO-RIO '94VOL. 10 N" :1-4
SEPT,-DIC. 1994
FERNANDO DE NORONHA ARCHIPELAGOSLOPES + N 9.578E 566
","
LEGEND (d·sr ••• ) AREA Lh a ) X OF TOTAL
• 8 - 1 238 11,6
, 1 - 18 1817 ~9,6- 18 - 28 H4 21,7
• 28 - 6B 351 17,1
ATLANTIC OCEAN
+ NE 568
+ N 9_574E 5GB
588 50B lBB8 •• t e r s, "
SCALE
UTH PROJ[CTlON
+ N 9.571""E 562
ECOFORCA - IB/USP - NHA
Author: Hateus BatlsteLla
São Paulo, 1994
FIgure 4. (up) Figure 5. (below)
ERNANDO DE NORONHA ARCHIPELAGOATEGORY OF THE DOMINANT VEGETAL SPECIES
+ N 9.578[ 566
LEGEND AREA (hal r. OF TOTAL-'Herb. 715 37,3
_ Shrub. ( 2 • 271 1~,1
• Woody pl e n t s ~i~~•.•.2-5. 387 28,2
• Ir-e e e ) 5 • 314
229
16,4
11,9.Scarce v e g e t e t í c n.at
,c>
Ire
.tic)er + N'he 56Bde
ATLANTIC OCEAN
+ N 9.574[ 568
5BB 5BB 1888 •• ter., "
SCALE
UTH PROJECTION
ECOFORCA - IB/USP - NHAuthor: Hateus Batlstell
São Paulo 1994+ N 9,571562
61
Nt
Nt

62~VOI.. 10 N° 3-4SEf'T.-DIC. 1994 THE USE OF GEOPROCESSING TECHNIQUES FOR THE ENVIRONMENTAL...
REVISTASELPER
,.. ". 'o·,..
r
'.'(_0,.J."WLO
,,,,''...'
" '::~.;;:-~/:~.~--, --IOCA1 ,.s W•• I••••
• - - - : :,-",. 'flN"...oo 01 NO_OH"A)....,~,...-;.:,'..: ;:.':." ,~='
",/~,J~ó"no"
Figure 1. Locatlon of the Fernando de NoronhaArchipelago on the Atlantlc Oceano
The biggest island (1766 ha) is also called Fernando deNoronha. It's the only Brazilian oceanic island inhabited formore than four centuries.
The temperature annual average is about 25° C. Themonthly averages are also high, making the annual termicamplitude lower than 2°C. The precipitation annual aver-age is about 1400 mm, but with a large interannual varia-tion. The seasons are well defined and the rainy periodgoes from March to July. The evaporation is very high, dueto the equatorial radiation and the intense ESE winds.
..
About 800 bibliographic titles were catalogued inDBase files, helping the automatic search and retrieve ofthese data.
The cartographic base at 1:10,000; 1 :15,000;1:20,000; and 1:50,000 scales was classified in accor-dance to its prtorities of use.
The panchromatic aerial photos (1: 10,000) were themain primary data for the cartographic delimitation.
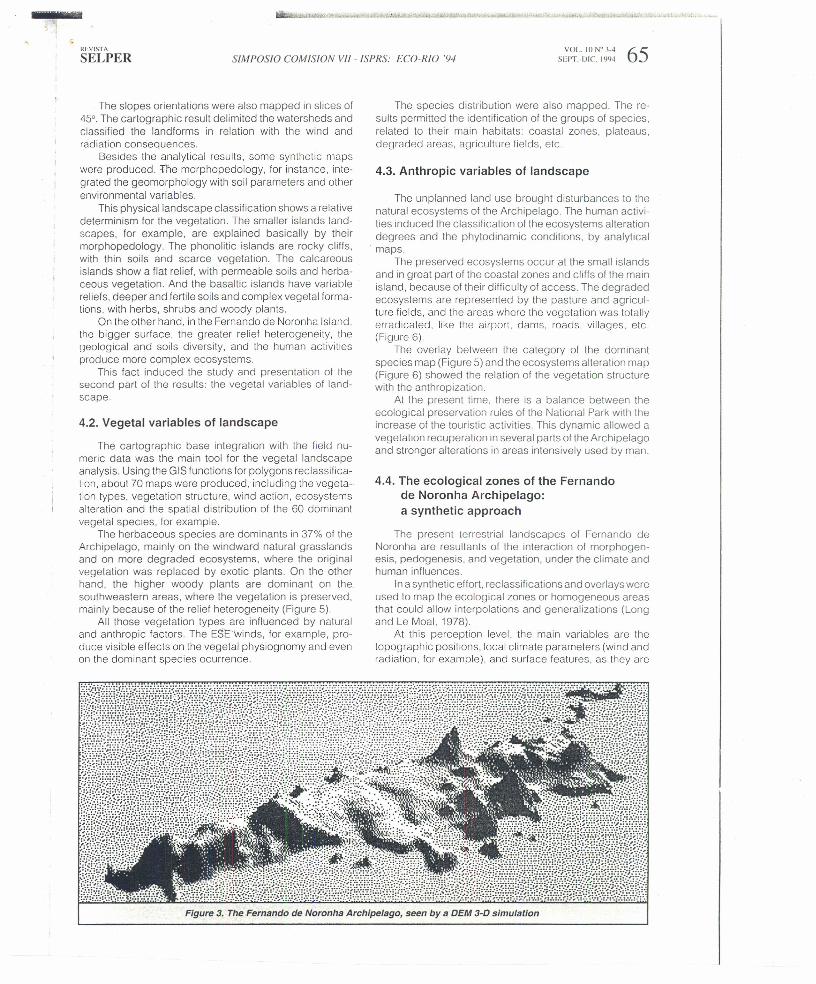
The present geomorphology is a consequence of lheclimatic, marine and fluvial actions over the volcanic sub-straturn, varying from sandy or basaltic plateaus to amaz-ing clifts (Figure 2).
As for the biological aspects, Fernando de Noronhahas several endemic species, but low faunistic and floristicrichness. Probably, the distance from continents, theunfavourable maritime currents and winds, the small sur-face and lhe semi-arid climate are the main causes of thispoor biodiversity.
The singular features of these insular systems and therecent touristic activities stimulated lhe generation of anecological cartography of the Archipelago, as a basis foran equilibrium between the economic development andthe environmental conservation.
2.2. Bibliographic, cartographicand photographic data
2.3. Equipments, digital system and softwares
During five field expeditions, several equipmenls wereused: compass, altimeter, thermometer, pH paper, auger,binocular, photographic cameras, etc.
The lab equipments included a zoom stereoscope; aPC 486 with 180Mb hard disk, 5.1/4" e 3.1/2" drives, 8Mb
Typlcal scene of Fernando de Noronha Archipielago showlng different re!ief variatlons
IEr.
ps.rE
3.
3.
tizpo
wa

REVISTASELPER VOL. 10 N· ).4SEVT.·DIC. 1994 63SIMPOSIO COMISION VII· ISPRS: ECO·RIO '94
RAM and a coloured video terminal; a graphic board UVI-340; a Super VGA high resolution video terminal, for imagesdisplay; an Ao digitizing tablet; an A4 scanner; an Aocoloured electrostatic plotter; and a laser printer.
The rectilication 01 the photointerpreted data to theUTM cartoçraphic base at 1:10,000 scale was made withoptical instruments.
The GIS software was developed by the BrazilianInstitute 01 Space Research (INPE) and is called SGI 2.4.
Other softwares included: WINDOWS 3.0, VENTURAPUBLlSHER 3.0, MICROSOFT WORD 5.5, DBASE 4.0;QUADRO PRO 1.01, FLOW CHARTING 30, NORTONEDITOR 1.3B e SCANNING GALLERY PLUS 5.0.
3. METHODS
3.1. Photointerpretation and digitalcartographic base
The photointerpretation occured in two main steps: oneIor the physicallandlorms and another ter the land use andvegetation phyisiognomy.
The landlorms mapping process consisted 01 the defi-nition 01 areas with the same structure, evolution andproblems, by the analysis 01 the various components 01 thisenvironment (climate, reliel, material, waters, morphogen-esis, pedogenesis). These territory are as are calledmorphopedological units or types 01 environment (Kilian,1981).
For the land use, the zones with similar vegetationphysiognomy were mapped (Goldsmith et aI., 1986).
At this moment, ali the available maps were stored intoa digital base, with the same resolution and topologicalformal.
The contour and hydrographical maps were digitizedwith a precision 01 0.1 mm. Some zoning proposals, thegeomorphologic and vegetation photointerpreted limitswere also digitized.
3.2. Field surveys
The photointerpretation conlirmed the environmentalheterogeneity 01 the Archipelago at se ales smaller than1:10,000. This lact suggested the choice 01 a randomstratilied sampling (Legendre and Legendre, 1983) andthe utilization 01 a standard questionnaire.
The questionnaire had 8 recognizing variables aboutthe ecological site, 22 variables related to the physicalenvironment, 17 about the vegetation and 7 related to thehuman inlluence over the environment.
At the end 01 the lield surveys, there were 618 com-pleted questionnaires and also the data about 128 soilsamples. Ali these data were organized into numeric files.related to the photointerpreted polygons.
3.3. Digital cartographic treatments
3.3.1. Digital elevation model (DEM)
The contour map 01 Fernando de Noronha was digi-tized Irom its .10 m equidistant lines and some isolatedpoints.
The samples were digitally organized and the DEMwas generated with a rectangular grid 01 45 m resolution.
This vectorial data was converted into a raster Iile withpixels 01 15 m and 256 grey tones. Several new layers weregenerated by slicing operations, synthetic shading, slopegeneration algorithms. etc.
3.3.2. Conversion 01 tormats and reclassi1ications
Ali the data input was made by vectors digitizing. TheGIS automatic lunctions lor the lormat conversion pro-duced raster files with specilic resolutions. allowing laterdigital handlings.
The reclassifications, for instance, were used in accor-dance to the field collected data (Batistella, 1993).Theprocedure consisted in giving a label for each polygon andmaking a lile with association rules in ASCII. The new mapswere the results of the numeric reclassifications.
3.3.3. Overlays
One of the main tools of a GIS is the possibility ofintegrating two or more layers.
Using boolean algorithms, the overlays were obtainedwith ANO, OR and NO operations between the classes ofthe thematic maps. The results were raster files with thesame resolution 01 the combined maps.
3.3.4, Area measurements and map generation
Although the maps store spatial inlormation, manytimes it's important to get some numeric data from them(Goodchild, 1990).
After lhe data input and manipulation, one 01 thequantitative analysis options was lhe automatic area rnea-surement. For each layer of the cartographic database, atable with the classes areas was produced.
The results were showed by the cartographic productsand their legends.
4. THE ENVIRONMENT AL PLANNINGOF THE FERNANDO DE NORONHAARCHIPELAGO (RESUL TS)
4.1. Physical variables of landscape
The physical variables of the Archipelago landscapewere described with mensurable paramelers and the de-Iimitation 01 the essential physiographic zones ormorphopedological units.
The DEM showed that the physicallandscape hetero-geneity is represented by severallandlorms: low plateauswith flat reliet, cliffs, plains, valleys, etc. The highest pointis a 323 m tall phonolitic hill.
The DEM permitted also 3-D visualizations (Figure 3).The grey tones simulate the amazing landscape of theArchipelago, in relation to its morphological aspects.
Slicing operations produced cartographic generaliza-tions, showing that almost 40% of the islands surlace arebetween 40 and 80 m high, including the main Archipelagoplateau.
The slope, more than altimetry, was one of the mainvariables that affected the land use patterns (Batistella andMiranda, 1992). Although it varies Irom 0° to 60°, more than60% 01 the Archipelago have slopes lower than 10°, sup-porting the human occupation and even the agriculturemechanization (Figure 4).

64 VOL. I() N" ).4SEPL·DIC 1994 THE USE OF GEOPROCESSING TECHNIQUES FOI? THE ENVIRONMENTAL..
HEVISTASELPER
ERNRNDOCOSYSTEMS
DE NORONHRRL TERRTION
LEGEND ARCA (h. I or TOTAL• No n e ~ 367 19,1
• Very .r:ak 499 26,0
• Weak 384 2 a, a
Me d I u 11 299 15,6
ú1 Slron9 173 9,0
• Very strong 02 4,3
_ Er r e dl c e t e d v e g e t e tl o n 113 5,2
+ N 9.574560
Figure 6. (up)
RRCHIPELRGO
+ N556 r§J .""N.
s~ »Í1!UM
roow::~!lft;oS
fHLANrlC OCmN
+ N 9.574568
5aa 500 109B melers, "
SCALEUTH I'ROJCCTION
+ N 9.571%2
EcorORCA - IB/USP - NHAulhor: Matcus Batlstell
São Pwol o , lCJq~
Figure 7. (beIOW)
RRCHIPELRGOERNRNDOCOLOGICRL
DE NORONHRZONES
LEGENDmphono(ltlc lslandsatB.saJUc t s l a n d •.:::;:;Calcareous tslandsIDHUnd.ard coas tal z e n e s of~ lhe .al" Island;:;:::Le e e e r d coas tal zones af. lhe .aln lslandªª Pj a t e e u wtth l e s s e c o Le q t c e l d í s t u r b a n c e sm Plateau .Ith .ore e c o l c g t c a l "íh'slurbances
-Hllls e í t h less ecologlcal dlsturbances~-:<HIII$ IIIIt,h "ore ccologlcal d t s t u r b e n c e s~:1J une t I o n ,I o p I S
~ Suu t h e r n e e e l e g r e e I zones
!iIIVlracao plaln
• Sapata [u r e s t
+ N 9.57456B
rE~DO DE NORONHA ISLAND
+ N 9.578566
ATLAATIC OCEAN
+ N 9.574568
5B0 50B 1000 .eter., ,
SCALEUTM PROJECTION
Dlstance oF the contourl l n e s : 68 e e t er s
+ N 9.571562
[COrORCA - IB/USP - NMâ u t h o r : Nateus Battstell
São Paulo, 1'394
Nt
Nt
REVISTA
SELPERVOL 10 N" .1-4
SE!Yr.-IJIC'. 1994 6SS/MPOS/O COMISION 1I11-/SPNS: ECO-N/O 'l)4
The slopes orientations were also mapped in slices 0145°. The cartographic result delimited the watersheds andclassilied the landforms in relation with the wind andradiation consequences.
Besides the analytical results, some synlhetic mapswere produced. Tne morphopedology, for instance, inte-grated the geomorphology with soil parameters and otherenvironmental variables.
This physicallandscape classilication shows a relativedeterminism for the vegetation. The smaller islands land-scapes, lor example, are explained basically by theirmorphopedology. The phonolitic islands are rocky cliffs,with thin soils and scarce vegetation. The calcareousislands show a flat relief, with permeable soils and herba-ceous vegetation. And the basaltic islands have variablereliels, deeper and fertile soils and complex vegetal forma-tions, with herbs, shrubs and woody plants.
On the other hand, in the Fernando de Noronha Island,the bigger surlace, the greater reliel heterogeneity, thegeological and soils diversity, and the human activitiesproduce more complex ecosystems.
This fact induced the study and presentation of thesecond part 01 the results: the vegetal variables 01 land-scape.
4.2. Vegetal variables of landscape
The cartographic base integration with the lield nu-meric data was the main toar lor the vegetal landscapeanalysis. Using the GIS lunctions lor polygons reclassilica-tion, about 70 maps were produced, including the vegeta-tion types, vegetation structure, wind action, ecosystemsalteration and the spatial distribution 01 the 60 dominantvegetal species, lor example.
The herbaceous species are dominants in 37% 01 theArchipelago, mainly on the windward natural grasslandsand on more degraded ecosystems, where the originalvegetation was replaced by exotic plants. On the otherhand, the higher woody plants are dominant on thesouthweastern areas, where the vegetation is preserved,mainly because 01 the reliel heterogeneity (Figure 5).
Ali those vegetation types are influenced by naturaland anthropic lactors. The ESE'winds, lor example, pro-duce visible effects on the vegetal physiognomy and evenon the dominant species ocurrence.
The species distribution were also mapped. The re-sults permitted the identification of the groups 01 species,related to their main habitats: coastal zones, plateaus.degraded arcas, agriculture líelds. etc.
4.3. Anthropic variables of landscape
The unplanned land use brought disturbances to thenatural ecosysterns of the Archipelago. The human activi-ties induced the classilication 01 the ecosystems alterationdegrees and the phylodinamic conditions, by analytical
. maps.The preserved ecosystems occur at the small islands
and in great part 01 the coastal zones and cliffs of the mainisland, because of their difficulty of access. The degradedecosystems are represented by the pasture and agricul-ture fields, and lhe areas where the vegetation was totallyerradicated, like lhe airport. dams. roads. villages, etc.(Figure 6).
The overlay belween the category 01 the dominanlspecies map (Figure 5) and the ecosystems alteration map(Figure 6) showed the relation 01 the vegetation slructurewith the anthropizalion.
At the present time. there is a balance between theecological preservation rules 01 the National Park with theincrease of the touristic activities. This dynamic allowed avegetation recuperation in several parts of the Archipelagoand stronger alterations in areas intensively used by mano
4.4. The ecological zones of the Fernandode Noronha Archipelago:a synthetic approach
The presenl terrestrial landscapes 01 Fernando deNoronha are resultants 01 lhe interaction 01 morphogen-esis, pedogenesis, and vegetalion, under the climate andhuman influences.
In a synthetic effort, reclassifications and overlays wereused to map the ecological zones or homogeneous areaslha! could allow interpolations and generalizations (Longand Le Moal, 1978).
At this perception levei, the main variables are thetopographic positions, local climate paramelers (wind andradiation, Ior example), and surface features, as lhey are
Figure 3. The Fernando de Noronha Archipelago, seen bya DEM 3-D simulation

66 VOL. 10 N° 3-4SEI'T.-DlC. 1994 THE USE OF GEOPROCESSING TECHNIQUES FOR THE ENVIRONMENTAL. ..
REVISTASELPER
the substratum for the vegetation. The ecosystems alter-ation degrees, produced by the human activities, were alsoanalysed for each one of the different zones.
The result was the map of the ecological zones of theArchipelago (Figure 7), that identifies 13 different classes.
In the smaller islands, the difficulty of access, thereduced surface and ,the low potentiality for agricultureproduction promoted 'their preservation.
For the Fernando de Noronha Island, the main land-scape variables can be summarized by themorphopedology (including climate lactors like the windinfluence), category 01the vegetal species and the ecosys-tems alteration degrees. This last one is one 01 the mosteffective variables lor the main island, inlluencing directlythe organization of the ecological space, the vegetationand even the dominant species occurrence. The plateauzones, the hills with more or less disturbances, the junctionslopes and the southeastern ecological zone are the bestexamples of this situation.
In the zones where the anthropic influence is weaker,other variables are more important. The coastal zones, forinstance, are distinguished mainly by the winds orientation.
Other example is the Viração plain, where the physi-ographic isolation promotes special features of microcli-mate and vegetation. The Sapata forest was also pre-served because of its steep reliel.
5. CONCLUSIONS
The natural resources of the Fernando de NoronhaArchipelago and its beatiful landscapes were always 01great interest. Unlortunately, this lact does not impede theterrestrial ecosystems alteration.
The responsibility lor the Archipelago administrationhas increased, since it is a National Park and there areenvironmental problems caused by the touristic activities.
This research project intended to provide some scien-tific elements lor the environmental planning 01 Fernandode Noronha, through the use 01geoprocessing techniques.
Ali the maps and the digital database are available atthe EMBRAPA/NMA and the NGO Ecolorça. Certainly, theuse 01 the results could improve, with greater objectivity,the association 01the socioeconomic development with theconservation practices.
REFERENCES
ALMEIDA, F. F. M, 1958. Geologia e petrologia do Arquipélago de Fernando de Noronha. MARA-DGM, Monografia 13,Ministério da Agricultura-Divisão de Geologia e Mineralogia, Rio de Janeiro, 181 p. ir
BA TlSTELLA, M, 1993. Cartografia ecológica do Arquipélago de Fernando de Noronha. Dissertação de Mestrado,DEGIIB·USP, São Paulo, 235 p. iI.
BATlSTELLA, M; MIRANDA, E. E. de., 1992. Ecologia da paisagem do Arquipélago de Fernando de Noronha. tn:Congresso Latinoamericano de Ecologia, 2; Congresso Brasileiro de Ecologia, 1, Caxambu, Brazil, pp. 177-178.
GOLDSMITH, F. B.; HARRINSON, C. M; MORTON, A. J, 1986. Description and analysis of vegetation, In. Moore, P'O;Chapman, S. B. (eds.), 1986. Methods in Plant Ecology, Backwell, Oxford, pp. 437-524.
GOODCHILD, M F., 1990. GIS and basic research: The National Center for Geographic Information and Analysis.NCGIA, Santa Barbara. 15 p.
KILlAN, J., 1981. Assessment of environmental stability and instability in morphopedological cartography with aview to agrlcultural development. University of Bem, Bem, 10 p.
LEGENDRE, L.; LEGENDRE, P., 1983. Echantillonnage et traitement des données. In: Frontier, S., 1983. Stratégiesd'échantillonnage en écologie. Masson, Paris, 494 p.
LONG, G.; LE MOAL, Y., 1978. Bases écologiques et socio-économiques du développement alternatif des zonesrurales marglnalisées. ~conomie Rurale, 124 (2), pp. 23-29.