6 th sem mech manual 2014-15 - Annamalai...
51
i ANNAMALAI UNIVERSITY DEPARTMENT OF MECHANICAL ENGINEERING Mechanical Engineering Laboratory Instruction Manual cum Observation Note book (Internal Combustion Engines Lab) VI Semester B.E., Mechanical Engineering 2014-2015 Name : ……………………………. Roll No: …………………………. Batch: ……………………………
Transcript of 6 th sem mech manual 2014-15 - Annamalai...

i
ANNAMALAI UNIVERSITY
DEPARTMENT OF MECHANICAL ENGINEERING
Mechanical Engineering Laboratory
Instruction Manual cum Observation Note book (Internal Combustion Engines Lab)
VI Semester B.E., Mechanical Engineering
2014-2015
Name : …………………………….
Roll No: ………………………….
Batch: ……………………………

ii
ANNAMALAI UNIVERSITY
DEPARTMENT OF MECHANICAL ENGINEERING
VI SEM .BE MECHANICAL 2014-2015.
MECHANICAL ENGINEERING LABORATORY - II
AA.. I C Engines Lab [[VENUE: I C Engines Laboratory Main]
1. Study & Performance test on Kaeser air compressor test rig.
2. Load test on Batliboi Engine.
3. Heat balance test on Field Marshal 6 HP Engine.
4. Load test on Kirloskar AV I engine (Double arm type).
5. Load test on PSG 5 HP Engine.
BB.. DDYYNNAAMMIICCSS Lab
1. Determine the characteristic curves of
Watt Governor
Hartnell governor
2. (i) Study and experiments on static and dynamic balancing of rotating masses.
(ii) Whirling of shaft. - Determination of critical speed
3. (i) Study and experiments on Cam Analyzer.
(ii) Experimental verification of natural frequency of un-damped
Free vibration of equivalent spring mass system.
4. Determination of mass moment of Inertia of Fly wheel.
5. Determination of mass moment of Inertia of connecting rod with flywheel.
PROPERTIES OF FUEL
Calorific value of Diesel : 42,000 kJ/kg.
Specific Gravity of Diesel : 0.835
Density of water : 1000 kg/m3
iii
Instructions to the students
1. Be regular and be punctual to classes
2. Come in proper uniform stipulated
3. Ensure safety to your body organs and laboratory equipment
– SAFETY FIRST DUTY NEXT
4. Read in advance the contents of the instruction manual pertaining to the experiment
due and come prepared. Understand the related basic principles.
5. Maintain separate observation and record note books for each laboratory portion of
the course wherever justified.
6. Though you work in a batch to conduct experiment, equip yourself to do
independently. This will benefit you at the time of tests and university examinations.
7. Independently do the calculations and sketching. If there is difficulty, consult your
batch mate, classmate, teacher(s) and Laboratory in-charge.
Do not attempt to simply copy down from others. You may fulfill the formalities
but you stand to loose learning and understanding
8. Obtain the signature of teacher (s) in the laboratory observation note book and
record note book then and there during class hours (with in a week subsequent to
experimentation).This will relieve the teacher (s) from giving reminder.
9. Help to maintain neatness in the laboratory.
10. Students are advised to retain the bonafide record notebook till they successfully
complete the laboratory course.

iv
CONTENTS
Sl No Date Name of the Experiment Staff Signature

v
CONTENTS
Sl No Date Name of the Experiment Staff Signature

1
Expt.No : Date :
STUDY AND PERFORMANCE TEST ON KAESER AIR COMPRESSOR
Study on Kaeser Air compressor
Introduction:-
Air Compressors are used to raise the pressure of air with the minimum expenditure
of energy. An air-compressor sucks the air from the atmosphere, compresses it and delivers
the same under high pressure to a storage tank.
Since the compression of air requires some work to be done on it, some form of
prime mover must drive a compressor.
The compressed air is used for many purposes such as for operating pneumatic drills,
rivets, road drills, paint spraying, air motors and in starting and supercharging of I.C. Engines
etc. It is also utilized in the operation of lifts, rams, pumps and a variety of other devices. In
heavy vehicle automobile, compressed air is also used for power brakes.
Air Compressors are classified into:
a) Reciprocating air compressors
b) Rotary air compressors.
Classification of Reciprocating Air Compressor:
(i) Single acting compressor,
(ii) Double acting compressor,
(iii) Single stage compressor,
(iv) Multi stage compressor
Single acting reciprocating compressor: In single acting compressor the air is compressed in
the cylinder on one side of the piston.
Double acting compressor: In double acting compressor the air is compressed on both
sides of the piston.
Single stage compressor: In single stage compressor, the air is compressed in a only one
cylinder.
Multi stage compressor: In multistage compressor, the air is compressed in two or more
cylinders. Multi stage compression is done to achieve high pressure ratio. In a compressor
when compression ratio exceeds 5, generally multistage compression is adopted. The
following arrangements are generally in practice for reciprocating compressors.
No. of stages Delivery press
One up to 5 bars
Two 5 to 35 bar
Three 35 to 85 bar
Four above 85 bars

2
According to pressure range the compressors are also classified as:
Fans : Pressure ratio is 1 to 1.1
Blowers : Pressure ratio is 1.1 to 4.0
Compressors : Pressure ratio is above 4
In this experiment the compressor given for study is Keaser air compressor, which is a single acting, two stage, air cooled reciprocating air compressor .The specifications of the compressor is also given below.
Some Important parts and their functions:
Low pressure cylinder: Air is compressed from atmospheric pressure to intermediate
pressure in L.P. Cylinder.
High Pressure Cylinder: Air is compressed from intermediate pressure to delivery pressure
in H.P Cylinder.
Inter Cooler: Air is cooled in between the two compression stages at constant pressure.
After Cooler: Air is cooled after the compression is over to accommodate more air in the
receiver tank.
Air Filter: It filters dust particles from the air. Otherwise the dust particles will adhere the
inner surface of the cylinder and thereby increases the friction between the cylinder and
piston. Due to this more power loss, wear and tear will be taking place.
Orifice Meter: It is used to measure the actual flow of air for compression by
measuring pressure difference across the orifice using manometer.
Air Stabilizing Tank: During suction stroke, the air from atmosphere is sent into the LP
cylinder. During compression, air is sent to HP cylinder through inter cooler. The flow of air
in the pipe line from atmosphere to the LP cylinder is not uniform (i.e. intermittent) due to
the suction of the air taking place in the alternative strokes. To measure the flow rate of air,
the flow must be uniform across the orifice. Otherwise the manometer reading will
fluctuate. Hence an air stabilizing tank is introduced between orifice meter and LP cylinder.
This stabilizes the flow of air between the air filter and stabilizing tank. While connecting
the pipe line and the stabilizing tank, see, that these are connected in diametrically
opposite. However, air stabilizing tank, is fitted only in the experimental air compressors to
measure the flow rate of air.
Safety Valves: It releases the air when the pressure of air exceeds the desired limit.
Pressure Cut off Switch: It is a device used to disconnect the electrical circuit, when the
pressure of air in the receiver tank reaches the desired pressure. This disconnects the
circuit of no volt coil in the Star-Delta Starter; thereby it switches off the motor.

3

4
Prime mover and Dynamometer: The prime mover used for the compressor is a trunnion
type electrical motor. This motor itself is acts as dynamometer to measure the input power
of the compressor.
Work done on P-V diagram of compressor:
Fig.2 P-V diagram for Single stage air compressor.
The P-V diagram of a single stage reciprocating air compressor with zero clearance is
shown in Fig.2 The air is sucked in from the atmosphere during the suction stroke AB at
pressure Pa(i.e. at atmospheric pressure). At the end of suction stroke the air is
compressed polytropically during the part of its return stroke (process BC). During
compression stroke the pressure and temperature of air increases and volume decreases.
This happens until the pressure Pd (delivery pressure) in the cylinder is sufficient to
force open the delivery valve at C after which no more compression takes place. The
delivery occurs during the remainder of the return stroke CD. The work done on the air per
stage is area ABCDA. In the case of air compressors, the inlet and outlet valves are
operated by pressure difference only. Not by any external means.
Fig.3 P-V diagram for two stage air compressor with inter cooling.
The air is sucked in LP cylinder during the suction stroke at intake pressure Pa
and Temperature Ta. After compression in the first stage from B to E it is delivered to the
intercooler, at a constant pressure Pi. The air is cooled in an intercooler, at a constant
pressure Pi before passing it to second stage. The process of inter cooling is represented by
the line EF. The air from the intercooler is then directed to the second stage of
compression FG to the delivery pressure Pd. Then the air delivered to the receiver tank at
constant pressure Pd. This process is represented by GD in the P-V diagram. The shaded
area CEFGC shows the amount of work saved due to two stage compression with inter
cooling per cycle.
D C

5
Performance test
Aim: To determine the volumetric efficiency of the low pressure cylinder of Keaser Air
Compressor at NTP condition, and to draw the performance characteristics curve of a
compressor .
Specifications:
Type :
Speed :
Type of cooling :
Bore
L.P. cylinder :
H.P. cylinder :
Stroke :
Maximum pressure :
Motor output :
Free air delivered :
Precautions:
1. Before starting the experiment, the air which is already compressed if any in the
reservoir is released out so that initial gauge pressure in compressor reservoir is
zero/atmospheric.
2. The initial load on the motor while starting should be avoided by opening the
valves provided at the top of the L.P. and H.P. cylinders.
3. The pin is inserted on the torque arm hole to prevent jerk while starting.
4. After starting the motor the pin is removed to get the correct load on the motor.
Procedure:
1. The motor is started using the automatic star-delta starter by pressing the
green colour button.
2. The valves provided at the top of the LP and HP cylinders, water drain cock and
the air outlet valves are closed after the motor has gained its speed and attains 960 rpm.
The increase in pressure of air in the receiver tank is indicated by the pressure gauge.
3. The pressure of air is maintained constant to the desired value (say 2 kgf /cm2)
by adjusting at the opening of the compressed air outlet valve in the reservoir manually.

6
4. The following observations are to be taken by keeping reservoir pressure
constant. Say (2 kgf / cm2)
a) Speed (N)
b) Manometer reading (��)(Pressure difference across orifice)
c) Temperature of air entry to LP cylinder [T1]
d) Temperature of air entry to HP cylinder [T2’] after attaining the steady state
condition.
e) Load on the motor in kgf. [Tm1-Tm2]
5. The same procedure of observations are to be made for the other reservoir
pressures [4,6,8,10,12 Kgf / cm2]
6. Then the motor is switched off by pressing the red color ( or off) button of the
starter after removing the load on the motor. This can be done by opening the valves
provided at the top of LP and HP cylinders.
.
Note : The load on the motor[Tm1-Tm2] has to be taken by keeping the torque arm
horizontal and this position can be verified by inserting the pin into the torque arm hole.
Observations:
Room Temperature [Ta] :_________oC Orifice dia. [do] : _____mm.
Sl.
No
Receiver pressure
(P3)
Speed
N
Entry temp Manometer
reading(hw) in mm
Load on
motor
(��� � ����
kgf/cm2
(gauge)
Bar
(abs.) Rpm
LPC
��
HPC ��
�
L
(left
arm)
R
(right
arm)
L+R � �
Note :1 kgf / cm2 (gauge) = (1 x 0.981) + 1.013 bar [Absolute] Bar

7
Specimen calculations: (For gauge pressure = kg/cm2)
1. Density of air (ρa)���
��� =
��
��� =
�.��� � ���
��� ������ � =
Where
Pa = Atmospheric pressure, 1.013 x 10⁵N/m
2
Ra = Universal Gas constant, 287 J/kgK
Ta = Room Temperature in Kelvin
2. Pressure head in terms of air (ha), m
ρa ha = ρw hw
�� = ����
��
= � ����
=
where
ρw = density of water = 1000 kg/m3
hw = head of water in m=( 10�� m)
3. Velocity of air through orifice, (Va), m/sec. = �2��
4. Area of orifice, (m2) = (Ao) =
����
�where do = dia of orifice= 18 mm = 0.018 m
� �.�� ���.���
�� 2.54 � 10��

8
5. Volume flow rate of air at inlet condition (Qa), (m3/sec) = �� � �� � ��
Where Cd = Coefficient of discharge of orifice = 0.6
6. Vol.of air compressed at NTP (Normal Temp. and Press.),( m3/sec.)
Qa at NTP = �����
�
7. Theoretical Volume of air, m3
/sec Qth = �����
� � ��
where
L = Stroke length of LP cylinder = 0.076m
N = Speed in rpm
D = Diameter of LP Cylinder = 0.110 m
8. Volumetric efficiency of the L.P. Cylinder, % = ��!��
��
x100

9
9. Input power , (kW) =� � " � # � $ � �%�%��
�������
where, R = Torque arm length = Half the distance between the spring balance centers.
��� ��� �� �� !��� � ����"# �����# ; � % �&��� �' ��� ����( % 960 +&�
10. Mass flow rate of air [Ma], kg/sec. = �� ρ�
11.Isothermal power ,(kW) =�� �� ��
���� x � ���
��
�
Where P3 = Receiver pressure in bar
P1= atmospheric pressure = 1.01325bar
Ra = 287 J/kgk
T1 = Atmospheric temperature in K
12. Isothermal efficiency = &'()*+,-./ 0(1+,
&203)0(1+, x 100

10
13. Adiabatic power in kW = � �
���� � ��� ��
����� x �T� � T�
�� � ����
�!
����
�� � 1�
Where γ = 1.4 [Ratio of Specific heats]
�� , ���
are in Kelvin
14. Adiabatic efficiency,(%) = 456.7.)68 0(1+,
&203) 0(1+,
15. Free air delivered,� -�
9: ;� =
<�
&203) 0(1+,
16. Heat rejected in inter cooler,( kJ/sec). % -�� �&� -�� � ���. .
Where T2 = Temperature of air entry to intercooler
ie T2= T�x 0=�
=
1�
�

11
Where n = 1.35
T1 = Atmospheric temperature in k.
Where P2 = Intermediate pressure assuming perfect inter cooling, P1 = Atmospheric
pressure.
P2 = �P�xP� bar.
Cp of air = 1.005
Draw the following performance characteristic curves graphs:
Receiver Pressure (P3)
�3 Volumetric efficiency.
�3 Isothermal efficiency.
�3 Adiabatic efficiency.
�3 FAD.
�3 Heat lost in the intercooler.
RESULT
The performance test on Keaser air compressor was conducted and the
volumetric efficiency of L.P cylinder at NTP condition was determined at various
receiver pressure , and the various performance characteristic curves of the were
also drawn

12
Result Tabulation: Sl.No Recei. Press.
P3, (bar)
(abs.)
�� ��
���
��� ��
���
Vol.η %
I.P kW
Adiabatic Isothermal Heat rejected
��/
FAD
�� �⁄ � ���⁄ Power kW
η in %
Power kW
η in %
5
FAD – Free Air Delivered.(The FAD is actual volume delivered at the stated pressure reduced to intake temperature and pressure and is expressed in cubic meter per min).

13
Expt.No : Date:
LOAD TEST ON BATLIBOI ENGINE
Aim:
To conduct a load test on BATLIBOI engine by running the engine at different loads at
1500 rpm and to find the economic load. Also determine the load characteristics of the engine.
Instruments required:
Tachometer to measure the speed of the engine
Stop-watch to note the time for a definite volume of fuel consumption.
Specifications:
Type :
No. of strokes per cycle :
Type of cooling :
Fuel used :
Speed :
Power :
Bore :
Stroke :
Procedure:
1. After evaluating the full-load of the engine in kgf with the help of specifications given, check
the fuel level in fuel tank, level of lubricant in the sump as indicated by the dipstick, and no-
load on the engine as indicated by the loading device etc, before starting the engine.
2. Start the engine by cranking and allow it to run for 5 to 10 minutes to attain steady condition
at its rated speed of 1500 rpm.
3. Now, load the engine to 20 % of full-load. Then check and adjust for its rated speed and note
down the actual load on the engine.
4. Note the time for 10 cc of fuel consumption twice at this load and average the values.

14
5. In the same way, maintain the speed at rated value and note the time for 10cc of fuel
consumption at 40 %, 60 %, 80 % of full load, full load and at no load. After taking no load
reading at last the engine is stopped by engaging the fuel cut off lever.
Note: At the beginning of the experiment, the conditions of viscous friction will be more from
that at steady running. Hence observation at no load if made at the beginning will result in
arriving of incorrect higher fuel consumption value. In order to overcome this error
observations at no load are to be made at the end of the experiments.
Preliminary calculations:
Full-load can be estimated by using the following equation.
BPrated = ���
�
Where,
BPrated - Brake power in kW
Wmax - Maximum load applied on the hydraulic dynamometer in Newton
N - Speed in rpm.
C - dynamometer constant [29323.3]
Wmax = ����
�

15
Observations:-
Speed to be maintained ___________rpm
Sl.
No
%of
load
Calculated load
(T1-T2)
Applied load
(T1-T2)
Time taken for 10cc of fuel
consumption in sec
N kgf kgf N t1 t2 tave
1
2
3
4
5
6
Note: At the beginning of the experiment, the conditions of viscous friction will be more than that at steady
running. Hence observation at no load if made at the beginning will result in arriving of incorrect higher fuel
consumption value. In order to overcome this error observations at no load are to be made at the end of the
experiment
Specimen calculations: (For ……………% of load)
1. Fuel Consumption [FC], kg/hr
= Vol. flow rate, cc/s x density of fuel, kg/cc x 3600 s/hr.
=� ��
����
� x Sp. gravity of diesel x density of water in kg/cc x 3600
FC = � ��
�x 0.835 x 1000 x 10�� x 3600 � _____________kg/hr

16
2.Brake Power (BP) = ���
�
3. Specific Fuel Consumption [SFC], (kg/kW-hr) = ��
SFC = --------------- = …………. kg/kW-hr
4. Frictional Power [Fr. P], kW
To be obtained from the graph of BP Vs FC by extrapolation method. Frictional power is assumed to be constant at all loads.
Fr.P =
5. Indicated Power [IP], (kW) = BP+ Fr.P
IP =
6. Mechanical Efficiency = �� � �����
��������� ����� x 100
ηMech =

17
7. Fuel Power [Fu.p] (or) Heat Input, (kW) = ��,���
�����.�,���
���
�!! [C.V of Diesel 42,000� " #��
Fu P =
8. Brake Thermal Efficiency =
$%�& �����x100
ηBth =
9. Indicated Thermal Efficiency = �
�%�& ����� x100
ηIth =
10.Brake Mean Effective Pressure [BMEP],(bar) = �����
� ���
��� � � � ��� �
= �� � ��
��� �� � in bar
BMEP =
N’ = Number of power strokes per minute.
For 4 stroke engine N' ='(; For 2 stroke engine N' = N; n = Number of cylinders
A = Area of bore(m2)= )*�
+ (d = Dia of bore in m)= …………….m2; L = Length of stroke,m

18
11. Indicated Mean Effective Pressure [IMEP] (bar) = �����
������
IMEP =
12. Torque, Nm = �� � ����
where ω = angular velocity
= ��
�
Draw the following Graphs:
1. BP Vs SFC,
B.Th. efficiency,
2. BP Vs I.Th.efficiency,
Mech. efficiency,
IMEP,
BMEP ,
Torque

19
RESULT TABULATION
Sl No Appl.load BP F C S F C Fu.P I P �� �� �� �� ����� BMEP IMEP Torque
� �� ��/� ��/�� � �� �� �� % % % �� �� �
1
2
3
4
5
6
Result : The Load test on BATLIBOI Engine was conducted at different load condition, the economic load of engine was found at ___________rpm is ________kW and the corresponding performance characteristic curve were also drawn.

20
Extrapolation (or) Willan’s line method:
Extrapolation (or) Willan’s line method:
This is a method of determining the friction power and hence the indicated power of C.I
engine. It is based on the fact that at part loads the combustion is completed within the
engine cylinder. Hence at a given speed the rate of fuel consumption bears a linear relationship
with power output/torque.
A plot therefore of rate of fuel consumption versus power output/torque at a
particular speed will be a straight line in the light load region. This straight line is Willan’s line.
The amount of negative power output/torque obtained by extrapolation of the plot at zero rate
of fuel consumption represents the frictional power (power required to over come friction) of
the engine at the specified speed.
The rapid increase in the slope of Willan’s line at high load denotes a reduction
in combustion efficiency as more and more fuel is pumped in to the given volume of air.
Since petrol engine is throttled to maintain a high fuel/air ratio with load,
combustion is not complete with in the cylinder. In this case a plot of power output versus rate
fuel consumption does not yield a straight line. Hence extrapolation is difficult and not suitable
for use with petrol engines.
Note: Finding friction power in this method directly depends on the flow rate of fuel consumed.
It has to be noted that any fuel leak in the fuel line will result in incorrect frictional power.
BP in kW
BP Vs. FC (Extrapolation Method)
0
0.2
0.4
0.6
0.8
1
1.2
1.4
1.6
1.8
2
-1.5 -1 0 0.5 1 1.5 2 2.5 3 3.5 4-0.5 Friction Power
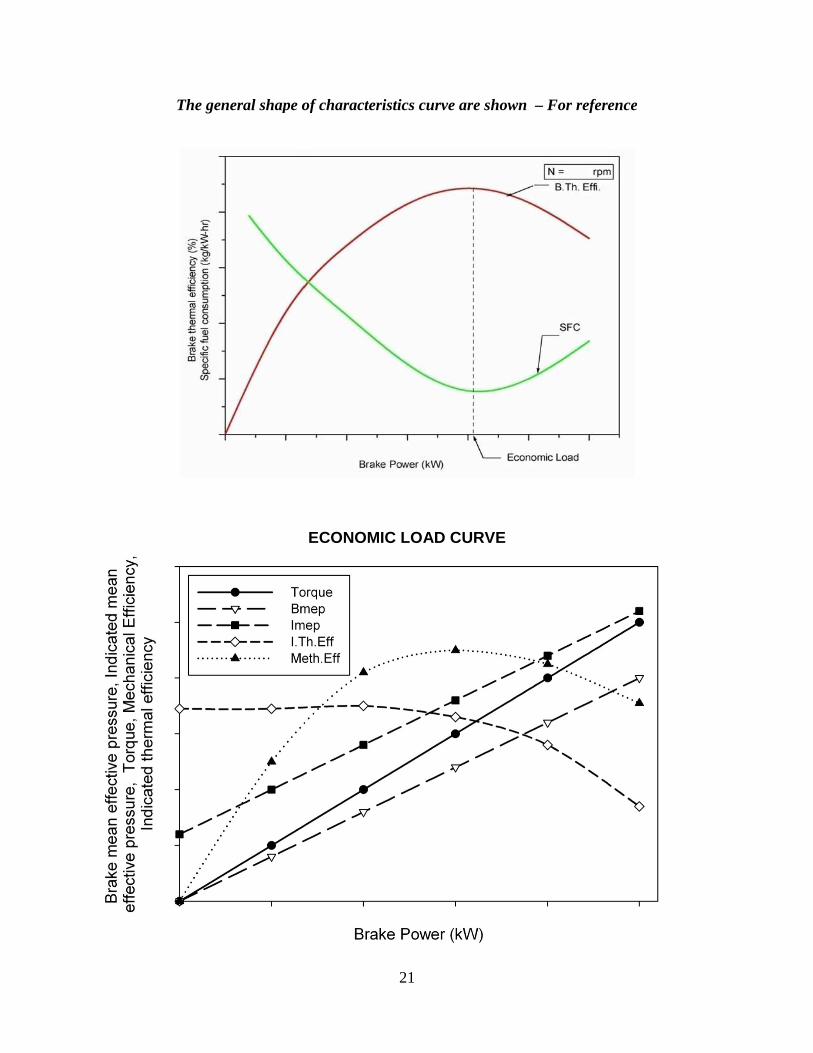
The general shape of characteristics curve are shown
21
shape of characteristics curve are shown – For reference
ECONOMIC LOAD CURVE
For reference

22
Expt.No : Date:
HEAT BALANCE TEST ON FIELD MARSHAL 6 HP ENGINE
Aim:
To conduct a HEAT BALANCE test on Field marshal 6 HP engine , and to draw the heat
balance chart on percentage basis.
Instruments required:
Friction brake to indicate the load,
Digital tachometer to measure the speed of the engine(Non contact type),
Stop-watch to note the time for a definite volume of fuel consumption.
Specifications:
Type :
No. of strokes per cycle :
Type of cooling :
Fuel used :
Speed :
Power :
Bore :
Stroke :
Procedure:
1. After evaluating the full-load of the engine in kgf with the help of specifications
given, check the fuel level in fuel tank, flow of cooling water to the engine, level of lubricant in
the sump as indicated by the dipstick, and no-load on the engine as indicated by the loading
device etc., before starting the engine.
2. Note down the initial thermometer readings of exhaust gas, cooling water inlet and
outlet and room temperature before starting the engine.
3. Adjust the cooling water flow rate to get appreciable temperature difference
between cooling water inlet and outlet. (Approximately 6 to 8 lit/min)
4. After ensuring the no load on the dynamometer dial, start the engine by cranking
and allow it to run at its rated speed of 660 rpm for 5 to 10 minutes to attain steady
state conditions.

23
5. Note down the following observations after attaining the steady state conditions at
no load.
(i) Temperature of cooling water inlet ,��� in oC
(ii) Temperature of cooling water outlet, ��� in oC
(iii) Temperature of exhaust gas , �� in oC
(iv) The flow rate of cooling water , Mw in Kg/sec
(v) Time for`10'cc of fuel consumption in secs
6. In the same way note down the above observations at 20%, 40%, 60%, 80% of full
load and at the full load.
7. After taking all the readings, the load on the engine is to be removed. The flow of
cooling water to the brake drum is to be cut off. Then the engine is to be stopped by engaging
fuel cut off lever.
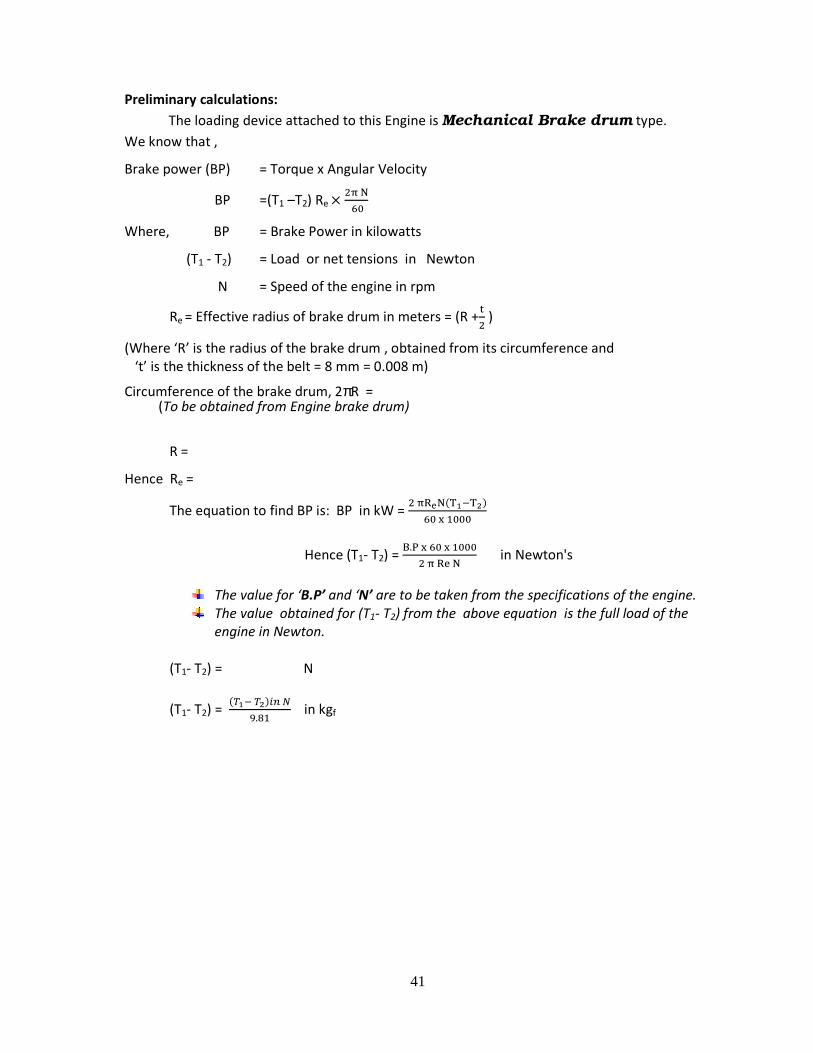
Preliminary calculations:
The loading device attached to this Engine is Mechanical Brake drum type.
We know that ,
Brake power (BP) = Torque x Angular Velocity
BP =(T1 –T2) Re ��� �
��
Where, BP = Brake Power in kilowatts
(T1 - T2) = Load or net tensions in Newton
N = Speed of the engine in rpm
Re = Effective radius of brake drum in meters = (R +�
� )
(Where ‘R’ is the radius of the brake drum , obtained from its circumference and
‘t’ is the thickness of the belt = 8 mm = 0.008 m)
Circumference of the brake drum, 2πR = (To be obtained from Engine brake drum)
R =
Hence Re =

24
The equation to find BP is: BP in kW = � ����������
� � ���
Hence (T1- T2) = �.� � � � ���
� � �� � in Newton's
The value for ‘B.P’ and ‘N’ are to be taken from the specifications of the engine.
The value obtained for (T1- T2) from the above equation is the full load of the engine in
Newton.
(T1- T2) = N
(T1- T2)= �� ��� �
�.�� in kgf
25
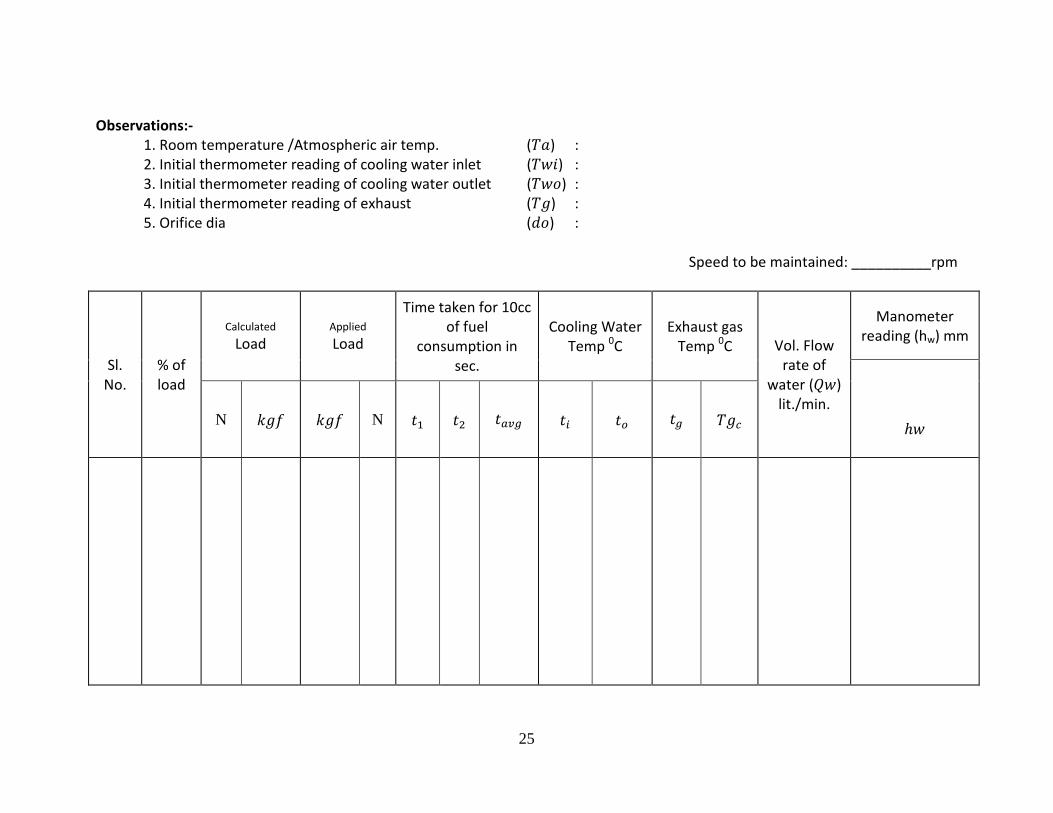
Observations:-
1. Room temperature /Atmospheric air temp. (��) :
2. Initial thermometer reading of cooling water inlet (���) :
3. Initial thermometer reading of cooling water outlet (���) :
4. Initial thermometer reading of exhaust (��) :
5. Orifice dia (��) :
Speed to be maintained: __________rpm
Sl.
No.
% of
load
Calculated
Load
Applied
Load
Time taken for 10cc
of fuel
consumption in
sec.
Cooling Water
Temp 0C
Exhaust gas
Temp 0C Vol. Flow
rate of
water (��)
lit./min.
Manometer
reading (hw) mm
�
N �� �� N �� �� ���� �� �� �� ���

26
Specimen Calculations: (For ……………% of load)
1. Fuel Consumption [FC], kg/hr
= Vol. flow rate, cc/s x density of fuel, kg/cc x 3600 s/hr.
=� ��
����� x Sp. gravity of diesel x density of water in kg/cc x 3600
FC = � ��
�x 0.835 x 1000 x 10�� x 3600 � ________________ kg/hr
2. Brake Power [BP], (kW) = � ��������
� � ����
���������� � � �� ���� �� ""Newton" "
N – Speed of the Engine .
BP = � � � � � �
� � ���� =
3. Heat input, (kJ/Sec) = FC, (kg/sec) x Calorific value of fuel, (kJ/kg)
[CV of Diesel =42,000��
��]

27
4. Useful shaft work in heat units, (kJ/sec) = BP
5. Heat carried away by cooling water, (kJ/sec) = M�xCp�x�Tw� � Tw��
= M� � kJ kg� � xCp� �kJ kgk� � x�Tw� � Tw�� K
6. Heat carried away by exhaust gas, (kJ/ sec) = M�xCp�x�Tg� T�
where Mg = Mass flow rate of exhaust gas, kg/sec.
= Mass flow rate of fuel + mass flow of air. = ( Fc + Ma)
Where Ma = mass flow of air = ρ x Q
ρ � ��
�� ��
=
To evaluate the mass of air Ma
Where P = Atmospheric pressure [1.013 x 10⁵, �
��]
Ra = Universal gas constant [287,J/kgk]
where Mw = mass flow rate of cooling water, kg/sec.
= ��
��x density of water in kg/lit. =
�
��x1 = 0.1 (If flow rate maintained at 6 lit/min)
Cpw= sp.heat of cooling water = 4.184 kJ/kgk
Twi,= Inlet temp. of cooling water o C , Two =Outlet temp. of cooling water k

28
Ta = Room temperature in k
Cp� = Specific heat of exhaust gas= (1.005 kJ/kgk)
Tg� , T� = Temperature of exhaust gas (corrected) and atmospheric air, k
pressure head in term of air,
ρ x h=ρ� x h�
h � �� ��
��
Where ρ� = density of water = 1000 kg/m3
h� = corrected manometer reading
Velocity of air through orifice va=�2 ! "� m/sec.
Area of orifice Ao = �
�xd�, m
2
Where d = diameter of the air drum orifice.
Volume flow of air inlet condition Q = Cdx Ao xva
Where Cd = Co - efficient of discharge of orifice = 0.6

29
Mg= ( Fc + Ma) ie., Mg1= ( Fc1 + Ma) , Mg2= ( Fc2 + Ma) like wise
Now, Heat carried away by exhaust gas,(kJ/ sec) = M�xCp�x�Tg� T�
7. Heat unaccounted =
{Heat input - �Heat to shaft work + Heat carr. by cool. water + Heat carr. by ex. gas�}
Result
The heat balance test on FIELD MARSHAL 6 HP ENGINE was conducted and heat balance
chart was drawn on percentage basis.

30
RESULT TABULATION :
Sl no Actual Load
%
Heat
input
��/�
Heat to useful shaft
work
Heat to Cooling water Heat to Exhaust gas Heat Unaccounted
��/� % of heat
input
��/� % of heat
input
��/� % of heat
input
��/� % of heat
input

31
Typical heat balance chart for an I.C Engine.

32
Expt.No: Date:
LOAD TEST ON KIRLOSKAR AV-I ENGINE
Aim:
To conduct a load test on Kirloskar AV-I (Double arm) engine by running the engine at
different loads at 1500 rpm and to find the economic load. Also determine the load
characteristics of the engine and generator.
Instruments required:
� Swing field [DC] generator/motor type dynamometer,
� AC-DC converter with starting device [panel board],
� Bank of electrical resistances to apply load,
� Tachogenerator with speed indicator to measure the speed of the engine,
� Stop-watch to note the time for a definite volume of fuel consumption.
Specifications:
Type :
No. of strokes per cycle :
Type of cooling :
Fuel used :
Speed :
Power :
Bore :
Stroke :
Preliminary calculations:
While conducting load test the speed is retained constant and the load is varied (viz, no
load, light load, medium load & full load). Normally six equi-distributed loads are chosen in the
range from no load to full load. Preliminary calculations are made to determine the net tension
(T1-T2) or a tangential force (W) needed at the dynamometer to effect the desired power
output (Load).
In this test setup the engine is coupled to a swing field DC shunt-wound
generator/motor type dynamometer. There are provisions to measure both the electrical
output of the generator and the mechanical output of the engine. When the electrical
resistances are included in the output circuit, the generator and hence the engine gets loaded.
The generator swings about the trunnion and force required to keep the torque arm horizontal
is the measure of engine output.

33
The net tension (T1-T2) corresponding to the rated power output is calculated using the
expression for brake power. Then the values of net tension for other part load outputs
(0%,20%,40%,60%,80%) are calculated and tabulated in the observation table.
We know that
Brake power (BP) = Torque x Angular Velocity
BP =(T1 –T2) Re � �� � ��
Where, BP = Brake Power in kilowatts
(T1 - T2)= Load or net tensions in Newton
N = Speed of the engine in rpm
Re = Torque arm length
{Torque arm length = Half of the distance between the center lines of the spring balances. }
Hence Re=
The equation to find BP is: BP in kW = � ��������
�� � ���
Hence (T1- T2) = �.� � �� � ���
� � ��� in Newton's
The value for ‘B.P’ and ‘N’ are to be taken from the specifications of the engine.
The value obtained for (T1- T2) from the above equation is the full load of the
engine in Newton.
(T1- T2) = ---------------------------------------------- = in N
(T1- T2) = N
(T1- T2)= ��� ����� �
�.� in kgf

34
Precautions:-
a) Ensure that the electrical main switches (one in the panel board intended for running
the DC machine as a motor to find friction power and the other in the resistance load bank
intended for loading the DC machine as generator during load test) are in OFF position.
b) Electrical starter has to be in OFF position.
c) Speed regulator knob shall be set for minimum position.
Procedure:
1. After evaluating the loads to be applied on the engine, check the fuel level in fuel tank, flow
of cooling water to the engine, level of lubricant in the sump as indicated by the dipstick and
no-load on the engine as indicated by the loading device etc.
The DC machine coupled to the engine is run as a generator and the applied load is varied by
altering the load resistances.
2. After observing all the precautions, the engine has to be started.
Starting Procedure:-
i. The decompression lever located at the rocker box is turned to the vertical upward
position. [Decompression On]
ii. The starting handle is inserted on the cam shaft
iii. The cam shaft is manually rotated faster in clockwise direction.
iv. After the engine shaft has gained sufficient momentum, the decompression lever is
brought to the horizontal position [Decompression Off]. Then the engine gets started.
3. Allow the engine to run for 5 to 10 minutes to attain steady condition at its rated speed of
1500 rpm.
4. Now, load the engine approximately to 20 % of full-load by switching on the load mains and
suitable electrical resistances.
5. The speed of the engine is to be maintained at 1500 rpm. The generator output voltage is
also to be maintained at 220 V by adjusting the field rheostat.
6. The actual spring balance readings are noted after the generator torque arm to its horizontal
position by adjusting the hand wheels located above the spring balance
7. Note the time for 10 cc of fuel consumption twice at this load and average the values.
Engine
Generator
Load

35
8. Ammeter reading is also to be noted for the same load.
9. In the same way, maintain the speed at rated value and note the time for 10cc of fuel
consumption at 40 %, 60 %, 80 % of full load, full load and at no load.
10. After taking all the readings, the engine is switched off at no load by pulling the control rod
of the fuel injection pump.
Observations:-
Speed to be maintained: ________rpm
Sl.
No.
%of
load
Cal. Load
(T1-T2)
App. load
(T1-T2) Voltmeter
reading
in
�����
Ammeter
reading
in
���
Time taken for 10 cc
of fuel consumption
in sec. �� �� �1 �2 ����
Note: At the beginning of the experiment, the conditions of viscous friction will be more than
that at steady running. Hence observation at no load if made at the beginning will result in
arriving of incorrect higher fuel consumption value. In order to overcome this error
observations at no load are to be made at the end of the experiment
Specimen calculations: (For ……………% of load)
1. Fuel Consumption [FC], kg/hr
= Vol. flow rate, cc/s x density of fuel, kg/cc x 3600 s/hr.
=� �����
� x Sp. gravity of diesel x density of water in kg/cc x 3600
FC = � � �x 0.835 x 1000 x 10� x 3600 � _____________kg/hr

36
2. Brake Power [BP], (kW) = � ��������
�� � ���
���� �� �! "# $ #�% �&�'! ( "N!+��("
BP = � � � � ��� � �
�� � ��� =
3. Specific Fuel Consumption [SFC], (kg/kW-hr) = ����
SFC = --------------- = kg/kW-hr
4. Frictional Power [Fr. P], kW
To be obtained from the graph of BP Vs FC by extrapolation method. Frictional power is assumed to be constant at
all loads.
Fr.P =
5. Indicated Power [IP], (kW) = BP+ Fr.P
IP =
6. Mechanical Efficiency = ��� ! "#$!�
%&'()��!' "#$!� x 100
ηMech =

37
7. Fuel Power [Fu.p] (or) Heat Input, (kW) = ��,+��
�,��.-,��
���
.��� [C.V of Diesel 42,000" / 0%,
Fu P =
8. Brake Thermal Efficiency = ��
12!3 "#$!�x100
ηBth =
9. Indicated Thermal Efficiency = %�
�2!3 "#$!� x100
ηIth =
10.Brake Mean Effective Pressure [BMEP],(bar) = ��� �� ���
�� � 4 � 5 � � � &
= �� � ��
�� 4 5 � & in bar
BMEP =
N’ = Number of power strokes per minute.
For 4 stroke engine N' =67; For 2 stroke engine N' = N; n = Number of cylinders
A = Area of bore(m2)= 89�
: (d = Dia of bore in m)= …………….m2; L = Length of stroke, m

38
11. Indicated Mean Effective Pressure [IMEP] (bar) = %����
��45� &
IMEP =
12. Torque, Nm = (T1 - T2) x Re
Torque =
13. Generator power output, (kW) = -� %
���
=
��� kW
14. Generator efficiency, (%) = ;!&!���#� "#$!� #2�"2�
��� !�#$!� #1 �<! !&0(&! x100
ηgen =
Draw the following Graphs:
1. BP Vs SFC,
B.Th. efficiency,
2. BP Vs I.Th.efficiency,
Mech. efficiency,
IMEP,
BMEP ,
Torque and
Generator Efficiency.

39
RESULT TABULATION
Result:
The Load test on KIRLOSKAR AV I Engine was conducted at different load condition, the economic load of engine was found at ___________rpm is ________kW - and the corresponding performance characteristic curve were also drawn.
l.
No.
��
B.P
��/��
F.C
��
/��. ��
SFC
��
Fu.P
��
I.P
%
I.Th.η
%
B.Th.η
%
Mech.η
��
BMEP
��
IMEP
�
Torque
%
Generator
Efficiency

40
Expt.No : Date:
LOAD TEST ON PSG 5 HP ENGINE
Aim:
To conduct a load test on PSG 5 HP engine by running the engine at different loads at
610 rpm and to find the economic load. Also to determine the load characteristics of the
engine.
Instruments required:
Measuring tape to measure the circumference of the brake drum.
Stop-watch to note the time for a definite volume of fuel consumption.
Specifications:
Type :
No. of strokes per cycle :
Type of cooling :
Fuel used :
Speed :
Power :
Bore :
Stroke :
Procedure:
1. After evaluating the full-load of the engine in ��f with the help of specifications given, check
the fuel level in fuel tank, flow of cooling water to the engine, level of lubricant in the sump as
indicated by the dipstick, and no-load on the engine as indicated by the loading device etc.,
before starting the engine.
2. Start the engine by cranking and allow it to run for 5 to 10 minutes to attain steady condition
at its speed of 610 rpm. Allow the cooling water for the brake drum in order to cool it while
applying loads.
3. Now, load the engine to 20 % of full-load. Then check for its speed and note down the actual
load on the engine.
4. Note the time for 10 cc of fuel consumption twice at this load and average the values.
5. In the same way, maintain the speed at its rated value and note the time for 10cc of fuel
consumption at 40 %, 60 %, 80 % of full load, full load and at no load. After taking no load
reading the engine is stopped by engaging the fuel cut off lever.
41
Preliminary calculations:
The loading device attached to this Engine is Mechanical Brake drum type.
We know that ,
Brake power (BP) = Torque x Angular Velocity
BP =(T1 –T2) Re � �� � ��
Where, BP = Brake Power in kilowatts
(T1 - T2) = Load or net tensions in Newton
N = Speed of the engine in rpm
Re = Effective radius of brake drum in meters = (R +�� )
(Where ‘R’ is the radius of the brake drum , obtained from its circumference and
‘t’ is the thickness of the belt = 8 mm = 0.008 m)
Circumference of the brake drum, 2πR = (To be obtained from Engine brake drum)
R =
Hence Re =
The equation to find BP is: BP in kW = � ��������
�� ����
Hence (T1- T2) = �.� �� ����
� � �� � in Newton's
The value for ‘B.P’ and ‘N’ are to be taken from the specifications of the engine.
The value obtained for (T1- T2) from the above equation is the full load of the
engine in Newton.
(T1- T2) = N
(T1- T2) = ��� ����� �
�.�� in kgf

42
Observations:-
Speed to be maintained :__________ rpm
Sl.
No
%of
load
Calculated load
(T1-T2)
Applied load
(T1-T2)
Time taken for 10cc of fuel
consumption in sec
N kgf kgf N t1 t2 tave
Note: At the beginning of the experiment, the conditions of viscous friction will be more from
that at steady running. Hence observation at no load if made at the beginning will result in
arriving of incorrect higher fuel consumption value. In order to overcome this error
observations at no load are to be made at the end of the experiments.
Specimen Calculations: (For ……………% of load)
1. Fuel Consumption [FC], kg/hr
= Vol. flow rate, cc/s x density of fuel, kg/cc x 3600 s/hr.
=� ������
� x Sp. gravity of diesel x density of water in kg/cc x 3600
FC = � �� �x 0.835 x 1000 x 10�� x 3600 � ________________ kg/hr
2. Brake Power [BP], (kW) = � ��������
�� ���� ���������� � � �� ���� �� "Newton"
� � ����� �� ��� �� ���.
BP = � � � �
�� ���� =

43
3. Specific Fuel Consumption [SFC], (kg/kW-hr) = ����
SFC = --------------- = …………. kg/kW-hr
4. Frictional Power [Fr. P], kW
To be obtained from the graph of BP Vs FC by extrapolation method. Frictional power is assumed to be constant at all loads.
Fr.P =
5. Indicated Power [IP], (kW) = BP+ Fr.P
IP =
6. Mechanical Efficiency = ����� �� ��
!"#$%���# �� �� x 100
ηMech =
7. Fuel Power [Fu.p] (or) Heat Input, (kW) = ��,'��
�( �.),�
���
*��� [C.V of Diesel 42,000��+�,��
Fu P =
8. Brake Thermal Efficiency = ��
-.�/ �� ��x100
ηBth =
9. Indicated Thermal Efficiency = !�
�.�/ �� �� x100
ηIth =

44
10.Brake Mean Effective Pressure [BMEP],(bar) = �� ��� ��
��� 0 1 � "
= �� ��
��� 0 1 � " in bar
BMEP =
11. Indicated Mean Effective Pressure [IMEP] (bar) = !� ��
���01� "
IMEP =
12. Torque, Nm = (T1 - T2) x Re
Torque =
Draw the following Graphs:
1. BP Vs SFC,
B.Th. efficiency,
2. BP Vs I.Th.efficiency,
Mech. efficiency,
IMEP,
BMEP and
Torque .
N’ = Number of power strokes per minute.
For 4 stroke engine N' =23; For 2 stroke engine N' = N; n = Number of cylinders
A = Area of bore(m2)= 45�
6 (d = Dia of bore in m)= …………….m2; L = Length of stroke,m

45
RESULT TABULATION
Sl No
Appl.load BP F C S F C Fu.P I P �� �� �� �� ����� BMEP IMEP Torque
� �� ��/� ��/��
� �� �� % % % � � ��
1
2
3
4
5
6
Result : The Load test on PSG 5HP Engine was conducted at different load condition, the economic load of engine was found at ___________rpm is ________kW - and the corresponding performance characteristic curves were also drawn.

46