6 th Japan-Korea Workshop on Theory and Simulation of Magnetic Fusion Plasmas 2011.07.28 Hyunsun...
22
6 th Japan-Korea Workshop on Theory and Simulation of Magnetic Fusion Plasmas 2011.07.28 Hyunsun Han, G. Park, Sumin Yi, and J.Y. Kim 3D MHD SIMULATIONS ON ELMS AND PELLET INDUCED ONES
-
Upload
rosanna-ethel-french -
Category
Documents
-
view
223 -
download
1
Transcript of 6 th Japan-Korea Workshop on Theory and Simulation of Magnetic Fusion Plasmas 2011.07.28 Hyunsun...
6th Japan-Korea Workshop on
Theory and Simulation of Magnetic Fusion Plasmas
2011.07.28
Hyunsun Han, G. Park, Sumin Yi, and J.Y. Kim
3D MHD SIMULATIONS ON ELMSAND PELLET INDUCED ONES
Contents
Introduction
Natural ELM simulation
Pellet triggered ELM
simulation
Summary
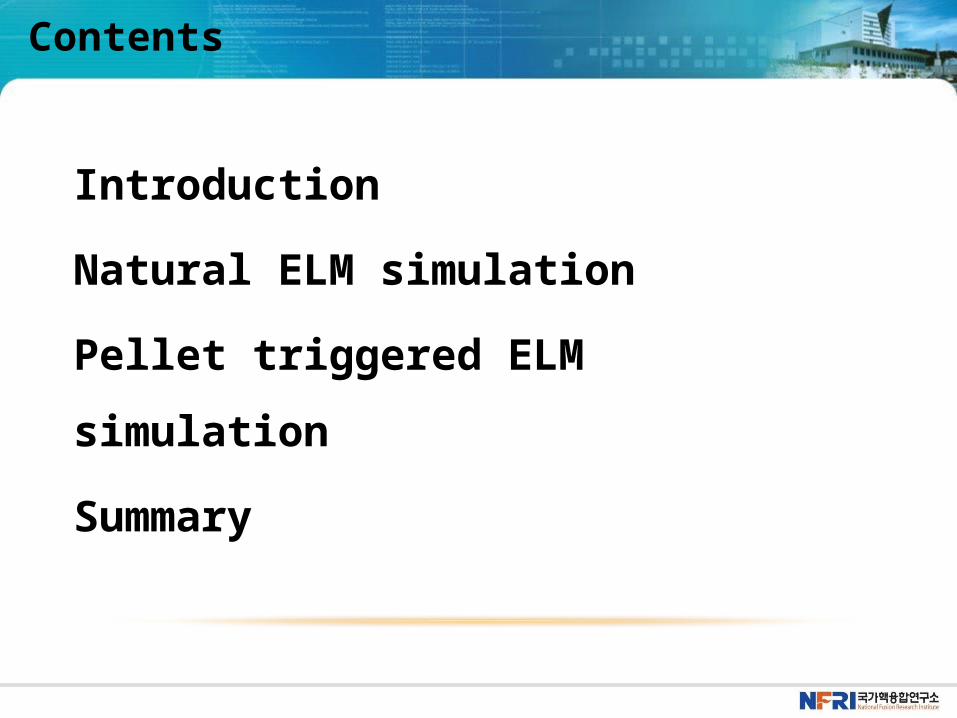
ELM simulation using MHD code
precursor oscillation
pedestal/SOL perturbation
filament ejection,
filament propagation,
relative timing to relaxation
Non-linear eruption
Linear instability
Pressure builds up
Pedestal re-established
ELM Cycle
ELM dynamics
M3D code
Original M3D code was written by W. Park (PPPL) in early 1980s
Code improvement has been ongoing continu-ously Two-fluid model (L. Sugiyama)
Hybrid model including hot particle (G. Fu)
Ref. http://w3.pppl.gov/m3d/index.php
A resistive MHD version of M3D is adapted from NYU Based on the resistive MHD equation in a cylindrical
coordinate Solves 8 equations for , , ,p B v
ELM simulation - Computing condition
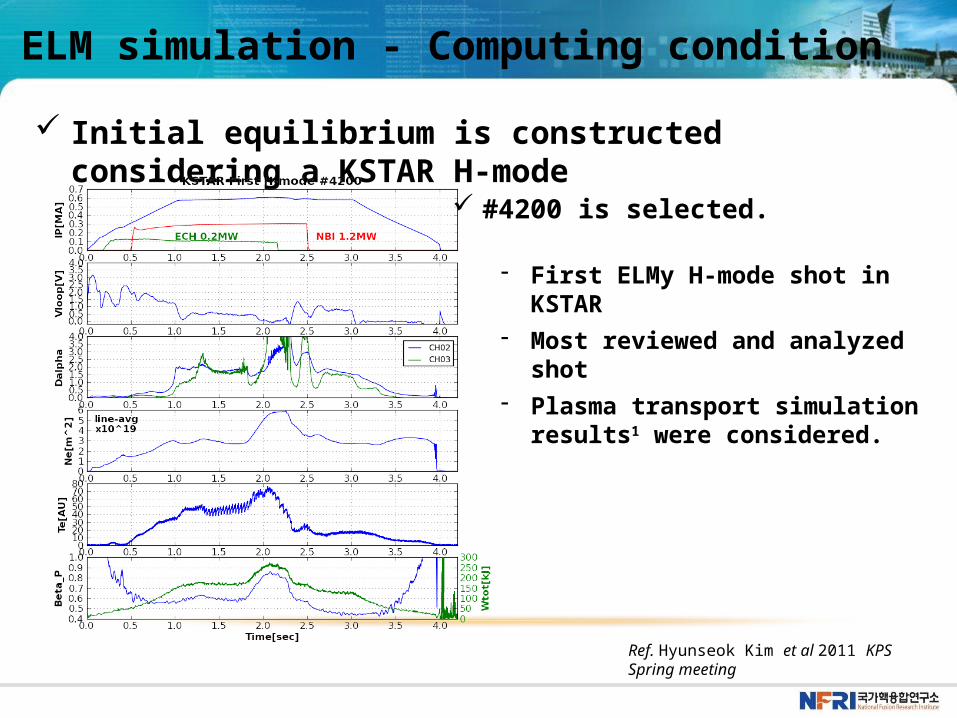
Initial equilibrium is constructed considering a KSTAR H-mode
#4200 is selected.
- First ELMy H-mode shot in KSTAR- Most reviewed and analyzed shot- Plasma transport simulation results1 were
considered.
Ref. Hyunseok Kim et al 2011 KPS Spring meeting
ELM simulation - Computing condition
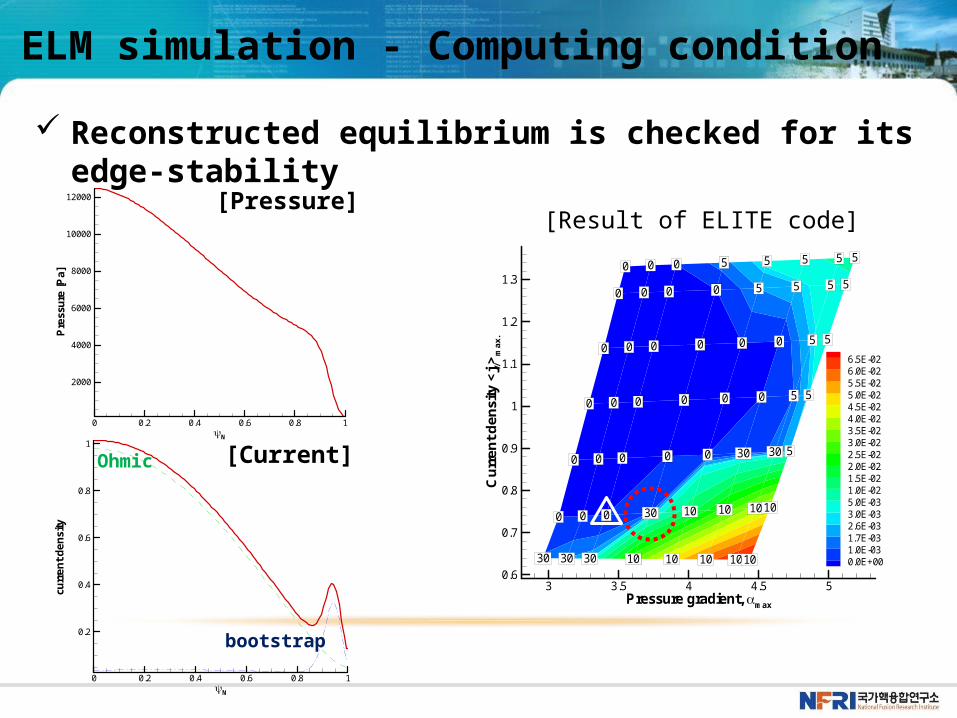
Reconstructed equilibrium is checked for its edge-stability
30 30 30 1010 10 10 1010
0 0 0 3030 10 10 1010
0 0 0 00 0 30 30 5
0 0 0 00 0 0 5 5
0 0 0 00 0 0 5 5
0 0 0 00 5 5 5 5
0 0 0 55 5 5 5 5
0
Pressure gradient, max
Currentdensity<j //>max.
3 3.5 4 4.5 50.6
0.7
0.8
0.9
1
1.1
1.2
1.3
6.5E-026.0E-025.5E-025.0E-024.5E-024.0E-023.5E-023.0E-022.5E-022.0E-021.5E-021.0E-025.0E-033.0E-032.6E-031.7E-031.0E-030.0E+00
N
currentdensity
0 0.2 0.4 0.6 0.8 1
0.2
0.4
0.6
0.8
1
Ohmic
bootstrap
N
Pressure[Pa]
0 0.2 0.4 0.6 0.8 1
2000
4000
6000
8000
10000
12000 [Pressure]
[Current]
[Result of ELITE code]
ELM simulation
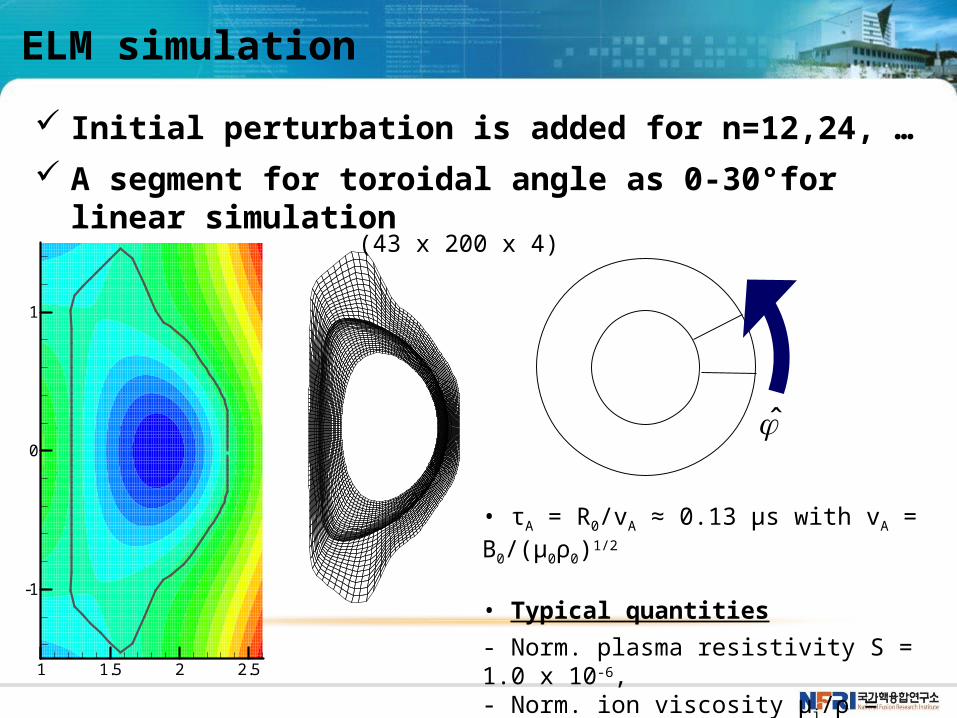
Initial perturbation is added for n=12,24, … A segment for toroidal angle as 0-30°for linear
simulation
1 1.5 2 2.5
-1
0
1
• τA = R0/vA ≈ 0.13 μs with vA = B0/(μ0ρ0)1/2
• Typical quantities
- Norm. plasma resistivity S = 1.0 x 10⁻⁶,- Norm. ion viscosity μi/ρ = 1.0 x 10⁻⁵
- Perp. thermal conductivity κ⊥ = 1.0 x 10⁻⁵
(43 x 200 x 4)
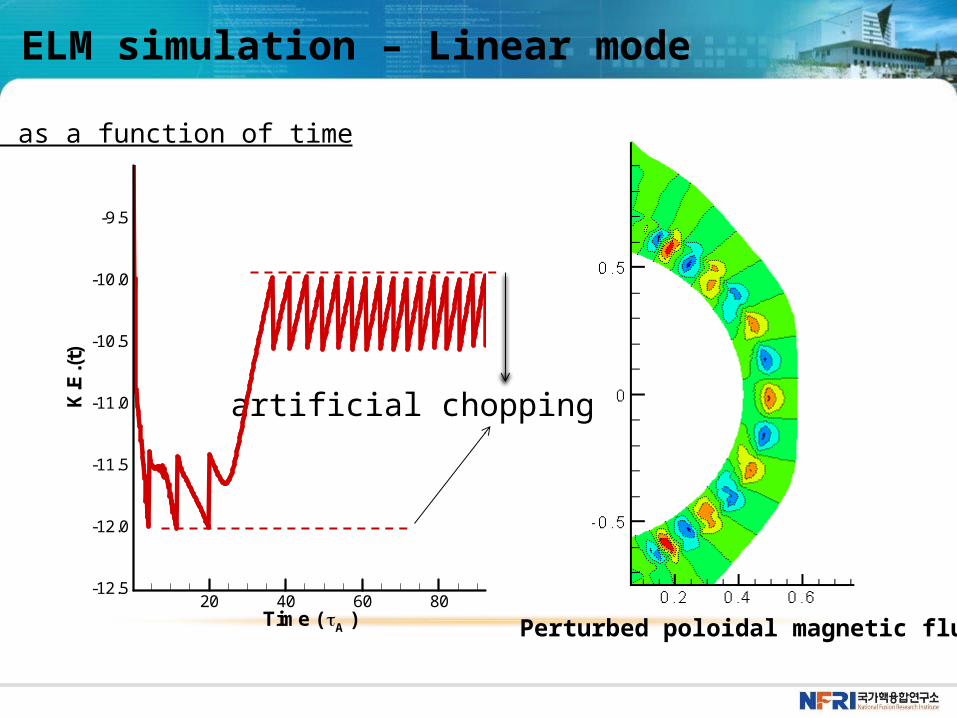
artificial chopping
KE as a function of time
Time ( A )
K.E.(t)
20 40 60 80-12.5
-12.0
-11.5
-11.0
-10.5
-10.0
-9.5
ELM simulation – Linear mode
Perturbed poloidal magnetic flux
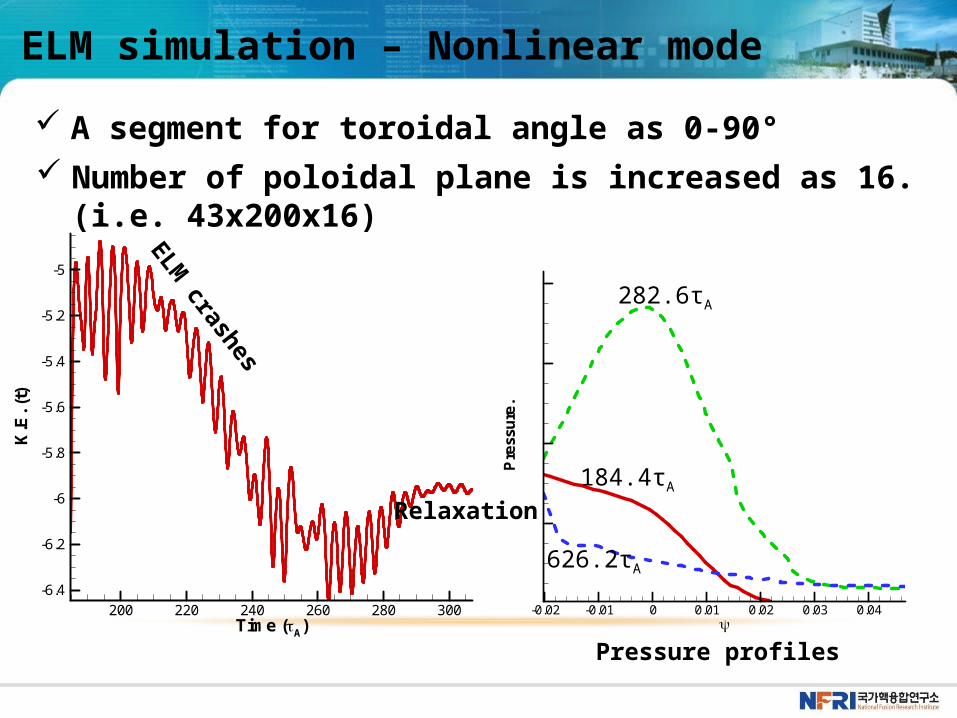
ELM simulation – Nonlinear mode
A segment for toroidal angle as 0-90°
Time (A)
K.E.(t)
200 220 240 260 280 300
-6.4
-6.2
-6
-5.8
-5.6
-5.4
-5.2
-5
ELM crashes
Number of poloidal plane is increased as 16. (i.e. 43x200x16)
Relaxation
Pressure.
-0.02 -0.01 0 0.01 0.02 0.03 0.04
184.4τA
282.6τA
626.2τA
Pressure profiles
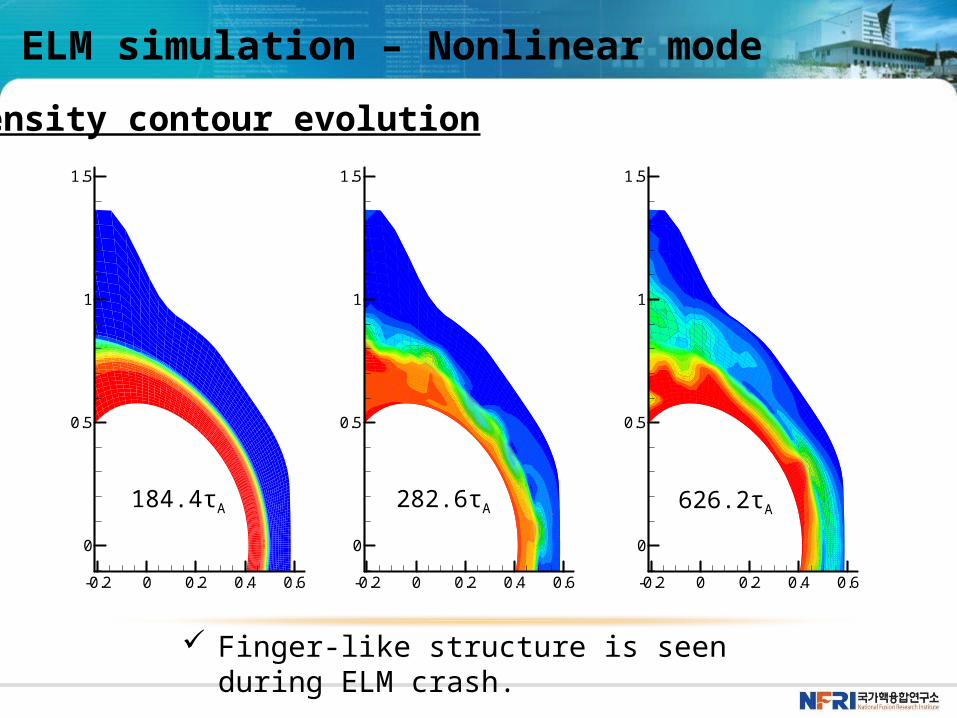
ELM simulation – Nonlinear mode
-0.2 0 0.2 0.4 0.6
0
0.5
1
1.5
184.4τA
-0.2 0 0.2 0.4 0.6
0
0.5
1
1.5
-0.2 0 0.2 0.4 0.6
0
0.5
1
1.5
Density contour evolution
Finger-like structure is seen during ELM crash.
282.6τA 626.2τA
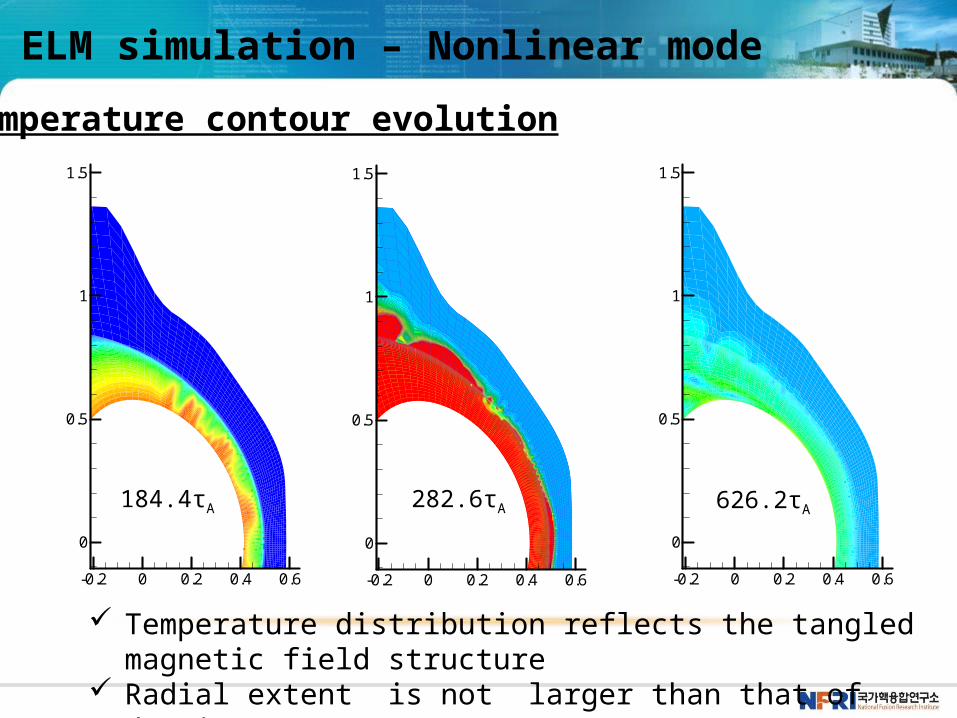
ELM simulation – Nonlinear mode
-0.2 0 0.2 0.4 0.6
0
0.5
1
1.5
-0.2 0 0.2 0.4 0.6
0
0.5
1
1.5
-0.2 0 0.2 0.4 0.6
0
0.5
1
1.5
Temperature contour evolution
184.4τA 282.6τA 626.2τA
Temperature distribution reflects the tangled magnetic field structure
Radial extent is not larger than that of density.
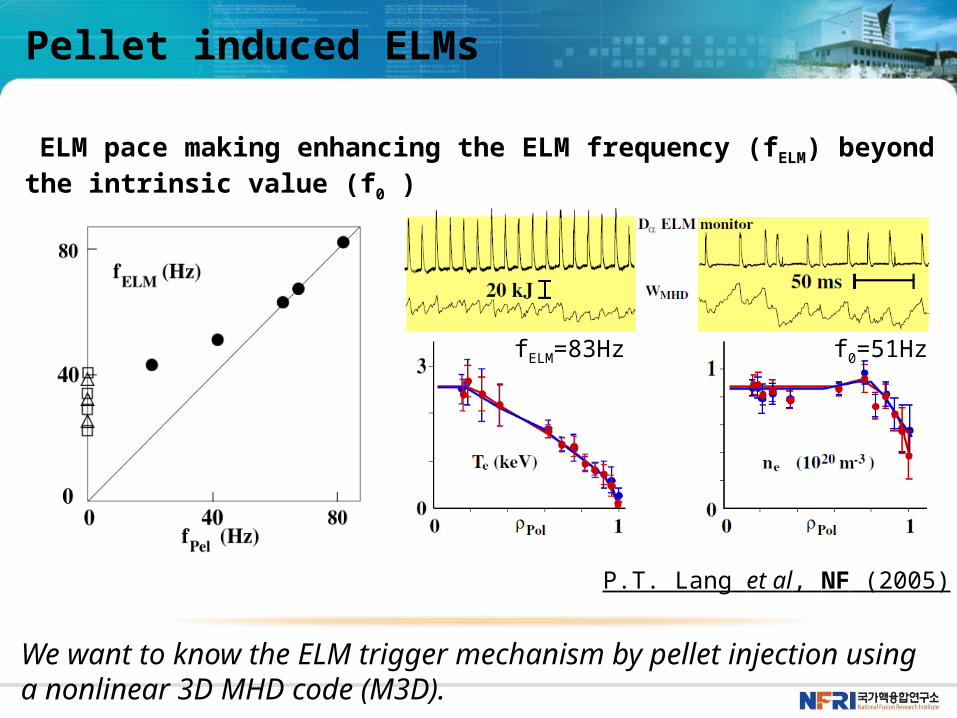
Pellet induced ELMs
ELM pace making enhancing the ELM frequency (fELM) be-yond the intrinsic value (f0 )
fELM=83Hz f0=51Hz
P.T. Lang et al, NF (2005)
We want to know the ELM trigger mechanism by pellet injec-tion using a nonlinear 3D MHD code (M3D).
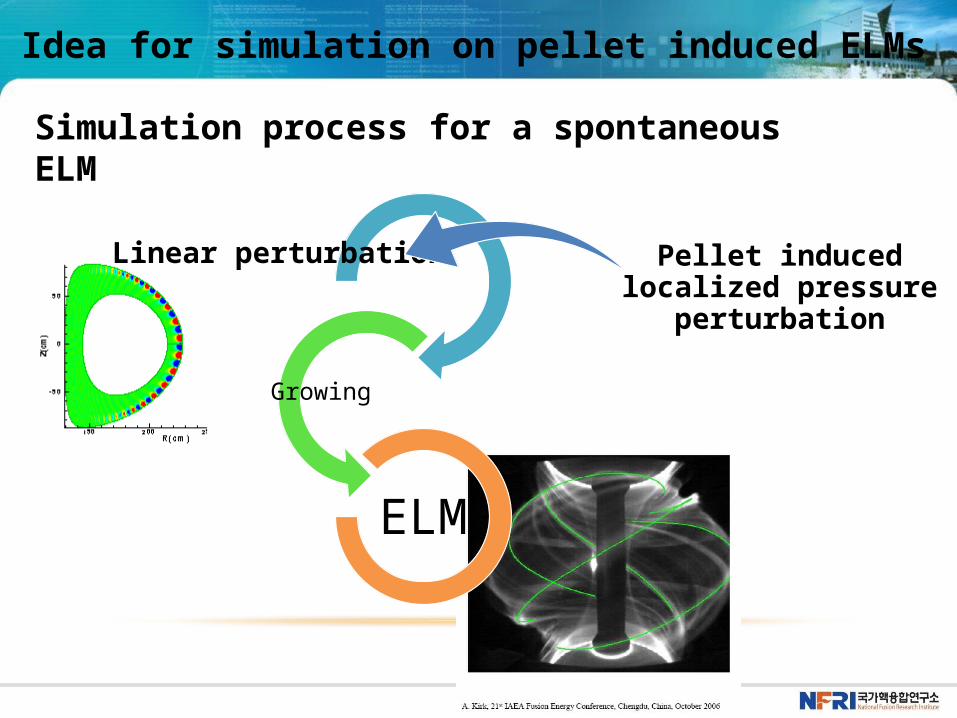
Idea for simulation on pellet induced ELMs
Simulation process for a spontaneous ELM
ELM
Linear perturbation
Growing
Pellet induced localized pressure perturbation
Simulation condition on pellet injection (1)
It is assumed
: The details of the ablation processes are not considered
Ref.) H.R. Strauss et al Physics of Plasma 7 (2000) 250 G. T. A. Huysmans et al PPCF 51 (2009) 124012
the ablation and ionization time scale are short
the injection process is adiabatic: The pellet impart no energy to the plasma ( p=const. )
-0.5 0 0.5
-0.5
0
0.5
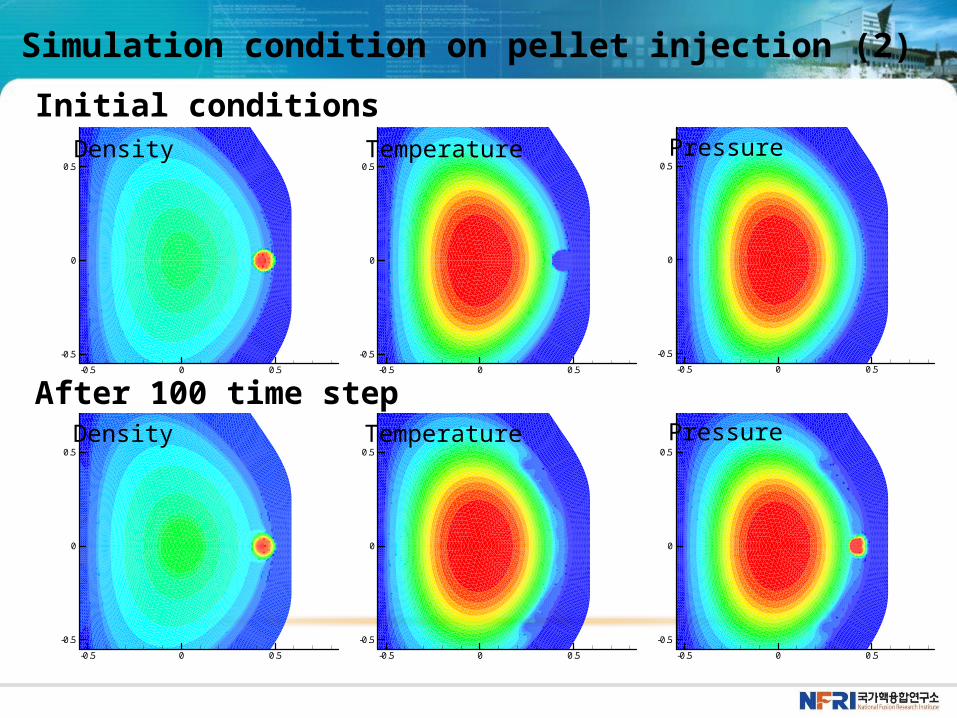
Simulation condition on pellet injection (2)
Initial conditions
-0.5 0 0.5
-0.5
0
0.5
-0.5 0 0.5
-0.5
0
0.5
-0.5 0 0.5
-0.5
0
0.5
-0.5 0 0.5
-0.5
0
0.5
-0.5 0 0.5
-0.5
0
0.5
Density Temperature Pressure
After 100 time step Density Temperature Pressure
Simulation condition on pellet injection (3)
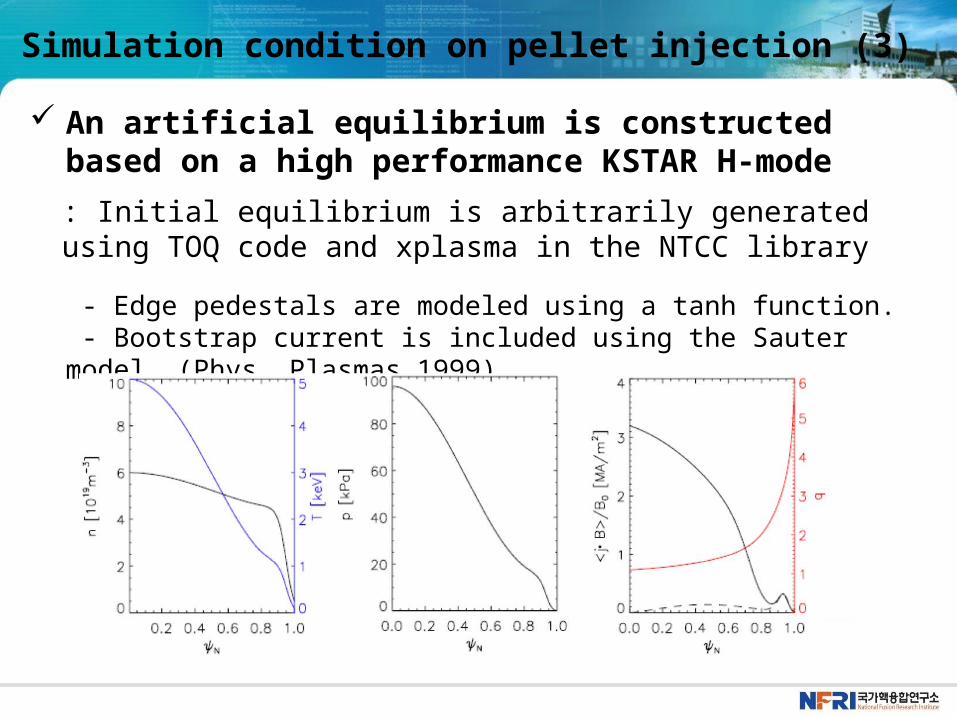
: Initial equilibrium is arbitrarily generated using TOQ code and xplasma in the NTCC library
- Edge pedestals are modeled using a tanh function. - Bootstrap current is included using the Sauter model. (Phys. Plasmas 1999)
An artificial equilibrium is constructed based on a high performance KSTAR H-mode
Pellet simulation using M3D
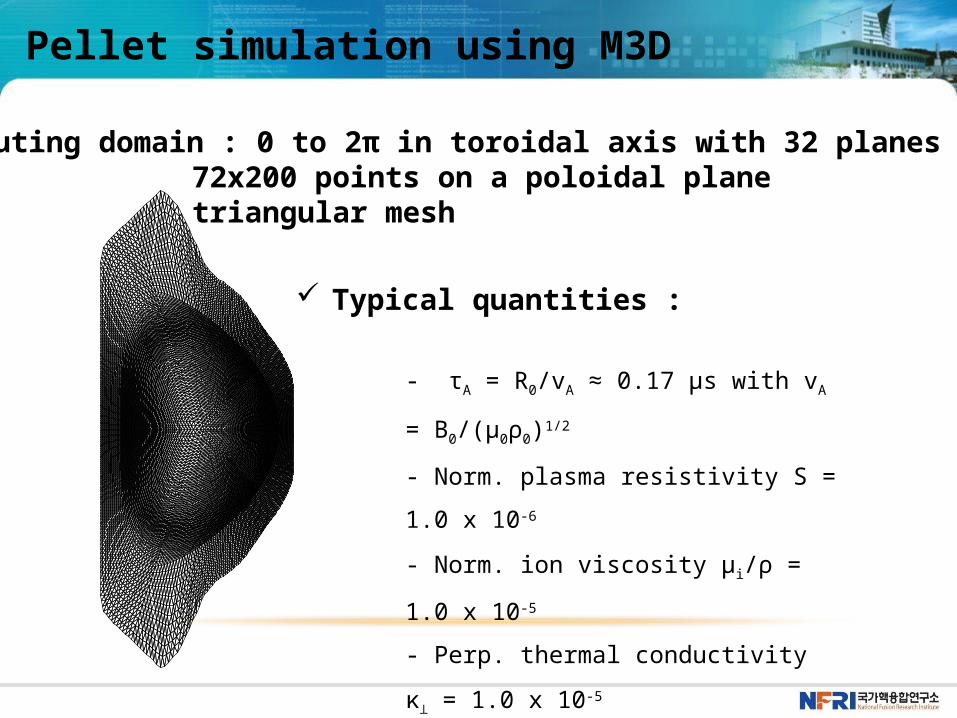
Computing domain : 0 to 2π in toroidal axis with 32 planes 72x200 points on a poloidal plane triangular mesh
Typical quantities :
- τA = R0/vA ≈ 0.17 μs with vA = B0/(μ0ρ0)1/2
- Norm. plasma resistivity S = 1.0 x 10⁻⁶
- Norm. ion viscosity μi/ρ = 1.0 x 10⁻⁵
- Perp. thermal conductivity κ⊥ = 1.0 x 10⁻⁵
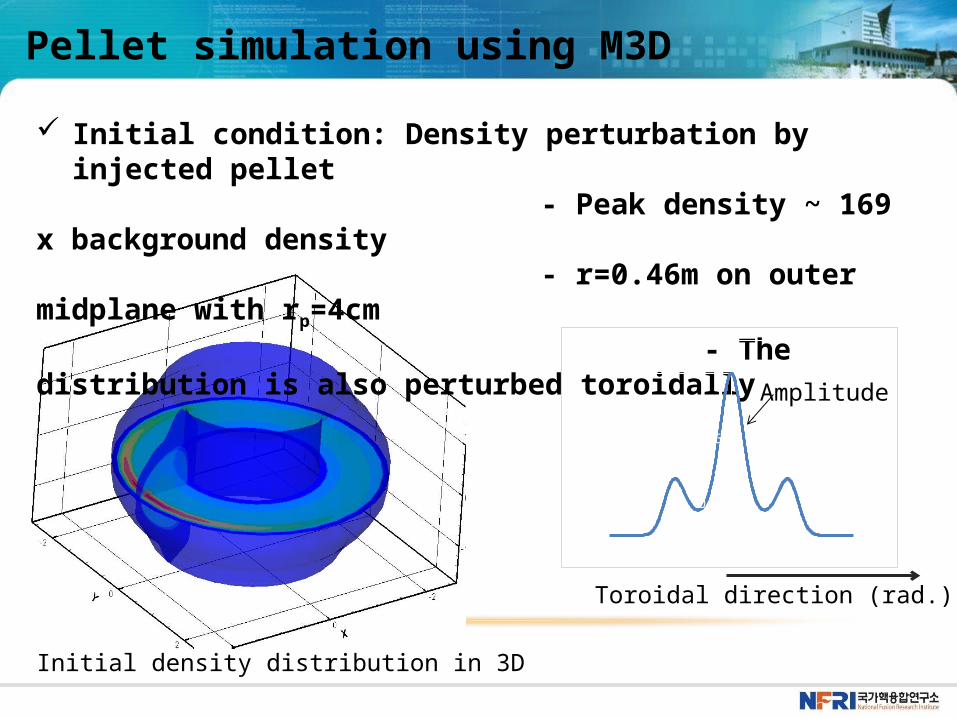
Initial density distribution in 3D
Pellet simulation using M3D
Initial condition: Density perturbation by injected pellet
- Peak density ~ 169 x back-ground density
- r=0.46m on outer midplane with rp=4cm - The distribution is also per-turbed toroidally
-4 -3 -2 -1 0 1 2 3 40
0.2
0.4
0.6
0.8
1
1.2
Toroidal direction (rad.)
Amplitude
26
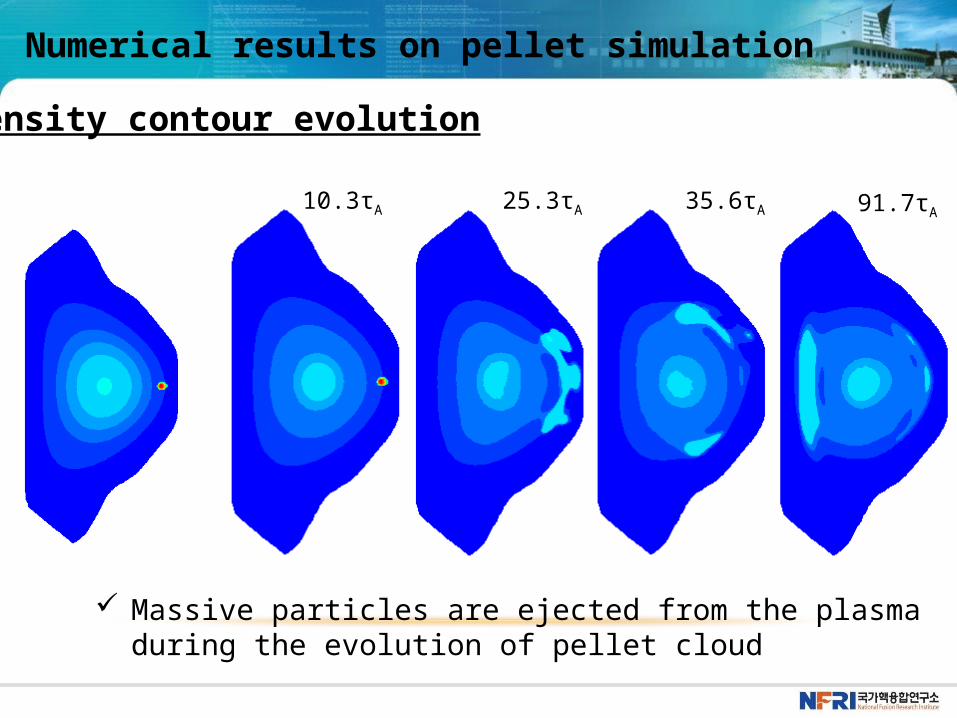
Density contour evolution
10.3τA 25.3τA 35.6τA
Massive particles are ejected from the plasma during the evolution of pellet cloud
91.7τA
Numerical results on pellet simulation
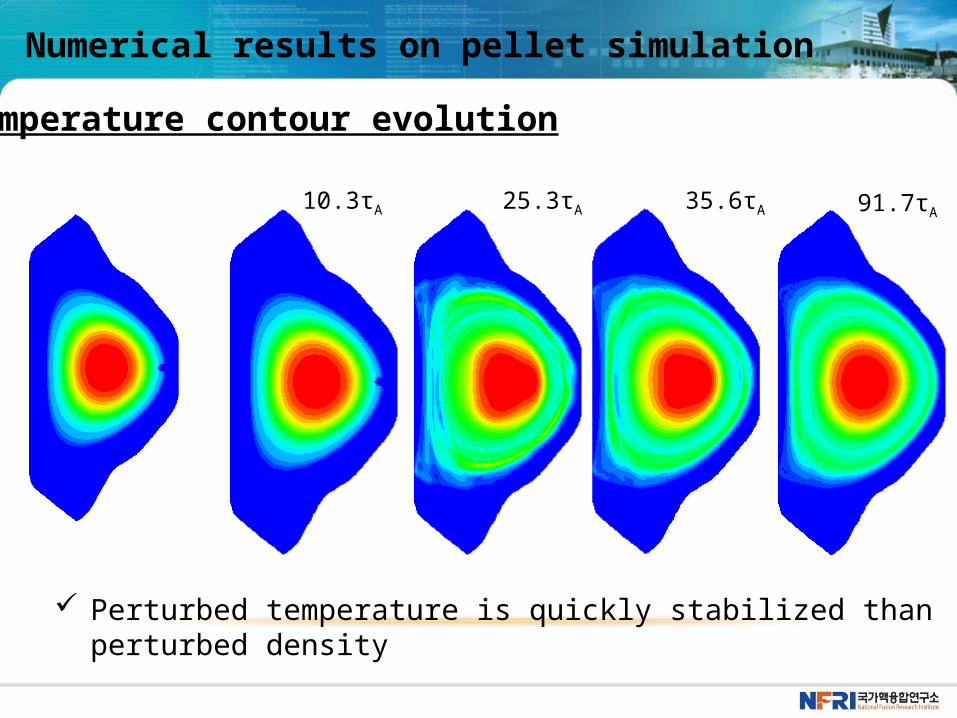
10.3τA 25.3τA 35.6τA 91.7τA
Temperature contour evolution
Perturbed temperature is quickly stabilized than per-turbed density
Numerical results on pellet simulation
Midplane (m)
Density
0.35 0.4 0.45 0.5
0.25
0.3
0.35
t=0
t=12.96
t=23.26
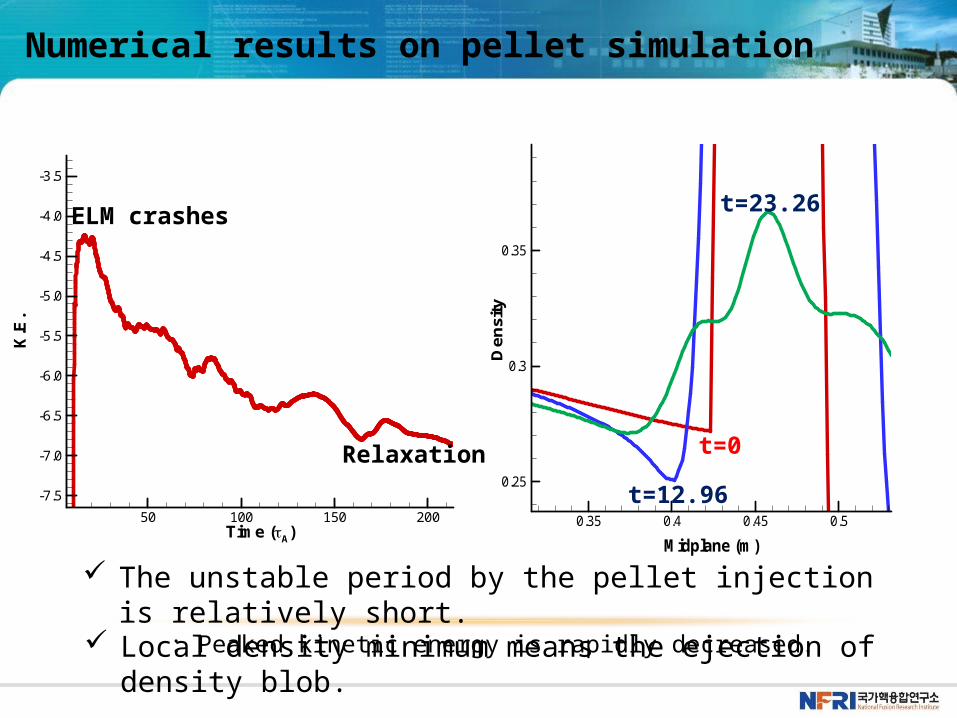
Numerical results on pellet simulation
ELM crashes
Time (A)
K.E.
50 100 150 200
-7.5
-7.0
-6.5
-6.0
-5.5
-5.0
-4.5
-4.0
-3.5
Relaxation
The unstable period by the pellet injection is relatively short.
: Peaked kinetic energy is rapidly decreased. Local density minimum means the ejection of den-sity blob.
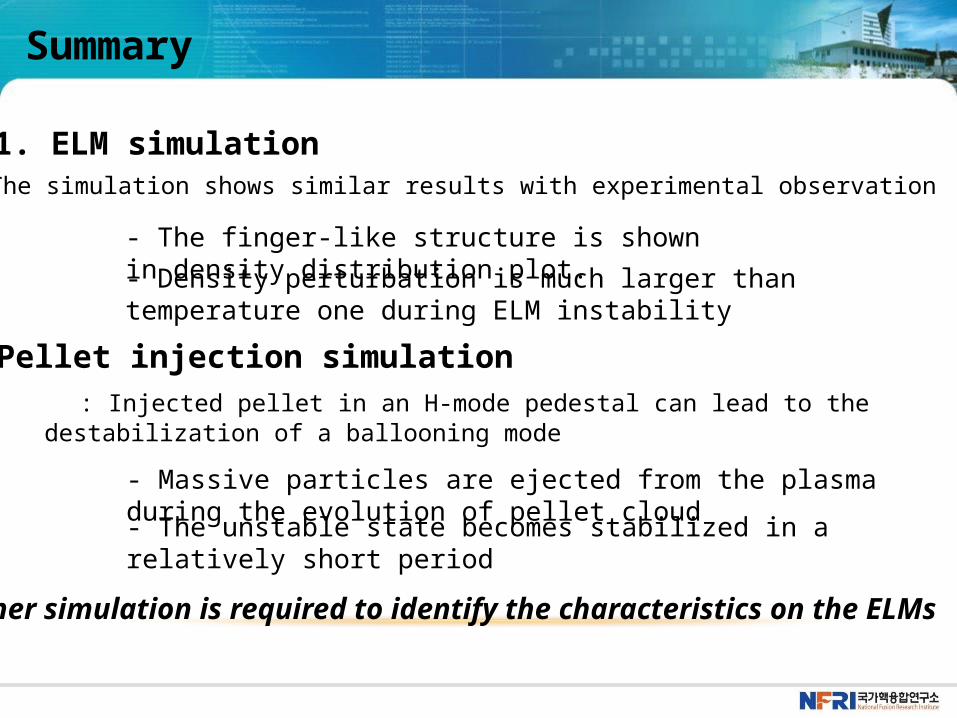
Summary
1. ELM simulation
2. Pellet injection simulation
- The finger-like structure is shown in density distribution plot.
- Density perturbation is much larger than temperature one during ELM instability.
: The simulation shows similar results with experimental observation
: Injected pellet in an H-mode pedestal can lead to the destabilization of a balloon-ing mode
- Massive particles are ejected from the plasma during the evolution of pellet cloud
- The unstable state becomes stabilized in a relatively short period
Further simulation is required to identify the characteristics on the ELMs