6 sigma rollators update for my blog
51
Improve Quality in MS and Brazing Rollators Area
-
Upload
mario-ruiz-felix -
Category
Documents
-
view
170 -
download
0
Transcript of 6 sigma rollators update for my blog

Improve Quality in MS and Brazing
Rollators Area
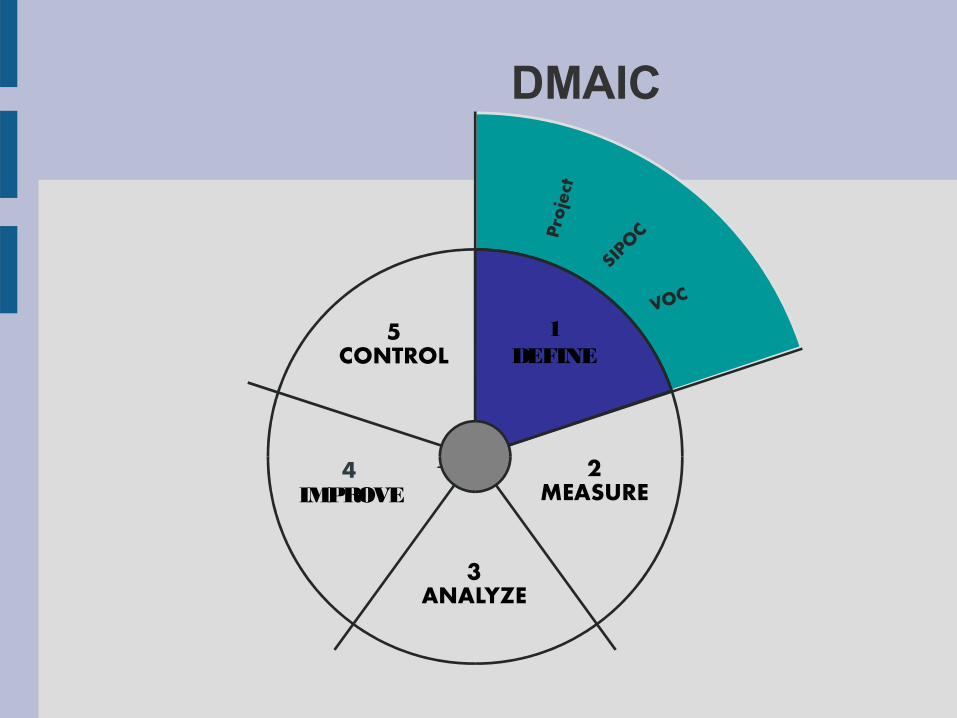
IMPROVE
1DEFINE
DMAIC

Sponsor:• Ensuring that the project is aligned with overall organization goals• Providing personnel and resources• Removing roadblocks and barriers• Allotting time to hear progress reports from the team and provide meaningful feedback
Signed: Imelda SalasName DateDirector of OperationsTitle
Champion:• Arranging Lean Sigma training for the team, as necessary• Coordinating available resources and support• Conducting frequent reviews of the team's progress
Signed: Javier EstradaName DateEngineering and Lean ManagerTitle
Team:• Applying the Lean Sigma methodology to make sustainable improvements to key metrics• Contributing our knowledge, ideas, and experiences• Attending scheduled meetings and events• Completing all assigned action items• Communicating project progress to the Champion and Sponsor
Signed:
Gladys Quiroz Mfg. Engineer / Floor SupportName Date
Eusebia cedillo Quality Engineer / Floor SupportName Date
Jorge Sanchez Gral. Supervisor / ProdcutionName Date
Alejandro Perez Project Engineer / ProjectsName Date
Jorge Castellanos Lean Department / PlantName Date
Ramon Garcia Gral. Supervisor / Tool RoomName Date
Name Date
Title / Role
Title / Role
Title / Role
Title / Role
Title / Role
Title / Role
Title / Role
Signature Page:I commit to support the successful completion of this project by:
I commit to support the successful completion of this project by:
We commit to contributing to the successful completion of this project by:
Project Project ApprovalApproval
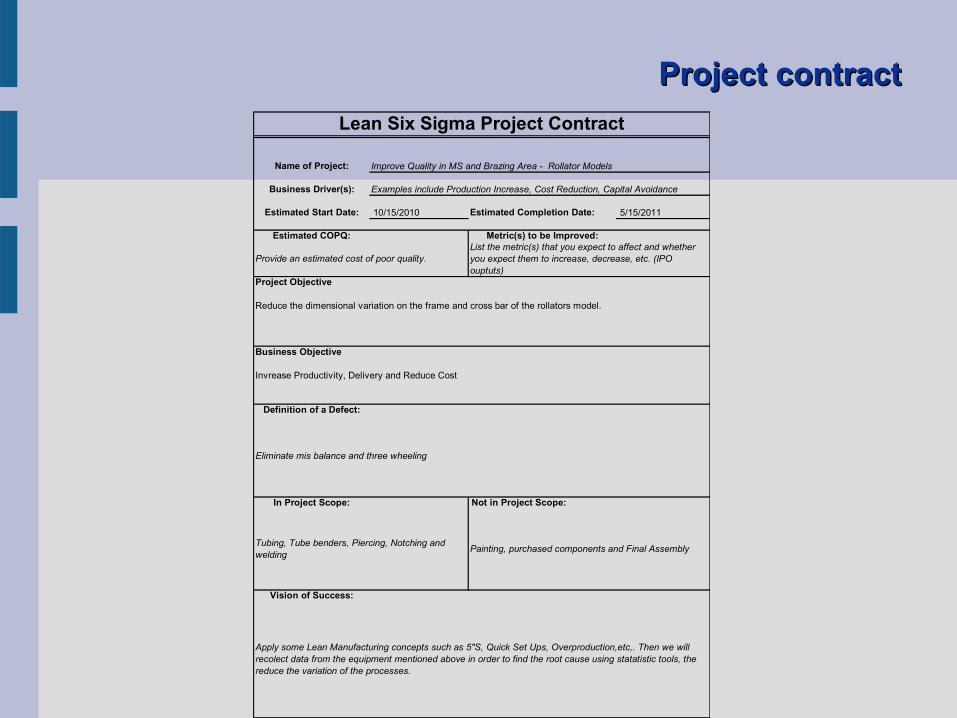
Improve Quality in MS and Brazing Area - Rollator Models
Examples include Production Increase, Cost Reduction, Capital Avoidance
10/15/2010 5/15/2011
Reduce the dimensional variation on the frame and cross bar of the rollators model.
Business Objective
Invrease Productivity, Delivery and Reduce Cost
Estimated COPQ: Metric(s) to be Improved:
Project Objective
Provide an estimated cost of poor quality.List the metric(s) that you expect to affect and whether you expect them to increase, decrease, etc. (IPO ouptuts)
Apply some Lean Manufacturing concepts such as 5"S, Quick Set Ups, Overproduction,etc,. Then we will recolect data from the equipment mentioned above in order to find the root cause using statatistic tools, the reduce the variation of the processes.
Definition of a Defect:
In Project Scope: Not in Project Scope:
Vision of Success:
Eliminate mis balance and three wheeling
Tubing, Tube benders, Piercing, Notching and welding
Painting, purchased components and Final Assembly
Lean Six Sigma Project Contract
Name of Project:
Business Driver(s):
Estimated Start Date: Estimated Completion Date:
Project contractProject contract

Dolomite Rollator

Core Team
Team members– Gladys Quiroz ( Engineering)– Eusebia Cedillo (Quality)– Jorge Sanchez (Production)– Alejandro Perez (Engineering)– Jorge Castellanos (Lean Mfg)– Ramon Garcia (Tool Room) – Jesus Fonseca (Production)
Support Members– Carlos Gonzalez (Finance)– Hector Elizondo (Maintenance)– Edilberto Reyes (HR & Safety)
• Sponsor – Imelda Salas• Champion – Javier Estrada
Black Belt – Mario Ruiz
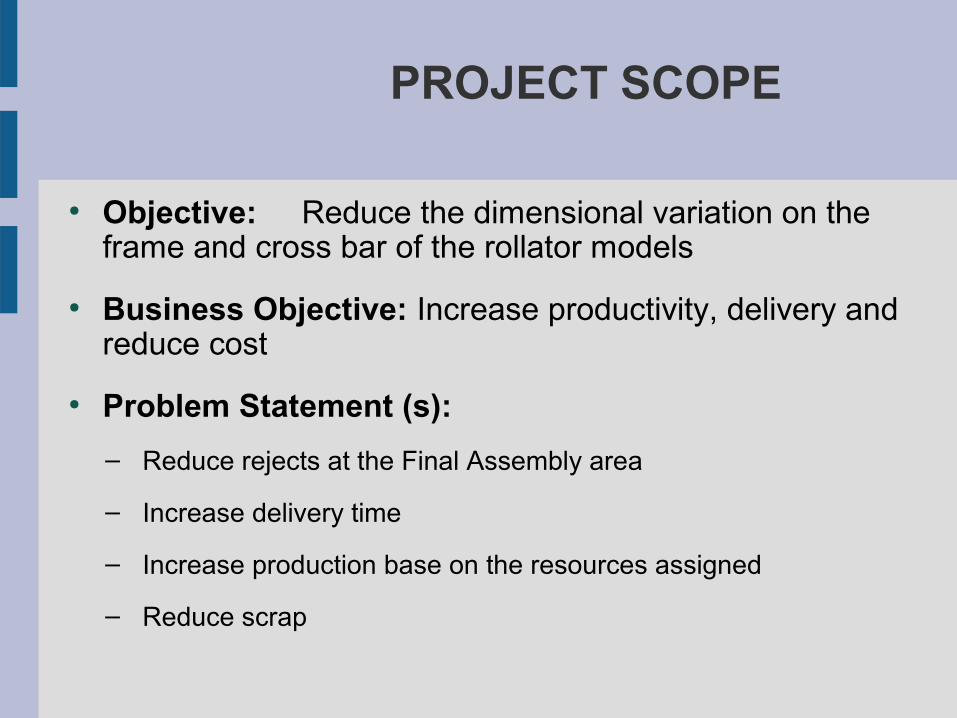
● Objective: Reduce the dimensional variation on the frame and cross bar of the rollator models
● Business Objective: Increase productivity, delivery and reduce cost
● Problem Statement (s):
– Reduce rejects at the Final Assembly area
– Increase delivery time
– Increase production base on the resources assigned
– Reduce scrap
PROJECT SCOPE

Project Timeline

VOCVOC
1. What process are we working on?• Rollators (Machine Shop & Brazing)
1. What is the process objective (voice of the customer and/or business)?• Reduce and Eliminate rework and scrap due cross folding and three
wheeling1. Has the customer been interviewed to confirm the VOC?
• Yes1. What is the project business objective (COPQ)?
• While eliminating this type of defects we minimize the chances of shipping bad product to our customers. We will also improve our safety and ergonomics eliminating the risk for a long term injuries. We can increase our production velocity, reduce the inspection time and material handling.
1. What does success look like (project goals)?• Hit Target: What is the target?
– Feb 2011 for hand off training and Owner sign off• Minimize: to what level, cost or effort?
– 80% Rework / Scrap reduction for cross folding and three wheeling• Robustness: To what degree?
– Maxi and Legacy Rollators regardless of the customer
Customer Interview

VOC6. How long had this issue been present?
Employee and supervisors interviews states that three wheeling has been since product initiated production, and cross folding control became due a some customer complains.
What has been done about it so far?Some tooling and process correction and 100% inspection at final assembly thru kaizen events.
7. Construct an Input, Process, Output diagram of the process. Outputs need to be measurable, in units, and possibly normalized. Use continuous data when possible. All outputs need to represent the voice of the customer or business.
SUPPLIER INPUT PROCESS OUTPUT CUSTOMER
Target
Materials Raw Material
H.Resources SOP's Delivery increase 95% <= 2 Days Government
Process Eng. Manpower Machine Shop Airlines
Maintenance Training Scrap Reduction 70% Parks
Industrial Eng Equipment Brazing Farmacies
Prod. Sup. Machines FPY 98% Warehouses
Safety Parameter Homecare
Utilities WIP Reduction 60% DC’s

8. Do you have baseline data for the outputs?• Yes, there are scrap and first pass yield reports• Measurements of the product were given but new parameters needed to be
set up due to new tooling for bender equipment.9. Can the project be completed (new controls in place) in 4-6 months?
• Yes, it can be completed
10. What are the problem statement(s)?• Cross folding• Three wheeling• Dimensional capability
11.Do you have an idea of what is causing these issues? • Yes, potential dimensional variation during the machining and welding
processes. Can that be supported with data?
• Not at this time, we have to collect data from the source.12. What prevents us from being in the desired state?
• Machine capabilities• Process operator dependable
13. Is this process within our realm of influence?• Yes, if a major investment is required a Cap Ex must be issue and approved
prior implementation
VOC

15. Who should be on the project team?• Core Team – multi-task employees with experience in this
product.
Suppliers Process Participants
Customers Others
Warehouse Cutting Paint Line Production Control
Planning Bending Final Assembly Quality
Production control Punching
Maintenance Welding
Tool Room Piercing
Engineering
14. Who are the stakeholders in this process?
VOC
Value Stream Map (Current state)
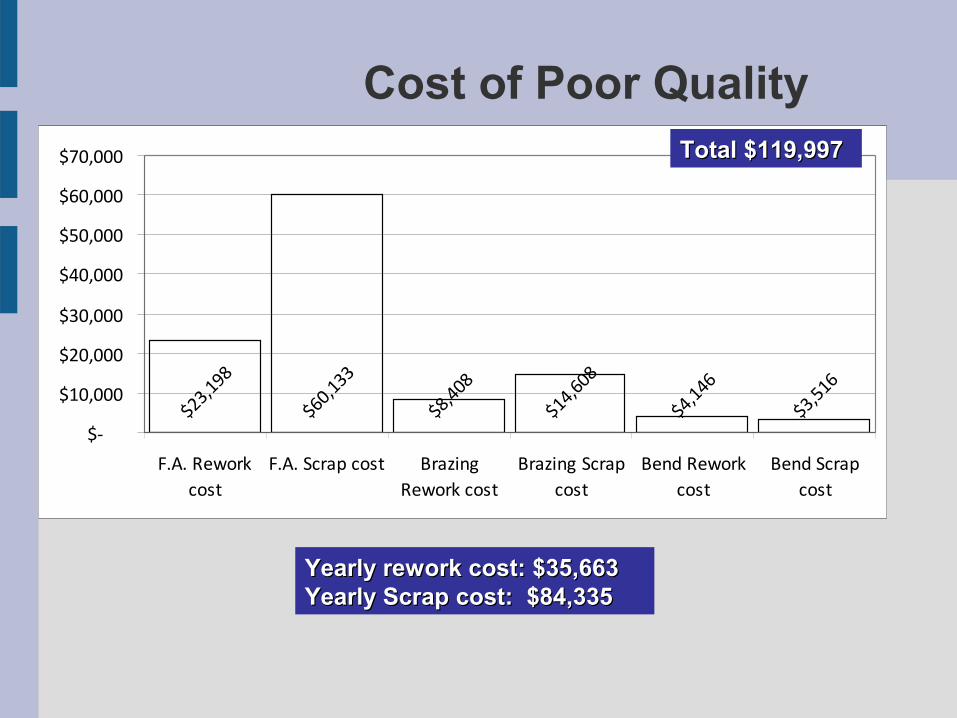
Cost of Poor Quality
$23,198
$60,133
$8,408
$14,608
$4,146
$3,516
$-
$10,000
$20,000
$30,000
$40,000
$50,000
$60,000
$70,000
F.A. Reworkcost
F.A. Scrap cost BrazingRework cost
Brazing Scrapcost
Bend Reworkcost
Bend Scrapcost
Yearly rework cost: $35,663Yearly rework cost: $35,663Yearly Scrap cost: $84,335Yearly Scrap cost: $84,335
Total $119,997Total $119,997

Defects Pareto
3508
857503 440
209 92 68 40 37 250
500
100015002000
25003000
35004000
Incorre
ct Ben
d
Set-u
p failu
re
Mat
erial
relat
ed
Bend fla
tness
Toolin
g den
t
Oxide
welding fa
ilure
Bad fo
rming
Incorre
ct len
gth
Metal
dent
Uni
ts

Bend Defect Pareto
Incorrect Bend degree77%
13%7% 3%
0%10%20%30%40%50%60%70%80%90%
Bender D-11 Press P54 Weldingfixture
Chrome
77% of bend defects relates to bender equipment77% of bend defects relates to bender equipment
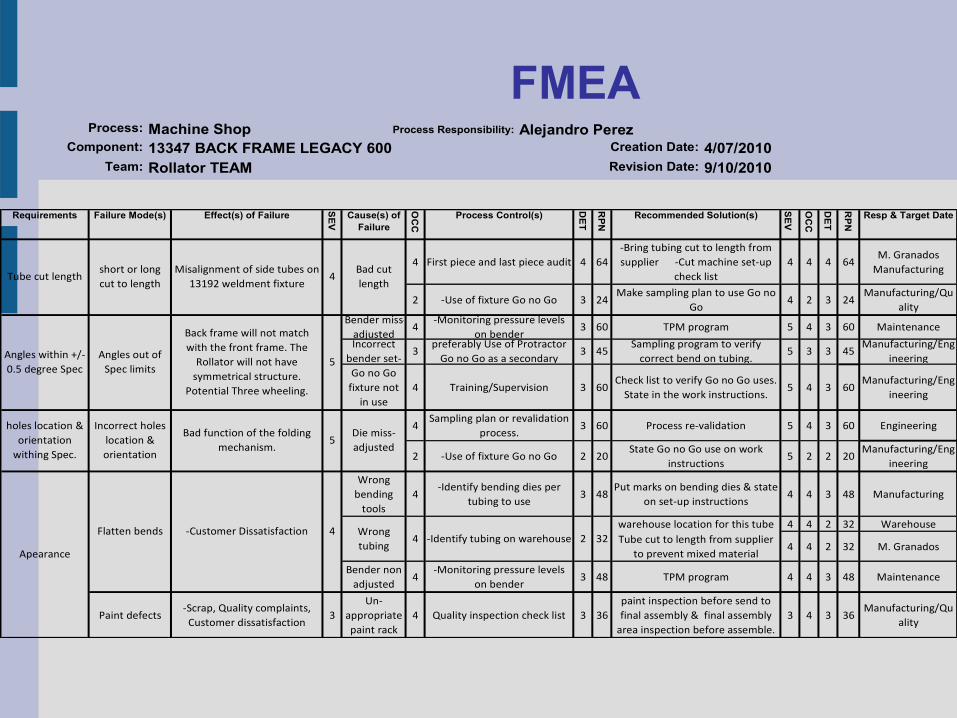
FMEA
Requirements Failure Mode(s) Effect(s) of Failure
SE
V
Cause(s) of Failure
OC
C
Process Control(s)
DE
T
RP
N
Recommended Solution(s)
SE
V
OC
C
DE
T
RP
N
Resp & Target Date
4 First piece and last piece audit 4 64-Bring tubing cut to length from supplier -Cut machine set-up
check list4 4 4 64
M. Granados Manufacturing
2 -Use of fixture Go no Go 3 24Make sampling plan to use Go no
Go4 2 3 24
Manufacturing/Quality
Go no Go fixture not
in use4 Training/Supervision 3 60
Check list to verify Go no Go uses. State in the work instructions.
5 4 3 60Manufacturing/Eng
ineering
4Sampling plan or revalidation
process.3 60 Process re-validation 5 4 3 60 Engineering
2 -Use of fixture Go no Go 2 20State Go no Go use on work
instructions5 2 2 20
Manufacturing/Engineering
Wrong bending
tools4
-Identify bending dies per tubing to use
3 48Put marks on bending dies & state
on set-up instructions4 4 3 48 Manufacturing
warehouse location for this tube 4 4 2 32 Warehouse Tube cut to length from supplier
to prevent mixed material4 4 2 32 M. Granados
Bender non adjusted
4-Monitoring pressure levels
on bender3 48 TPM program 4 4 3 48 Maintenance
Paint defects-Scrap, Quality complaints,
Customer dissatisfaction3
Un-appropriate paint rack
4 Quality inspection check list 3 36paint inspection before send to final assembly & final assembly
area inspection before assemble.3 4 3 36
Manufacturing/Quality
4 -Identify tubing on warehouse 2 32
Die miss-adjusted
Apearance
Flatten bends -Customer Dissatisfaction 4 Wrong tubing
holes location & orientation
withing Spec.
Incorrect holes location & orientation
Bad function of the folding mechanism.
5
3 3 45Manufacturing/Eng
ineering
3 60 Maintenance
Incorrect bender set-
3preferably Use of Protractor
Go no Go as a secondary 3 45
Sampling program to verify correct bend on tubing.
5
60 TPM program 5 4Bender miss-
adjusted4
-Monitoring pressure levels on bender
3
Angles within +/-0.5 degree Spec
Angles out of Spec limits
Back frame will not match with the front frame. The
Rollator will not have symmetrical structure.
Potential Three wheeling.
5
Tube cut lengthshort or long cut to length
Misalignment of side tubes on 13192 weldment fixture
4Bad cut length
Process: Machine Shop Process Responsibility: Alejandro PerezComponent: 13347 BACK FRAME LEGACY 600 Creation Date: 4/07/2010
Team: Rollator TEAM Revision Date: 9/10/2010
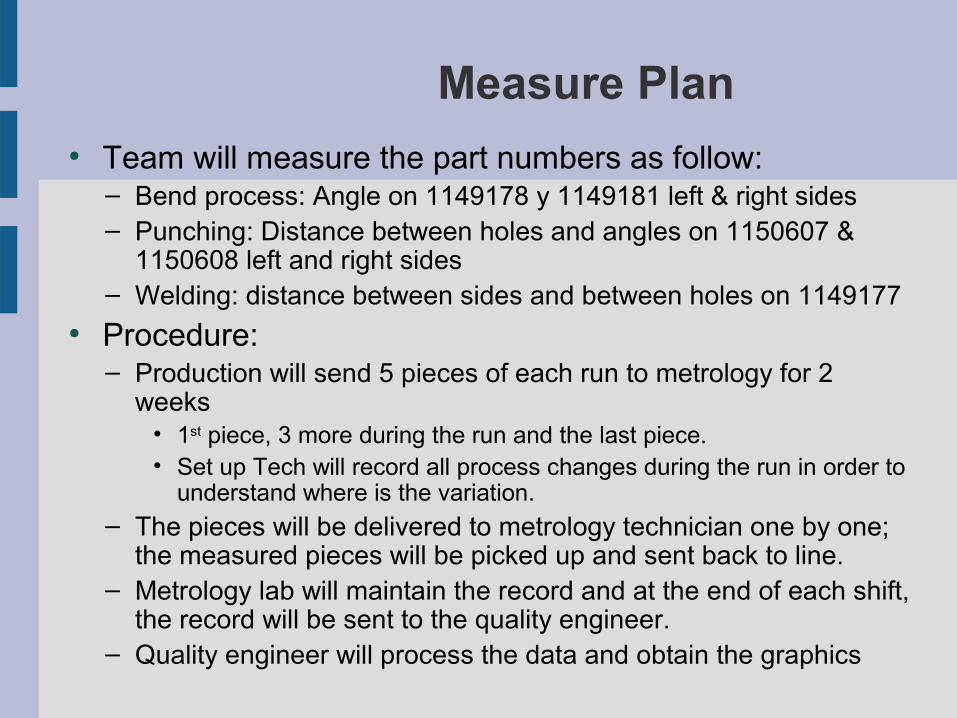
Measure Plan● Team will measure the part numbers as follow:
– Bend process: Angle on 1149178 y 1149181 left & right sides – Punching: Distance between holes and angles on 1150607 &
1150608 left and right sides– Welding: distance between sides and between holes on 1149177
● Procedure:– Production will send 5 pieces of each run to metrology for 2
weeks • 1st piece, 3 more during the run and the last piece.• Set up Tech will record all process changes during the run in order to
understand where is the variation.– The pieces will be delivered to metrology technician one by one;
the measured pieces will be picked up and sent back to line.– Metrology lab will maintain the record and at the end of each shift,
the record will be sent to the quality engineer.– Quality engineer will process the data and obtain the graphics

2010 Defects
1,261 1,284 2,460
1,702 1,782
1,787
1,309 1,748
1,959
1,645
1,270
2,049 2,086
3,997
2,765 2,895
2,904
2,127 2,841 3,184
2,673
1,016
2,207 2,246
4,304
2,978 3,118 3,128
2,291
3,059 3,429
2,879
2,539
296 556 641
329 264 385
0
2,000
4,000
6,000
8,000
10,000
12,000
Jan Feb Mar Apr May Jun Jul Aug Sep Oct Nov Dec Jan-11
2010
Units
M.S. Defects Brazing Defects F.A. Defects
Significative improvement achieved for production to control runs and Significative improvement achieved for production to control runs and avoid mixing set-ups has helped reduce three wheeling.avoid mixing set-ups has helped reduce three wheeling.

Three wheeling Defect Trend
Nov 2010 Production started to control production orders for Nov 2010 Production started to control production orders for left and right sides of the frame.left and right sides of the frame.
2.92%
4.83%
2.54%
4.28%
3.70%3.60%
4.49%
8.38%8.19%
7.34%
1.95%
0.35%0.30%
0.00%
1.00%
2.00%
3.00%
4.00%
5.00%
6.00%
7.00%
8.00%
9.00%
Jan Feb Mar Apr May Jun Jul Aug Sep Oct Nov Dec Jan-11
2010

IMPROVE
DMAICDMAIC

IPO Grid Bender
Output Variables
Tube bend operation Bend angle
Distance between
bends Length Total
Weigh Factor 9 5 1
Process input variables
Speed 9 5 1 107
Die penetration 9 1 1 87
Pressure 9 5 1 107
Stops position 1 9 9 63
Temperature 5 1 1 51
Lubrication 5 1 1 51
Forming dies 5 5 1 71
Tube strength 9 1 1 87
Tube position 1 5 5 39
Per our pareto graphs we weighed bend angle as our output variable to focus

Time Series Plot 610 angle Run trial to establish our start point.• 20 pieces in Bend & Punch operations • Measured the 4 angles of the piece after each operation• Graph each Angle to compare
2018161412108642
62.0
61.5
61.0
60.5
60.0
59.5
Index
Dat
a
Angle 1Max 1Min 1Punch 1Spec 1
Variable
Time Ser ies Plot of Angle 1, Max 1, Min 1, Punch 1, Spec 1
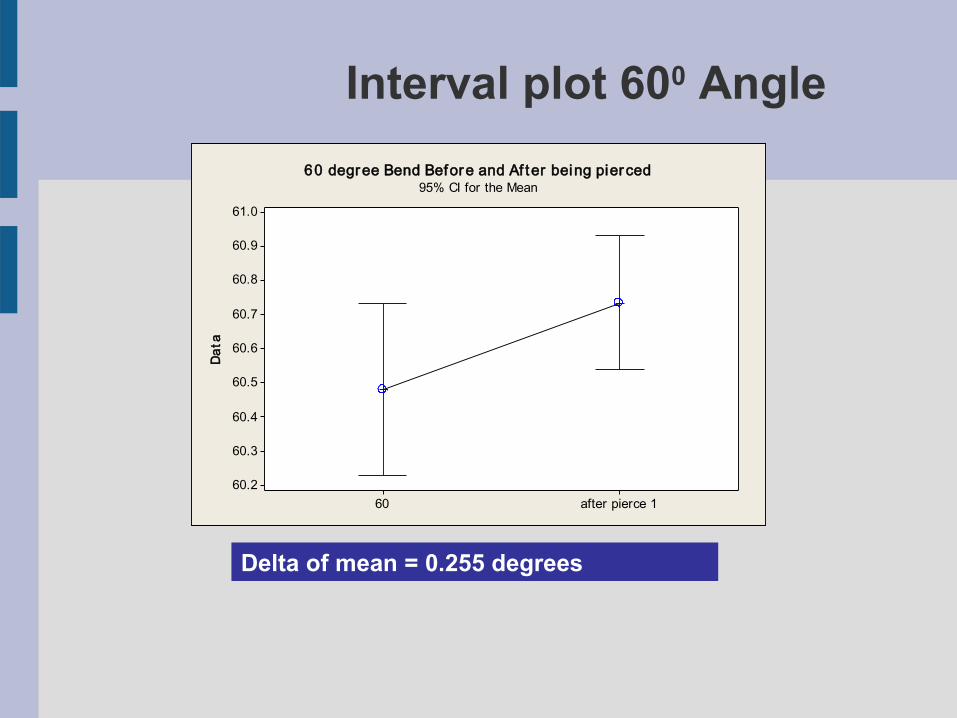
Interval plot 600 Angle
after pierce 160
61.0
60.9
60.8
60.7
60.6
60.5
60.4
60.3
60.2
Dat
a
60 degree Bend Before and Af ter being pier ced95% CI for the Mean
Delta of mean = 0.255 degrees

Hypothesis test for piercing process● The Angle deformation made during piercing operation is
statistically significant to deviate in +/-0.5 degrees
H0-0.50<m0>+0.50
H1-0.50>m1<+0.50
One-Sample T: Z-test Test of mu = 0.5 vs not = 0.5Variable N Mean StDev SE Mean 95% CI T PZ-test 59 -0.0458 0.3164 0.0412 (-0.1282, 0.0367) -13.25 0.0090.009 One-Sample T: Z-test Test of mu = -0.5 vs not = -0.5Variable N Mean StDev SE Mean 95% CI T PZ-test 59 -0.0458 0.3164 0.0412 (-0.1282, 0.0367) 11.03 0.0090.009
P-values range from 0 to 1. The smaller the p-value, the smaller the probability that rejecting the null hypothesis is a mistake
Conclusion:The H0 is rejected as P value in both tests are 0.009
0.500.250.00-0.25-0.50-0.75
X_
Ho
Z- t est
Boxplot of Z-test(with Ho and 95% Z-confidence interval for the Mean, and StDev = 0.25)

Cause and effect analysis
WheelingThree
Environment
Measurements
Methods
Material
Machines
Personnel
No experience
Lack of t raining
equipment check up
prevent ive maintenance
tooling condit ion
unstable pressure
walnut out of tolerance
Material inconsistency
Material hardness
Lenght
process controls
Welding process
tooling lifecycle records
Operator dependant
set up parameters
tube posit ion
Set up tools
measurement toolsimproper
lack of calibrat ion
Go-no go out of spec
Safety factors
Temperature
Cause-and-Ef fect Diagram
Bend Angle Three
Wheeling
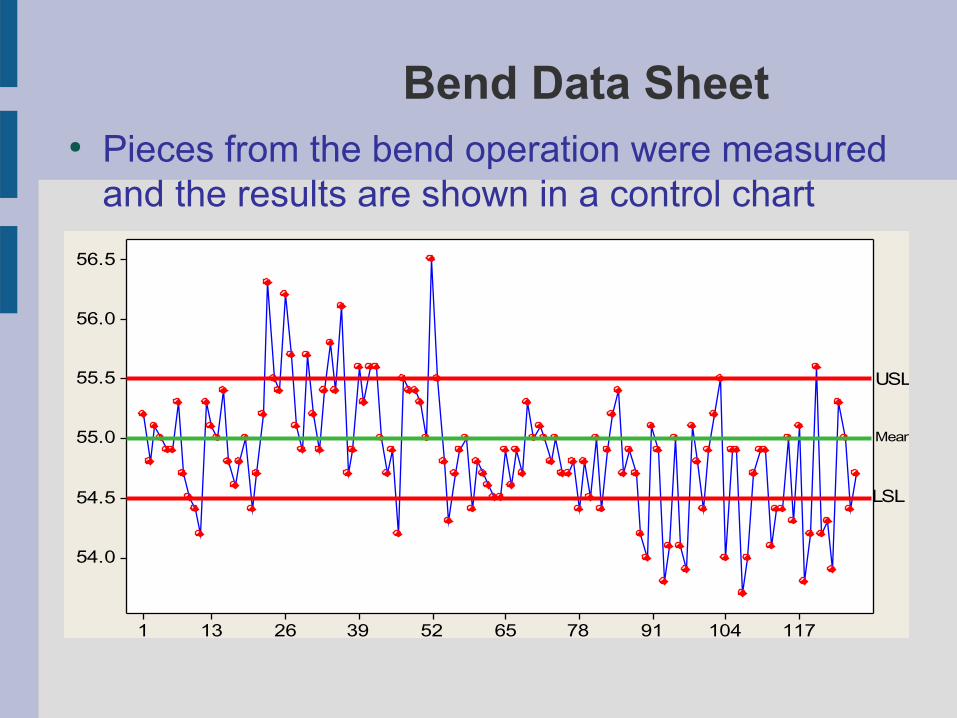
Bend Data Sheet● Pieces from the bend operation were measured
and the results are shown in a control chart
117104917865523926131
56.5
56.0
55.5
55.0
54.5
54.0
Index
55 d
egre
e
Time Ser ies Plot of 55 degree
USL
LSL
Mean
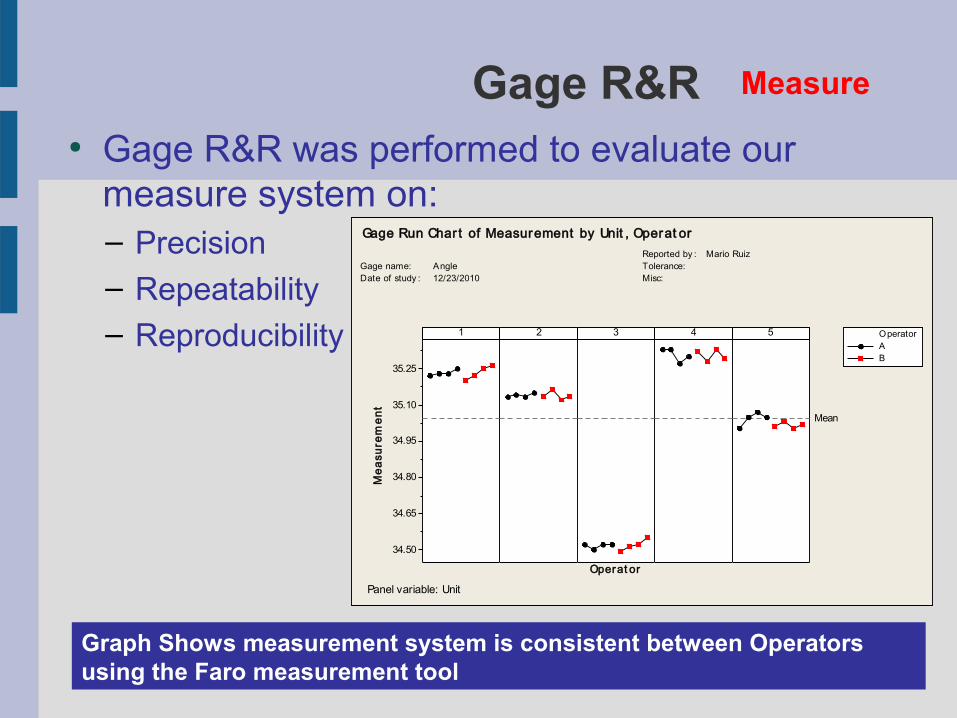
Gage R&R● Gage R&R was performed to evaluate our
measure system on:– Precision
– Repeatability
– Reproducibility
Measure
35.25
35.10
34.95
34.80
34.65
34.50
1
Operat or
Mea
sure
men
t
2 3 4 5
Mean
AB
Operator
Gage name: Angle Date of study : 12/23/2010
Reported by : Mario RuizTolerance: Misc:
Panel variable: Unit
Gage Run Char t of Measurement by Unit , Operat or
Graph Shows measurement system is consistent between Operators using the Faro measurement tool

ANOVA of Gage R&R
Part-to-PartReprodRepeatGage R&R
100
50
0
Per
cent
% Cont ribut ion% Study Var
5432154321
0.10
0.05
0.00
Unit
Sam
ple
Ran
ge
_R=0.044
UCL=0.1004
LCL=0
A B
5432154321
35.1
34.8
34.5
Unit
Sam
ple
Mea
n __X=35.044UCL=35.0761LCL=35.0119
A B
54321
35.1
34.8
34.5
Unit
BA
35.1
34.8
34.5
Operat or
54321
35.1
34.8
34.5
Unit
Ave
rage
AB
Operat or
Gage name: Angle measurementDate of study : 12/23/2010
Reported by : Mario RuizTolerance: 1Misc:
Com ponents of Variat ion
R Chart by Operator
Xbar Chart by Operator
Measurem ent by Unit
Measurem ent by Operator
Unit * Operator I nteract ion
Gage R& R (ANOVA) for Measurement
Pieces are out of control, meaning measurement
system is valid
No interaction of operator if lines are almost parallel
system is on control, means operators are measuring almost the
same,
Variation of the pieces, OK
Major contributor of variation is the parts, means, the measuring
system is correct
ANOVA to the measuring system shows our measurement system to be reliable

Six pack Bender Analysis
Process sigma, CP and Cpk was determined
2321191715131197531
56
55
54Sam
ple
Mea
n
__X= 54.913
UCL= 55.994
LCL= 53.833
2321191715131197531
2
1
0Sam
ple
Ran
ge
_R= 0.574
UCL= 1.877
LCL= 0
2015105
56
55
54
Sam ple
Valu
es
56.455.855.254.654.053.4
LSL USL
LSL 54.5USL 55.5
Specifications
57.055.554.0
Within
Ov erall
Specs
StDev 0.5092Cp 0.33Cpk 0.27PPM 333124.40
WithinStDev 0.5987Pp 0.28Ppk 0.23Cpm *PPM 408572.88
Overall
1
Process Capabi l i t y Sixpack of C5Xbar Char t
Tests performed with unequal sample sizes
R Char t
Tests performed with unequal sample sizes
Last 2 4 Subgr oups
Capabilit y Histogr am
Nor mal Pr ob PlotAD: 0.421, P: 0.320
Capabil ity Plot
Xbar shows data to be normal as well as the histogram
2321191715131197531
56
55
54Sam
ple
Mea
n
__X= 54.913
UCL= 55.994
LCL= 53.833
2321191715131197531
2
1
0Sam
ple
Ran
ge
_R= 0.574
UCL= 1.877
LCL= 0
2015105
56
55
54
Sam ple
Valu
es
56.455.855.254.654.053.4
LSL USL
LSL 54.5USL 55.5
Specifications
57.055.554.0
Within
Ov erall
Specs
StDev 0.5092Cp 0.33Cpk 0.27PPM 333124.40
WithinStDev 0.5987Pp 0.28Ppk 0.23Cpm *PPM 408572.88
Overall
1
Process Capabi l i t y Sixpack of C5Xbar Char t
Tests performed with unequal sample sizes
R Char t
Tests performed with unequal sample sizes
Last 24 Subgr oups
Capabili t y Histogr am
Nor mal Pr ob PlotAD: 0.421, P: 0.320
Capabil it y Plot
Data shows a dispersion from 53.83 to 55.99
Six pack Bender Analysis
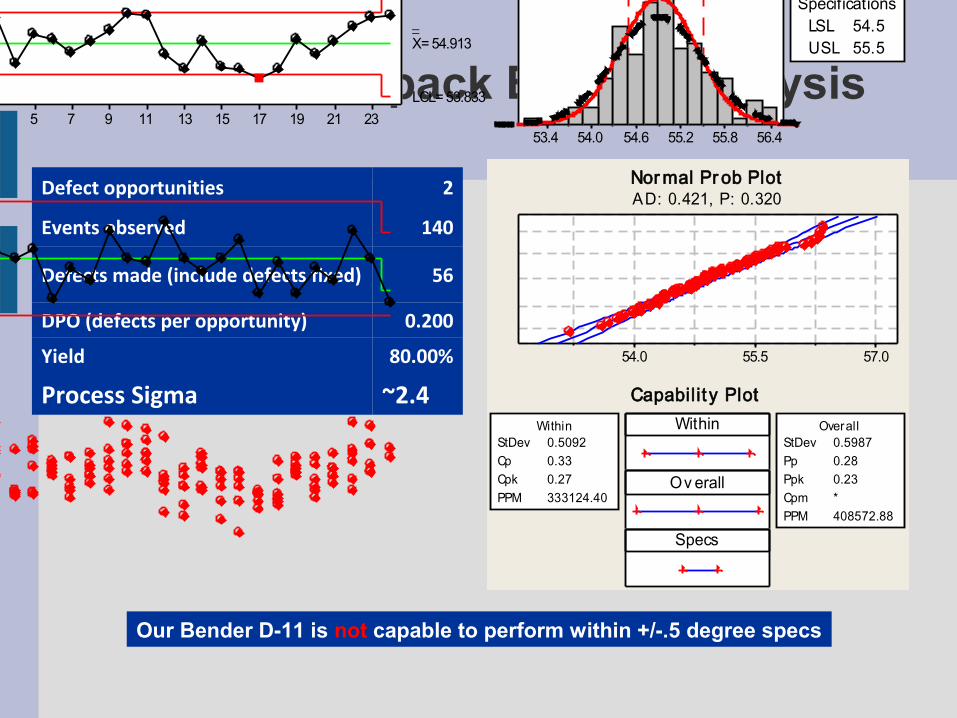
Defect opportunities 2
Events observed 140
Defects made (include defects fixed) 56
DPO (defects per opportunity) 0.200
Yield 80.00%
Process Sigma ~2.4
2321191715131197531
56
55
54Sam
ple
Mea
n
__X= 54.913
UCL= 55.994
LCL= 53.833
2321191715131197531
2
1
0Sam
ple
Ran
ge
_R= 0.574
UCL= 1.877
LCL= 0
2015105
56
55
54
Sam ple
Valu
es
56.455.855.254.654.053.4
LSL USL
LSL 54.5USL 55.5
Specifications
57.055.554.0
Within
Ov erall
Specs
StDev 0.5092Cp 0.33Cpk 0.27PPM 333124.40
WithinStDev 0.5987Pp 0.28Ppk 0.23Cpm *PPM 408572.88
Overall
1
Process Capabi l i t y Sixpack of C5Xbar Char t
Tests performed with unequal sample sizes
R Char t
Tests performed with unequal sample sizes
Last 2 4 Subgr oups
Capabilit y Histogr am
Nor mal Pr ob PlotAD: 0.421, P: 0.320
Capabilit y Plot
Our Bender D-11 is not capable to perform within +/-.5 degree specs

Process
analysis
Mu
lti-Vari
Ca
us
e
org
an
ization
Hip
ote
sis
verific
atio
n
Reg
resion
DoE
5Control
1Define
2Measure
4Improve
3Analyze
DMAICDMAIC

Multi-vari analysis
11.8
11.7
11.6
11.5
11.3
55.50
55.25
55.00
54.75
54.50
16-Dec
15-D
ec
14-D
ec
13-D
ec
10-Dec
9-Dec
8-Dec
3-Dec
2-Dec
1-Dec
30-Nov
26-Nov
25-Nov
24-Nov
Angle parameter
Mea
n
date
Main Ef fects Plot for Cur r entData Means
The Encoder misread angle position, We use a cross reference table to set the angle

Time series Plot by angle set
140126112988470564228141
56.5
56.0
55.5
55.0
54.5
54.0
53.5
53.0
Index
Curr
ent
11.311.511.611.711.8
parameterAngle
Time Ser ies Plot of Cur rent
We will likely look for extremes in order to see potential DOE variable

Facts about Bend precision● Angle Precision vs Speed
– Equipment states that Angle precision and speed are inversely proportional; If we increase speed, the result angle is less precise.
– the equipment is capable to decelerate the upper piston speed almost at the end of the bend cycle.
– The set up is obtained by the constants of deceleration and proportional of speed.
– More details can be found in the equipment’s display.
– Based on this, we determine the variables to use in our DOE.

DOE Matrix and Results.Std
OrderCenter
PtRun
Order Blocks P1 P2 Speed Prop.
decelerationResult
1Result
2
14 1 1 1 950 1600 0.8 10.00 89.3 89.3
3 1 2 1 700 1800 0.5 1.00 83.3 85.2
13 1 3 1 700 1600 0.8 10.00 89.1 88.4
4 1 4 1 950 1800 0.5 1.00 85.4 86.2
11 1 5 1 700 1800 0.5 10.00 89.6 88.9
15 1 6 1 700 1800 0.8 10.00 89.6 89.2
8 1 7 1 950 1800 0.8 1.00 84.3 87.1
16 1 8 1 950 1800 0.8 10.00 89 89.6
6 1 9 1 950 1600 0.8 1.00 86.4 87
10 1 10 1 950 1600 0.5 10.00 89.6 89.6
7 1 11 1 700 1800 0.8 1.00 84.6 86.1
12 1 12 1 950 1800 0.5 10.00 89.4 89.5
2 1 13 1 950 1600 0.5 1.00 86.4 88.1
1 1 14 1 700 1600 0.5 1.00 84.7 86.4
9 1 15 1 700 1600 0.5 10.00 88.8 89.7
5 1 16 1 700 1600 0.8 1.00 84.8 86.3

Results of DOE
Results of DOE to be normal due variation as expected.
Index
Res
ult
30272421181512963
90
89
88
87
86
85
84
83
Time Ser ies Plot of Resul t
Sample order

Marginal Plots
950700
89
88
87
86
18001600
0.80.5
89
88
87
86
10.001.00
P1
Mea
n
P2
Speed Prop.
Main Ef fects Plot for Resul tData Means
Proportional deceleration has the main effect for the desired result

Interaction Plot18001600 0.80.5 10.001.00
90.0
87.5
85.090.0
87.5
85.090.0
87.5
85.0
P1
P2
Speed
Prop.
700950
P1
16001800
P2
0.50.8
Speed
I nteract ion Plot for Resul t Data Means
Between Factors, Proportional of deceleration has the main effect for the desired result

Conclusion of DOE
101
90
89
88
87
86
85
Dat
aDot Plot of Propor t ional of decelerat ion
95% CI for the Mean
Higher proportional of deceleration factor has the main effect for the desired result
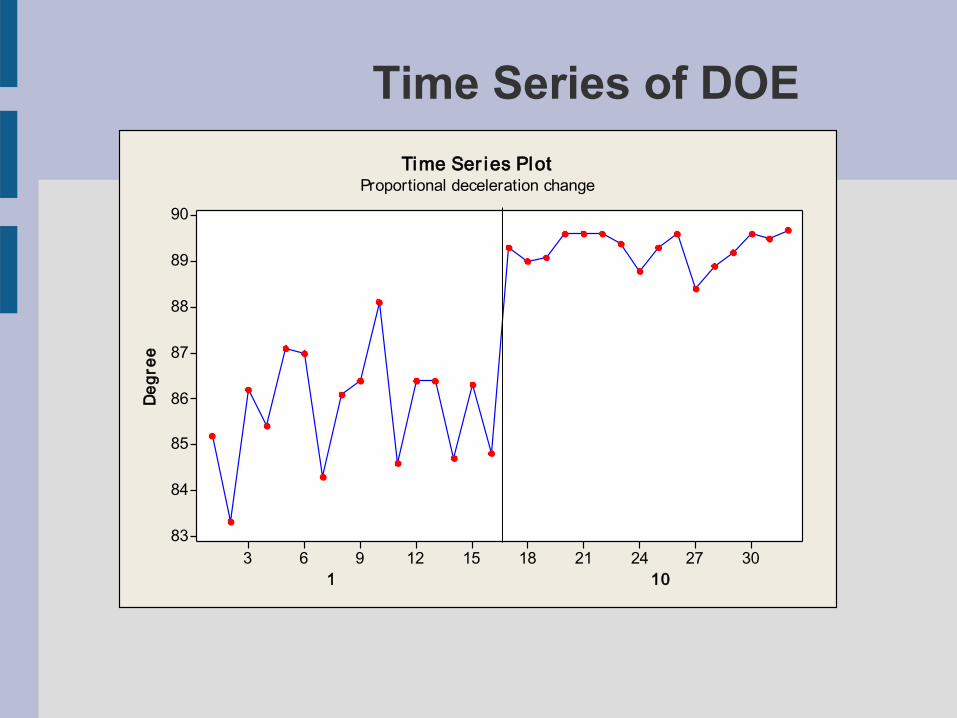
Time Series of DOE
30272421181512963
90
89
88
87
86
85
84
83
1 10
Deg
ree
Time Ser ies PlotProportional deceleration change

Solutions
FMEA
Pilot tests
Action plan
5CONTROL
1DEFINE
2MEASURE
4IMPROVE
3ANALYZE
DMAICDMAIC

Pilot test Results
17015313611910285685134171
56.5
56.0
55.5
55.0
54.5
54.0
53.5
53.0
Index
Curr
ent-
pilo
t
Time Ser ies Plot of Cur rent -pi lot
UCL
LCL
Mean
Pilot Test results show and improvement in bend accuracy.
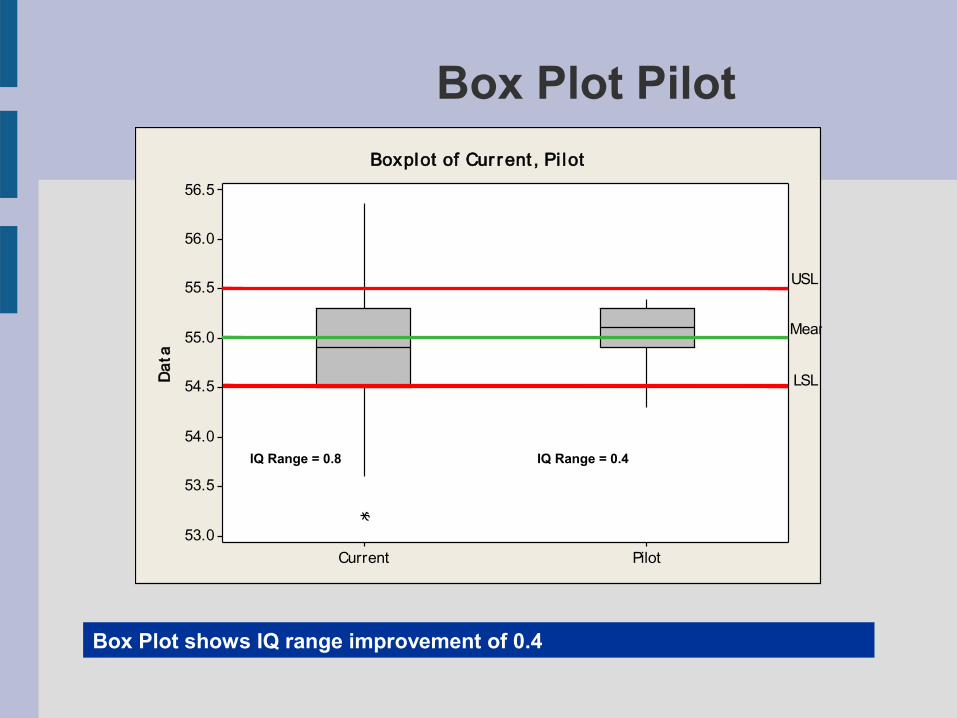
Box Plot Pilot
PilotCurrent
56.5
56.0
55.5
55.0
54.5
54.0
53.5
53.0
Dat
aBoxplot of Cur rent , Pi lot
USL
LSL
Mean
Box Plot shows IQ range improvement of 0.4
IQ Range = 0.8 IQ Range = 0.4

Solution Grid Solution Status Responsible Due date Comments
Run pilot test to validate constant of deceleration sets. 60 Pieces run thru all process
Closed Team 3/7
Conduct a SMED event in D-11 Bender to improve set-up time ClosedJorge
Castellanos5/18
Setup all part numbers parameters and save them in the equipment to avoid missing information due set up technician change/absence.
Closed Jesus Fonseca 3/25Set-up technitians were trained to load and save
parts in equipment
Bender Equipment Parameters training to personnel Closed Mario Ruiz 3/15Parameters reviewed and
saved in equipment
Perform TPM to assure proper bender operation and set preventive maintenance schedule (oil leaks repair, change worn parts)
Closed Ramon Garcia
Develop a trouble shooting manual for Bender equipment Closed Ramon Garcia
Trouble shooting completed, will prepare info in binder to deliver
production
Welding fixtures maintenance and verification to assure dimensions
Closed Ramon Garcia 3/25Welding fixtures reviewed
and pass specs.
Reset Encoder to absolute 0 degrees Closed Hector Elizondo 4/05Review with Pines model
& serial number.
Develop new inspection fixtures (go-no go). Closed Mario Ruiz QC certified the fixture

SummarySummary
Description Before After Results Annual savings Improvement %
Monthly Lost hours
$292 $3 $288 $3,461 98.92%
Scrap Report $3,102 $852 $2,250 $27,000 72.53%
Incorrect Bend $1,705 $14 $1,691 $20,292 99.16%
Rework cost $2,972 $32 $2,940 $35,279 98.91%
Lean Initiatives cost reduction
Model Before After Results Annual savings
Improvement %
12050-37-85VA $62.09 $59.61 $2.48 $8,683 4.00%
12050-37-86VA $66.84 $65.31 $1.53 $52,044 2.29%
12120-37-746 $85.07 $83.34 $1.73 $23,793 2.03%
12122-37-746 $84.25 $82.53 $1.71 $2,142 2.03%
12122-37-23 $88.47 $86.67 $1.80 $2,249 2.03%
Annual cost Savings $171,482.00

Monitoring
Evaluating results
Documentation
Closure
5CONTROL
1DEFINE 2
MEASURE
4IMPROVE
3ANALYZE
DMAICDMAIC
Monitoring● As a method to constantly review bend
performance, Team has implemented to check the bend at the beginning of the run, every 10 pieces and the last piece, this has helped understand variation and correct as necessary.
● Scrap and Rework has been dramatically reduced.

Scrap monitoring
$0.00
$1,000.00
$2,000.00
$3,000.00
$4,000.00
$5,000.00
$6,000.00
Jan Feb Mar Apr May Jun Jul Aug Sep Oct Nov Dec
2010 2011
Average 2010 scrap related to Bend defects was $ 1,979.44
2011 up-to-date scrap average $110. 37

Rework cost
Rework costs 2011
$-
$10.00
$20.00
$30.00
$40.00
$50.00
$60.00
Jan Feb Mar Apr May Jun
Average 2010 rework cost related to Bend defects was $ 2,971.92
2011 up-to-date scrap average $35.39