6-Sigma, DMAIC & DCOV Fundamentals - Lean · PDF fileLean Tools 3 of 24 DCOV PROCESS VERIFY...
24
6-Sigma, DMAIC & DCOV Reference Guide Fundamentals
Transcript of 6-Sigma, DMAIC & DCOV Fundamentals - Lean · PDF fileLean Tools 3 of 24 DCOV PROCESS VERIFY...

6-Sigma, DMAIC & DCOV
Reference GuideFundamentals

Lean Tools 2 of 24 www.leandeployment.com
Table of Contents
KEY CONCEPTS............................................................................................................................................................4
6-SIGMA OVERVIEW.....................................................................................................................................................6
DMAIC — DEFINE PHASE.............................................................................................................................................7
DMAIC PROCESS DEFINE PHASE DELIVERABLES, ACTIONS, AND TOOLS......................................................7 DEFINE PHASE KEY POINTS TO REMEMBER .......................................................................................................8DEFINE PHASE SUMMARY.......................................................................................................................................8
DMAIC — MEASURE PHASE .................................... ...................................................................................................8
DMAIC PROCESS MEASURE PHASE DELIVERABLES, ACTIONS, AND TOOLS..................................................9MEASURE PHASE KEY POINTS TO REMEMBER ..................................................................................................9 MEASURE PHASE SUMMARY ................................................................................................................................10
DMAIC — ANALYZE PHASE..................................... ...................................................................................................10
DMAIC PROCESS ANALYZE PHASE DELIVERABLES, ACTIONS, AND TOOLS .................................................10 ANALYZE PHASE KEY POINTS TO REMEMBER ...................................................................................................11 ANALYZE PHASE SUMMARY...................................................................................................................................11
DMAIC — IMPROVE PHASE.........................................................................................................................................12
DMAIC PROCESS IMPROVE PHASE DELIVERABLES, ACTIONS, AND TOOLS .................................................12 IMPROVE PHASE KEY POINTS TO REMEMBER ..................................................................................................13IMPROVE PHASE SUMMARY..................................................................................................................................13
DMAIC — CONTROL PHASE..................................... ..................................................................................................13
DMAIC PROCESS CONTROL PHASE DELIVERABLES, ACTIONS, AND TOOLS ................................................14CONTROL PHASE KEY POINTS TO REMEMBER ..................................................................................................14 CONTROL PHASE SUMMARY..................................................................................................................................15
DMAIC — REPLICATE PHASE................................... ..................................................................................................16
DMAIC PROCESS REPLICATE PHASE DELIVERABLES, ACTIONS, AND TOOLS...............................................16 REPLICATE PHASE KEY POINTS TO REMEMBER ................................................................................................17 REPLICATE PHASE SUMMARY................................................................................................................................17
DCOV — DEFINE PHASE .............................................................................................................................................17
DCOV PROCESS DEFINE PHASE DELIVERABLES, ACTIONS, AND TOOLS.......................................................17 DEFINE PHASE KEY POINTS TO REMEMBER .......................................................................................................18 DEFINE PHASE SUMMARY.......................................................................................................................................18
DCOV — CHARACTERIZE PHASE................................ ...............................................................................................19
DCOV PROCESS CHARACTERIZE PHASE DELIVERABLES, ACTIONS, AND TOOLS.........................................19 CHARACTERIZE PHASE KEY POINTS TO REMEMBER.........................................................................................20 CHARACTERIZE PHASE SUMMARY .......................................................................................................................20

Lean Tools 3 of 24 www.leandeployment.com
DCOV PROCESS VERIFY PHASE DELIVERABLES, ACTIONS, AND TOOLS..........................................................23 VERIFY PHASE KEY POINTS TO REMEMBER...........................................................................................................24VERIFY PHASE SUMMARY .........................................................................................................................................24
DCOV — VERIFY PHASE.............................................................................................................................................23
OPTIMIZE PHASE SUMMARY......................................................................................................................................22OPTIMIZE PHASE KEY POINTS TO REMEMBER.......................................................................................................22DCOV PROCESS OPTIMIZE PHASE DELIVERABLES, ACTIONS, AND TOOLS ......................................................21
DCOV — OPTIMIZE PHASE.........................................................................................................................................21

Lean Tools 4 of 24 www.leandeployment.com
Key Concepts
CTS (Criticalto Satisfaction) Characteristics
CTS Tree
All products and processes have key characteristics that are Critical to Satisfaction (CTS) because they have a direct impact on how customers perceive the performance of the product/process. Identifying CTS characteristics begins with listening to the voice of the customer (VOC), but the VOC often is open to interpretation. For example, the customer will almost always describe the symptoms of a problem, rather than identifying the problem itself.
A CTS Tree is used to represent the flow down from vague customer issues to measurable characteristics, and expands in detail as the project progresses and a project team delves deeper into the product and process characteristics that affect customer satisfaction.
Seat Comfort on Seat-Back During Short/Long Drives
Spinal Support Lumbar Support Thoracic Support
CTS Tree
Below you can see the expansion of the CTS tree down to the levels controls (or CTX’s) that can be set by the design or process. It’s at this level that the dimensions, processes and specifications are set that will determine the level of ‘seat comfort’ at the top of the tree.
Seat Comfort in Seat-Back During Short/Long Drives
Spinal Support Lumbar Support Thoracic Support
Seat Back WireConfiguration
(position and shape)
Lumbar Mechanism Location
Cushion Firmness
Foam Thickness
Foam Firmness
Cushion Contour
Trim Tension and Elasticity
Foaming Agent
Chemical B
Chemical A
Carbon Dioxide Pressure
Catalyst Type
Stabilizer Type
Mixing Speed
CTX Tree - Expanded
Data Analysis The strength of 6-Sigma is that decision-making is based on data and factual information. Data iscollected and analyzed so that conclusions can be drawn.
Defect In 6-Sigma, a defect is viewed as any variation in a product, service, or process that fails to meet customer needs and/or process specifications.

Lean Tools 5 of 24 www.leandeployment.com
MeasurementSystem Analysis
While collecting data, the measurement system inevitably introduces some variation. To ensure the validity of data, an assessment is made to determine whether the amount of variation introduced by the measurement system is acceptable compared with the variation introduced by the process that manufactured the part being measured.
Mistake Prevention
Allowing functional failures to occur through mechanisms that can be addressed during the design of a product or the design of its manufacturing process is a mistake. Team members should establish a plan to prevent these types of mistakes.
Optimization All products and processes have key characteristics that can be adjusted to ensure that the product or process functions in a reliable and robust manner. The process of identifying these characteristics and their target levels constitutes optimization .
Process Capability
The expected performance level of a process is quantified by measuring a KPOV as it is produced. The variation in KPOV measurements is compared to the engineering specification for the KPOV. This comparison establishes the capability of the process.
Proces s Control Process control is a method of maintaining stable process performance. Data is collected from the process, analyzed, and action taken if the data analysis indicates deterioration in process performance.
Reliability Reliability is the absence of failure. A reliable product or process functions without failure over its lifetime or some other specified period. Reliability is improved by mistake prevention or robustness improvement.
Replication Replication is the duplication of the improvements gained from a 6-Sigma project in other areas of an organization.
Robustness A design exhibits robustness by functioning efficiently in all reasonable operating conditions.
Scorecard The system performance assessment, or scorecard, is a method of optimizing design performance using a transfer function to investigate the effect of variation in key design characteristics on system performance.
Transfer Function
A transfer function is the representation of the relationship between design characteristics (Xs) for either a product or a process, and the functional output (Y) of the product or process.
Verification Before launching an improved product or process, it is important for the team to verify that it is robust and reliable. Verification is achieved by collecting data on product or process performance and confirming that the performance is to the expected level.
Xs (Key Process Input Variables, orKPIVs)
Xs are lower-level characteristics of a product or process that determine the level of performance of a higher level (Y) characteristic.
Y = f(x) Cascade
A Y = f(x) cascade identifies the relationship between levels of a CTX tree. Y is the higher-level characteristic (output), and X represents the lower-level characteristics (inputs) that influence Y.

Lean Tools 6 of 24 www.leandeployment.com
Ys (Key Process Output Variables, orKPOVs)
Characteristics that represent key outputs from the manufacturing process (and affect high-level CTS characteristics) are called Ys or Key Process Output Variables (KPOVs).
6-SIGMA OVERVIEW
6-Sigma Definition
6-Sigma is a methodology used to improve the design of products and processes. It provides anoverall approach for using existing tools to reduce defects and increase customer satisfaction.
Goals of 6-Sigma
The four main goals of 6-Sigma are: • Defect reduction — reducing defects in processes, products, and services • Yield improvement — fewer scrapped and reworked parts • Better customer satisfaction — providing the ever-higher quality of products that
customers demand • Higher shareholder value — resulting from significant cost savings from 6-Sigma projects
6-Sigma Roles and Responsibilities
Successful implementation of 6-Sigma projects depends on the involvement of people from all levels in a company. 6-Sigma is a team-based process with individual team members having specific roles. Team members include consumers, project team members, green belts, black belts, master black belts, project champions, deployment directors, and executives.
6-Sigma Processes
DMAIC is a systematic methodology for reducing defects in processes. It is an acronym forDefine, Measure, Analyze, Improve, and Control. A sixth step, Replicate, ensures thatimprovements gained from a DMAIC project are replicated elsewhere in the company and thatthe corporate knowledge base is updated. While the DMAIC process can be applied to bothtechnical and business processes, the emphasis in this course is on the processes that manufacture product.
DCOV is a disciplined methodology for designing and manufacturing products that perform at or above the level expected by the customer. It is an acronym for Define, Characterize, Optimize, and Verify.
Reference Guide Process Tables
The following pages present a brief overview of each phase of the DMAIC and DCOV processes.Each phase includes a table that summarizes:
• The engineering deliverables achieved during the phase • The actions taken to achieve those deliverables • The tools used to support the actions
The tables provide a quick reference and organizational tool while moving through the phases of the DMAIC and DCOV processes. In addition, you can use the table to help locate the "actions" pages in the course that reference specific tools. Particular tools are listed with specific actions, but may be used elsewhere in a DMAIC process. Tools usage is determined by the particular circumstances of each DMAIC project. Key points to remember and a summary for each phasefollow each table.
There are many references in the ‘tools’ section of the tables that follow to methods and applications that you may not be familiar with. Please refer to the glossary document contained within the ‘Lean Quality’ section of the site as a brief guide to what these are.

Lean Tools 7 of 24 www.leandeployment.com
DMAIC — DEFINE PHASE
The Define Phase — Purpose
The Define phase of a DMAIC process typically addresses customer satisfaction issues with aproduct. Customers often do not state the exact issue, but rather its symptoms. It is up to the DMAIC project team to define the issue by listening to the customer, identifying critical to satisfaction characteristics, considering how these relate to the process that manufactures the product, and laying out its plans for improvement in a project charter.
The main purpose of the Define phase is to identify the voice of the customer, understand the problem, then produce a brief, qualitative statement defining the defect. Refer to the following Deliverables, Actions, and Tools Table that links the components of the Define phase.
DMAIC Process Define Phase Deliverables, A ctions, and Tools Deliverables Actions Tools
Critical to Satisfaction (C TS) Characteristics. Items that have a direct influence on customer satisfaction.
Identifying CTS Characteristics. Requires a clear understanding of customer expectations gathered by listening to the voice of the customer (VOC).
• CTS tree • Existing quality data • Pareto chart
Process Variables (Ys) that Most Affect CTS. Accurate determination of the relationship between CTS characteristics and Key Process Output Variables (KPOVs, or Ys). This is the foundation for the rest of the DMAIC process.
Identifying CTXs that Most Affect CTS. Review the CTXs and identify those that most influence the CTS. These are the KPOVs (Y)s.
• Pareto chart• CTX tree
Process Map. A graphical description of the sequence of events that make up the process. It is a valuable tool in subsequent phases.
Developing a Process Map. Include all those involved in managing the DMAIC process.
• Process map
Defining the Defect. Develop a problem statement from knowledge gained from the CTX tree and KPOVs (Ys). Estimating the Cost of Poor Quality. Ensure prior to implementing a DMAIC project that the cost of achieving the improvement is not greater than the cost associated with the customer dissatisfaction.
• Existing quality Information/database
Project Charter. A record of what is known and planned regarding the project.
Identifying the Project Scope. Clear boundaries give a project more likelihood of success.
• Process map
DEFINE MEASURE ANALYSE IMPROVE CONTROL REPLICATE

Lean Tools 8 of 24 www.leandeployment.com
Identifying the Project Goal. Project team members' shared vision of what will define success for their project. Finalizing the Project Charter. The document links to business objectives,lists team members, defines resources, and lists interactions with other projectsor initiatives.
• Project charter
Define Phase Key Points to Remember
Voice of the Customer
Defining the problem begins with listening to the voice of the customer (VOC).
CriticalComponents
CTS characteristics are vital to how customers perceive the performance of a product. Therefore, CTS characteristics directly influence customer satisfaction. Lower-level aspects of product performance that influence CTS characteristics include safety, quality, delivery, cost, morale, and environment. Collectively, these are known as CTX characteristics. To identify CTS characteristics, one must have a clear understanding of customer expectations.
Define Phase Summary
Define Phase Summary
In the Define phase of the DMAIC process, the project team distils a high-level problem statement from customer feedback and identifies critical characteristics of product performance that impact the problem. Team members identify the project's scope, determine a specific project goal, and lay out their plans in a project charter. With this groundwork done, they are ready to move on to the Measure phase, where they will gather data related to the problem.
DMAIC — MEASURE PHASE
The Measure Phase — Purpose
After the project team has defined the issue (i.e., the defect), it turns its attention to identifying key causal factors by gathering data for analysis in the Analyze phase. In the Measure phase, the soundness of the measurement system used to collect data is assessed.
The purpose of the Measure phase is to measure the capability of the lower-level characteristics (CTXs) that affect CTS characteristics identified in the Define phase. Refer to the following Deliverables, Actions, and Tools Table that links the components of the Measure phase.
DEFINE MEASURE ANALYSE IMPROVE CONTROL REPLICATE

Lean Tools 9 of 24 www.leandeployment.com
DMAIC Process Measure Phase Deliverables, Actions, and Tools Deliverables Actions Tools
Determining which Xs most affect KPOVs
• Identifying possible Xs • Brainstorming • Fishbone diagram • P-diagram • Cause-and-effect
matrix • Process Failure Mode
and Effects Analysis (PFMEA)
Inputs that affect the KPOVs. The team determines which process parameters (Xs) most affect KPOVs (Ys).
• Identifying which Xs affect a Y • CTX tree An acceptable measurement system. A measurement system consists ofequipment, procedures, and people used to collect data.
Identifying measurement system sources of variation
• Gauge Repeatability and Reproducibility (R&R) Study
Establishing data type – variable or attribute
• Measures of location, variation
Developing a data collection plan
• 5Ws and 1H • Checklists, checksheets, forms, and tables
• Operational definition • Establishing a sampling strategy • Random sampling
• Stratified random sampling
Collecting data Assessing capability of a Y
• Variable data • Measures of location, variation
• Width of variation • Specification limits • Capability indices • z-value tables and
yield
Process capability. The expected level of performance of a process can be quantified by measuring a Y as it is produced, and comparing that measurement to the Y's engineering specification.
• Attribute data • Defects Per Million Opportunities (DPMO) formula
Measure Phase Key Points to Remember
Acceptable MeasurementSystem
No measurement system is perfect. The measurement system inevitably introduces some variation while taking measurements. To ensure the validity of data collected during the DMAIC process, the DMAIC team must determine whether the amount of measurement variation introduced is acceptable by conducting a measurement system analysis study, such as Gauge R&R.

Lean Tools 10 of 24 www.leandeployment.com
Collecting Data To collect process performance data, the DMAIC team puts its measurement system and data collection strategy into effect.
Variable and Attribute Data Types
Attribute data has two types – binary and categorical. Binary attributes are classified according toa yes/no condition. Categorical attributes fall into pre-defined, qualitative groups, such as colour.
Variable data is measured on a continuous scale and includes characteristics such as weight, length, and temperature.
Measure Phase Summary
Measure Phase Summary
In the Measure phase of the DMAIC process, the project team identifies possible causes (process Xs) of the problem issue using tools such as a P-diagram and existing process FMEA. The team narrows its focus to factors most likely to affect CTS characteristics, and performs a Gauge R&R study on its existing measurement system to determine if it is appropriate for the current process.
The team decides which methods to use to collect data and performs an initial data collection, measuring the process capability of its Ys. Potential reasons for a problem should surface during the Measure phase, and need to be quantified in the Analyze phase.
DMAIC — ANALYZE PHASE
The Analyze Phase — Purpose
The project team is ready to analyze the data collected and recorded in the Measure phase to determine the effects on the Ys of manufacturing process CTX characteristics. Specifically, the purpose of the Analyze phase in the DMAIC process is to determine which Xs have a significant influence on each Y.
Refer to the following Deliverables, Actions, and Tools Table that links the components of the Analyze phase.
DMAIC Process Analyze Phase Deliverables, Actions, and Tools Deliverables Actions Tools
Improvement opportunities based on the relationship between Ys and Xs. How performance may be improved by modifying the process design.
Analyzing the relationship between Ys and Xs (Y = f[x]). Identifying the vital few Xs that affect each Y and determining the nature of the variation in X.
DEFINE MEASURE ANALYSE IMPROVE CONTROL REPLICATE
Lean Tools 11 of 24 www.leandeployment.com
• Identifying which Xs affect each Y
• Boxplot • Histogram • Run chart • Scatter plot • Multi-vari chart • Process map • Comparative analysis
• Identifying the 'vital few' Xs that affect each Y
• Hypothesis testing/ANOVA
• Regression and correlation
• Determining the nature of the variation in Xs
• Control chart
Level of confidence in conclusions. The statistical confidence the team has in conclusions drawn from its data analysis.
Establishing statistical confidence.Performance improvement predictions made based on data analysis.
• Sample size formulas
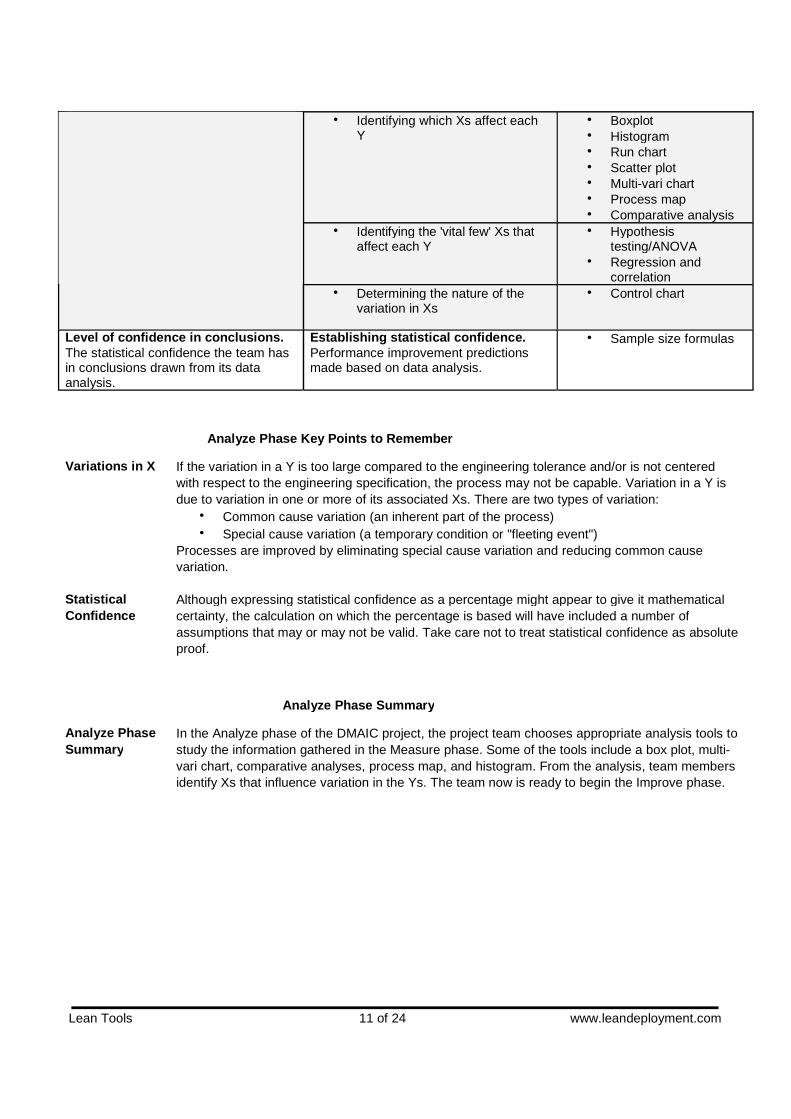
Analyze Phase Key Points to Remember
Variations in X If the variation in a Y is too large compared to the engineering tolerance and/or is not centered with respect to the engineering specification, the process may not be capable. Variation in a Y is due to variation in one or more of its associated Xs. There are two types of variation:
• Common cause variation (an inherent part of the process) • Special cause variation (a temporary condition or "fleeting event")
Processes are improved by eliminating special cause variation and reducing common cause variation.
StatisticalConfidence
Although expressing statistical confidence as a percentage might appear to give it mathematical certainty, the calculation on which the percentage is based will have included a number of assumptions that may or may not be valid. Take care not to treat statistical confidence as absolute proof.
Analyze Phase Summary
Analyze Phase Summary
In the Analyze phase of the DMAIC project, the project team chooses appropriate analysis tools to study the information gathered in the Measure phase. Some of the tools include a box plot, multi- vari chart, comparative analyses, process map, and histogram. From the analysis, team members identify Xs that influence variation in the Ys. The team now is ready to begin the Improve phase.

Lean Tools 12 of 24 www.leandeployment.com
DMAIC — IMPROVE PHASE
The Improve Phase — Purpose
The project team has analyzed the data identified and collected from previous phases and is ready to identify and implement improvements to achieve maximum benefit to a CTS characteristic.
Specifically, the purpose of the Improve phase is to optimize the process. Refer to the following Deliverables, Actions, and Tools Table that links the components of the Improve phase.
DMAIC Process Improve Phase Deliverables, Actions, and Tools Deliverables Actions Tools
Determining optimal Y = f(x) solution.Ys are considered optimized when the CTS characteristics to which they relate are improved such that a corresponding increased level of customer satisfaction is achieved that meets the goals of the DMAIC project.
• Identifying improvement alternatives
Designed Experiments • Single factor • Fractional factorial • Full factorial
Experimental Analysis Techniques and Tools
• Hypothesis testing • Effects plot • Normal plot
Optimal solution for improving the process. Project team identifies how best to make improvements.
• Evaluating alternatives • Decision-making matrix • Cost-benefit analysis • Future state "should
be" process map • FMEAs
Plan to verify and implement the solution. This plan guides the project team when it implements the solution.
Creating a work plan. The work plan details the plan to verify and implement the optimal solution.
• Work plan
Implementation of the solution. Project team follows its work plan to implement and verify the improvement.
Implementing the improvement. The optimal solution is implemented.
Proof that the solution works. Improvement should show an increase in customer satisfaction in the CTS characteristics addressed by the project.
Verifying the solution. Verification can be achieved by measuring the process capability of the Ys and/or Xs.
• Process capability
DEFINE MEASURE ANALYSE IMPROVE CONTROL REPLICATE

Lean Tools 13 of 24 www.leandeployment.com
Improve Phase Key Points to Remember
Design of Experiment
Design of Experiment (DOE) is an efficient way to determine an optimal combination of Xs. Key DOE terms are as follows:
• Factor (a parameter or X variable that is varied in the experiment) • Level (a setting or magnitude of the factor in the experiment) • Response (the output, or Y variable, that is measured in the experiment) • Run (one in a series of tests)
Evaluate Alternatives
Most DMAIC teams will identify a number of alternative process improvement options. Each option must be evaluated and the best one selected.
Creating Work Plans
When creating a work plan to verify and implement the optimal solution, it is important to be detailed and thorough. Any risks associated with the improvement's not being fully and correctly implemented should be assessed, and appropriate actions taken to reduce them.
Verifying the Solution
CTS issues often arise after a product has been in the field for some time; therefore, it is not immediately possible to measure the direct effects of an improvement on a CTS characteristic. However, CTS characteristics are cascaded down to Ys early in the DMAIC process. The improvement, therefore, can be verified by measuring the process capability of the Ys. In addition to measuring the capability of Ys, the capability of Xs that relate to a Y can be assessed.
Improve Phase Summary
Improve Phase – Summary
The project team conducts experiments to investigate the effects of Xs on a Y. From the results, the team identifies alternative improvement opportunities. The optimal improvement is identified, implemented, and data collected to confirm its effectiveness. The project team now begins the Control phase, where it can establish a system to control and monitor its recently enacted improvement.
DMAIC — CONTROL PHASE
Control Pha se – Purpose
After the project team implements a method to improve a CTS characteristic, it must develop a way to control Xs, institutionalize improvements, and monitor ongoing performance. Refer to the following Deliverables, Actions, and Tools Table that links the components of the Control phase.
DEFINE MEASURE ANALYSE IMPROVE CONTROL REPLICATE

Lean Tools 14 of 24 www.leandeployment.com
DMAIC Process Control Phase Deliverables, Actions, and Tools Deliverables Actions Tools
Developing and implementing a control plan. The characteristic to be controlled has to be identified and the method of control chosen. Each X and Y should be reviewed. Where there is a risk of a defect, a control action should be introduced to either prevent or detect the defect.
• Establishing control strategy for Xs and Ys
• Identifying an appropriate control method
• Inspection • Error proofing • Control charts • Set-up
• Developing a reaction plan • Reaction plan
Control plan. Provides details about how a manufacturing process is monitored and controlled.
• Implementing the control plan • Training plans • Standard operating
procedures Establishing ongoing process control for Xs and/or Ys. Establishing and implementing the control plan and maintaining the level of controldocumented in the plan.
• Maintaining process stability • Control charts
Ongoing process control. Helps to maintain the improved performance level by indicating when process performance shows signs of deteriorating.
• Monitoring process capability • Long-term process capability study
Sustaining improvements
• Planning to assess process performance at future dates.
Sustained improvements. Take actions to ensure that the improvements are sustained in the long term.
• Verifying that the control plan is being followed.
Control Phase Key Points to Remember
Control Plan Development
Before establishing a control plan, the team must update the process map, which was first developed in the Define phase to reflect changes implemented during the Improve phase. The process map helps to highlight the steps that need to be monitored and controlled.

Lean Tools 15 of 24 www.leandeployment.com
Control Plan Adherence
As part of checking that the control plan is being followed, team members should ensure that:
• Any error-proofing systems are still in place and working effectively • Ys and/or Xs are still being controlled by the method documented in the control plan • The sample size and sampling frequency documented in the control plan is being followed • Control charts are being plotted and analyzed • The reaction plan is followed where special cause variation occurs
DefectDetention and Prevention
Defect detection and defect prevention are two fundamental strategic approaches to process control.
• Defect detection identifies defects before product is shipped to the customer so remedial action can be taken.
• Defect prevention, the more cost-effective and efficient strategy, eliminates the opportunity for defects to occur.
Establishing Control Strategy
Process control through monitoring Xs can only be effective if the relationship between the Xs andY is understood. Understanding is gained in the Measure, Analyze, and Improve phases of DMAIC. This illustrates the power of the DMAIC approach, where knowledge and understanding gained in one phase is used to enhance the approach taken in subsequent phases.
Maintaining process stability through the use of control charts includes sampling the process at the rate specified in the control plan and ensuring that control charts are plotted and analyzed. The level of control also should be reviewed periodically to see if it is still relevant. Process capability should be assessed using control chart data to ensure the control plan effectiveness.
Control Phase Summary
Control Phase – Summary
In the Control phase of the DMAIC process, the project team develops a method or process for controlling and monitoring the improvements it created and enacted in previous phases, such as the use of error-proofing, control charts, and set-up control. The team develops a plan for ongoing process control to maintain the integrity of the process improvement.
To maintain the level of improvement, the team sets future dates to assess the process control and verify that the control plan is followed.
You’ve done a great job to get to this stage and you’ve made mistakes along the way. But, now you must cascade that learning to other parts of the system that has identical or similar processes. To do this the project team must establish a method to Replicate the improvements it established and update the company knowledge base.

Lean Tools 16 of 24 www.leandeployment.com
DMAIC — REPLICATE PHASE
Replicate Phase – Purpose
The final task for the DMAIC project team is to bring knowledge of the improvements it has achieved to the attention of other areas of the company that might benefit from this knowledge. Specifically, the purpose of the Replicate phase is to replicate improvement and update the corporate knowledge base. Refer to the following Deliverables, Actions, and Tools Table that links the components of the Replicate phase.
DMAIC Process Replicate Phase Deliverables, Actions , and Tools Deliverables Actions Tools
Updated knowledge base. All individuals and/or organizations responsible for the management of the systems, policies, methods, specifications, and/or procedures relating to the DMAIC project findings should be notified so that all relevant documents are updated.
Updating knowledge base by updating documentation. Documentation should be updated to keep the knowledge base current.
• Failure Mode and Effects Analysis (FMEA)
Summarizing key actions taken as a result of the DMAIC project. The summary should include changes made to the process, reasons why the changes were made, and the results achieved by making the changes. Identifying areas that would benefitfrom improvements. This helps ensure that maximum benefit is gained from the work put into the DMAIC project. All areas that potentially can benefit from the knowledge gained from a DMAIC project should be listed.
Institutionalized and communicated improvements. Existing company processes that are the same as, or similar to, the one improved in a DMAICproject must be reviewed so they can benefit from the knowledge gained.
Communicating the improvements toidentified areas. Communication should include a summary of findings, supporting documentation (e.g., capability analyses, experiment results), and team contact information.
DEFINE MEASURE ANALYSE IMPROVE CONTROL REPLICATE

Lean Tools 17 of 24 www.leandeployment.com
Replicate Phase Key Points to Remember
Communicating Improvements
The method for communicating information about the improvement should be standardized, such as sending e-mail messages to potentially affected areas, or using an electronic subscription service to enable others across the company to automatically receive information about projectsrelevant to their areas.
Replicate Phase Summary
Replicate Phase – Summary
The project team completes its DMAIC project. It begins the Replicate phase by updating the corporate knowledge base to reflect what it has learned during its project. It uses documentation tools such as the FMEA and design specifications.
The team then ensures that its findings are institutionalized by communicating to other areas of the company that use similar processes.
DCOV — DEFINE PHASE
Define Phase – Purpose
The purpose of the Define phase is to synthesize customer needs and wants and product/process history into objective Critical to Satisfaction (CTS) characteristics. This helps to define customer expectations, making it easier to design, develop, and deliver products customers will purchase.
DCOV Process Define Phase Deliverables, Actions, an d Tools Deliverables Actions Tools
Gaining consumer insight. Interpreting consumers' preconceptions and feelings about products to gain an understanding of their motivational core.
• Introspection • Observation • Interview • Ethnography/immersion
Conducting market research and brand analysis. Sampling market opinions, establishing brand touchpoints, and benchmarking competitive offerings.
• Sampling market opinions • Survey • Focus group • Customer clinic
Critical to Satisfaction Characteristics (CTS). Key characteristics of product or process performance important to customer satisfaction.
• Establishing brand touchpoints through brand analysis
• Consumer targeting
DEFINE CHARACTERISE OPTIMISE VERIFY

Lean Tools 18 of 24 www.leandeployment.com
• Benchmarking competitive offerings
• Publication survey • Comparison testing • Teardowns
Understanding how customers use products
• Real World Usage
Reviewing quality history
• Interpreting qualitative data • Qualitysystems/surveys
• Media ratings • Interpreting in-house sources of
quality information • Warranty • Customer Returns
• Reviewing process quality history • CTS Tree • SPC • DMAIC projects• Process capability • Process map • In-factory repairs
Customer connected targets and specifications for CTS characteristics. Developed for CTS characteristics so a product can bedesigned to meet the CTSrequirements.
• Integrating customer needs and wants into product targets
• Kano model • Quality Function
Deployment (QFD) • Loss function • CTS scorecard
Project charter. Communicates the team's intent to stakeholders, clarifies roles, and contracts commitments by the team.
Developing a project charter. Should include a statement of the opportunity to be addressed, the business case for conducting the project, the project scope and goals, a project work plan, team membership, and a summary of the technical input from previous related efforts.
• Project charter
Define Phase Key Points to Remember
CTS Characteristicsand Customer Connected Targets
Customers judge the performance of a product or process by its ability to achieve critical to satisfaction (CTS) characteristics. A customer connected target is required for each CTS if a product or process is to be designed to meet the CTS characteristics.
Kano Model The Kano Model identifies the overall engineering direction for a DCOV project. A model with a predominance of basic quality relies more heavily on a product design that does not exhibit thefailures of previous similar designs. A model that has predominance of high achievement performance and excitement characteristics requires the engineering of enhanced product design,perhaps using a new design concept.
Define Phase Summary
Define Phase – Summary
The DCOV project team synthesizes customer needs and wants and product/process history into objective CTS characteristics with customer connected targets. The team then summarizes the CTS characteristics and their targets in a CTS tree and works to integrate them into product
Lean Tools 19 of 24 www.leandeployment.com
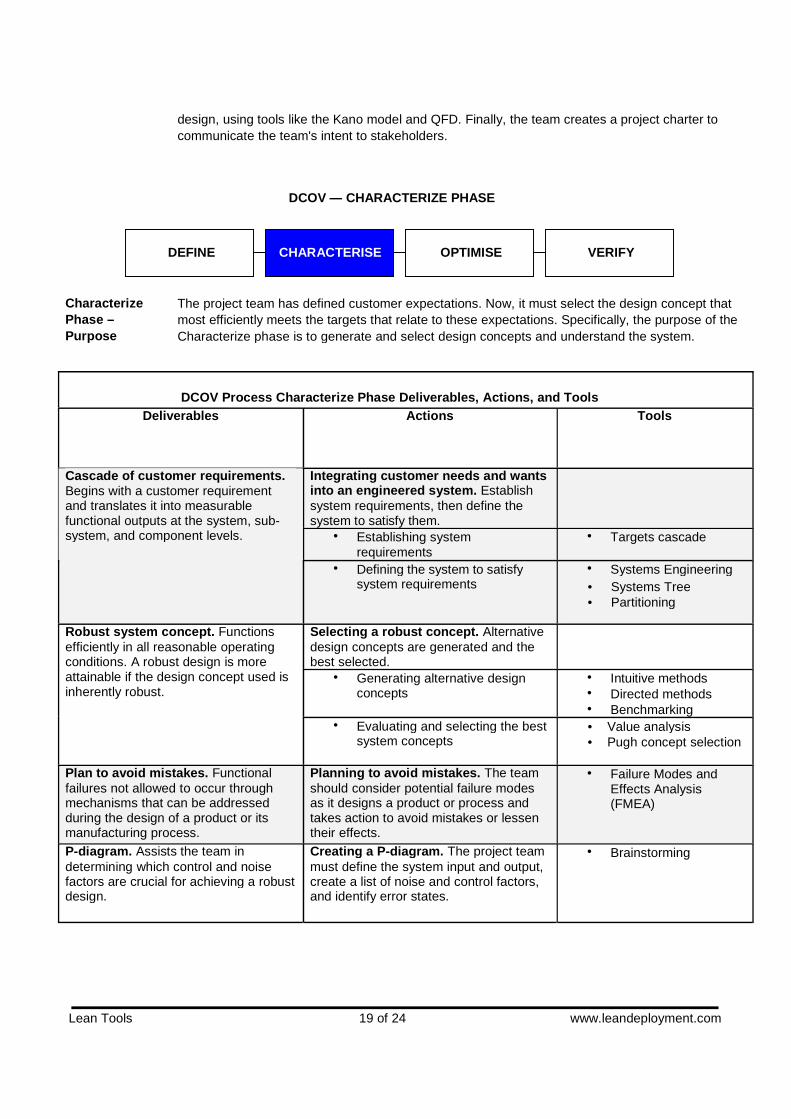
design, using tools like the Kano model and QFD. Finally, the team creates a project charter to communicate the team's intent to stakeholders.
DCOV — CHARACTERIZE PHASE
CharacterizePhase – Purpose
The project team has defined customer expectations. Now, it must select the design concept that most efficiently meets the targets that relate to these expectations. Specifically, the purpose of the Characterize phase is to generate and select design concepts and understand the system.
DCOV Process Characterize Phase Deliverables, Actio ns, and Tools Deliverables Actions Tools
Integrating customer needs and wantsinto an engineered system. Establish system requirements, then define the system to satisfy them.
• Establishing system requirements
• Targets cascade
Cascade of customer requirements. Begins with a customer requirement and translates it into measurable functional outputs at the system, sub- system, and component levels.
• Defining the system to satisfy system requirements
• Systems Engineering • Systems Tree • Partitioning
Selecting a robust concept. Alternative design concepts are generated and the best selected.
• Generating alternative design concepts
• Intuitive methods• Directed methods • Benchmarking
Robust system concept. Functions efficiently in all reasonable operating conditions. A robust design is more attainable if the design concept used isinherently robust.
• Evaluating and selecting the best system concepts
• Value analysis • Pugh concept selection
Plan to avoid mistakes. Functional failures not allowed to occur through mechanisms that can be addressed during the design of a product or its manufacturing process.
Planning to avoid mistakes. The team should consider potential failure modes as it designs a product or process and takes action to avoid mistakes or lessen their effects.
• Failure Modes and Effects Analysis (FMEA)
P-diagram. Assists the team in determining which control and noise factors are crucial for achieving a robust design.
Creating a P -diagram. The project team must define the system input and output, create a list of noise and control factors, and identify error states.
• Brainstorming
DEFINE CHARACTERISE OPTIMISE VERIFY

Lean Tools 20 of 24 www.leandeployment.com
Initial noise factor management strategy. Helps improve product and process performance by anticipating and eliminating system failures due to noise factors.
Establishing the initial noise factormanagement strategy. The strategy to improve robustness is selected from the five noise factor management strategies.
• Reliability and Robustness Checklist (RRCL)
Part/process CTX characteristic (Xs). CTX cascade extended to include further levels of detail for product and manufacturing process characteristics.
Characterizing product and process.This is accomplished by understanding how the constituent parts of a system work together to produce a system output that meets the customer-driven requirements identified in the DCOV Define phase.
• Boundary diagram • Interface matrix • Functional flow
diagram • CTX tree
System transfer function (Y = f/[x]). Models the relationship between a system output and the system input variables, and describes how design characteristics and process parameters identified in the CTX cascade relate to the system’s functional output.
Developing a transfer func tion. There are two fundamental ways to develop a transfer function; deductively, from first principles, and inductively, from data relating to product or process performance.
• Deductive methods • Inductive methods
Characterize Phase Key Points to Remember
Cascade of Customer Requirements
The key driver in product design is the customer’s perception of the product. The cascade of customer requirements helps to ensure that product performance meets customer expectations.
Establishing the Initial Noise Factor Management Strategy
There are five noise factor management strategies to improve the robustness of a design. Team members must use one or more of these strategies to help achieve a robust design:
• Change the design concept• Make basic current design insensitive to the noises • Reduce or remove the noise factor(s)• Insert a compensation device • Send the error state/noise somewhere else where it will do less harm (disguise the effect)
System Transfer Function
The transfer function describes how design characteristics and process parameters identified in the CTX cascade relate to the system’s functional output. A transfer function can be a mathematical model (continuous) or a Computer-aided Engineering (CAE) model (discrete), and is represented by the general expression Y=f(x).
Characterize Phase Summary
CharacterizePhase – Summary
The project team generates and selects design concepts for the DCOV project. During the Characterize phase, it creates a cascade of customer requirements and a robust system concept. Itplans to avoid mistakes by using FMEA and develops a P-diagram to help select an initial noise factor management strategy. The team develops a system transfer function Y = f(x). The team now moves to the Optimize phase.

Lean Tools 21 of 24 www.leandeployment.com
DCOV — OPTIMIZE PHASE
Optimize Phase – Purpose
The DCOV team begins to design for robust performance and producibility. It must validate its transfer function, confirm its noise factor management strategy, create a scorecard, determine the optimal values for Xs, and develop a verification plan.
DCOV Process Optimize Phase Deliverables, Actions, and Tools Deliverables Actions Tools
Validated transfer function. Validation for either a product or process that the transfer function is a good model of the relationship between CTQ characteristics (Xs) and the functional output (Y) that the Xs determine.
Validating the transfer function. Acceptable predictive capability of the transfer function.
• Analytic modeling • Prototype or surrogate
correlation
Noise factor management strategy. The chosen strategy to minimize or eliminate the effect of noise factors on product/process performance.
Making the design insensitive to noise. Use of one or more of the five noise factor management strategies.
• Change technology • Make design
insensitive to noise • Reduce or remove
noise• Insert compensation
device • Send error state where
it will do less harm Determining optimal design. A two-step optimization process to:
1. Reduce variability 2. Achieve targets
• Determining optimal design by performing 2-step optimization
• Single and multiple response optimization
• Design of Experiment • Parameter Design • Analytical Reliability
and Robustness (AR&R)
• Measuring and establishing optimal tolerances
• Dimensional variation analysis
• Statistical tolerancing • Tolerance design
Optimal nominal values for CTQ Xs (product or process). The values of CTQ characteristics that correspond to system performance being on target and having minimum variation about this target.
Designing for producibility and optimizing the process. Complementary product and process achieved by designing for producibility.
• Design of Experiment • Lean manufacturing • Parameter Design
DEFINE CHARACTERISE OPTIMISE VERIFY

Lean Tools 22 of 24 www.leandeployment.com
System performance assessment (scorecard). Used to optimize design performance using a transfer function to investigate the effect of variation in key design characteristics on system performance.
Confirming the contributing factors for variation. Enables the CTQ characteristics with the most effect on overall variation in Y to be identified.
• Scorecard template
Developing a verification plan.
• Confirming noise factor management strategies
• Reliability and robustness checklist (RRCL)
• Design verification plan (DVP)
• Failure Mode and Effects Analysis (FMEA)
Verification plan. States the tests used to verify that the product is reliable and robust.
• Establishing testing procedure • Bogey tests • Tests to failure • Degradation tests
Optimize Phase Key Points to Remember
Measuring and Establishing OptimalTolerances
When manufacturing components, some variation is inevitable. The variation in individual components accumulates when these components are assembled to form a sub-system or system resulting in a variation in a system's functional output.
The project team must determine the threshold level of variation that, if exceeded, gives rise to customer dissatisfaction.
Confirm Noise Factor Management Strategies
During the Optimize phase, the product is designed to be reliable and robust by minimizing the effect of critical noise factors using particular noise management strategies. Later, when product robustness and reliability is confirmed in the Verify phase, it is important that confirmation testingincludes the effects of these noise factors. Testing is then able to confirm that the adopted noise factor management strategy works.
In the Optimize phase, the DCOV team should consider the types of confirmation testing to be conducted in the Verify phase and develop a testing plan.
Optimize Phase Summary
Optimize Phase – Summary
The project team designs the product to be reliable and robust by minimizing the effect of critical noise factors. The project team:
• Validates the transfer function by comparing predictions to measured data • Identifies a NFMS for mitigating the effects of critical noises • Uses an analytical reliability and robustness approach to simplify its transfer function • Identifies appropriate tolerances • Conducts experiments to optimize the system • Creates a design and manufacturing scorecard to establish contributions of various Xs to Y • Develops a design verification plan that included tests to verify the absence of important
failure modes
Lean Tools 23 of 24 www.leandeployment.com
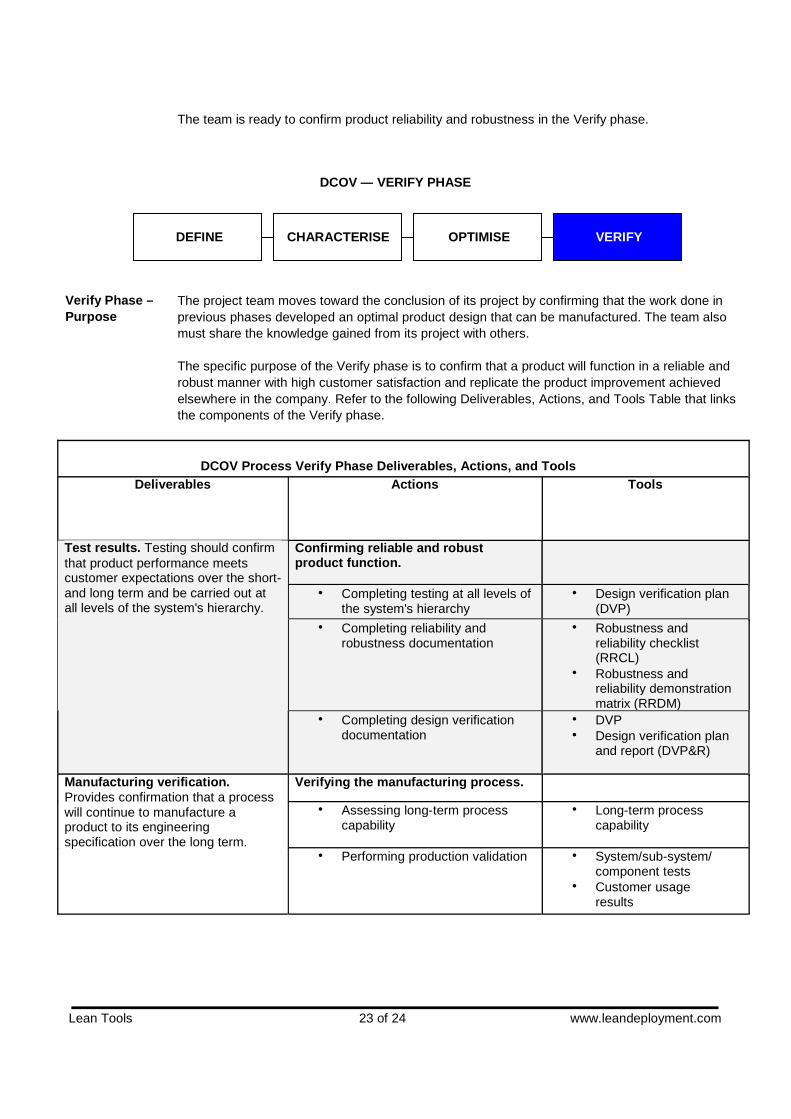
The team is ready to confirm product reliability and robustness in the Verify phase.
DCOV — VERIFY PHASE
Verify Phase – Purpose
The project team moves toward the conclusion of its project by confirming that the work done in previous phases developed an optimal product design that can be manufactured. The team also must share the knowledge gained from its project with others.
The specific purpose of the Verify phase is to confirm that a product will function in a reliable and robust manner with high customer satisfaction and replicate the product improvement achieved elsewhere in the company. Refer to the following Deliverables, Actions, and Tools Table that linksthe components of the Verify phase.
DCOV Process Verify Phase Deliverables, Actions, an d Tools Deliverables Actions Tools
Confirming reliable and robust product function.
• Completing testing at all levels of the system's hierarchy
• Design verification plan (DVP)
• Completing reliability and robustness documentation
• Robustness and reliability checklist (RRCL)
• Robustness and reliability demonstration matrix (RRDM)
Test results. Testing should confirm that product performance meets customer expectations over the short- and long term and be carried out at all levels of the system's hierarchy.
• Completing design verification documentation
• DVP • Design verification plan
and report (DVP&R)
Verifying the manufacturing process.
• Assessing long-term process capability
• Long-term process capability
Manufacturing verification. Provides confirmation that a process will continue to manufacture aproduct to its engineering specification over the long term.
• Performing production validation • System/sub-system/ component tests
• Customer usage results
DEFINE CHARACTERISE OPTIMISE VERIFY

Lean Tools 24 of 24 www.leandeployment.com
Verify Phase Key Points to Remember
Updated knowledge base. Knowledge gained from a DCOV project impacts existing policies, methods, and specifications.
Updating the knowledge base by updating documentation. Keeps the existing knowledge base current with DCOV project findings.
• Failure Mode and Effects Analysis (FMEA)
Institutionalizing and communicating improvements.
• Summarizing key results of the DCOV project
• Identifying areas that would benefit from the knowledge gained
Institutionalized and communicated improvements. Knowledge is assimilated into existing company practices and procedures, and project findings are conveyed throughout the company so others can benefit.
• Communicating the improvements to identified areas
Testing at All Levels
When testing a component it should be subjected to the stresses it will experience as part of a sub- system in the vehicle. The component is then assembled into a sub-system, which is subjected to the stresses it will experience in the system. The process is repeated with the sub-system assembled into a system, and finally with everything assembled into the vehicle. Testing begins at the component level as soon as prototype parts are available.
Analytical Testing
Analytical models increasingly are being used as the basis of verification testing because of the time and cost of hardware-based verification testing. A transfer function is an ideal model that can be used as the basis of analytical testing.
Reliability and Robustness Documentation
Reliability and robustness documentation, including P-diagrams, a reliability and robustness checklist, design verification plan, design verification methods, and a reliability and robustness demonstration matrix are used in concert.
Long -term Process Capability
Some sources of variation occur over the long term, and it is important that they are included in a long-term process capability study. Data does not have to be collected over an extended period if the effect of long-term variation can be simulated over a shorter time.
Design Verifica tion vs. Production Validation
While design verification normally is conducted on prototype product or by using analytical models, production validation is carried out on manufactured parts. Design verification testing is conducted earlier in a vehicle program than the equivalent production validation testing. Testing for both begins at the component level as soon as parts are available
Verify Phase Summary
Verify Phase – Summary
In the final phase of the DCOV process, the project team confirms that work done in other phases has been worthwhile and that an optimal, reliable, and robust product design has been developed.The corporate knowledge base is updated and the findings of the project communicated to all areasthat might benefit from the knowledge and understanding gained.