6. POTENTIAL FOR HUMAN EXPOSURE - Agency for Toxic ... · 6. POTENTIAL FOR HUMAN EXPOSURE ... The...
53
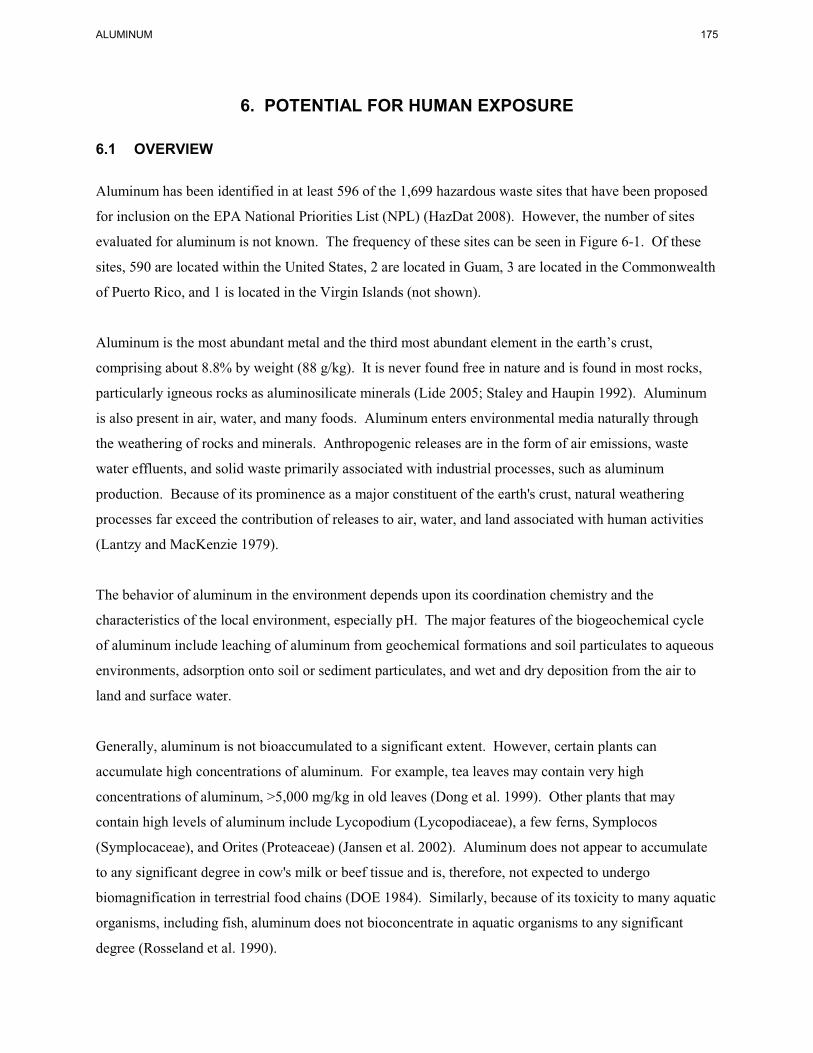
ALUMINUM 175 6. POTENTIAL FOR HUMAN EXPOSURE 6.1 OVERVIEW Aluminum has been identified in at least 596 of the 1,699 hazardous waste sites that have been proposed for inclusion on the EPA National Priorities List (NPL) (HazDat 2008). However, the number of sites evaluated for aluminum is not known. The frequency of these sites can be seen in Figure 6-1. Of these sites, 590 are located within the United States, 2 are located in Guam, 3 are located in the Commonwealth of Puerto Rico, and 1 is located in the Virgin Islands (not shown). Aluminum is the most abundant metal and the third most abundant element in the earth’s crust, comprising about 8.8% by weight (88 g/kg). It is never found free in nature and is found in most rocks, particularly igneous rocks as aluminosilicate minerals (Lide 2005; Staley and Haupin 1992). Aluminum is also present in air, water, and many foods. Aluminum enters environmental media naturally through the weathering of rocks and minerals. Anthropogenic releases are in the form of air emissions, waste water effluents, and solid waste primarily associated with industrial processes, such as aluminum production. Because of its prominence as a major constituent of the earth's crust, natural weathering processes far exceed the contribution of releases to air, water, and land associated with human activities (Lantzy and MacKenzie 1979). The behavior of aluminum in the environment depends upon its coordination chemistry and the characteristics of the local environment, especially pH. The major features of the biogeochemical cycle of aluminum include leaching of aluminum from geochemical formations and soil particulates to aqueous environments, adsorption onto soil or sediment particulates, and wet and dry deposition from the air to land and surface water. Generally, aluminum is not bioaccumulated to a significant extent. However, certain plants can accumulate high concentrations of aluminum. For example, tea leaves may contain very high concentrations of aluminum, >5,000 mg/kg in old leaves (Dong et al. 1999). Other plants that may contain high levels of aluminum include Lycopodium (Lycopodiaceae), a few ferns, Symplocos (Symplocaceae), and Orites (Proteaceae) (Jansen et al. 2002). Aluminum does not appear to accumulate to any significant degree in cow's milk or beef tissue and is, therefore, not expected to undergo biomagnification in terrestrial food chains (DOE 1984). Similarly, because of its toxicity to many aquatic organisms, including fish, aluminum does not bioconcentrate in aquatic organisms to any significant degree (Rosseland et al. 1990).
Transcript of 6. POTENTIAL FOR HUMAN EXPOSURE - Agency for Toxic ... · 6. POTENTIAL FOR HUMAN EXPOSURE ... The...
ALUMINUM 175
6 POTENTIAL FOR HUMAN EXPOSURE
61 OVERVIEW
Aluminum has been identified in at least 596 of the 1699 hazardous waste sites that have been proposed
for inclusion on the EPA National Priorities List (NPL) (HazDat 2008) However the number of sites
evaluated for aluminum is not known The frequency of these sites can be seen in Figure 6-1 Of these
sites 590 are located within the United States 2 are located in Guam 3 are located in the Commonwealth
of Puerto Rico and 1 is located in the Virgin Islands (not shown)
Aluminum is the most abundant metal and the third most abundant element in the earthrsquos crust
comprising about 88 by weight (88 gkg) It is never found free in nature and is found in most rocks
particularly igneous rocks as aluminosilicate minerals (Lide 2005 Staley and Haupin 1992) Aluminum
is also present in air water and many foods Aluminum enters environmental media naturally through
the weathering of rocks and minerals Anthropogenic releases are in the form of air emissions waste
water effluents and solid waste primarily associated with industrial processes such as aluminum
production Because of its prominence as a major constituent of the earths crust natural weathering
processes far exceed the contribution of releases to air water and land associated with human activities
(Lantzy and MacKenzie 1979)
The behavior of aluminum in the environment depends upon its coordination chemistry and the
characteristics of the local environment especially pH The major features of the biogeochemical cycle
of aluminum include leaching of aluminum from geochemical formations and soil particulates to aqueous
environments adsorption onto soil or sediment particulates and wet and dry deposition from the air to
land and surface water
Generally aluminum is not bioaccumulated to a significant extent However certain plants can
accumulate high concentrations of aluminum For example tea leaves may contain very high
concentrations of aluminum gt5000 mgkg in old leaves (Dong et al 1999) Other plants that may
contain high levels of aluminum include Lycopodium (Lycopodiaceae) a few ferns Symplocos
(Symplocaceae) and Orites (Proteaceae) (Jansen et al 2002) Aluminum does not appear to accumulate
to any significant degree in cows milk or beef tissue and is therefore not expected to undergo
biomagnification in terrestrial food chains (DOE 1984) Similarly because of its toxicity to many aquatic
organisms including fish aluminum does not bioconcentrate in aquatic organisms to any significant
degree (Rosseland et al 1990)
ALUMINUM 177
6 POTENTIAL FOR HUMAN EXPOSURE
Background concentrations of aluminum in rural air typically range from 0005 to 018 Igm3 (Hoffman
et al 1969 Poumltzl 1970 Sorenson et al 1974) whereas concentrations in urban and industrial areas can be
considerably higher ranging from 04 to 80 Igm3 (Cooper et al 1979 Dzubay 1980 Kowalczyk et al
1982 Lewis and Macias 1980 Moyers et al 1977 Ondov et al 1982 Pillay and Thomas 1971 Sorenson
et al 1974 Stevens et al 1978) Concentrations of aluminum are highly variable in drinking water
ranging from lt0001 to 1029 mgL (Schenk et al 1989) The use of alum (aluminum sulfate) as a
flocculent in water treatment facilities typically leads to high aluminum concentrations in finished waters
(DOI 1970 Letterman and Driscoll 1988 Miller et al 1984a) In a survey of 186 community water
systems the median aluminum concentration in finished water receiving coagulation treatment using
alum was 0112 mgL compared to 0043 mgL in finished water that received no coagulation treatment
(Miller et al 1984a) Dissolved aluminum concentrations in surface and groundwater vary with pH and
the humic acid content of the water High aluminum concentrations in natural water occur only when the
pH is lt5 therefore concentrations in most surface water are very low
Since aluminum is ubiquitous in the environment the general population will be exposed to aluminum by
the inhalation of ambient air and the ingestion of food and water The consumption of foods containing
aluminum-containing food additives are a major sources of aluminum in the diet (Saiyed and Yokel 2005
Soni et al 2001) The use of other consumer items such as antiperspirants cosmetics internal analgesics
(buffered aspirins) anti-ulcerative medications antidiarrheals and antacids that also contain aluminum
compounds will result in exposure to aluminum The intake of aluminum from food and drinking water is
low especially compared with that consumed by people taking aluminum-containing medicinal
preparations Daily intakes of aluminum from food range from 34 to 9 mgday (Biego et al 1998 MAFF
1999 Pennington and Schoen 1995) whereas aluminum-containing medications contain much higher
levels of aluminum for example 104ndash208 mg of aluminum per tabletcapsule5 mL dose for many
antacids (Zhou and Yokel 2005) While aluminum is naturally present in food and water the greatest
contribution to aluminum in food and water by far is the aluminum-containing additives used in water
treatment and processing certain types of food such as grain-based products and processed cheese
Aluminum has no known physiological role in the human body (Nayak 2002)
The aluminum content of human breast milk generally ranged from 92 to 49 IgL (Fernandez-Lorenzo et
al 1999 Hawkins et al 1994 Koo et al 1988 Simmer et al 1990 Weintraub et al 1986) Soy-based
infant formulas contain higher concentrations of aluminum as compared to milk-based infant formulas or
breast milk Recent reports provide average aluminum concentrations of 460ndash930 IgL for soy-based
ALUMINUM 178
6 POTENTIAL FOR HUMAN EXPOSURE
infant formulas and 58ndash150 IgL for milk-based formulas (Fernandez-Lorenzo et al 1999 Ikem et al
2002 Navarro-Blasco and Alvarez-Galindo 2003)
Occupational exposures to aluminum occur during the mining and processing of aluminum ore into metal
recovery of scrap metal production and use of aluminum compounds and products containing these
compounds and in aluminum welding Individuals living in the vicinity of industrial emission sources
and hazardous waste sites individuals with chronic kidney failure requiring long-term dialysis or
treatment with phosphate binders patients requiring intravenous fluids infants especially premature
infants fed soy-based formula containing high levels of aluminum and individuals consuming large
quantities of antacids anti-ulcerative medications antidiarrheal medications may also be exposed to high
levels of aluminum
According to the Toxic Chemical Release Inventory in 2005 total releases of aluminum (fume or dust) to
the environment (including air water and soil) from 329 large processing facilities were
456 million pounds (~207x104 metric tons) (TRI05 2007) In addition in 2005 total releases of
aluminum oxide (fibrous forms) to the environment (including air water and soil) from 59 large
processing facilities were 259 million pounds (~1180 metric tons) (TRI05 2007) Tables 6-1 and 6-2 list
amounts released from these facilities grouped by state The TRI data should be used with caution
because only certain types of facilities are required to report (EPA 2005) This is not an exhaustive list
62 RELEASES TO THE ENVIRONMENT
The Toxics Release Inventory (TRI) data should be used with caution because only certain types of
facilities are required to report (EPA 2005) This is not an exhaustive list Manufacturing and processing
facilities are required to report information to the TRI only if they employ 10 or more full-time
employees if their facility is included in Standard Industrial Classification (SIC) Codes 10 (except 1011
1081 and 1094) 12 (except 1241) 20ndash39 4911 (limited to facilities that combust coal andor oil for the
purpose of generating electricity for distribution in commerce) 4931 (limited to facilities that combust
coal andor oil for the purpose of generating electricity for distribution in commerce) 4939 (limited to
facilities that combust coal andor oil for the purpose of generating electricity for distribution in
commerce) 4953 (limited to facilities regulated under RCRA Subtitle C 42 USC section 6921 et seq)
5169 5171 and 7389 (limited SC section 6921 et seq) 5169 5171 and 7389 (limited to facilities
primarily engaged in solvents recovery services on a contract or fee basis) and if their facility produces
ALUMINUM 179
6 POTENTIAL FOR HUMAN EXPOSURE
Table 6-1 Releases to the Environment from Facilities that Produce Process or Use Aluminum (Fume or Dust)a
Reported amounts released in pounds per yearb
Total release On- and
Statec RFd Aire Waterf UIg Landh Otheri On-sitej Off-sitek off-site AK 1 0 0 0 0 1 0 0 0 AL 4 2453 0 0 45887 48344 2453 45887 48340 AR 3 0 0 0 0 3 0 750 750 AZ 4 7167 0 0 230729 237900 7217 230679 237896 CA 16 182017 0 0 1662654 1844688 1802363 42364 1844727 CO 1 1500 0 0 53058 54559 1500 53058 54558 CT 2 0 0 0 0 2 0 0 0 FL 5 1624 0 0 23 1652 1624 23 1647 GA 10 37680 0 0 108219 145909 37680 108871 146551 IA 8 11570 0 0 43052 54630 11570 43052 54622 ID 2 2864 0 0 653345 656211 518203 138006 656209 IL 16 62008 0 0 520607 582631 62008 525882 587890 IN 29 149220 0 0 10023429 10172678 149225 10024174 10173399 KS 3 0 0 0 0 3 0 0 0 KY 13 254892 0 0 2799380 3054285 2419281 634991 3054272 LA 4 1184 0 0 13 1201 1197 0 1197 MA 2 No dataNo data No data No data No data No data 0 0 MD 2 0 0 0 0 2 0 0 0 MI 16 17862 0 0 1215365 1233243 17862 1224508 1242370 MN 6 58268 0 0 157233 215507 58268 157277 215545 MO 8 29495 0 0 1941390 1970893 1828685 7037274 8865959 MS 1 0 0 0 550 551 0 550 550 NC 8 62432 0 0 55340 117780 63182 54590 117772 NE 2 0 0 0 31105 31107 21263 9842 31105 NJ 6 4413 0 0 5222 9641 4413 5222 9635 NM 1 No dataNo data No data No data No data No data 0 0 NV 4 259 0 0 330084 330347 330343 0 330343 NY 7 58438 312 0 198222 256979 60436 213027 273463 OH 33 50159 2 0 2170512 2220706 253161 2237892 2491053 OK 9 9654 0 0 447920 457583 10416 447158 457574 OR 4 646 0 0 1295 1945 646 1295 1941 PA 23 8594 0 0 294833 303450 8866 317627 326493 RI 1 No dataNo data No data No data No data No data 0 0 SC 4 7841 0 0 750 8595 7841 1500 9341 TN 21 93021 0 0 887911 980953 185281 795651 980932 TX 19 89879 0 0 7670584 7760481 2590719 5171544 7762262
ALUMINUM 180
6 POTENTIAL FOR HUMAN EXPOSURE
Table 6-1 Releases to the Environment from Facilities that Produce Process or Use Aluminum (Fume or Dust)a
Reported amounts released in pounds per yearb
Total release On- and
Statec RFd Aire Waterf UIg Landh Otheri On-sitej Off-sitek off-site UT 6 187 0 0 372634 372827 147182 225639 372821 VA 2 137 0 0 1000 1139 137 1000 1137 WA 4 846 0 0 128819 129669 846 129421 130267 WI 14 75933 0 0 289933 365880 75933 290099 366032 WV 5 3112 0 0 4732012 4735129 3112 4732012 4735124 Total 329 1285354 314 0 37073110 38359108 10682912 34900865 45583777
aThe TRI data should be used with caution since only certain types of facilities are required to report This is not an exhaustive list Data are rounded to nearest whole number bData in TRI are maximum amounts released by each facility cPost office state abbreviations are used dNumber of reporting facilitieseThe sum of fugitive and point source releases are included in releases to air by a given facility fSurface water discharges waste water treatment-(metals only) and publicly owned treatment works (POTWs) (metal and metal compounds)gClass I wells Class II-V wells and underground injectionhResource Conservation and Recovery Act (RCRA) subtitle C landfills other on-site landfills land treatment surface impoundments other land disposal other landfillsiStorage only solidificationstabilization (metals only) other off-site management transfers to waste broker for disposal unknownjThe sum of all releases of the chemical to air land water and underground injection wellskTotal amount of chemical transferred off-site including to POTWs
RF = reporting facilities UI = underground injection
Source TRI05 2007 (Data are from 2005)
ALUMINUM 181
6 POTENTIAL FOR HUMAN EXPOSURE
Table 6-2 Releases to the Environment from Facilities that Produce Process or Use Aluminum Oxide (Fibrous Forms)a
Reported amounts released in pounds per yearb
Total release On- and
Statec RFd Aire Waterf UIg Landh Otheri On-sitej Off-sitek off-site AL 2 0 0 0 0 0 0 0 0 AR 1 0 0 0 0 0 0 0 0 CA 1 0 No data 0 0 0 0 0 0 CO 1 0 5 0 480 2749 485 2749 3234 CT 1 0 0 0 0 0 0 0 0 GA 2 16 175 0 2957 0 191 2957 3148 IA 2 0 0 0 40320 0 0 40320 40320 IL 5 76 0 0 122002 22660 76 144662 144738 IN 3 901 250 0 5 10 1156 10 1166 KY 3 243 0 0 26631 0 243 26631 26874 LA 2 0 0 0 0 0 0 0 0 MI 2 0 0 0 375000 0 0 375000 375000 MO 1 250 0 0 750 0 1000 0 1000 NC 4 56 10 0 60797 4342 61 65144 65205 NE 1 2 0 0 20 0 22 0 22 NM 1 0 0 0 0 0 0 0 0 NY 2 250 0 0 0 29808 250 29808 30058 OH 2 980 0 0 110958 0 980 110958 111938 OK 1 0 No data 0 0 0 0 0 0 PA 6 247 0 0 178893 6781 247 185674 185920 SC 2 14 0 7 23556 424 14 23987 24001 TN 4 3 0 0 0 0 3 0 3 TX 4 11 0 0 431166 0 11 431166 431177 VA 2 500 0 0 37159 0 37409 250 37659 WI 3 260 0 0 1059128 0 1059138 250 1059388
ALUMINUM 182
6 POTENTIAL FOR HUMAN EXPOSURE
Table 6-2 Releases to the Environment from Facilities that Produce Process or Use Aluminum Oxide (Fibrous Forms)a
Reported amounts released in pounds per yearb
Total release On- and
Statec RFd Aire Waterf UIg Landh Otheri On-sitej Off-sitek off-site WV 1 0 0 0 48000 0 48000 0 48000 Total 59 3810 440 7 2517822 66774 1149287 1439565 2588852
aThe TRI data should be used with caution since only certain types of facilities are required to report This is not an exhaustive list Data are rounded to nearest whole number bData in TRI are maximum amounts released by each facility cPost office state abbreviations are used dNumber of reporting facilitieseThe sum of fugitive and point source releases are included in releases to air by a given facility fSurface water discharges waste water treatment-(metals only) and publicly owned treatment works (POTWs) (metal and metal compounds)gClass I wells Class II-V wells and underground injectionhResource Conservation and Recovery Act (RCRA) subtitle C landfills other on-site landfills land treatment surface impoundments other land disposal other landfillsiStorage only solidificationstabilization (metals only) other off-site management transfers to waste broker for disposal unknownjThe sum of all releases of the chemical to air land water and underground injection wellskTotal amount of chemical transferred off-site including to POTWs
RF = reporting facilities UI = underground injection
Source TRI05 2007 (Data are from 2005)
ALUMINUM 183
6 POTENTIAL FOR HUMAN EXPOSURE
imports or processes 225000 pounds of any TRI chemical or otherwise uses gt10000 pounds of a TRI
chemical in a calendar year (EPA 2005)
621 Air
Estimated releases of 129 million pounds (~586 metric tons) of aluminum (fume or dust) to the
atmosphere from 329 domestic manufacturing and processing facilities in 2005 accounted for about 28
of the estimated total environmental releases from facilities required to report to the TRI (TRI05 2007)
Estimated releases of 3810 pounds (~173 metric tons) of aluminum oxide (fibrous forms) to the
atmosphere from 59 domestic manufacturing and processing facilities in 2005 accounted for about 15
of the estimated total environmental releases from facilities required to report to the TRI (TRI05 2007)
These releases are summarized in Tables 6-1 and 6-2
Aluminum is released to the environment by both natural processes and anthropogenic sources Because
of its prominence as a major constituent of the earths crust natural processes far exceed the contribution
of anthropogenic releases to the environmental distribution of aluminum (Lantzy and MacKenzie 1979)
Anthropogenic releases are primarily to the atmosphere The largest source of airborne aluminum-
containing particulates is the flux of dust from soil and the weathering of rocks (Lee and Von Lehmden
1973 Sorenson et al 1974) In addition aluminum-containing dust is generated by volcanic activity
(Varrica et al 2000) Human activities such as mining and agriculture contribute to this wind-blown
dust (Eisenreich 1980 Filipek et al 1987) About 13 of atmospheric aluminum is attributed to
anthropogenic emissions (Lantzy and MacKenzie 1979) The major anthropogenic sources of aluminum-
containing particulate matter include coal combustion aluminum production and other industrial
activities such as smelting that process crustal minerals (Lee and Von Lehmden 1973) Aluminum
concentrations in air particulate emissions from iron and steel foundries and brass and bronze refineries
range from about 100 to 1000 ppm (Lee and Von Lehmden 1973) Que Hee et al (1982) also found that
aluminum was one of the most abundant elements quantified in coal stack emissions from power plants
located in both the eastern and western United States In addition in US cities motor vehicle emissions
contribute an estimated 09ndash9 of the observed elemental concentration of aluminum in these
atmospheres (Ondov et al 1982)
Aluminum has been identified in air samples collected at 14 of the 596 NPL hazardous waste sites where
it has been detected in some environmental media (HazDat 2008)
ALUMINUM 184
6 POTENTIAL FOR HUMAN EXPOSURE
622 Water
Estimated releases of 314 pounds (~014 metric tons) of aluminum (fume or dust) to surface water from
329 domestic manufacturing and processing facilities in 2005 accounted for about 00007 of the
estimated total environmental releases from facilities required to report to the TRI (TRI05 2007)
Estimated releases of 440 pounds (~020 metric tons) of aluminum oxide (fibrous forms) to surface water
from 59 domestic manufacturing and processing facilities in 2005 accounted for about 0017 of the
estimated total environmental releases from facilities required to report to the TRI (TRI05 2007) These
releases are summarized in Tables 6-1 and 6-2
Aluminum occurs ubiquitously in natural waters as a result of the weathering of aluminum-containing
rocks and minerals Of the known geochemical responses to environmental acidification the best
documented is the mobilization of aluminum from terrestrial to aquatic environments (Campbell et al
1992) This mobilization of aluminum is often episodic in nature and is associated with pH depressions
(acidification) occurring during the spring snowmelt or associated with erosion from specific storm events
(Campbell et al 1992 Nelson and Campbell 1991 Rosseland et al 1990)
Aluminum concentrations in surface waters can be increased directly or indirectly by human activity
through industrial and municipal discharges surface run-off tributary inflow groundwater seepage and
wet and dry atmospheric deposition (Eisenreich 1980) For example aluminum is released to surface
waters in the effluent from bauxite processing and aluminum manufacturing facilities at concentrations
that can be toxic to aquatic life (His et al 1996 Trieff et al 1995) However the effluents of these
facilities typically contain not only aluminum but also a complex mixture of heavy metals such as iron
chromium and mercury as well as minerals silica and other compounds and synergistic effects of these
metals and compounds cannot be ruled out The use of aluminum sulfate and other aluminum compounds
as coagulating agents in the treatment of raw drinking water supplies can significantly increase the total
aluminum content in finished water (Cech and Montera 2000 Henshaw et al 1993 Miller et al 1984a
Qureshi and Malmberg 1985 USGS 1984b) Weathering of sulfide ores exposed to the atmosphere in
inactive mines and tailings dumps releases large quantities of sulfuric acid and metals such as aluminum
(Filipek et al 1987) Increasingly acid environments caused by such acid mine drainage or by acid rain
will subsequently cause an increase in the dissolved aluminum content of the surrounding waters
(Brusewitz 1984 Filipek et al 1987) In addition atmospheric deposition is a source of aluminum input
to surface water The atmospheric loading of aluminum to Lake Michigan was estimated to be 5 million
ALUMINUM 185
6 POTENTIAL FOR HUMAN EXPOSURE
kgyear of which 74 was to the southern basin where the influence of agricultural and industrial activity
(eg steel manufacturing and cement production) was greatest (Eisenreich 1980)
Aluminum has been identified in surface water and groundwater samples collected at 251 and 391 of the
596 NPL hazardous waste sites respectively where it has been detected in some environmental media
(HazDat 2008)
623 Soil
Estimated releases of 371 million pounds (~168x104 metric tons) of aluminum (fume or dust) to soils
from 329 domestic manufacturing and processing facilities in 2005 accounted for about 81 of the
estimated total environmental releases from facilities required to report to the TRI (TRI05 2007)
Estimated releases of 252 million pounds (~1140 metric tons) of aluminum oxide (fibrous forms) to soils
from 59 domestic manufacturing and processing facilities in 2005 accounted for about 97 of the
estimated total environmental releases from facilities required to report to the TRI (TRI05 2007) An
additional 7 pounds (3 kilograms ) of aluminum oxide (fibrous forms) were released via underground
injection (TRI05 2007) These releases are summarized in Tables 6-1 and 6-2
Aluminum is the most abundant metal and the third most abundant element in the earthrsquos crust
comprising about 88 by weight (88 gkg) (Staley and Haupin 1992) Aluminum can be released
naturally by the weathering of aluminum-containing rocks Aluminum is also released to soil as a major
constituent of many mining wastes and is also contained in solid wastes from coal combustion and
aluminum reduction and other metal processing operations (DOI 1983 1984) Wilson et al (2002)
estimated that several hundred thousand pounds of aluminum containing chaff have been release to the
Chesapeake Bay during research and training operations by the Naval Research Laboratory-Chesapeake
Bay Detachment over the past 25 years
Aluminum has been identified in soil and sediment samples collected at 253 and 190 of the 596 NPL
hazardous waste sites respectively where it has been detected in some environmental media (HazDat
2008)
ALUMINUM 186
6 POTENTIAL FOR HUMAN EXPOSURE
63 ENVIRONMENTAL FATE 631 Transport and Partitioning
Aluminum is the most abundant metal in the earthrsquos crust but is never found in its elemental state in
nature In compounds aluminum occurs in its only oxidation state (+3) (Lide 2005) Aluminum occurs
widely in nature with silicates such as mica and feldspar as the hydroxo oxide (bauxite) and as cryolite
(Na3AlF6) (Cotton et al 1999) Aluminumrsquos behavior in the environment is strongly influenced by its
coordination chemistry Aluminum partitions between solid and liquid phases by reacting and
complexing with water molecules and anions such as chloride fluoride sulfate nitrate phosphate and
negatively charged functional groups on humic materials and clay
The transport and partitioning of aluminum in the environment is determined by its chemical properties
as well as the characteristics of the environmental matrix that affect its solubility At a pH gt55 naturally
occurring aluminum compounds exist predominantly in an undissolved form such as gibbsite Al(OH)3 or
as aluminosilicates except in the presence of high amounts of dissolved organic material or fulvic acid
which binds with aluminum and can cause increased dissolved aluminum concentrations in streams and
lakes (Brusewitz 1984) Organic acids have been found to be important weathering agents for dissolving
and transporting aluminum in an alpine soil environment (Litaor 1987) The ability of these organic acids
to complex aluminum in sub-alpine soil solutions was found to increase as the pH rose from 38 to
5 (Dahlgren and Ugolini 1989) In this study dissolved aluminum was found primarily as organic
complexes when organic carbonmetal ratios were gt50 (Dahlgren and Ugolini 1989)
In general decreasing pH (acidification) results in an increase in mobility for monomeric forms of
aluminum (Goenaga and Williams 1988) which is of concern with respect to the occurrence of acid rain
and the release of acid mine drainage Aluminum in soil solutions and surface waters in a mining region
rich in metallic sulfides was in a labile form as Al-SO4 and Al3+ species Acidic conditions are created
by the microbial oxidation of sulfides in tailing piles resulting in sulfuric acid In contrast in areas not
affected by acidification aluminum in solution was partitioned between labile and non-labile forms the
latter being predominantly bound to fluorine (Alvarez et al 1993) In soils the most soluble form of
aluminum under acidic conditions is nonsilicaceous organically-bound aluminum (Mulder et al 1989)
In groundwater or surface water systems an equilibrium with a solid phase form is established that
largely controls the extent of aluminum dissolution which can occur In acid sulfate waters resulting from
mine drainage gibbsite and kaolinite are not stable and the solubility of the minerals jurbanite
ALUMINUM 187
6 POTENTIAL FOR HUMAN EXPOSURE
(Al(SO4)(OH)middotH2O) or alunite (KAl3(SO4)2(OH)6) may control aluminum levels (Filipek et al 1987) In a
Colorado alpine watershed soil the chemical equilibria of aluminum in interstitial water at a pH range of
44ndash72 were controlled by amorphous aluminosilicate rather than gibbsite (Litaor 1987)
In addition to the effect of pH on mobility the type of acid entering environmental systems may also be
important Nitric acid was found to leach more aluminum from soil columns representative of high-
elevation forest floor soils than did sulfuric acid (James and Riha 1989) However in mineral horizons
below the forest floor the study found that concentrations of aluminum leached by these acids did not
differ from concentrations of aluminum leached by distilled deionized water at a pH of 57 The authors
concluded that soluble constituents from the forest floor affected the aluminum solubility in the
underlying mineral horizons under the leaching conditions that they used These constituents may have
included natural buffering agents which resist changes in pH and therefore negate or mediate the effect
of the acid
The ability of mineralized soil to control the migration of aluminum was observed in another study
Acidic leachate from coal waste containing aluminum was percolated through soil containing varying
amounts of calcium carbonate (Wangen and Jones 1984) Soluble aluminum was found to decrease
dramatically as the pH of the percolating leachate increased and aluminum oxide precipitates formed at
pH 6 no dissolved aluminum was measured The authors concluded that alkalinized carbonaceous soils
provide the best control material for acidic leachates from coal mineral wastes
The adsorption of aluminum onto clay surfaces can be a significant factor in controlling aluminum
mobility in the environment and these adsorption reactions measured in one study at pH 30ndash41 have
been observed to be very rapid (Walker et al 1988) However clays may act either as a sink or a source
for soluble aluminum depending on the degree of aluminum saturation on the clay surface (Walker et al
1988)
The presence of high levels of suspended solids in stream surface water during storm episodes resulted in
higher concentrations of adsorbed aluminum than in the absence of suspended solids (Goenaga and
Williams 1988) The increased adsorption was not strictly linear with higher concentrations of
suspended solids due to variations in the particle size distribution and the nature of the particles
Within the pH range of 5ndash6 aluminum complexes with phosphate and is removed from solution
Because phosphate is a necessary nutrient in ecological systems this immobilization of both aluminum
ALUMINUM 188
6 POTENTIAL FOR HUMAN EXPOSURE
and phosphate may result in depleted nutrient states in surface water (Brusewitz 1984) Conversely
aluminum has been added to a nutrient-rich lake in Sweden with some success in an effort to arrest the
aging process caused by an overabundance of phosphate (Jernelov 1971)
Aluminum salt coagulants are used in the treatment of potable drinking water and unretained aluminum
(approximately 11 of the added aluminum) was found to be transported through a water distribution
system (Driscoll and Letterman 1988)
Aluminum as a constituent of soil weathered rock and solid waste from industrial processes is
transported through the atmosphere as windblown particulate matter and is deposited onto land and water
by wet and dry deposition Atmospheric loading rates of aluminum to Lake Michigan were estimated at
5 million kgyear (Eisenreich 1980) In this study most of the aluminum was generally associated with
large particles that were deposited near their source In a study the wet and dry deposition of aluminum
was measured biweekly for 1 year at two sites on Massachusetts Bay Turro and Nahant The average
total deposition rate was 01 gm2-year of which 29 was in rain (wet deposition) (Golomb et al 1997)
Plant species and cultivars of the same species differ considerably in their ability to take up and
translocate aluminum to above-ground parts (Kabata-Pendias and Pendias 1984) Tea leaves may contain
very high concentrations of aluminum gt5000 mgkg in old leaves (Dong et al 1999) Other plants that
may contain high levels of aluminum include Lycopodium (Lycopodiaceae) a few ferns Symplocos
(Symplocaceae) and Orites (Proteaceae) (Jansen et al 2002) Aluminum is often taken up and
concentrated in root tissue (Kabata-Pendias and Pendias 1984) In sub-alpine ecosystems the large root
biomass of the Douglas fir Abies amabilis takes up aluminum and immobilizes it preventing large
accumulation in above-ground tissue (Vogt et al 1987) It is unclear to what extent aluminum is taken up
into root food crops and leafy vegetables An uptake factor (concentration of aluminum in the
plantconcentration of aluminum in soil) of 0004 for leafy vegetables and 000065 for fruits and tubers
has been reported (DOE 1984) but the pH and plant species from which these uptake factors were
derived are unclear Based upon these values however it is clear that aluminum is not taken up in plants
from soil but is instead biodiluted
Transfer coefficients of 00002 (kgday)-1 for uptake into milk and 00015 (kgday)-1 for uptake into beef
tissue have been reported (DOE 1984) The transfer coefficients represent the fraction of daily aluminum
intake in feed that is transferred to a kilogram of milk or beef muscle Based upon the above values
ALUMINUM 189
6 POTENTIAL FOR HUMAN EXPOSURE
aluminum is not transferred to beef muscle or milk from feed to any appreciable extent and therefore
would not be expected to bioaccumulate in terrestrial food chains
The potential for accumulation of aluminum has been studied in several aquatic species including fish
(Buckler et al 1995 Cleveland et al 1991 Hamdy 1993 McDonald et al 1991 Wilkinson and Campbell
1993) amphibians (Freda and McDonald 1990) crustaceans (Madigosky et al 1991) snails (Brooks et al
1992) aquatic insects (Frick and Herrmann 1990 Guerold et al 1995 Krantzberg and Stokes 1990) and
aquatic plants (Albers and Camardese 1993 Vuori et al 1990) Bioconcentration of aluminum in fish is a
function of the water quality (eg pH and total organic carbon) (Cleveland et al 1989)
Brook trout have been shown to accumulate slightly more aluminum (measured as whole-body residues)
at pH 56ndash57 than at pH 65ndash66 (Cleveland et al 1989) Cleveland et al (1991) reported that the
estimated steady-state bioconcentration factors (BCF) for aluminum in brook trout were 215 123 and
36 at pH 53 61 and 72 respectively When transferred to water of the same pH without added
aluminum brook trout eliminated aluminum from tissues more rapidly at pH 53 than at pH 61 and 72
In tissues of smallmouth bass aluminum concentrations were higher and more variable in gill tissue than
in other tissues (Brumbaugh and Kane 1985) Aluminum concentrations in rainbow trout from an alum-
treated lake an untreated lake and a hatchery were highest in gill tissue and lowest in muscle (Buergel
and Soltero 1983) Aluminum residue analyses in brook trout have shown that whole-body aluminum
content decreases as the fish advance from larvae to juveniles (Cleveland et al 1989) These results
imply that the aging larvae begin to decrease their rate of aluminum uptake to eliminate aluminum at a
rate that exceeds uptake or to maintain approximately the same amount of aluminum while the body
mass increases The decline in whole-body aluminum residues in juvenile brook trout may be related to
growth and dilution by edible muscle tissue that accumulated less aluminum than did the other tissues
(Cleveland et al 1989) Wilkinson and Campbell (1993) studied aluminum uptake in Atlantic salmon at a
pH of 45 under conditions simulating spring snowmelt These authors reported that gill uptake was slow
approaching a steady state only after 3 days of exposure The greatest fraction of the gill-associated
aluminum was not sorbed to the gill tissue but to the gill mucus The authors believe that the mucus
appears to retard aluminum transport from solution to the membrane surface thus delaying the acute
biological response of the fish Buckler et al (1995) reported concentrations of aluminum in whole-body
tissue of the Atlantic salmon exposed to high concentrations of aluminum ranging from 3 Igg (for fish
exposed to 33 IgL) to 96 Igg (for fish exposed to 264 IgL) at pH 55 After 60 days of exposure
BCFs ranged from 76 to 190 and were directly related to the aluminum exposure concentration In acidic
waters (pH 46ndash53) with low concentrations of calcium (05ndash15 mg CaL) labile aluminum between
ALUMINUM 190
6 POTENTIAL FOR HUMAN EXPOSURE
25 and 75 IgL is toxic (Rosseland et al 1990) Because aluminum is toxic to many aquatic species it is
not bioaccumulated to a significant degree (BCF lt300) in most fish and shellfish therefore consumption
of contaminated fish does not appear to be a significant source of aluminum exposure in humans
Aluminum uptake for the leopard frog (Rana pipiens) was positively correlated to exposure time and pH
however no BCF values were reported because the authors felt that the body aluminum accumulation was
too variable for useful prediction of the exposure history or physiological status of the frogs (Freda and
McDonald 1990)
Bioconcentration of aluminum has also been reported for several aquatic invertebrate species BCF
values ranging from 013 to 05 in the whole-body were reported for the snail Helix aspersa fed a single
24-hour meal containing aluminum in a barley-flour pellet (Brooks et al 1992) Madigosky et al (1991)
reported high tissue residues of aluminum in the red swamp crayfish (Procambarus clarkii) collected
from roadside drainage ditches in Louisiana Mean aluminum concentrations as Igg dry weight in
crayfish from roadside ditches ranged from 175 to 639 in abdominal muscle 31ndash2274 in the
hepatopancreas 3094ndash98150 in the alimentary tract 1085ndash7745 in the exoskeleton and 30ndash140 in the
blood These values were significantly elevated above those of control crayfish where the concentrations
(Ig Alg dry weight) were 122 in abdominal muscle 142 in the hepatopancreas 2697 in the alimentary
tract 428 in the exoskeleton and 379 in the blood
Bioconcentration of aluminum has also been reported for aquatic insects Frick and Herrmann (1990)
reported aluminum accumulation in mayfly nymphs (Heptagenia sulphurea) at low pH (45) The
nymphs were exposed at two concentrations (02 and 2 mg AlL) and for two exposure times (2 and
4 weeks) the longer time period including a molting phase When nymphs were exposed to the higher
concentration of aluminum for two instar periods with a molt in between the aluminum content (234 mg
Alg dry weight) nearly doubled compared with that of a one-instar treatment (124 mg Alg dry weight)
The major part of the aluminum was deposited in the exuviae of the nymphs as the aluminum
determination in the nymphs showed a 70 decrease in aluminum content after molting These authors
speculate that internally accumulated aluminum in the nymphs may be transferred to terrestrial predators
(eg birds) They also hypothesized that externally deposited aluminum may be transferred to terrestrial
food chains by aquatic invertebrates that leave the water in their last instar to molt on shore An
important contribution to the idea of biomagnification of aluminum was made by Nyholm (1981) Using
semi-quantitative multi-element microanalysis he related impaired breeding of pied flycatchers (Ficedula
hypoleuca) in Sweden to the occurrence of aluminum in the bone marrow of the birds A diet of
ALUMINUM 191
6 POTENTIAL FOR HUMAN EXPOSURE
stoneflies was suspected of forming a link between the lake and the terrestrial predators Although the
matter is far from clear Nyholm (1981) seems to imply that the insects (stoneflies) were adults and that
these could contain significant amounts of aluminum even after having left the exuviae behind (Frick and
Herrmann 1990)
Vuori et al (1990) sampled tufts of the aquatic moss Fontinalis dalecarlica from the River Lestijoki in
Western Finland The concentrations of aluminum in the water were low (87ndash196 IgL pH 65ndash70)
relative to the concentrations in the young terminal shoots of F dalecarlica appeared to be quite high
(303ndash1852 Igg dry weight) The authors concluded that there was an effective accumulation of
aluminum in the moss tissue Albers and Camardese (1993) compared concentrations of aluminum and
other metals in aquatic species of three acidified (pH 5) and three nonacidified (pH65)constructed
wetlands They found that the metal content of Sparganium americanum (bur-reed) was only slightly
affected by acidification
632 Transformation and Degradation
As an element aluminum cannot be degraded in the environment but may undergo various precipitation
or ligand exchange reactions Aluminum in compounds has only one oxidation state (+3) and would not
undergo oxidation-reduction reactions under environmental conditions Aluminum can be complexed by
various ligands present in the environment (eg fulvic and humic acids) The solubility of aluminum in
the environment will depend on the ligands present and the pH
6321 Air
Aluminum-containing particulate matter in the atmosphere is mainly derived from soil and industrial
processes where crustal materials (eg minerals) are processed Aluminum is found as silicates oxides
and hydroxides in these particles (Eisenreich 1980) Aluminum compounds cannot be oxidized and
atmospheric transformations would not be expected to occur during transport If aluminum metal
particulates were released to air during metal processing they would be rapidly oxidized
6322 Water
The trivalent aluminum ion is surrounded by six water molecules in solution (Cotton et al 1999) The
hydrated aluminum ion [Al(H2O)6]3+ undergoes hydrolysis in which a stepwise deprotonation of the
coordinated water ligands forms bound hydroxide ligands (eg [Al(H2O)5(OH)]2+ [Al(H2O)4(OH)2]+)
ALUMINUM 192
6 POTENTIAL FOR HUMAN EXPOSURE
(Snoeyink and Jenkins 1980) The speciation of aluminum in water is pH dependent The hydrated
trivalent aluminum ion is the predominant form at pH levels below 4 Between pH 5 and 6 the
predominant hydrolysis products are Al(OH)2+ and Al(OH)2+ while the solid Al(OH)3 is most prevalent
between pH 52 and 88 The soluble species Al(OH)4- is the predominant species above pH 9 and is the
only species present above pH 10 (Martell and Motekaitis 1989) Polymeric aluminum hydroxides appear
between pH 47 and 105 and increase in size until they are transformed into colloidal particles of
amorphous Al(OH)3 which crystalize to gibbsite in acid waters (Brusewitz 1984) Polymerization is
affected by the presence of dissolved silica when enough silica is present aluminum is precipitated as
poorly crystallized clay mineral species (Bodek et al 1988)
Hydroxyaluminum compounds are considered amphoteric (eg they can act as both acids and bases in
solution) (Cotton et al 1999) Because of this property aluminum hydroxides can act as buffers and
resist pH changes within the narrow pH range of 4ndash5 (Brusewitz 1984)
Monomeric aluminum compounds typified by aluminum fluoride chloride and sulfate are considered
reactive or labile compounds whereas polymeric aluminum species react much more slowly in the
environment (USGS 1984a) Aluminum has a stronger attraction for fluoride in an acidic environment
compared to other inorganic ligands (Brusewitz 1984) Fulvic acid is also an important ligand for
aluminum under acidic conditions and it has been observed that as the temperature is lowered the rate of
complexation of aluminum with fluoride is considerably slowed while the rate of complexation between
aluminum and fulvic acid is only slightly decreased in rate (Plankey and Patterson 1987) This suggests
that during snow-melt conditions when aluminum and hydrogen ion concentrations increase
complexation with fulvic acid could preferentially occur over complexation with fluoride
6323 Sediment and Soil
Aluminum is present in many primary minerals The weathering of these primary minerals over time
results in the deposition of sedimentary clay minerals such as the aluminosilicates kaolinite and
montmorillonite The weathering of soil results in the more rapid release of silicon and aluminum
precipitates as hydrated aluminum oxides such as gibbsite and boehmite which are constituents of
bauxites and laterites (Bodek et al 1988) Aluminum is found in the soil complexed with other anions
such as fluoride sulfate and phosphate
ALUMINUM 193
6 POTENTIAL FOR HUMAN EXPOSURE
64 LEVELS MONITORED OR ESTIMATED IN THE ENVIRONMENT
Reliable evaluation of the potential for human exposure to aluminum depends in part on the reliability of
supporting analytical data from environmental samples and biological specimens Concentrations of
aluminum in unpolluted atmospheres and in pristine surface waters are often so low as to be near the
limits of current analytical methods In reviewing data on aluminum levels monitored or estimated in the
environment it should also be noted that the amount of chemical identified analytically is not necessarily
equivalent to the amount that is bioavailable The analytical methods available for monitoring aluminum
in a variety of environmental media are detailed in Chapter 7
641 Air
There are varying levels of aluminum in the atmosphere depending on the location of the sampling site
meteorologic conditions and the level of industrial activity or traffic in the area Aluminum levels are
expected to be low in areas influenced by the ocean and high in areas with wind-blown soil Background
concentrations of aluminum in the atmosphere generally range from 0005 to 018 Igm3 (Hoffman et al
1969 Poumltzl 1970 Sorenson et al 1974) In rural areas of Hawaii aluminum concentrations have been
measured at a range of 0005ndash0032 Igm3 (Hoffman et al 1969) whereas a concentration range of 027ndash
039 Igm3 has been reported in Manitoba National Park in Canada (AEC 1971) Atmospheric aluminum
concentrations in US cities and industrial areas are considerably higher ranging from about 04 to
80 Igm3 (Cooper et al 1979 Dzubay 1980 Kowalczyk et al 1982 Lewis and Macias 1980 Moyers et
al 1977 Ondov et al 1982 Pillay and Thomas 1971 Sorenson et al 1974 Stevens et al 1978) The
range of the concentration of aluminum in fine (lt1ndash25 Im) and course (25ndash10 Im) particles from two
industrial areas Southeast Chicago Illinois and East St Louis Illinois were 22ndash539 ngm3
(125 ngm3 mean) and 24ndash1370 ngm3 (153 ngm3 mean) respectively for fine particles and 82ndash
1760 ngm3 (390 ngm3 mean) and 17ndash2120 ngm3 (442 ngm3 mean) respectively for coarse particles
At a rural site (Bondville Illinois) the aluminum concentrations in fine and coarse particles ranged from
32 to 293 ngm3 (95 ngm3 mean) and from 32 to 3120 ngm3 (338 ngm3 mean) respectively which was
not much different than the aluminum concentration from the industrial sites (Sweet et al 1993) A mean
aluminum concentration of 4746 ngm3 (range 384ndash26196 ngm3) was reported in particulate matter
collected in air from downtown Rio de Janeiro Brazil samples were collected during the period from
September 2001 to August 2002 (Quiterio et al 2004) Mean aluminum concentrations in winter and
summer indoor air sampled in 1999 were 41 and 39 ngm3 in the homes of 46 high school students from
West Central Harlem New York City who participated in the Toxic Exposure Assessment a
ColumbiaHarvard (TEACH) study (Kinney et al 2002) Aluminum concentrations can also vary with
ALUMINUM 194
6 POTENTIAL FOR HUMAN EXPOSURE
seasonal meteorological conditions For example in Mackinac Island Michigan summer concentrations
averaged about 025 Igm3 while winter concentrations were only about 018 Igm3 (AEC 1971)
642 Water
The concentrations of dissolved aluminum in water vary with pH and the humic-derived acid content of
the water (Brusewitz 1984) Aluminum is only sparingly soluble in water between pH 6 and 8 Because
the pH of about 95 of naturally-occurring water is between 6 and 9 and since high aluminum
concentrations occur in surface water bodies only when the pH is lt5 the aluminum concentration in most
natural waters is extremely low (Filipek et al 1987 Snoeyink and Jenkins 1980 Sorenson et al 1974) In
general aluminum concentrations in surface waters at pH levels above 55 will be lt01 mgL (Brusewitz
1984 Miller et al 1984a Sorenson et al 1974 Taylor and Symons 1984) However even at neutral pH
levels higher aluminum concentrations have been found in lakes with a high humic acid content
(Brusewitz 1984) Aluminum concentrations in marinewaters tend to be much lower (ie lt0001 mgL)
than those found in freshwater lakes and streams (Brusewitz 1984) probably because of increased
alkalinity in marinewater compared to fresh water
At lower pH levels the aluminum content significantly increases because of increased solubility of
aluminum oxide and salts in acidic solutions For example aluminum has been found at concentrations
of up to 90 mgL in tributaries that drain mines containing massive sulfide deposits (Filipek et al 1987)
In heavily contaminated surface waters in a mining region rich in sulfides the water was highly acidic
(pH lt35) and the levels of soluble aluminum were gt2 mmolL (50 mgL) (Alvarez et al 1993)
Similarly surface water samples contaminated with acidic mine drainage collected at seven different
locations in the vicinity of abandoned coal mines in west-central Indiana had aluminum concentrations of
60ndash269 mgL (Allen et al 1996) The pH ranged from 21 to 34 at these sites
Aluminum was detected at dissolved aluminum concentrations ranging from 0001 to 2760 mgL with a
mean concentration of 0074 mgL in 456 of 1577 raw surface water samples collected during a 5-year
survey at various locations across the United States (DOI 1970) Dissolved aluminum concentrations
were detected in about 48 of the 380 finished drinking waters sampled and ranged from 0003 to
16 mgL with a mean of 0179 mgL (DOI 1970) In another survey of 186 community water systems
median aluminum concentrations for all finished drinking water samples ranged from 0026 to
0161 mgL (Miller et al 1984a) These authors further reported that the median aluminum concentration
in finished water that received no coagulation treatment was 0043 mgL (range 0016ndash1167 mgL)
ALUMINUM 195
6 POTENTIAL FOR HUMAN EXPOSURE
compared to the median of 0112 mgL (range 0014ndash2670 mgL) in finished water receiving alum
(aluminum sulfate) coagulation treatment In the supplies in which no coagulant was used during
treatment 29 of supplies using surface water as their source had aluminum concentrations exceeding
005 mgL whereas only 4 of supplies using groundwater sources exceeded this level When aluminum
coagulants were used 69 of all supplies had residual aluminum concentrations gt005 mgL (Miller et al
1984a) In another study the aluminum content in treated water at facilities using alum coagulation
treatment of raw waters ranged from about 001 to 13 mgL with a mean of about 0157 mgL (Letterman
and Driscoll 1988) Tap water samples were collected in 1998 in the service area of East Houston Texas
water purification plant 44 of these samples had aluminum concentrations gt02 mgL Aluminum
concentrations as high as 053 mgL were observed in samples collected near the treatment plant that used
an alum coagulant An average decrease of 7 IgLkm was observed along the distribution system (Cech
and Montera 2000)
Schenk et al (1989) measured aluminum concentrations in drinking water collected primarily in the
western and central parts of the United States from outlets from which water was consumed rather than
from the original water treatment plant Aluminum concentrations in drinking water in various regions of
the United States are listed in Table 6-3 Although aluminum concentrations in drinking water may range
from undetectable to 1029 mgL aluminum concentrations in most drinking water in the United States
were generally lt01 mgL (Schenk et al 1989) While several water sources in the west coast states
(California Oregon and Washington) were found to contain undetectable concentrations of aluminum
(lt0001 mgL) several cities in other geographic areas of the United States had high aluminum
concentrations (gt04 mgL) These included Peoria Illinois (0467 mgL) Coos Bay Oregon
(0483 mgL) Watertown South Dakota (0502 mgL) Waco Texas (0520 mgL) Yellowstone National
Park Wyoming (0608 mgL) Philadelphia Pennsylvania (0688 mgL) and Charleston South Carolina
(1029 mgL)
Henshaw et al (1993) studied concentrations of various components including aluminum in drinking
water derived from the Great Lakes in six communities in the United States and Ontario Canada Alum
was used as a coagulant in all six communities It was found that aluminum concentrations were
generally higher in treated waters as compared to raw water Between 1986 and 1990 mean aluminum
concentrations in raw water were 0020ndash0053 0058ndash0070 0012ndash0023 0020ndash0037 and 0058ndash
0476 mgL in Milwaukee Wisconsin Rochester New York Thunder Bay Ontario Toronto Ontario
and Windsor Ontario respectively Between 1986 and 1990 mean aluminum concentrations in treated
water were 0085ndash0200 0070ndash0115 0027ndash0032 0080ndash0139 and 0113ndash0727 mgL in Gary
ALUMINUM 196
6 POTENTIAL FOR HUMAN EXPOSURE
Table 6-3 Aluminum Concentrations Detected in Drinking Water in Various Regions of the United States
US States Aluminum concentration (μgL)a
California 0ndash274 Colorado 42ndash166 Hawaii 12ndash124 Idaho 28ndash63 Illinois 3ndash467 Indiana 1ndash137 Kansas 12ndash245 Kentucky 9ndash400 Louisiana 12ndash210 Michigan 6ndash123 Minnesota 24ndash93 Missouri 2ndash368 Montana 11ndash98 New Yorkb 254ndash299 Nevada 5ndash126 Ohio 2ndash245 Oregon 0ndash483 Pennsylvaniac 688 South Carolina 2ndash1029 South Dakota 2ndash502 Tennesseed 45 Texas 1ndash520 Utah 19ndash51 Washington 0ndash118 Wisconsin 12ndash118 Wyoming 16ndash608
aRange in values reported for each statebWater sampled in New York City only cWater sampled in Philadelphia only (one sample)dWater sampled in Memphis only (one sample)
Source Schenk et al 1989
ALUMINUM 197
6 POTENTIAL FOR HUMAN EXPOSURE
Indiana Rochester New York Thunder Bay Ontario Toronto Ontario and Windsor Ontario
respectively Data for raw water in Gary Indiana and treated water in Milwaukee Wisconsin were not
provided (Henshaw et al 1993) Aluminum concentrations in 172 samples of bottled water sold in
Canada ranged from lt0010 to 0568 Igg (lt0010ndash0567 mgL) with a mean of 0027 Igg (0027 mgL)
(Dabeka et al 1992) Drinking water from 35 cities and villages in Galicia northwest Spain were
analyzed for dissolved aluminum during 1997 to 2003 an average aluminum concentration of 0126 mgL
was reported with concentrations ranging from 0008 to 0650 mgL (Rubinos et al 2007)
Aluminum has been measured in atmospheric precipitation (ie rain and snow) in the United States at
concentrations up to 12 mgL (Dantzman and Breland 1970 DOI 1971 Fisher et al 1968 USGS 1964)
Aluminum has been measured in rainwater samples collected during the Global Change Expedition in the
North Atlantic Ocean (Lim and Jickells 1990) These authors reported that comparisons between acid-
leachable and total (dissolved plus particulate) trace aluminum concentrations suggest that the acid-
leachable fraction of aluminum can significantly underestimate total concentrations of aluminum in
rainwater Acid-leached mean concentrations of aluminum in rainwater collected during three rainfall
events in the North Atlantic were 337 122 and 199 IgL Overall the acid-leached concentrations of
aluminum in rainwater for seven rainfall events ranged from 114 to 352 IgL These values were
compared with acid-leachable aluminum concentrations in precipitation from remote areas which ranged
from 21 to 1544 IgL Total (dissolved plus particulate) aluminum concentrations in North Atlantic
precipitation samples collected in 1988 ranged from 61 to 827 IgL (Lim and Jickells 1990)
Aluminum concentrations in groundwater wells at neutral pH generally fall below 01 mgL (Brusewitz
1984) In areas receiving acid precipitation aluminum concentrations in groundwater may be gt10 times
the concentrations found in areas with neutral pH levels in the water (Brusewitz 1984) possibly due to
precipitation of aluminum compounds in the more alkaline medium or the reaction of aluminum with
available silicates In another study Miller et al (1984a) reported that the median concentration of
aluminum in finished water obtained from groundwater was 0031 mgL (range 0014ndash0290 mgL) as
compared to the median concentration in surface water of 0043 mgL (range 0016ndash1167 mgL) These
authors also reported that while 55 of the raw surface waters sampled contained aluminum
concentrations gt005 mgL only 4 of the raw groundwater samples contained aluminum concentrations
gt005 mgL
ALUMINUM 198
6 POTENTIAL FOR HUMAN EXPOSURE
643 Sediment and Soil
Aluminum is the most abundant metal and the third most abundant element in the earthrsquos crust
comprising about 88 by weight (88 gkg) (Staley and Haupin 1992) Its concentration in soils varies
widely ranging from about 007 by weight (07 gkg) to over 10 by weight (100 gkg) (Sorenson et al
1974 USGS 1984c) Varying concentrations are found in different soil samples taken from the same area
and in areas with different vegetation types (Brusewitz 1984 Sorenson et al 1974) In Hawaii aluminum
contents were much higher with concentrations ranging from 79 to 317 gkg (Moomaw et al 1959) Soils
in Florida and parts of Georgia Texas Oklahoma and Michigan contain lt20 gkg of soil whereas soils
from portions of the Pacific Northwest New England Colorado and Nevada have concentrations
gt80 gkg (Sparling and Lowe 1996) Mean aluminum concentrations in cultivated and uncultivated soil
samples collected during a number of field studies were 33 gkg (range 7ndashgt100 gkg) for subsurface soils
in the eastern United States 54 gkg (range 5ndashgt100 gkg) in subsurface soils in the western United States
and 57 gkg (range 13ndash76 gkg) in surface soils collected in Colorado (Connor and Shacklette 1975) Ma
et al (1997) reported a mean aluminum concentration of 0730 gkg (range 001ndash4300 gkg) in 40 surface
soil samples from Florida Aluminum concentrations in 1903 soils samples collected from the United
States as well as the Virgin Islands Guam and Puerto Rico were reported to range from 05 to 142 gkg
with a median value of 46 gkg (Burt et al 2003) A median aluminum concentration of 18 mgkg was
reported in soils collected form 25 playgrounds located in urban Uppsala Swedenrsquos fourth largest city
(Ljung et al 2006)
Aluminum concentrations in soil also vary with different vegetation types For example aluminum
concentrations in the soils of coniferous forests are often higher than in soils of beech forests since
coniferous forests tend to have more acid soils (Brusewitz 1984) Alternate views of the data are that the
acidic soil produced by conifers can preferentially mobilize aluminum from deeper layers toward surface
soil or that conifers over beech preferentially grow in soils rich in aluminum and it is their metabolic
processes which produce more acidic soil
Concentrations of various elements in 541 streambed-sediment samples collected from 20 study areas in
the conterminous United States (1992ndash1996) were analyzed as part of the National Water-Quality
Assessment Program of the US Geological Survey Aluminum was present in all samples
concentrations ranged from 14 to 14 by weight (14ndash140 gkg) with a median of 64 by weight
(64 gkg) (Rice 1999) Mean aluminum concentrations in sediments collected in 1993 and 1994 from
Lake Erie Lake Ontario and the Niagara River ranged from 1339 to 13823 gkg dry weight (Lowe and
ALUMINUM 199
6 POTENTIAL FOR HUMAN EXPOSURE
Day 2002) Mean aluminum concentrations in sediments collected from three lakes in central Texas near
a coal-fired power plant were 532 816 and 864 in the Gibbons Creek Reservoir Hall Lake and
Yarboro Lake respectively (Menounou and Presley 2003) A mean aluminum concentration of 561 gkg
was reported in sediments form Terra Nova Bay Antarctica (Giordano et al 1999)
644 Other Environmental Media
Aluminum occurs naturally in many edible plants and is added to many processed foods The
concentrations in foods and beverages vary widely depending upon the food product the type of
processing used and the geographical areas in which food crops are grown (Brusewitz 1984 Sorenson et
al 1974) In general the foods highest in aluminum are those that contain aluminum additives (eg
processed cheese grain products and grain-based desserts) (Greger 1992 Pennington 1987 Saiyed and
Yokel 2005) Because of the variability of reported concentrations of aluminum in foods the many new
manufactured food products on the market and the increasing use of aluminum as a packaging material a
wide range of beverages and foods have been analyzed The aluminum concentrations in a number of
beverages foods and food products are listed in Table 6-4 Most unprocessed foods (with the exception
of some herbs and tea leaves) typically contain lt5 mgkg aluminum (Greger 1992 MAFF 1999
Pennington 1987 Schenk et al 1989) Concentrations of aluminum in foods generally ranged from
lt015 mgkg in eggs apples raw cabbage corn and potatoes to 695 mgkg in American cheese (Greger
1992 MAFF 1999 Pennington 1987 Schenk et al 1989) Loacutepez et al (2000) measured aluminum
concentrations in 17 different spices and aromatic herbs widely consumed in Spain and in the
Mediterranean diet concentrations ranged from 374 to 5650 mgkg dry weight in cinnamon and
oregano respectively
The high aluminum concentrations seen in some processed foods (eg processed cheeses baked goods
and nondairy cream substitutes) are likely to have been introduced into the foods as additives such as the
anti-caking agent sodium aluminosilicate which is present in salt nondairy creamers and many other
powdered materials (Table 6-4) (Saiyed and Yokel 2005 Schenk et al 1989) The most commonly used
food additives containing aluminum are acidic sodium aluminum phosphate (leavening agent in baked
goods) basic sodium aluminum phosphate (emulsifying agent in processed cheese) aluminum sulfates
(acidifying agents) bentonite (materials-handling aid) aluminum color additives (lakes) from various
food dyes and aluminum silicates (anti-caking agents) (Greger 1992 Saiyed and Yokel 2005)
ALUMINUM 200
6 POTENTIAL FOR HUMAN EXPOSURE
Table 6-4 Estimated Aluminum Concentrations of Selected Foods
Aluminum Foods concentration Reference Beverages (mgL)
Fruit juices (eg orange reconstituted 0043ndash4130 Schenk et al 1989 lemon peach) Soft drinks (eg ginger ale diet cola) 0103ndash2084 Schenk et al 1989 Alcoholic beverages (eg beer wine 0067ndash320 Schenk et al 1989 wine coolers champagne) Spirits (eg brandy vodka whiskey) 0148ndash0635 Schenk et al 1989 Tea steeped from tea bags 0424ndash2931 Schenk et al 1989 Teas (1 extract) 0378ndash355 Schenk et al 1989 Herbal teas (1 extract) 014ndash1065 Schenk et al 1989 Instant coffee (1 solution) 002ndash0581 Schenk et al 1989 Whole coffee (3 extract) 0235ndash1163 Schenk et al 1989 Beverages 13a MAFF 1999
Animal products (mgkg) Beef cookeda 02 Greger et al 1985 Cheese (eg Swiss cheddar bleu) 383ndash141 Schenk et al 1989 Cheese (eg cottage cheddar Swiss) 012ndash19 Pennington 1987 Cheese American 411ndash695 Pennington 1987 Cheese processed 297 Greger et al 1985 Chicken with skin cookeda 07 Greger et al 1985 Egg chicken 0107 Schenk et al 1989 Eggs scrambled 2865 Schenk et al 1989 Eggs cookeda 01 Greger et al 1985 Eggs 014 MAFF 1999 Fish (cod) cookeda 04 Greger et al 1985 Fish salmon 544 Schenk et al 1989 Fish herring 0127 Schenk et al 1989 Fish 61 MAFF 1999 Ham cookeda 12 Greger et al 1985 Meat products 19 MAFF 1999 Milk whole 006ndash2 Pennington 1987 Milk (skim whole and powdered) 0028ndash79 Schenk et al 1989 Milk 007 MAFF 1999 Poultry 03 MAFF 1999 Salami 112 Pennington 1987 Yoghurt plain low-fat 112 Pennington 1987 Yoghurt strawberry sweetened 063 Pennington 1987
Fruits (mgkg) Apple fresh 014 Pennington 1987
ALUMINUM 201
6 POTENTIAL FOR HUMAN EXPOSURE
Table 6-4 Estimated Aluminum Concentrations of Selected Foods
Aluminum Foods concentration Reference
Banana fresh 005 Pennington 1987 Grapes fresh 181 Pennington 1987
Peaches fresh 051 Pennington 1987 Raisins dried 308 Pennington 1987 Strawberries fresh 225 Pennington 1987 Fresh fruit 029 MAFF 1999 Fruit products 082 MAFF 1999
Grains (mgkg) Biscuits baking powder refrigerated 163 Pennington 1987 type Bread white 0351 Schenk et al 1989 Bread white 233 Pennington 1987 Bread whole wheat 291 Pennington 1987 Bread pumpernickel 132 Schenk et al 1989 Bread 66 MAFF 1999 Cereal (eg Post Raisin Branreg Malt-o- 0040ndash2933 Schenk et al 1989 Meal Wheat Cerealreg) Miscellaneous cereals 52 MAFF 1999 Corn chips 123 Pennington 1987 Cornbread homemade 400 Pennington 1987 Muffin blueberry 128 Pennington 1987 Oatmeal cooked 068 Pennington 1987 Oats 221ndash418 Schenk et al 1989 Rice cookeda 17 Greger et al 1985 Rice yellow Rice-a-Ronireg 197 Schenk et al 1989 Spaghetti cookeda 04 Greger et al 1985
Vegetables and legumes (mgkg) Asparagus 44 Greger et al 1985 Beans green cookeda 34 Greger et al 1985 Beans navy boiled 206 Pennington 1987 Cabbage raw 01 Greger et al 1985 Cauliflower cookeda 02 Greger et al 1985 Corn boiled 01 Pennington 1987 Cucumber fresh pared 011 Pennington 1987 Green vegetables 31 MAFF 1999 Lettuce 06 Greger et al 1985 Lettuce 008 Schenk et al 1989 Peanut butter 20 Greger et al 1985 Peanut butter natural 629 Schenk et al 1989 Peas cookeda 19 Greger et al 1985
ALUMINUM 202
6 POTENTIAL FOR HUMAN EXPOSURE
Table 6-4 Estimated Aluminum Concentrations of Selected Foods
Aluminum Foods concentration Reference
Potatoes unpeeled boileda 01 Greger et al 1985 Potatoes unpeeled baked 24 Greger et al 1985 Potato red 363 Schenk et al 1989 Potato sweet 101 Schenk et al 1989 Potatoes 09 MAFF 1999 Spinach cookeda 252 Greger et al 1985 Tomatoes cookeda 01 Greger et al 1985 Other vegetables 27 MAFF 1999 Canned vegetables 097 MAFF 1999
Herbs and spices (mgkg dry weight) Basil 2480ndash2730 Loacutepez et al 2000 Cinnamon 1854ndash5650 Loacutepez et al 2000 Garlic 1360ndash1525 Loacutepez et al 2000 Mustard 3040ndash3856 Loacutepez et al 2000 Nutmeg 2281ndash2480 Loacutepez et al 2000 Oregano 374ndash4041 Loacutepez et al 2000 Pepper black 579ndash2441 Loacutepez et al 2000 Thyme 635ndash790 Loacutepez et al 2000
Other food products (mgkg) Baking powder commercial (Na Al 20000ndash26000 Sorenson et al 1974 sulfate containing) Candy milk chocolate 684 Pennington 1987 Chocolate cookie Oreoreg 127 Schenk et al 1989 Cocoa 45 Greger et al 1985 Nondairy creamer 257ndash943 Schenk et al 1989 Nuts 40 MAFF 1999 Oils and fats 11 MAFF 1999 Pickles with aluminum additives 392b Greger et al 1985 Pickles 0126ndash997 Schenk et al 1989 Salad dressing Kraft Miracle Whipreg 37 Schenk et al 1989 Salt with aluminum additives 164 Greger et al 1985 Salt 313ndash366 Schenk et al 1989 Soup 0032ndash36 Schenk et al 1989 Sugars and preserves 27 MAFF 1999
aFood not cooked or stored in aluminum pans trays or foil
ALUMINUM 203
6 POTENTIAL FOR HUMAN EXPOSURE
Commercially available teas contain high concentrations of aluminum 30ndash45 of this aluminum may be
dissolved into an infusion of tea (Dong et al 1999) Aluminum concentrations ranging from 02 to
95 mgL have been reported in tea (Baxter et al 1989 Flaten and Odegard 1988 Koch et al 1989
Schenk et al 1989 Muumlller et al 1998 Pennington 1987 Pennington and Jones 1989 Kralj et al 2005
Mehra et al 2007) Fairweather-Tait et al (1987) reported that approximately one-third of the aluminum
in commercially available tea leaves was extracted into the tea (10 g tea100 mL water) aluminum
concentrations ranged from 27 to 49 mgL in the tea after 5 minutes Fimreite et al (1997) reported
aluminum concentrations of 4ndash5 mgL in tea after 10 minutes Schenk et al (1989) reported that herbal
teas contain lower concentrations of aluminum than ordinary tea (0140ndash1065 mgL) Total aluminum
concentrations in black green and red tea infusions ranging from 05 to 40 mgL with 10ndash35 of the
total aluminum from an anion-exchange column as aluminum citrate The remaining aluminum which
was strongly retained by the column likely corresponds to aluminum species bound to penolic
compounds Addition of lemon or milk was found to change the distribution of the aluminum species in
the tea infusions (Kralj et al 2005)
Brewed coffee (3 extract) and instant coffee (1 solution) contain aluminum concentrations of 0235ndash
1163 and 002ndash0581 mgL respectively (Schenk et al 1989) Aluminum concentrations ranging from
01 to 034 mgL have been reported in coffee (Koch et al 1989 Muumlller et al 1998) Another report
provided aluminum concentration in coffee beans ranging from 11 to 21 mgkg (Koch et al 1989) The
aluminum content of ground coffee beans has been measured at 518 mgkg (Lione et al 1984) Loacutepez et
al (2000) reported aluminum concentrations in coffee ranging from 2560 to 2908 mgkg dry weight
Muumlller et al (1998) reported an aluminum concentration of 19 mgkg dry weight in ground coffee Lione
et al (1984) estimated that brewing coffee in a new aluminum pot can add from 088 mg (immediately
after brewing) to 118 mg aluminum (after 12-hour storage in the pot and subsequent reheating) to each
cup
Aluminum concentrations in wines and spirits were 0388ndash32 and 0148ndash0635 mgL respectively
(Schenk et al 1989) Lopez et al (1998) reported mean aluminum concentrations in alcoholic beverages
consumed in Spain concentrations were 948ndash16826 365ndash7952 and 157ndash7396 IgL in wine beer
and other alcoholic beverages (cider brandy rum whisky gin anisette and liquor) respectively
In fiscal years 19851986 the FDA conducted a survey of elements in fresh clams and oysters collected
from US coastal areas in use for shellfish production (Capar and Yess 1996) The average concentration
(wet weight basis) of aluminum found in the four shellfish categories surveyed were clams (hardshell)
ALUMINUM 204
6 POTENTIAL FOR HUMAN EXPOSURE
23plusmn23 mgkg (n=74) clams (softshell) 115plusmn110 mgkg (n=59) Eastern oyster 33plusmn26 mgkg (n=104)
and Pacific oyster 30plusmn28 mgkg (n=46) Cod and bluefin tuna from the Northwest Atlantic Ocean
contained an average of 1 and 04 mgkg of aluminum respectively in muscle tissue (Hellou et al 1992a
1992b)
Cooking foods in aluminum pots and pans or storing foods in aluminum foil or cans may increase the
aluminum content in some foods since aluminum may dissolve when in contact with a salty acidic or
alkaline food (Abercrombie and Fowler 1997 Greger et al 1985 King et al 1981 Muller et al 1993b
Nagy and Nikdel 1986) Aluminum concentrations in precooked foods (eg applesauce green beans
beef eggs ham pudding rice and tomato sauce) ranged from lt01 to 216 mgkg while concentrations
in the foods after cooking in conditioned aluminum pans and stainless steel pans ranged from 024 to
125 mgkg and from lt01 to 34 mgkg respectively (Greger et al 1985) Acidic foods such as tomatoes
tomato sauce and applesauce especially when cooked for gt15 minutes tended to accumulate more
aluminum than other foods (Greger et al 1985) Greger et al (1985) also reported that foods cooked in
new aluminum cookware had higher aluminum concentrations than foods cooked in old aluminum
cookware or aluminum cookware that had been treated to simulate use In addition the aluminum
concentrations in the foods prepared in any aluminum cookware (old new or treated to simulate use) had
higher aluminum concentrations than the same foods cooked in stainless steel cookware A study by Lin
et al (1997) noted that cooking with aluminum utensils may be an important aluminum exposure source
for patients with chronic renal disease
Abercrombie and Fowler (1997) reported in a small sampling of canned drinks stored at 15ndash20 degC the
aluminum content ranged from lt01 to 74 mgkg depending on the product and storage time This study
concluded that there appeared to be little basis for concern about the ingestion of aluminum when the
internal protective coating of cans remains intact the cans are stored properly and the contents are
consumed in a reasonable period of time Fairweather-Tait et al (1987) reported mean aluminum
concentrations in Coca-Colareg and Pepsi-Colareg of 009 and 005 Igg respectively Average aluminum
concentrations in various beverages purchased in Australia New Zealand and Thailand were 090 and
015 in non-cola soft drinks in aluminum cans and glass bottles respectively and 066 and 024 in cola
drinks in aluminum cans and glass bottles respectively Aluminum concentrations averaged 016 mgL in
beer in either aluminum cans or glass bottles (Duggan et al 1992) Muller et al (1993b) reported
migration of aluminum from aluminum cans (unlacquered) into Coca-Colareg (pH 25) and diet Coca-
Colareg (pH 30) and that the concentration of aluminum increased as the storage period increased
Concentrations of aluminum ranged from 46 to 170 IgL in Coca-Colareg (storage for 40ndash101 days) and
ALUMINUM 205
6 POTENTIAL FOR HUMAN EXPOSURE
from 14 to 250 IgL in diet Coca-Colareg (storage for 44ndash173 days) respectively Vela et al (1998)
examined the change in aluminum concentration in beer packaged in aluminum cans over time Two
brands of beer stored at 5 degC showed little change in aluminum concentration over 5 months However
when stored at 23 degC the concentrations increased from 500 to 5465 IgL and from 1080 to 4140 IgL
for the two brands of beer after 5 months Joshi et al (2003) studied the potential for the migration of
aluminum into commercial sauces packaged in aluminum pouches The results of this study indicated
that after 45 days at 22 and 50 degC samples showed only minor changes in aluminum content as compared
to fresh samples
Aluminum concentrations of 06ndash37 and 01ndash04 mgg were reported in four different types of tobacco
and two samples of cannabis respectively (Exley et al 2006) Various elements were determined in
tobacco used in the manufacture of 12 brands of cigarettes in the United States aluminum concentrations
ranged from 0699 to 12 mgg (Iskander et al 1986)
Aluminum compounds are also used extensively in the manufacture of cosmetics (eg aluminum
hexahydrate in deodorants) and in medical treatments (eg aluminum hydroxide in antacids to control
gastric hyperacidity or aluminum oxide in dental ceramic implants) (Brusewitz 1984 FDA 2002 NIH
2004 NRC 1982) Many antacids contain 300ndash600 mg aluminum hydroxide (approximately 104ndash208 mg
of aluminum) per tabletcapsule5 mL dose (Zhou and Yokel 2005) Lione (1985a) reported aluminum
contentdose (single tablet or 5 mL liquid) for antacids internal analgesics (buffered aspirins)
antidiarrheals and anti-ulcerative drugs The aluminum content per dose (single tablet or 5 mL liquid)
ranged from 35 to 208 mg for antacids 9ndash52 mg for buffered aspirins 36ndash1450 mg for antidiarrheal
drugs and 207 mg for an anti-ulcerative drug Potential daily aluminum dosage ranged from 126 to
5000 mg for these medications (Lione 1985a) Aluminum hydroxide (1ndash5) is found in car polishes and
paints and aluminum chlorohydrate (gt1ndash20) is found in antiperspirants and deodorants (NIH 2004)
Fernandez-Lorenzo et al (1999) reported mean aluminum concentrations of 2259 (8ndash1149) 690 (20ndash
204) and 1525 (104ndash201) IgL in infant formulas whole cows milk and soy milk respectively in a
study in Spain Ikem et al (2002) reported mean aluminum concentrations of 58 92 and 150 IgL in
milk-based powdered formulas from Nigeria the United Kingdom and the United States respectively
Mean aluminum concentrations of 101 and 460 IgL were reported for milk-based liquid formulas from
the United Kingdom and soy-based powder formulas from the United States respectively Daily intakes
of aluminum for infants in the United States were estimated to be 97 573 and 361 Igday for milk-based
powder formulas soy-based powder formulas and hypoallergenic powder formulas from the United
ALUMINUM 206
6 POTENTIAL FOR HUMAN EXPOSURE
States (Ikem et al 2002) Navarro-Blasco and Alvarez-Galindo (2003) reported aluminum concentrations
in soy-based infant formulas from Spain that ranged from 313 to 3479 IgL with a mean of 930 IgL
Mean aluminum concentrations in other types of Spanish infant formula were 499 237 252 292 574
687 and 453 IgL for preterm formula non-adapted starter formula adapted starter formula follow-up
formula lactose-free formula hypoallergenic formula and inform error diet formula respectively
Aluminum concentrations were determined in infant formulas and food in Turkey (Sipahi et al 2006)
Aluminum concentrations in cereal- milk- cereal plus milk-based baby food were reported to be 643
802 and 743 333 and 1315 Igg respectively Aluminum concentrations in starches and rice flours
traditionally used in baby foods were also reported as 333 and 1315 Igg respectively (Sipahi et al
2006)
Older reports on aluminum concentrations in infant formulas are also available however it is not known
if these values would be necessarily representative of aluminum levels in infant formulas currently on the
market and available to consumers Aluminum concentrations in cowrsquos milk-based infant formulas
generally ranged from 4 to 700 IgL and from 5 to 2500 IgL in soy-based infant formulas (Baxter et al
1989 1990 1991 Bloodworth et al 1991 Simmer et al 1990) Average aluminum concentrations in
infant formula from Canada were 0129 0217 and 0717 Igg in ready-to-use concentrated and powder
milk-based infant formulas respectively Aluminum concentrations in Canadian soy-based formulas
were 198 141 and 944 Igg in ready-to-use concentrated and powder milk-based infant formulas
respectively (Dabeka and McKenzie 1990)
The median aluminum level in breast milk collected from 12 Canadian women was reported to be
14 IgL (range lt5ndash45 IgL) (Koo et al 1988) In an Australian study Weintraub et al (1986) reported
human breast milk concentrations of 30 IgL Simmer et al (1990) reported a mean aluminum
concentration of 49 IgL in breast milk collected from Australian women Hawkins et al (1994) reported
a mean breast milk aluminum concentrations of 92 IgL collected from 15 nursing mothers in the United
Kingdom In a study of Croatia women an average aluminum concentration in breast milk was 380 IgL
with a range of 4 to 2670 IgL (Mandie et al 1995) Fernandez-Lorenzo et al (1999) reported mean
aluminum concentrations of 239 IgL (range 7ndash42 IgL) in human milk in a study in Spain Baxter et al
(1991) reported a mean aluminum concentration of 27 IgL (range 3ndash79 IgL) in a study in the United
Kingdom
Concentrations of aluminum in whole blood and plasma have been reported to range from 014 to
624 mgL and from 013 to 016 mgL respectively (Sorenson et al 1974) Aluminum concentrations in
ALUMINUM 207
6 POTENTIAL FOR HUMAN EXPOSURE
serum have been reported as 146 and 024 mgL using neutron activation and atomic absorption analysis
respectively (Berlyne et al 1970) An aluminum concentration in serum of 0037 mgL was reported
using flameless atomic absorption analysis (Fuchs et al 1974) Versieck and Cornelis (1980) discussed
the possibility of aluminum contamination in blood and plasma samples from some of these early studies
This may question the reliability of aluminum levels reported in some older reports House (1992)
reported a geometric mean aluminum concentration of 00267 mgL in serum and plasma for 71 office
employees who were not occupationally exposed to aluminum Mean plasma or serum aluminum
concentrations were reported from various studies ranging from 00016 to 0035 mgL (House 1992)
Drablos et al (1992) analyzed aluminum serum concentrations in 230 nonexposed workers (controls) and
reported a mean aluminum serum concentration of 0005 mgL Nieboer et al (1995) reviewed 34 studies
on aluminum concentrations in serum or plasma and also reported that aluminum serum concentrations in
the general population were typically lt001 mgL In an investigation of workers at an open bauxite mine
in Surinam serum aluminum concentrations of 24 men working in the mine for an average of 24 years
were low and not statistically different from controls (de Kom et al 1997) Razniewska and Trzcinka-
Ochocka (2003) reported mean aluminum concentrations of 099 and 975 IgL in serum and urine
respectively in 18 healthy subjects not using medications containing aluminum
A mean aluminum concentration of 2321 IgL (range 598ndash20693 IgL) was reported in serum samples
collected form 533 female children (6ndash8 years old) living in Riyadh City Saudi Arabia (Al-Saleh and
Shinwari 1996) Hawkins et al (1994) reported plasma aluminum concentrations in infants fed various
formulas and breast milk A mean plasma aluminum concentration of 86 IgL was reported in breast fed
infants mean aluminum concentrations in plasma of infants fed various formulas ranged from 92 to
152 IgL Mean aluminum plasma concentrations of 99 84 and 134 IgL in breastfed infants at birth
1 month and 3 months of age respectively Infants on soy-based infant formulas containing 1600ndash
1700 IgL of aluminum were reported to have mean aluminum plasma concentrations of 82ndash124 76ndash
85 and 108ndash124 IgL at birth 1 month and 3 months of age respectively (Litov et al 1989)
Aluminum concentrations in the urine can serve as an indicator of increased exposure to aluminum
because a large proportion of ingested aluminum passes quickly through the body Drablos et al (1992)
analyzed aluminum urine concentrations in 230 nonexposed workers (controls) and reported a mean
aluminum urine level of 0005 mgL (range 0001ndash0037 mgL) Nieboer et al (1995) reviewed eight
studies on aluminum concentrations in urine and reported that aluminum urine concentrations in healthy
individuals typically ranged from 00027 to 00081 mgL In a Finnish study of aluminum in urine from
3212 occupationally exposed workers mostly aluminum welders between 1993 and 1996 the average
ALUMINUM 208
6 POTENTIAL FOR HUMAN EXPOSURE
annual urinary aluminum level was 14 ImolL (0038 mgL) and the range was 108ndash204 ImolL
(0029ndash0055 mgL) (Valkonen and Aitio 1997) The samples collected as part of a routine occupational
health program were collected after the weekend as a morning specimen The mean urinary aluminum
concentration in 44 nonexposed persons who did not use antacid preparations was 033 ImolL
(00089 mgL) and the range and standard deviation were 007ndash082 ImolL (0002ndash0022 mgL) and
018 ImolL (00022 mgL) respectively The mean serum aluminum concentration of 21 of these
nonexposed individuals was 006 ImolL (00016 mgL) and the range and standard deviation were 002ndash
013 ImolL (00005ndash00035 mgL) and 003 ImolL (00008 mgL) respectively Drablos et al (1992)
studied aluminum concentrations in workers at an aluminum fluoride plant Mean aluminum
concentrations in urine were 0011 mgL (range 0002ndash0046 mgL) for 15 plant workers 0032 mgL
(range 0006ndash0136 mgL) for 7 foundry workers and 0054 mgL (range 0005ndash0492 mgL) for
12 potroom workers as compared to 0005 mgL (range 0001ndash0037 mgL) for 230 unexposed controls
Mean aluminum concentrations were 506 and 374 IgL in blood and 656 and 635 IgL in urine of
103 workers in the optoelectronic industry and 67 controls respectively (Liao et al 2004) Pre- and
postshift average aluminum concentrations in urine ranging from 013 to 0153 mgL were reported in
welders from the construction industry (Buchta et al 2005) Aluminum concentrations in human breast
tissue and breast tissue fat of 4ndash437 nmolg (01ndash12 Igg) dry weight and 3ndash192 nmolg oil (008ndash
518 Igg oil) respectively have been reported (Exley et al 2007)
Nieboer et al (1995) reported background concentrations of aluminum in bone of 1ndash3 Igg dry weight
Background aluminum concentrations in brain tissues (primarily grey matter) of healthy individuals
typically ranges from 1 to 3 Igg dry weight or lt05 Igg wet weight (Nieboer et al 1995) Markesbery
et al (1984) determined trace element concentrations in various human brain regions in infants through
adults Aluminum concentrations were shown to increase with increasing age Mean aluminum
concentrations in adults were 0467 Igg wet weight as compared to 0298 Igg wet weight in infants
Overall aluminum concentrations ranged from 0050 to 305 Igg with the highest mean aluminum
concentrations in the globus pallius (0893 Igg) and the lowest in the superior parietal lobule
(0282 Igg)
Metal concentrations were determined in spermatozoa and seminal plasma from men working in two
industrial companies a refinery and a polyolefin factory 40 km east of Helsinki Finland and from sperm
bank donor candidates from Helsinki Finland in 1994 Aluminum concentrations in the factory
employees were 093 and 054 mgkg in spermatozoa and seminal plasma respectively and were
252 and 087 mgkg in spermatozoa and seminal plasma respectively in the donor candidates The
ALUMINUM 209
6 POTENTIAL FOR HUMAN EXPOSURE
authors attributed the lower concentrations in the factory workers to good quality of occupational
protection in the factories In addition the factory employees lived in the countryside as compared to the
donor candidates who lived in a more urban area (Hovatta et al 1998) Mean aluminum concentrations
in seminal plasma of 2200 1530 and 270 IgL were reported in samples collected from men working in
smelter refinery and chemical industries respectively A mean concentration of 460 IgL was reported
in hospital workers (control group) (Dawson et al 2000) Mean aluminum concentrations ranged from
180 to 1010 IgL in seminal plasma collected from 64 apparently healthy men (21ndash35 years of age)
recruited from the University of Texas (Dawson et al 1998) A mean aluminum concentration of
150 IgL was reported in sweat collected from the arms of 15 normal healthy subjects while exercising
(Omokhodion and Howard 1994) Sighinolfi et al (1989) reported aluminum concentration ranging from
25 to 102 IgL in human saliva
Aluminum concentrations in hair ranging from 01 to 36 Igg have been reported (Alder et al 1976
Caroli et al 1994) Imahori et al (1979) measured various elements in 202 human hair samples collected
from a local population in the Tokyo metropolitan area Aluminum was detected in 95 and 99 of the male
and female hair samples respectively Mean aluminum concentrations were 137 mgkg (range lt024ndash
650 mgkg) and 136 mgkg (lt193ndash671 mgkg) in male and female hair samples respectively
Kobayashi et al (1989) reported mean hair aluminum concentrations of 39 and 62 Igg in patients with
senile dementia of Alzheimer type and a control group respectively Shore and Wyatt (1983) reported
aluminum concentrations of 75 and 62 ppm (Igg) in hair from patients with Alzheimers disease and
age-matched (nondemented) controls respectively Elemental concentrations were determined in hair
from children (6ndash15 years old) living in environmentally degraded districts of the East Aral Sea region
(Kazakhstan and Uzbekistan) Mean aluminum concentrations were 895 and 1136 mgkg in samples
collected from two regions Kazalinsk and Zhanakorgan respectively (Chiba et al 2004) Wilhelm et al
(1989) reported that use of hair analysis as an indicator of systematically incorporated metals may not be
reliable since endogenous metal concentrations in hair may be masked by the uptake of metals including
aluminum from exogenous sources
Human albumin solutions and other biological products intended for human use may contain aluminum
because aluminum compounds are used in their manufacture or as a result of contamination In albumin
products aluminum is generally introduced as a contaminant from filters filter aides buffer solutions
and anticoagulants as well as the container itself The aluminum level in a 5 pooled human albumin
solution was 0507 IgmL (Progar et al 1996)
ALUMINUM 210
6 POTENTIAL FOR HUMAN EXPOSURE
Metal concentrations were measured in two lichen species (Parmelic conspersa and Xanthoria calcicola)
from the island of Vulcano and around Mt Etna Sicily Aluminum concentrations were 14619 and
17964 mgkg dry weight in lichens collected near Mt Etna and Vulcano respectively (Varrica et al
2000)
Mean aluminum concentrations in the soft tissues of zebra mussels (Dreissena polymorpha) collected in
1993 and 1994 from Lake Erie Lake Ontario and the Niagara River ranged from 232 to 5030 mgkg dry
weight (Lowe and Day 2002) Whole fish composites were analyzed for various metals as part of a
survey of 167 lakes in the northeastern United States as part of the Environmental Monitoring and
Assessment Program (1992ndash1994) a mean aluminum concentration of 826 mgkg wet weight (range
026ndash1145 mgkg wet weight) was reported (Yeardley et al 1998) Aluminum concentrations ranged
from 2 to 4 mgkg dry weight in the livers of various seabirds collected from the northern Pacific Ocean
in 1992 (Elliott 2005) Mean aluminum concentrations in the feathers of nestling black-crowned night-
herons in the Chesapeake and Delaware Bays ranged from 918 to 7885 mgkg dry weight (Golden et al
2003)
An aluminum concentration of 25948 mgkg was reported in house dust from residences in Ottawa
Canada (Butte and Heinzow 2002)
65 GENERAL POPULATION AND OCCUPATIONAL EXPOSURE
Since aluminum is ubiquitous in the environment the general population will be exposed to aluminum by
inhalation of ambient air and the ingestion of food and water Pennington and Schoen (1995) reported
average daily intakes of 8ndash9 and 7 mgday for adult men and woman respectively based on an FDA
Total Diet Study According to the 1997 total diet study conducted by the Food Standards Agency the
average UK population dietary exposure to aluminum was estimated to be 34 mgday (MAFF 1999)
Greger (1992) estimated that most adults consume 1ndash10 mg aluminum per day from natural sources
Biego et al (1998) reported a daily average intake for aluminum of 42 mg in a study in France Food
additives containing aluminum including preservatives coloring agents anticaking agents and leavening
agents are major dietary sources of aluminum in the United States (Saiyed and Yokel 2005 Soni et al
2001)
In a report on FDAs Total Diet Study the foods highest in aluminum were those suspected of containing
aluminum additives (eg processed cheese grain products and grain-based desserts) (Pennington 1987)
ALUMINUM 211
6 POTENTIAL FOR HUMAN EXPOSURE
Measured daily dietary intakes of aluminum were reported to range from 2 to 14 mgday The major
contributors to aluminum in the diet are grain products (24ndash49) dairy products (17ndash36) desserts (9ndash
26) and beverages (5ndash10) (Pennington 1987) FDA revised their Total Diet Study in 1991 to reflect
current food consumption patterns and to include additional sex-age groups (Pennington and Schoen
1995) Dietary intakes ranged from 07 mgday for infants to 115 mgday for 14ndash16-year-old males The
aluminum intake of adult males ranged from 8 to 9 mgday and that for adult females was about
7 mgday Dietary intakes for 2- 6- and 10-year-old children were 46 65 and 68 mgday respectively
Aluminum intakes per kilogram of body weight were 010 mgkg for infants 035 mgkg for 2-year-old
children and 030 mgkg for 10-year-old children The other sex age groups had aluminum intakes of
010ndash015 mgkg except for 14ndash16-year-old males who had an aluminum intake of 018 mgkg Principal
sources for aluminum were milk and diary products (36) fish and crustaceans (29) cereals (16)
and vegetables (8)
Saiyed and Yokel (2005) reported the aluminum content in various foods in the United States with
aluminum food additives Cheese from a frozen pizza was reported to contain up to 14 mg of aluminum
from basic sodium aluminum phosphate An equivalent amount of cheese from a ready-to-eat restaurant
pizza contained 003ndash009 mg of aluminum Up to 15 mg of aluminum were found in single serving
packets of nondairy creamer containing sodium aluminosilicate Products such as baking powder
pancake and waffle mixes and ready-to-eat pancakes contained up to 180 mg of aluminum per serving
(Saiyed and Yokel 2005)
Cooking in aluminum containers often results in statistically significant but not biologically important
increases in the aluminum content of some foods In one study increases in the aluminum content of
foods after contact with aluminum utensils were lt1 mgkg for 47 of the food examined and lt10 mgkg
for 85 of the food examined (Pennington and Schoen 1995) The migration of aluminum from
cookware into food will increase with the acidity of the food and the duration of exposure For example
red current juice was prepared by boiling berries for 3 hours in either an aluminum or stainless steel pot
The aluminum concentrations of the juice prepared in the aluminum pot was 891 mgL whereas the juice
prepared in the stainless steel pot was 183 mgL (Valkonen and Aitio 1997) Aluminum was also shown
to migrate into fish baked on aluminum foil Increases in aluminum concentration ranged from a factor of
2 for saithe fillets baked on aluminum foil without added ingredients (010ndash021 mgkg) to a factor of
about 70 for mackerel fillets grilled on aluminum foil with onion rings and mixed spices (007ndash
504 mgkg) The migration of aluminum into foods appeared to be dependent on factors such as
temperature duration of cooking the composition and pH of the food and the presence of other
ALUMINUM 212
6 POTENTIAL FOR HUMAN EXPOSURE
substances (eg organic acids and salt) (Ranau et al 2001) A study by Lin et al (1997) noted that
cooking with aluminum utensils may be an important aluminum exposure source for patients with chronic
renal disease
The intake of aluminum in foods is low compared with the amount of aluminum consumed when taking
aluminum-containing medication such as antacids buffered aspirins antidiarrheal agents and certain
anti-ulcer drugs at their recommended dosages (Lione 1983 1985a Pennington and Schoen 1995 Soni et
al 2001 Zhou and Yokel 2005) Antacids and buffered aspirin which are often taken in multiple daily
doses for prolonged periods contain 4ndash562 mgkg of aluminum (Lione 1983 Schenk et al 1989 Shore
and Wyatt 1983) For example according to Pennington and Schoen (1995) buffered aspirin may
contain 10ndash20 mg of aluminum per tablet Many antacids contain 300ndash600 mg aluminum hydroxide
(approximately 104ndash208 mg of aluminum) per tabletcapsule5 mL dose (Zhou and Yokel 2005) Other
exposures to aluminum can occur through the use of cosmetics and other consumer products containing
aluminum compounds (Lewis 2001 NIH 2004 OrsquoNeil et al 2001)
Pennington and Schoen (1995) reported average daily intakes of 8ndash9 and 7 mgday for adult men and
woman respectively based on an FDA Total Diet Study According to the 1997 total diet study
conducted by the Food Standards Agency the average UK population dietary exposure to aluminum was
estimated to be 34 mgday (MAFF 1999) Biego et al (1998) reported a daily average intake for
aluminum of 42 mg in a study in France
Lione (1985a) estimated that 126ndash728 and 840ndash5000 mg were possible daily doses of aluminum
consumed in buffered aspirins and antacids products respectively These doses are from 6 to almost
40 times and 42ndash250 times greater respectively than aluminum doses obtained from consumption of
food When large oral loads of aluminum (1000ndash4000 mgday) in the form of antacids are ingested
some of this excess aluminum is absorbed usually lt1 of the intake amount in healthy individuals
(Gorsky et al 1979 Kaehny et al 1977 Reiber et al 1995)
Median concentrations of aluminum in drinking water not receiving coagulation treatment and that
receiving coagulation treatment have been reported as 0043 and 0112 mgL respectively (Miller et al
1984a) If the total dose of aluminum obtained from water is calculated based on an estimated
consumption of 14 Lday the amount of aluminum ingested would respectively be 006 and 016 mgday
or roughly 1 of the 7ndash9 mgday for adults from dietary sources
ALUMINUM 213
6 POTENTIAL FOR HUMAN EXPOSURE
While the intake of aluminum is mainly through the ingestion of food and drinking water inhalation of
ambient air represents a small contribution to an individualrsquos exposure to aluminum (Browning 1969)
Background concentrations of aluminum in the atmosphere generally range from 0005 to 018 Igm3 in
the United States (Hoffman et al 1969 Sorenson et al 1974) If the inhalation rate is taken to be
20 m3day then the total amount of aluminum obtained from inhalation of 018 Igm3 would be
36 Igday suggesting that ambient air is not normally a major exposure pathway for aluminum This is
negligible compared with the estimated dietary intake for adults of 7ndash9 mgday However the aluminum
content of air in urban and industrial areas has been reported to be considerable higher ranging from
04 to 80 Igm3 (Cooper et al 1979 Dzubay 1980 Kowalczyk et al 1982 Lewis and Macias 1980
Moyers et al 1977 Ondov et al 1982 Pillay and Thomas 1971 Sorenson et al 1974 Stevens et al
1978) If the inhalation rate is taken to be 20 m3day then the total amount of aluminum inhaled would
range from 8 to 160 Igday which is still negligible compared with the aluminum intake from dietary
sources Dusts arising from soil especially in industrial or agricultural areas (Eisenreich 1980) and from
the metal surfaces of air conditioners can contain large amounts of aluminum (Crapper McLachlan 1989)
resulting in high localized concentrations and subsequently in higher exposures Typically however for
the general population inhalation is likely to be less important as an exposure pathway than is dietary
exposure to aluminum but may represent a source of greater exposure in some urban environments
Occupational exposure to aluminum occurs not only in the refining of the primary metal but also in
secondary industries that use aluminum products (eg aircraft automotive and metal products) and
aluminum welding (Nieboer et al 1995) Three major steps are involved in primary aluminum
production Aluminum is first extracted with caustic soda from bauxite ore precipitated as aluminum
hydroxide and subsequently converted to aluminum oxide in a calcination process In the second step
the oxide is dissolved in molten cryolite (Na3AlF6) and electrolyzed to yield the pure molten metal The
electrolytic cells are called pots and the work area is called the potroom Casting is the final step in the
process where molten aluminum is poured into ingots in the foundry Exposure is primarily to aluminum
hydroxide and oxide in the initial extraction and purification process to aluminum oxide and aluminum
fluoride in the potroom (as well as to tar-pitch volatiles including PAHs) and to partially oxidized
aluminum metal fumes in the foundry (Drablos et al 1992 IARC 1984 Nieboer et al 1995)
Most of the studies of occupational exposure (aluminum refining and metal industry workers) to
aluminum have dealt with inhalation of aluminum-containing dust particles Rarely is a worker exposed
solely to aluminum-containing dust exposure to mixtures of aluminum with fine respirable particles or
other toxic chemicals is more prevalent For example it had been observed that the incidence of bladder
ALUMINUM 214
6 POTENTIAL FOR HUMAN EXPOSURE
cancer was unusually high among aluminum reduction workers An epidemiological study showed that
volatile PAHs in coal tar pitch however were the actual causative agents (Theriault et al 1984a)
Synergism among metal dusts fine particles toxic chemicals including PAHs and cigarette smoke is a
highly plausible cause of skin irritation and cancers appearing in workers for many industrial processes
involving aluminum
According to the National Occupational Exposure Study (NOES) conducted by NIOSH from 1981 to
1983 the industries with the largest numbers of workers potentially exposed to aluminum and aluminum
compounds include plumbing heating and air conditioning masonry and other stonework electrical
work machinery except electrical certified air transportation equipment electrical components
fabricated wire products general medical and surgical hospitals industrial buildings and warehouses and
special dies tools jigs and fixtures (NIOSH 1991)
A group of 44 aluminum welders in the train body and truck trailer construction industry were monitored
for aluminum exposure (Buchta et al 2005) Median aluminum concentrations of 56 mgm3 (range 0ndash
315 mgm3) and 45 mgm3 (range 13ndash156 mgm3) in respirable dust in air were reported in welding
fumes in 1999 and 2001 respectively Median aluminum concentrations in aluminum welders were
1527 IgL (range 29ndash6563 IgL) and 1455 IgL (range 50ndash6563 IgL) in urine in pre- and
post-shift samples in 2001 respectively Median aluminum concentrations in aluminum welders were
106 IgL (range 33ndash403 IgL) and 143 IgL (range 38ndash510 IgL) in plasma in pre- and post-shift
samples in 2001 respectively (Buchta et al 2005)
66 EXPOSURES OF CHILDREN
This section focuses on exposures from conception to maturity at 18 years in humans Differences from
adults in susceptibility to hazardous substances are discussed in Section 37 Childrenrsquos Susceptibility
Children are not small adults A childrsquos exposure may differ from an adultrsquos exposure in many ways
Children drink more fluids eat more food breathe more air per kilogram of body weight and have a
larger skin surface in proportion to their body volume A childrsquos diet often differs from that of adults
The developing humanrsquos source of nutrition changes with age from placental nourishment to breast milk
or formula to the diet of older children who eat more of certain types of foods than adults A childrsquos
behavior and lifestyle also influence exposure Children crawl on the floor put things in their mouths
ALUMINUM 215
6 POTENTIAL FOR HUMAN EXPOSURE
sometimes eat inappropriate things (such as dirt or paint chips) and spend more time outdoors Children
also are closer to the ground and they do not use the judgment of adults to avoid hazards (NRC 1993)
As with adults exposures of children to aluminum from breathing air drinking water and eating food is
generally low As aluminum is part of the natural environment and found widely in soils rocks and
foods exposure to low levels of aluminum is unavoidable Children are likely to ingest dirt from their
unwashed hands or when playing with soils and may be exposed to aluminum in this manner Children
living in proximity to hazardous waste sites or industries that release aluminum to the environment may
be exposed to higher levels of aluminum than are found in the natural environment via ingestion of
aluminum contained in soil or via inhalation of aluminum from soil that is entrained in air While
aluminum contained in dirt may be in many forms some of these forms may be embedded in minerals not
bioavailable even in the acid environment of the stomach
When FDA revised their Total Diet Study in 1991 several sex-age groups relating to children were
included (Pennington and Schoen 1995) Average dietary intakes of aluminum in children are shown in
Table 6-5 Dietary intakes of aluminum for children ranged from 07 mgday for infants to 115 mgday
for 14ndash16-year-old males Aluminum intakes per kilogram of body weight for children ranged from
010 mgkg for infants to 035 mgkg for 2-year-old children The major sources of aluminum in food by
age-sex group are shown in Table 6-6 Processed foods containing aluminum additives such as processed
cheese and grain-based products constitute the foods with the largest quantities of aluminum and the
largest components of the dietary intake of children Soy-based formula may contain high quantities of
aluminum and infants on such formula would have much higher dietary intakes of aluminum than other
infants Pennington and Schoen (1995) reported that soy-based infant formula was a major contributor to
aluminum for infants contributing 0161 mgday
As with adults aluminum intake from aluminum-containing medication such as antacids buffered
aspirins and antidiarrheal agents would overwhelm ordinary dietary intakes (Pennington and Schoen
1995) Children may be exposed to aluminum from aluminum-containing medications vaccinations
parenteral feeding dialysis fluids and treatment for hyperphosphatemia (Advenier et al 2003 Andreoli
et al 1984 Baylor et al 2002 Bougle et al 1991 Bozynski et al 1989 Chedid et al 1991 Goyens and
Brasseur 1990 Griswold et al 1983 Klein et al 1989 Koo et al 1986 1992 Malakoff 2000 Milliner et
al 1987 Moreno et al 1994 Naylor et al 1999 Offit and Jew 2003 Randall 1983 Robinson et al 1987
Salusky et al 1990 von Stockhausen et al 1990 Warady et al 1986) Advenier et al (2003) reported a
mean aluminum concentration of 16 ImolL (0043 mgL) in parenteral nutrition solutions resulting
ALUMINUM 216
6 POTENTIAL FOR HUMAN EXPOSURE
Table 6-5 Dietary Intakes of Aluminum in Children
Aluminum intake Age-sex group (mgday) (mgkg) 6ndash11-Months 07 010 2-Years 46 035 6-Years 65 030 10-Years 68 011 14ndash16-Years (females) 77 015 14ndash16-Years (males) 115 018
Source Pennington and Schoen 1995
ALUMINUM 217
6 POTENTIAL FOR HUMAN EXPOSURE
Table 6-6 Major Sources of Aluminum in Food by Age-Sex Group
Aluminumday Foods by age-sex group (Alday) mg Percent of total intake 6ndash11-month-old infants (07 mg)
Soy-based formula 0161 230 American processed cheese 0122 174 Yellow cake with icing 0088 126 Green beans strained 0038 54 Pancakes 0029 41 Total 0438 626
2-year-old children (46 mg) Cornbread 1580 343 American processed cheese 1037 225 Yellow cake with icing 0384 83 Fish sticks 0173 54 Pancakes 0113 25 Tortillas 0093 20 Muffins 0093 20 Fruit drink from powder 0079 17 Tacotostada 0071 15 Tea 0061 13 Total 3684 801
6-year-old children (65 mg) American processed cheese 1382 213 Yellow cake with icing 1091 168 Pancakes 0752 116 Fish sticks 0529 81 Cornbread 0450 69 Tortillas 0297 46 Tacotostada 0209 32 Muffins 0202 31 Hamburger 0104 16 Fruit drink from powder 0105 16 Total 5121 788
10-year-old children (68 mg) American processed cheese 1498 220 Cornbread 1105 163 Pancakes 0858 126 Tortillas 0344 51 Yellow cake with icing 0350 51 Fish sticks 0280 41 Tacotostada 0259 38
ALUMINUM 218
6 POTENTIAL FOR HUMAN EXPOSURE
Table 6-6 Major Sources of Aluminum in Food by Age-Sex Group
Aluminumday Foods by age-sex group (Alday) mg Percent of total intake
Muffins 0207 30 Chocolate cake with icing 0141 21 Chocolate snack cake 0144 21 Total 5186 763
14ndash16-year-old females (77 mg) American processed cheese 2139 278 Yellow cake with icing 0906 118 Cornbread 0781 101 Tacotostada 0682 89 Pancakes 0668 87 Tortillas 0325 42 Muffins 0219 28 Cheeseburger 0183 24 Tea 0159 21 Fish sticks 0125 16 Total 6187 804
14ndash16-year-old males (115 mg) Cornbread 4209 366 American processed cheese 1978 172 Pancakes 1038 90 Yellow cake with icing 0925 80 Tacotostada 0398 35 Tortillas 0398 35 Cheeseburger 0310 27 Tea 0225 20 Hamburger 0211 18 Fish sticks 0170 15 Total 9862 858
Source Pennington and Schoen 1995
ALUMINUM 219
6 POTENTIAL FOR HUMAN EXPOSURE
in a mean aluminum daily intake of 008 Imolkgday (0002 mgkgday) An upper limit of 090 IgL
for aluminum in all large-volume parenteral solutions used in total parenteral nutrition therapy was set by
the FDA (Advenier et al 2003) Aluminum compounds such as aluminum hydroxide aluminum
phosphate or aluminum sulfate (alum) are commonly used as an adjuvant in many vaccines licensed by
the FDA the amount of aluminum in vaccines is limited to no more than 085 mgdose (Baylor et al
2002)
Elevated levels of aluminum may be found in the tissues and fluids of children undergoing treatments
such as parenteral feeding or dialysis or if they are receiving aluminum-containing medications
(Advenier et al 2003 Andreoli 1990 Andreoli et al 1984 Bougle et al 1991 Bozynski et al 1989
Chedid et al 1991 Goyens and Brasseur 1990 Griswold et al 1983 Klein et al 1989 Koo et al 1986
1992 Milliner et al 1987 Moreno et al 1994 Naylor et al 1999 Robinson et al 1987 Roodhooft et al
1987 Salusky et al 1986 1990 von Stockhausen et al 1990) however these levels are atypical of the
general population
67 POPULATIONS WITH POTENTIALLY HIGH EXPOSURES
In addition to individuals who are occupationally exposed to aluminum (see Section 65) there are several
groups within the general population that have potentially higher exposures (higher than background)
than the general population These populations include members of the general population living in the
vicinity of industrial emission sources and hazardous waste sites individuals with chronic kidney failure
requiring long-term hemodialysis treatment infants fed a formula diet containing high levels of
aluminum and individuals consuming large quantities of antacid formulations for gastric disorders anti-
ulcerative medications buffered analgesics for arthritis or antidiarrheal medications Furthermore the
elderly are at risk because of multiple chronic diseases including ulcers and other gastrointestinal
diseases rheumatoid arthritis and renal disorders Aluminum has been detected in virtually all food
products (especially plant-derived and processed foods) ambient air drinking water and soils
Substantially higher concentrations of aluminum have been detected in localized areas around some
industrial and hazardous waste disposal sites
Individuals living or working in proximity to aluminum production facilities may be exposed to higher
concentrations of aluminum in the ambient air than members of the general population In addition
individuals living in proximity to hazardous waste sites may be exposed to aluminum via ingestion of
aluminum contained in soil from their unwashed hands when working or playing with contaminated soils
ALUMINUM 220
6 POTENTIAL FOR HUMAN EXPOSURE
and sediments Children in particular are likely to ingest dirt from their unwashed hands or inhale
resuspended dust during near-ground activities If residential wells are the primary source of drinking
water this may also pose a risk to human health via consumption of contaminated drinking water
Individuals with chronic renal failure requiring long-term hemodialysis treatment are another group
within the general population that may be exposed to greater than background levels of aluminum (Alfrey
1987 Chappuis et al 1988 1989 Chedid et al 1991 Fernaacutendez-Martin et al 1998 Griswold et al 1983
Lione 1985a Marumo et al 1984 Muller et al 1993b Salusky et al 1990 Winterberg et al 1987)
Elevated levels of aluminum may be found in the tissues and fluids of individuals undergoing treatments
such as hemodialysis or if they are receiving aluminum-containing medications (Chappuis et al 1988
1989 Chedid et al 1991 Griswold et al 1983 Marumo et al 1984 Salusky et al 1990 Tsukamoto et al
1979 Winterberg et al 1987) however these levels are atypical of the general population Aluminum
levels in virtually every body tissue are significantly higher in this group of patients if aluminum is
present in the dialysate (Alfrey et al 1980 Cooke and Gould 1991) In addition Main and Ward (1992)
reported a 10-fold increased serum aluminum concentration in a hemodialysis patient after she was
prescribed effervescent analgesic tablets containing citrate This patient was already taking aluminum
hydroxide capsules Once the effervescent analgesic tablets were discontinued the patientrsquos serum
aluminum levels fell to acceptable levels within 3 weeks Since citrate appeared to enhanced aluminum
absorption these authors stated that patients with renal failure taking aluminum compounds should not be
prescribed citrate-containing preparations In a study by Fernaacutendez-Martin et al (1998) a decrease in
serum aluminum concentrations in patients on hemodialysis over the past 10 years was observed from
618 IgL in 1988 to 257 IgL in 1996 These reductions have been achieved due to the restriction of the
use of oral aluminum hydroxide as well as to the use of adequate water treatment systems
The oral intake of aluminum tends to be higher for children than for adults (Greger 1992) Calculations
based on the FDArsquos Total Diet Study suggest that 2-year-old children (13 kg body weight) consumed
almost 3 times as much aluminum per kg body weight as adult males (75 kg body weight) or adult
females (60 kg body weight) respectively (048 versus 018 and 015 mg aluminumkg body weight
respectively) (Greger 1992) Infants fed milk-based or soy-based infant formulas can be exposed to
higher concentrations of aluminum than infants fed breast milk or cowsrsquo milk (see Section 644) Within
this group the infants believed to be most at risk would be preterm infants with impaired renal function
because they would be less able to excrete the absorbed aluminum (Bishop 1992 Greger 1992 Koo et al
1988 1992 Weintraub et al 1986)
ALUMINUM 221
6 POTENTIAL FOR HUMAN EXPOSURE
As discussed in Section 644 individuals consuming large quantities of antacid formulations anti-
ulcerative medications buffered analgesics or antidiarrheal medications are exposed to higher than
background doses of aluminum in their diet Lione (1985a) estimated that 126ndash728 and 840ndash5000 mg
were possible daily doses of aluminum consumed in buffered aspirins for rheumatoid arthritis and antacid
products respectively These doses are 6ndash40 and 42ndash250 times greater respectively than aluminum
doses obtained from consumption of foods (34ndash9 mgday) (Biego et al 1998 MAFF 1999 Pennington
and Schoen 1995)
68 ADEQUACY OF THE DATABASE
Section 104(i)(5) of CERCLA as amended directs the Administrator of ATSDR (in consultation with the
Administrator of EPA and agencies and programs of the Public Health Service) to assess whether
adequate information on the health effects of aluminum is available Where adequate information is not
available ATSDR in conjunction with NTP is required to assure the initiation of a program of research
designed to determine the health effects (and techniques for developing methods to determine such health
effects) of aluminum
The following categories of possible data needs have been identified by a joint team of scientists from
ATSDR NTP and EPA They are defined as substance-specific informational needs that if met would
reduce the uncertainties of human health assessment This definition should not be interpreted to mean
that all data needs discussed in this section must be filled In the future the identified data needs will be
evaluated and prioritized and a substance-specific research agenda will be proposed
681 Identification of Data Needs
Physical and Chemical Properties The physical and chemical properties of aluminum and
various aluminum-containing compounds are sufficiently well defined to allow an assessment of the
environmental fate of these compounds (HSDB 2008 Lewis 2001 Lide 2005 OrsquoNeil et al 2001) No
additional data are needed at this time
Production ImportExport Use Release and Disposal According to the Emergency
Planning and Community Right-to-Know Act of 1986 42 USC Section 11023 industries are required
to submit substance release and off-site transfer information to the EPA The TRI which contains this
information for 2005 became available in May of 2007 This database is updated yearly and should
provide a list of industrial production facilities and emissions
ALUMINUM 222
6 POTENTIAL FOR HUMAN EXPOSURE
Because aluminum compounds occur naturally (Browning 1969 Dinman 1983 IARC 1984 NRC 1982)
and are widely used in industry in the manufacture of household products and in processing packaging
and preserving food (Browning 1969 Lewis 2001 OrsquoNeil et al 2001 Stokinger 1981 Venugopal and
Luckey 1978) the potential for human exposure to these compounds through ingestion of food and water
and inhalation of airborne particulates is substantial Recent data on production importexport and use
are available (Lewis 2001 OrsquoNeil et al 2001 USGS 2007a 2007c) Information on disposal of
aluminum compounds is limited In the United States about 3 million metric tons of aluminum was
recovered from purchased scrap in 2005 (USGS 2007b 2007c) TRI data are available for releases of
aluminum as fume or dust and as aluminum oxide (fibrous forms) (TRI05 2007) Additional information
on disposal would be useful in assessing the potential for the release of and exposure to aluminum
compounds
Environmental Fate Aluminum partitions to air water soil and plant material As an element
aluminum cannot be degraded in the environment it can undergo various precipitation or ligand exchange
reactions in the environment Its partitioning to various media is determined by the physical and chemical
properties of the aluminum compound and the characteristics of the environmental matrix that affects its
solubility (Brusewitz 1984 Dahlgren and Ugolini 1989 Filipek et al 1987 Goenaga and Williams 1988
James and Riha 1989 Litaor 1987 Mulder et al 1989 Wangen and Jones 1984) Aluminum is
transported through the atmosphere primarily as a constituent of soil and other particulate matter
(Eisenreich 1980) Transformations are not expected to occur during transport of aluminum through the
atmosphere Aluminum partitions between solid and liquid phases by reacting and complexing with
water molecules anions and negatively charged functional groups on humic materials and clay (Bodek et
al 1988) Information on the environmental fate of aluminum is sufficient to permit a general
understanding of transport and transformation in all environmental media No additional information is
needed at this time
Bioavailability from Environmental Media Aluminum compounds are deposited in the lungs
following inhalation (Christie et al 1963 Steinhagen et al 1978 Stone et al 1979 Thomson et al 1986)
and are poorly absorbed following ingestion (Hohl et al 1994 Priest et al 1998 Stauber et al 1999
Steinhausen et al 2004) A fractional absorption of 15ndash2 was estimated based on the relationship
between urinary aluminum excretion and the airborne soluble aluminum to which workers were exposed
(Yokel and McNamara 2001) Very limited information is available regarding absorption following
dermal contact however this pathway of exposure is not expected to be significant Additional
ALUMINUM 223
6 POTENTIAL FOR HUMAN EXPOSURE
information on absorption following ingestion of soils contaminated with aluminum compounds and
dermal contact would be useful in assessing bioavailability following exposure via these routes
particularly at hazardous waste sites
Food Chain Bioaccumulation Little information is available on the uptake of aluminum into food
crops Uptake into root crops is of particular importance since many plant species concentrate aluminum
in their roots (DOE 1984 Kabata-Pendias and Pendias 1984 Vogt et al 1987) The limited information
available on bioconcentration in animals appears to indicate that aluminum is not significantly taken up
by livestock (DOE 1984) The fact that in studies dealing with aluminum in food aluminum is generally
present in low concentrations in fruit vegetables and meat products that do not contain aluminum
additives or have other contact with aluminum (eg cooked in aluminum pots) (Greger et al 1985
MAFF 1999 Pennington 1987 Pennington and Schoen 1995 Schenk et al 1989 Sorenson et al 1974)
would support a conclusion that aluminum does not bioaccumulate in the food chain Because of its
toxicity to many aquatic species aluminum does not bioconcentrate appreciably in fish and shellfish and
therefore it would not be a significant component of the diet of animals that feed upon them (Rosseland
et al 1990) Further studies on the uptake of aluminum by plants especially those grown on acid soils
would be useful in expanding a limited database and characterizing the importance of food chain
bioaccumulation of aluminum as a source of exposure for particular population groups
Exposure Levels in Environmental Media Reliable monitoring data for the levels of aluminum
in contaminated media at hazardous waste sites are needed so that the information obtained on levels of
aluminum in the environment can be used in combination with the known body burden of aluminum to
assess the potential risk of adverse health effects in populations living in the vicinity of hazardous waste
sites
Estimates of human exposure to aluminum from food (Biego et al 1998 Greger 1992 MAFF 1999
Pennington 1987 Pennington and Schoen 1995 Saiyed and Yokel 2005 Schenk et al 1989 Sorenson et
al 1974) drinking water (Cech and Montera 2000 DOI 1970 Letterman and Driscoll 1988 Miller et al
1984a Schenk et al 1989) and air (Browning 1969 Crapper McLachlan 1989 Sorenson et al 1974) are
available as are estimates from exposure from antacids buffered analgesics antidiarrheal and anti-
ulcerative compounds (Lione 1983 1985a Schenk et al 1989 Shore and Wyatt 1983 Zhou and Yokel
2005) Information on the intake of aluminum from vitamins and other dietary supplements is lacking
and would be useful in estimating human exposure Additional information on the occurrence of
ALUMINUM 224
6 POTENTIAL FOR HUMAN EXPOSURE
aluminum in the atmosphere surface water groundwater and soils surrounding hazardous waste sites
would be helpful in updating estimates of human intake
Exposure Levels in Humans Measurements of the aluminum content in human tissues especially
in blood (Berlyne et al 1970 de Kom et al 1997 Drablos et al 1992 Fuchs et al 1974 House 1992
Liao et al 2004 Nieboer et al 1995 Razniewska and Trzcinka-Ochocka 2003 Sorenson et al 1974)
urine (Buchta et al 2005 Drablos et al 1992 Liao et al 2004 Nieboer et al 1995 Razniewska and
Trzcinka-Ochocka 2003 Valkonen and Aitio 1997) and breast milk (Baxter et al 1991 Fernandez-
Lorenzo et al 1999 Hawkins et al 1994 Koo et al 1988 Mandie et al 1995 Simmer et al 1990
Weintraub et al 1986) are available However Versieck and Cornelis (1980) discussed the possibility of
aluminum contamination in blood and plasma samples from some of early studies This may question the
reliability of aluminum levels reported in some older reports
Measurements of aluminum in other human tissues and fluids such as bone brain saliva spermatozoa
and seminal fluid are also available (Dawson et al 1998 2000 Hovatta et al 1998 Markesbery et al
1984 Nieboer et al 1995 Sighinolfi et al 1989) However recent biological monitoring data
particularly for aluminum in blood and urine are limited More recent information would be useful in
assessing current exposure levels Additional biological monitoring data for populations surrounding
hazardous waste sites would be useful in helping to better characterize human exposure levels
This information is necessary for assessing the need to conduct health studies on these populations
Exposures of Children Measurements of the aluminum content in tissues blood and urine of
children who have been exposed to aluminum as well as unexposed children are limited Chiba et al
(2004) reported aluminum concentrations in hair of children Al-Saleh and Shinwari (1996) reported
aluminum concentrations in serum samples of girls aged 6ndash8 years Hawkins et al (1994) and Litov et al
(1989) reported plasma aluminum concentrations in infants fed various formulas and breast milk Studies
measuring aluminum concentrations in tissues blood and urine of specialized groups of children (eg
infants with renal failure or on parenteral nutrition) have also been reported (Advenier et al 2003
Andreoli 1990 Andreoli et al 1984 Bougle et al 1991 Bozynski et al 1989 Chedid et al 1991 Goyens
and Brasseur 1990 Griswold et al 1983 Klein et al 1989 Koo et al 1986 1992 Milliner et al 1987
Moreno et al 1994 Naylor et al 1999 Robinson et al 1987 Roodhooft et al 1987 Salusky et al 1986
1990 von Stockhausen et al 1990)
ALUMINUM 225
6 POTENTIAL FOR HUMAN EXPOSURE
Additional information monitoring aluminum concentrations in children would be useful in assessing
both the normal aluminum content of children and the effect of exposure on aluminum concentrations in
children This information would also be useful in assessing differences in the effect of aluminum
exposure on children to that of adults While the largest source of aluminum exposure in adults is from
aluminum-containing medications and cosmetics we do not know the amount of such products that may
be given to children Additional information on the intake of available aluminum from soil during
childhood activities or the placental transfer to fetal blood especially among pregnant women taking
antacids as a result of abdominal upsets would be useful in assessing exposure levels in children
Data are available on the intake of aluminum in food eaten by children and from their diet (Dabeka and
McKenzie 1990 Koo et al 1988 Pennington and Schoen 1995 Pennington 1987 Simmer et al 1990
Weintraub et al 1986) Aluminum concentrations in human breast milk infant formula and cowrsquos milk
have been reported The aluminum content of human breast milk generally ranged from 92 to 49 IgL
lower than that reported in infant formulas (Fernandez-Lorenzo et al 1999 Hawkins et al 1994 Koo et
al 1988 Simmer et al 1990 Weintraub et al 1986) Soy-based infant formulas contain higher
concentrations of aluminum as compared to milk-based infant formulas or breast milk Recent reports
provide average aluminum concentrations ranging from 460 to 930 IgL for soy-based infant formulas
and from 58 to 150 IgL for milk-based formulas (Fernandez-Lorenzo et al 1999 Ikem et al 2002
Navarro-Blasco and Alvarez-Galindo 2003) Infant formulas are much higher in aluminum than human
breast milk Daily intakes of aluminum for infants in the United States were estimated to be 97 573 and
361 Igday from milk-based powder formulas soy-based powder formulas and hypoallergenic powder
formulas respectively (Ikem et al 2002)
Child health data needs relating to susceptibility are discussed in Section 3122 Identification of Data
Needs Childrenrsquos Susceptibility
Exposure Registries No exposure registries for aluminum were located This substance is not
currently one of the compounds for which a sub-registry has been established in the National Exposure
Registry The substance will be considered in the future when chemical selection is made for sub-
registries to be established The information that is amassed in the National Exposure Registry facilitates
the epidemiological research needed to assess adverse health outcomes that may be related to exposure to
this substance
ALUMINUM 226
6 POTENTIAL FOR HUMAN EXPOSURE
682 Ongoing Studies
The Federal Research in Progress (FEDRIP 2006) database provides additional information obtainable
from a few ongoing studies that may fill in some of the data needs identified in Section 681 These
studies are summarized in Table 6-7
ALUMINUM 227
6 POTENTIAL FOR HUMAN EXPOSURE
Table 6-7 Ongoing Studies on Aluminum
Investigator Affiliation Research description Sponsor Longnecker M Not provided This research proposes to study elemental NIH
concentrations in toenails which may provide a good measure of exposure for various elements including aluminum
Yokel RA University of The overall objective of the proposed NIH Kentucky research is to test the null hypothesis that the Lexington bioavailability of aluminum is comparable Kentucky from foods and from drinking water
NIH = National Institutes of Health
Source FEDRIP 2006
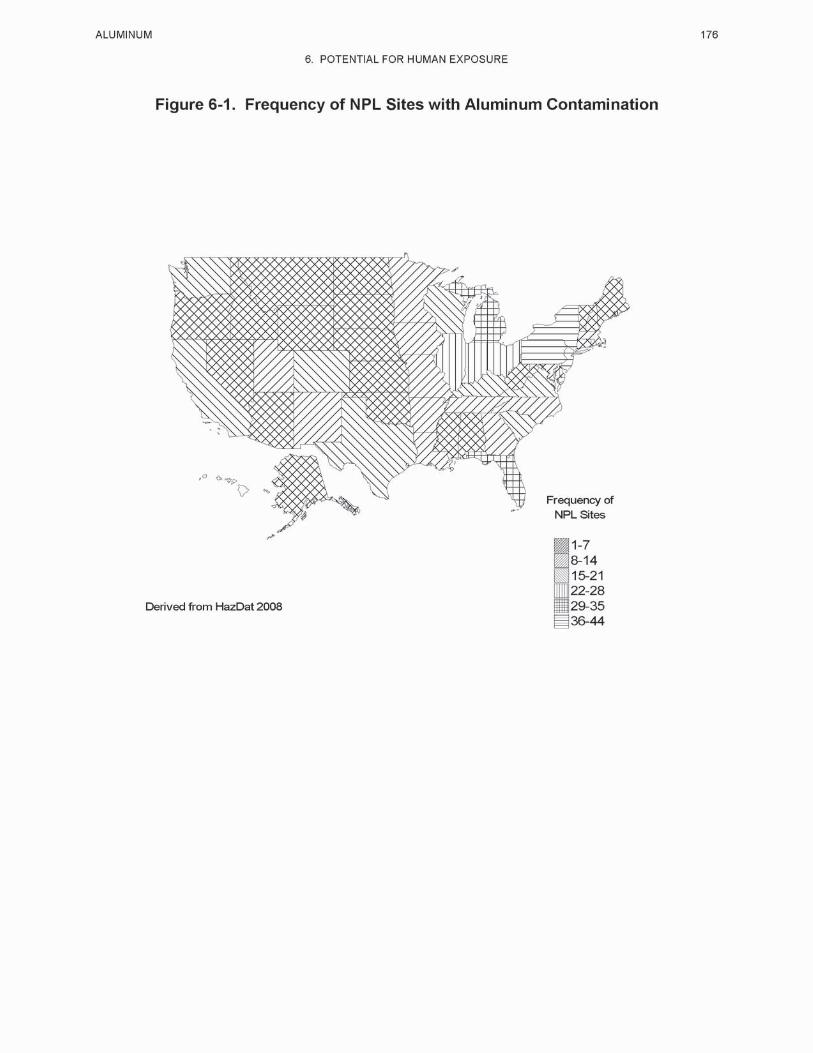
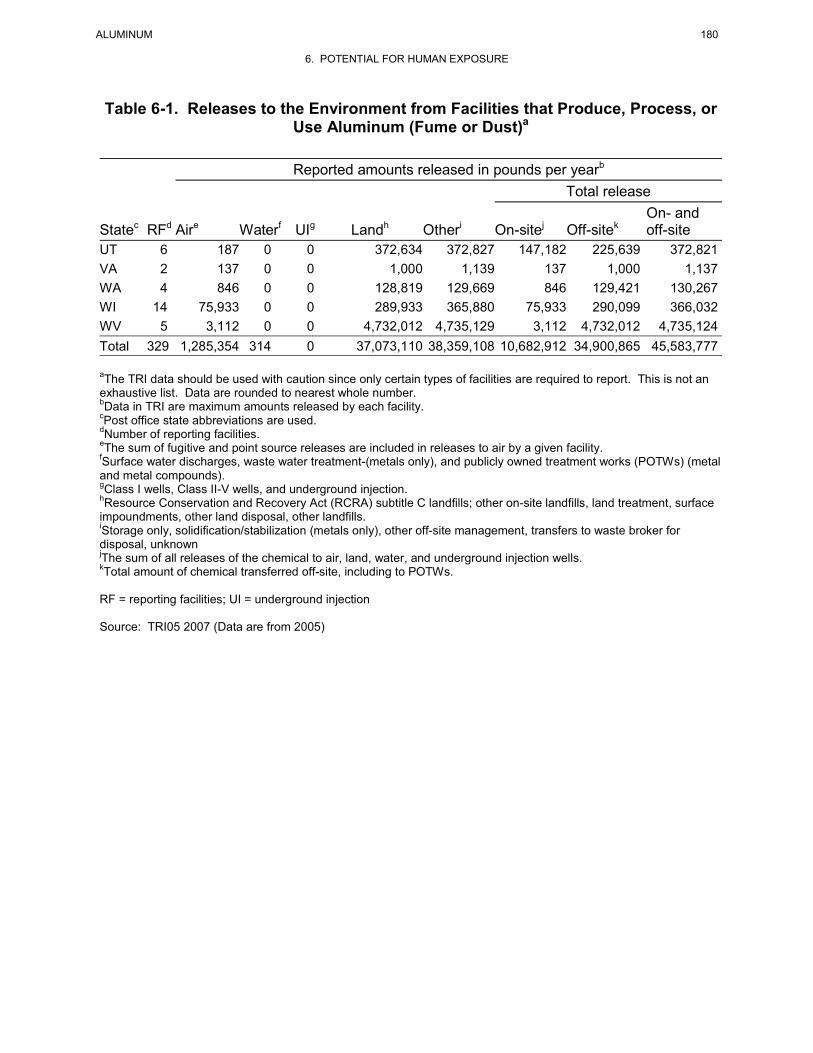
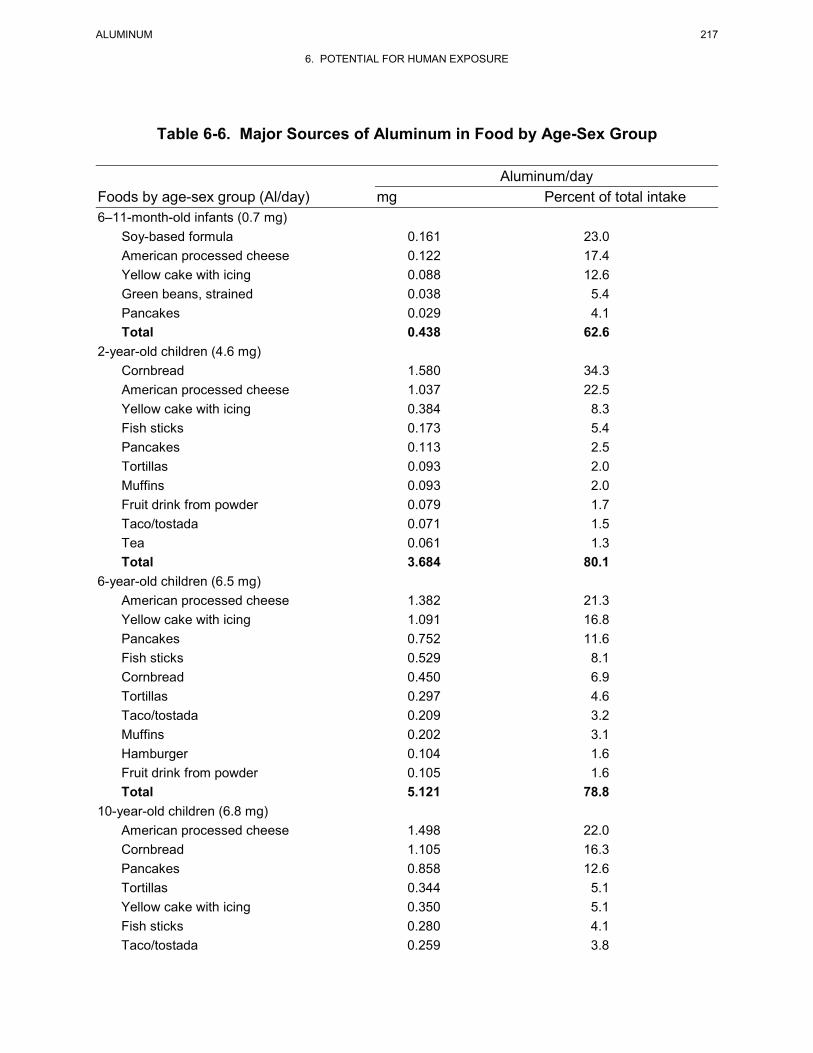