6. NONDESTRUCTIVE EVALUATION - US Department of Energy · 6. NONDESTRUCTIVE EVALUATION A. NDE...
11
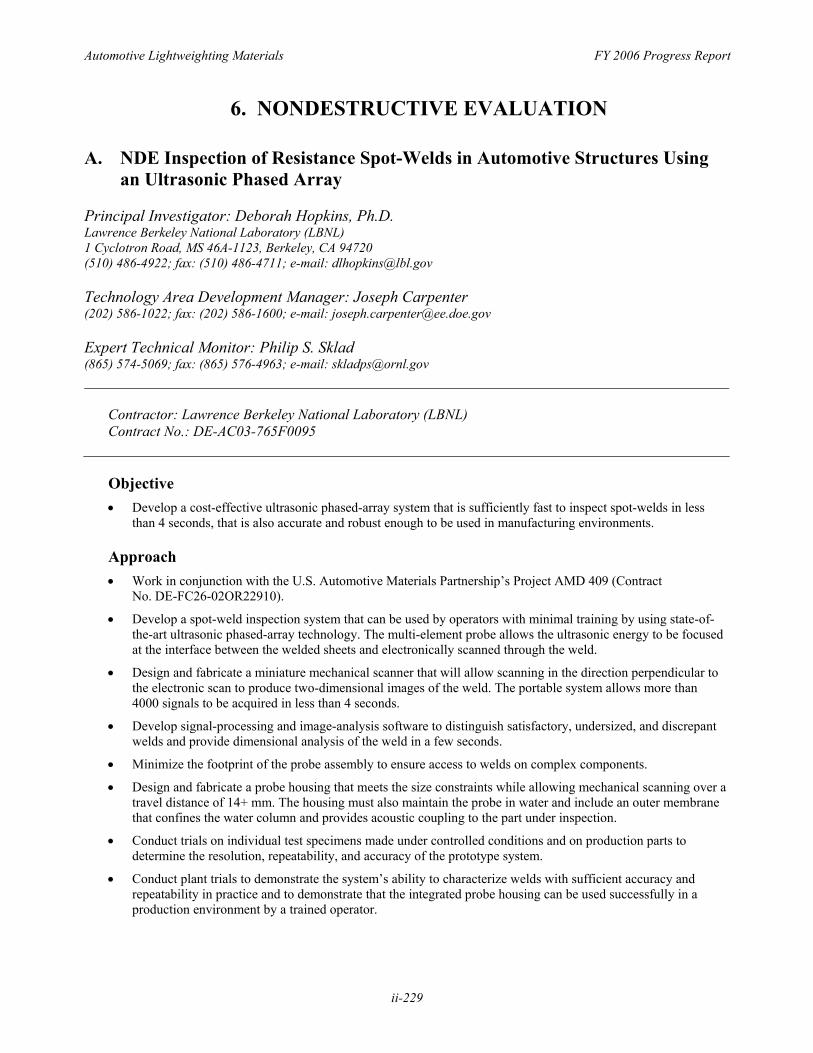
Automotive Lightweighting Materials FY 2006 Progress Report 6. NONDESTRUCTIVE EVALUATION A. NDE Inspection of Resistance Spot-Welds in Automotive Structures Using an Ultrasonic Phased Array Principal Investigator: Deborah Hopkins, Ph.D. Lawrence Berkeley National Laboratory (LBNL) 1 Cyclotron Road, MS 46A-1123, Berkeley, CA 94720 (510) 486-4922; fax: (510) 486-4711; e-mail: [email protected] Technology Area Development Manager: Joseph Carpenter (202) 586-1022; fax: (202) 586-1600; e-mail: [email protected] Expert Technical Monitor: Philip S. Sklad (865) 574-5069; fax: (865) 576-4963; e-mail: [email protected] Contractor: Lawrence Berkeley National Laboratory (LBNL) Contract No.: DE-AC03-765F0095 Objective • Develop a cost-effective ultrasonic phased-array system that is sufficiently fast to inspect spot-welds in less than 4 seconds, that is also accurate and robust enough to be used in manufacturing environments. Approach • Work in conjunction with the U.S. Automotive Materials Partnership’s Project AMD 409 (Contract No. DE-FC26-02OR22910). • Develop a spot-weld inspection system that can be used by operators with minimal training by using state-of- the-art ultrasonic phased-array technology. The multi-element probe allows the ultrasonic energy to be focused at the interface between the welded sheets and electronically scanned through the weld. • Design and fabricate a miniature mechanical scanner that will allow scanning in the direction perpendicular to the electronic scan to produce two-dimensional images of the weld. The portable system allows more than 4000 signals to be acquired in less than 4 seconds. • Develop signal-processing and image-analysis software to distinguish satisfactory, undersized, and discrepant welds and provide dimensional analysis of the weld in a few seconds. • Minimize the footprint of the probe assembly to ensure access to welds on complex components. • Design and fabricate a probe housing that meets the size constraints while allowing mechanical scanning over a travel distance of 14+ mm. The housing must also maintain the probe in water and include an outer membrane that confines the water column and provides acoustic coupling to the part under inspection. • Conduct trials on individual test specimens made under controlled conditions and on production parts to determine the resolution, repeatability, and accuracy of the prototype system. • Conduct plant trials to demonstrate the system’s ability to characterize welds with sufficient accuracy and repeatability in practice and to demonstrate that the integrated probe housing can be used successfully in a production environment by a trained operator. ii-229
Transcript of 6. NONDESTRUCTIVE EVALUATION - US Department of Energy · 6. NONDESTRUCTIVE EVALUATION A. NDE...
Automotive Lightweighting Materials FY 2006 Progress Report
6. NONDESTRUCTIVE EVALUATION
A. NDE Inspection of Resistance Spot-Welds in Automotive Structures Using an Ultrasonic Phased Array
Principal Investigator: Deborah Hopkins, Ph.D. Lawrence Berkeley National Laboratory (LBNL) 1 Cyclotron Road, MS 46A-1123, Berkeley, CA 94720 (510) 486-4922; fax: (510) 486-4711; e-mail: [email protected]
Technology Area Development Manager: Joseph Carpenter (202) 586-1022; fax: (202) 586-1600; e-mail: [email protected]
Expert Technical Monitor: Philip S. Sklad (865) 574-5069; fax: (865) 576-4963; e-mail: [email protected]
Contractor: Lawrence Berkeley National Laboratory (LBNL) Contract No.: DE-AC03-765F0095
Objective • Develop a cost-effective ultrasonic phased-array system that is sufficiently fast to inspect spot-welds in less
than 4 seconds, that is also accurate and robust enough to be used in manufacturing environments.
Approach • Work in conjunction with the U.S. Automotive Materials Partnership’s Project AMD 409 (Contract
No. DE-FC26-02OR22910).
• Develop a spot-weld inspection system that can be used by operators with minimal training by using state-ofthe-art ultrasonic phased-array technology. The multi-element probe allows the ultrasonic energy to be focused at the interface between the welded sheets and electronically scanned through the weld.
• Design and fabricate a miniature mechanical scanner that will allow scanning in the direction perpendicular to the electronic scan to produce two-dimensional images of the weld. The portable system allows more than 4000 signals to be acquired in less than 4 seconds.
• Develop signal-processing and image-analysis software to distinguish satisfactory, undersized, and discrepant welds and provide dimensional analysis of the weld in a few seconds.
• Minimize the footprint of the probe assembly to ensure access to welds on complex components.
• Design and fabricate a probe housing that meets the size constraints while allowing mechanical scanning over a travel distance of 14+ mm. The housing must also maintain the probe in water and include an outer membrane that confines the water column and provides acoustic coupling to the part under inspection.
• Conduct trials on individual test specimens made under controlled conditions and on production parts to determine the resolution, repeatability, and accuracy of the prototype system.
• Conduct plant trials to demonstrate the system’s ability to characterize welds with sufficient accuracy and repeatability in practice and to demonstrate that the integrated probe housing can be used successfully in a production environment by a trained operator.
ii-229
FY 2006 Progress Report Automotive Lightweighting Materials
Accomplishments • Evaluated the performance and limitations of existing ultrasonic phased-array systems.
• Conducted a series of laboratory experiments to evaluate the performance of 5-, 10-, and 17-MHz phased-array probes for characterization of spot-welds in galvanized steel.
• Developed signal-processing algorithms to distinguish between satisfactory, undersized, and discrepant welds.
• Developed image-processing algorithms that allow three-dimensional analysis and dimensioning of welds.
• Demonstrated the ability to acquire more than 4000 signals per weld and analyze the resulting data in a few seconds to render an estimate of weld quality.
• Developed a difference-equation model that enables simulation as well as signal processing to recover reflectivity estimates, and to detect poor coupling and malfunctioning probe elements. Pre-processing algorithms are used to measure changes in thickness and to detect misalignment of the probe.
• Designed and fabricated a portable, integrated probe housing that maintains the phased-array probe in water, contains a miniature mechanical system that allows linear translation of the probe, and provides an outer membrane that confines the water column while also providing acoustic coupling to the part under inspection. Identified and tested coupling materials that allow satisfactory signals to be obtained outside of a water tank.
• Demonstrated good correlation between ultrasonic measurements and other measures of weld quality including measurements of weld buttons on peeled samples.
Future Direction • Demonstrate technical feasibility by demonstrating good statistical correlation between ultrasonic
measurements and weld buttons obtained by destructive teardown. Experiments are underway on production parts and specially-designed test coupons provided by industry partners that capture conditions found on production parts such as deep surface indentations and non-parallel sheets. Sample sizes are large enough to allow meaningful statistical analysis. Repeatability is being assessed by using three different operators to make measurements and by making repeat measurements.
• Conduct laboratory experiments to determine the concept feasibility of using ultrasonic phased arrays to inspect welds in advanced high-strength steels.
• Determine the diagnostic capability of measurable data including interface transmissivity, the spatial pattern of transmissivity, the number and spatial pattern of weak signals, and the depth of the surface indentation caused by the welding electrodes. Develop automated classifiers to determine weld quality and size, and to identify discrepant welds including cold welds.
• Develop a user interface in conjunction with end users to ensure ease of use and reporting of data in the most useful format for inspectors, welding engineers, and plant managers.
• Develop a fully-integrated prototype system suitable for deployment and testing in a manufacturing plant.
• Perform large-scale testing and measurement system analysis.
Introduction Development of nondestructive evaluation (NDE) techniques is enabling for greater use of lightweight materials in the automotive industry where NDE methods to assure product quality are essential for industry and consumer acceptance of new materials and manufacturing methods. Recent studies have demonstrated cost savings associated with implementing NDE that derive from finding discrepancies early in the production process and
reducing waste compared to destructive testing. One of the critical technical challenges in introducing lightweight materials is developing joining technologies and inspection strategies suitable for mass production. At present, the most common methods for inspecting spot-welds in automotive manufacturing are pry checks and physical teardown, during which spot-welded joints are pried apart and the resulting weld buttons are visually inspected or measured with calipers. Although these
ii-230
Automotive Lightweighting Materials
methods have been used successfully for decades, destructive weld testing has several drawbacks including high costs associated with scrapped material, ergonomic injuries, and the time-lag between the onset and identification of problems. In addition, pry tests and teardowns do not allow quality-control personnel and engineers to easily collect inspection data that would allow them to identify trends and potential problems. Furthermore, these inspection techniques are not viable options for lightweight and high-strength materials, as well as non-pryable welds. For example, composite structures with adhesive-bonded joints cannot be pry checked, and aluminum is relatively expensive and more difficult to rework than steel making pry checks and teardown cost prohibitive.
Advances in sensors, computing, communication, and engineering technologies have all played a role in advancing the development of NDE methods with promising automotive applications. For example, ultrasonic phased-array systems have been available since the mid-1970s, but they were prohibitively expensive. In the past decade, prices have dropped dramatically, and increased competition promises additional price reductions in the future. A recent breakthrough is the availability of portable systems that are particularly attractive for use in production environments.
To best advance the adoption of lightweight materials while also serving the needs of the auto industry, the current project team has adopted a strategy that strives to develop platforms that add value immediately, minimize barriers to incorporating emerging technologies at a later date, and that are as modular as possible so that they can be easily modified or adapted for new applications. Consistent with that model, the current work is focused on development of a prototype spot-weld inspection platform that integrates the best available ultrasonic phased-array technology with customdesigned signal processing and analysis software, and hardware that will allow the system to be tested and implemented in manufacturing plants as a portable stand-alone unit.
Ultrasonic Phased-Array Technology Most commercially-available spot-weld inspection systems use conventional high-frequency single-
FY 2006 Progress Report
crystal ultrasonic probes working in pulse-echo mode. The output from these mono-probes is a single signal that is an integrated response over an area that depends on the diameter of the probe. Different probes must be used for different-sized welds. In contrast, a phased array is composed of many piezoelectric elements that are individually excited by electronic pulses at programmed delay times. As a result, phased arrays have several advantages over conventional ultrasonic probes that derive from the ability to dynamically control the acoustic beam transmitted into the structure under examination. An electronic delay can be applied separately to each channel when emitting and receiving the signal. These delay laws permit constructive and destructive interference of the acoustic wavefront transmitted into the structure, allowing predefined ultrasonic beams to be formed. The acoustic energy can be focused, and delay laws can be used to steer the acoustic beam. Electronic scanning is accomplished by firing successive groups of elements in the array.
Instead of assessing weld quality based on a single signal, as is the case with mono-probes, phased arrays allow thousands of signals to be obtained for individual welds in a few seconds. The ability to perform complex scanning of the acoustic beam through the weld allows greater accuracy in sizing, while also improving the flaw-characterization capability. These attributes of phased-array probes allow us to measure the size of welds, map the surface indentation caused by the welding electrodes, locate and image discrepancies, and identify misshapen and burnt welds. In addition, the same probe can be used to inspect different sized welds and welds in sheets with different thicknesses. It is also possible to electronically compensate for misalignment of the probe with respect to the sample.
Project Status As described in detail below, the project is now in the second phase of assessing technical feasibility, having demonstrated concept feasibility and completed the first phase of technical feasibility. Concept feasibility was demonstrated using a phased-array probe in a water tank. Experiments were conducted with different probes to determine the optimal ultrasonic frequency. Work also
ii-231
FY 2006 Progress Report
included a series of experiments performed on test specimens provided by DaimlerChrysler made from both mild and high-strength steel, with both equalthickness and unequal-thickness stackups. The objective of these tests was to determine if the newly-acquired phased-array probe and LBNL's signal-processing software could be used without modification across the range of materials, sheet thicknesses and stackups tested. The probe and signal-processing algorithms performed as desired, and the resulting data were judged to be sufficient for demonstrating the concept feasibility of using a high-frequency phased-array probe to assess the size and quality of spot-welds.
The most challenging task in the first phase of technical feasibility was to design and fabricate a portable, integrated probe that allows ultrasonic measurements to be made outside of a water tank. As described in detail in the following section, this required not only a housing to maintain the phasedarray probe in water, but also a miniature mechanical scanning system to provide lateral translation of the probe; to generate two-dimensional images of the welds, mechanical scanning is required in the direction perpendicular to the electronic scan. In the future, matrix phased-array probes may prove to be an attractive alternative to mechanical scanning if they can meet cost and robustness requirements.
As described below, the integrated probe was completed and tested in 2005. The miniature scanning system performed as designed, and the coupling membrane integrated into the probe housing was demonstrated to confine the water column and provide adequate acoustic coupling to welded assemblies. Along with the development of hardware, the first phase of technical feasibility also included further development of signal processing and analysis software that allows classifying and sizing welds. Experiments performed on test specimens provided by industry partners demonstrated the feasibility of imaging spot-welds using the portable phased-array probe assembly. More than 4000 signals were measured for each weld in a few seconds. Post-processing algorithms developed to analyze the signals demonstrated the capability of the system to qualitatively distinguish cold, undersized, satisfactory and burnt welds.
Automotive Lightweighting Materials
The second phase of demonstrating technical feasibility includes work underway to perform correlation studies to determine the accuracy and repeatability of measurements made with the integrated probe assembly. In addition to assessing the ability of the prototype system and the signal post-processing algorithms to classify welds, software developed to provide an estimate of the size of the weld nugget is also being assessed. Experiments are being performed on both production parts and specially-designed test coupons provided by industry.
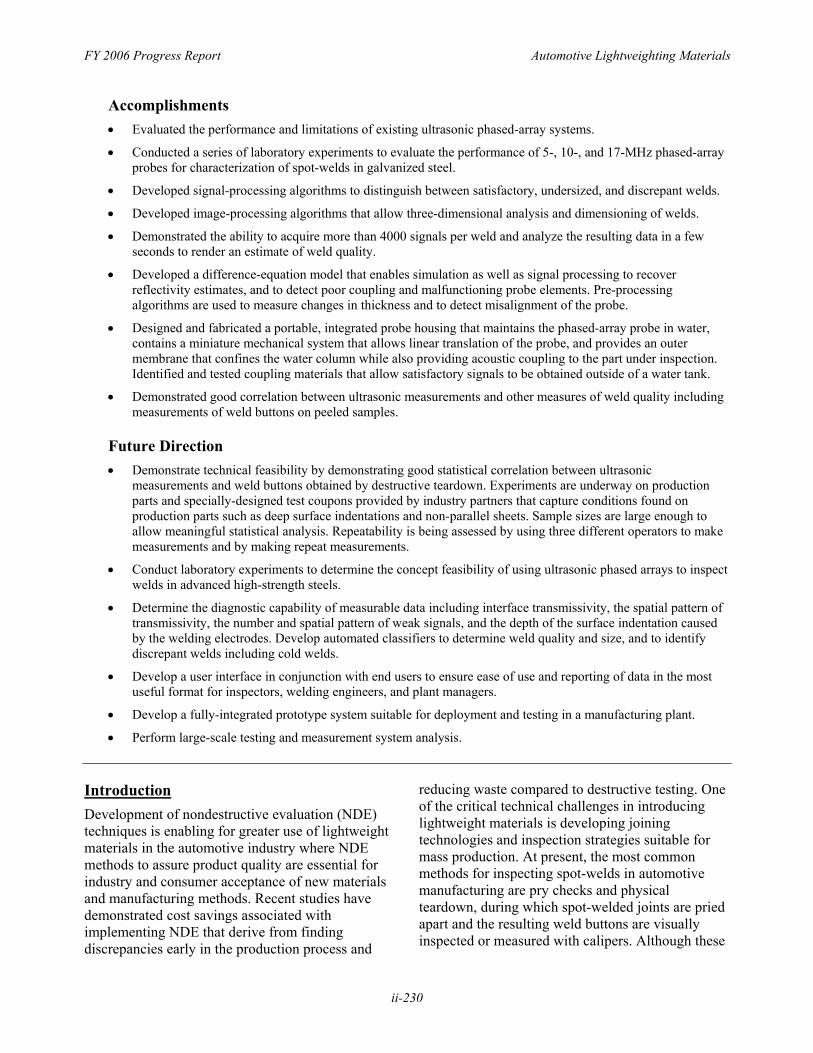
Integrated Probe Unit A plant-deployable unit requires a housing for the ultrasonic probe that maintains the probe in water and contains the miniature mechanical system for linear translation of the probe. The mechanical system designed and encapsulated into the probe housing allows the probe to travel a distance of 14.7 mm. A mechanical drawing of the scanning system is shown in Figure 1a. The small motor used to drive the system has a nominal speed of 4800 RPM and is coupled to a 1:16 gearbox. The drive assembly is separated from the water column containing the probe by two slider plates and O-rings that form a watertight seal. Pictures of the integrated probe housing are displayed in Figures 1b-1e.
One of the technical challenges in designing the miniature scanning system was in minimizing the size and weight of the integrated probe. In many cases, there is very limited access to spot-welds on production parts, making it essential to minimize the footprint of the probe assembly. Minimizing weight is important in designing an ergonomic tool that is relatively easy to position and hold on the part. The overall footprint of the first prototype, shown in Figure 1b, was 26 by 44 mm. This design works well on relatively flat components where there is easy access to the welds. In the next several iterations of the probe design, also shown in Figure 1, the bottom section of the housing was tapered to allow improved access to welds on production parts. As shown in Figure 1c, the bottom half of the housing in the latest designs is a cylinder with a diameter of approximately 2 cm. Several different designs of the end cap on the probe housing have
ii-232
Automotive Lightweighting Materials FY 2006 Progress Report
Figure 1. Mechanical drawing of the miniature scanning system (1a) encapsulated into the prototype probe housing (1b). In later prototypes, the lower section of the housing was redesigned to be much smaller for better accessibility to welds on production parts (1c). Figure 1d shows the end of the probe assembly after being filled with water, and Figure 1e shows one of the membranes tested.
also been tried, with two objectives: maximizing the ease of changing the membrane that confines the water column, and determining which design provides the best coupling between the membrane and the parts under inspection.
Figure 1d shows the end of the probe assembly after being filled with water, and Figure 1e shows one of the membranes tested. The optimal material for the outer membrane has also been investigated. The material must provide acoustic coupling to the part, which requires that it conform to the surface. Since many welds on production parts are associated with surface roughness and indentations caused by the welding electrodes, the membrane must be highly pliable, while also being durable enough to withstand thousands of measurements. With regard to its acoustic properties, the ideal membrane has an acoustic impedance equal to that of water, and does not attenuate the acoustic signal. Another important consideration in choosing a material is that it be relatively inexpensive. Experiments were performed with a variety of materials, and acceptable results were achieved even with inexpensive, off-the-shelf products. What has been shown to be important is the thickness of the material. Tests to date indicate that membranes thinner than 0.5 mm are necessary to achieve good coupling with the part. Tradeoffs between price, durability, and coupling will determine the best membrane option for any particular application.
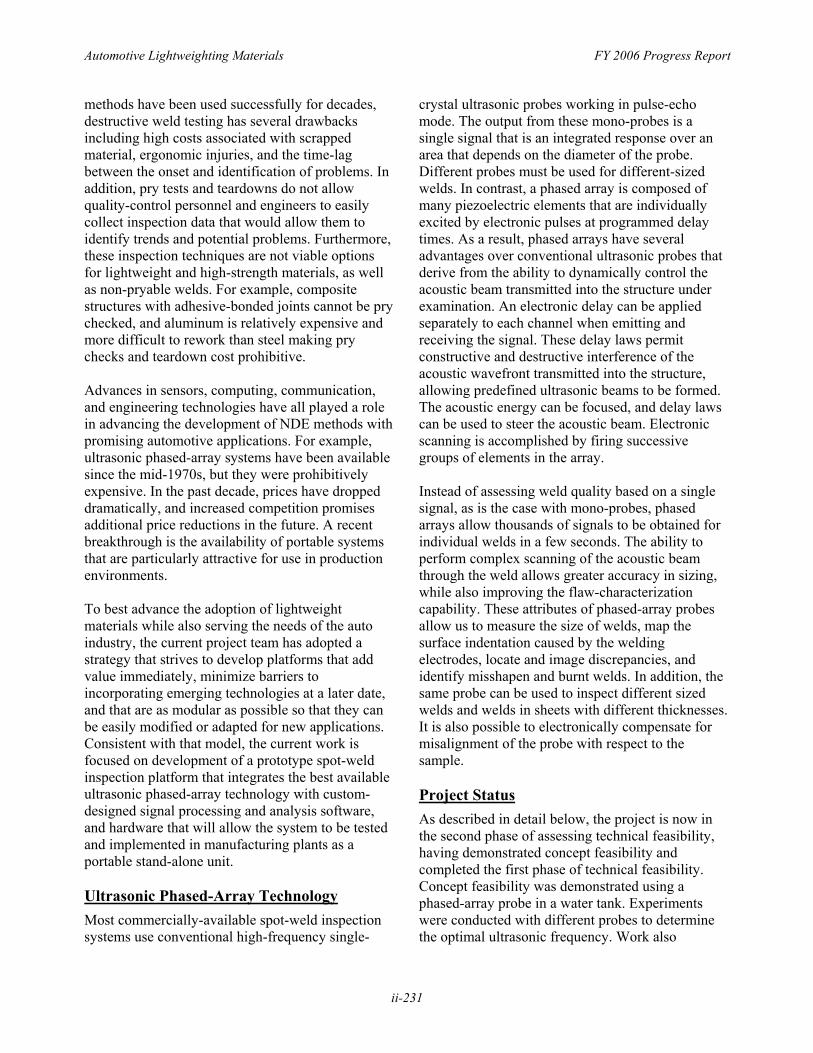
Phased-Array Inspection Strategy For all experiments performed to date, electronic scanning and focusing laws are combined to inspect the spot-welds. The acoustic energy is focused at the interface between the two sheets by applying symmetrical delay laws to the elements of the
phased-array probe (see Figure 2). The results presented here were obtained using a 17-MHz focused probe. In contrast to the probes used for initial experiments that had flat elements, the 17-MHz probe has curved elements that focus the energy with a natural focal length of 37 mm. When used in conjunction with the delay laws described above that focus the energy from multiple elements, the acoustic beam at the interface between the welded sheets is a circular spot that is scanned across the weld. Using a portable phased-array controller, more than 4000 signals are recorded for each weld in approximately 4 seconds.
Signal Processing The signals recorded while scanning through the weld are currently analyzed in the frequency and time domains with the goal of developing fast and accurate algorithms that work for the wide range of welds found on production parts. For a satisfactory weld, most of the ultrasonic energy is transmitted through the weld nugget and reflected off the back surface of the lower sheet (see Figure 2). In contrast, for a discrepant weld, incomplete fusion at the interface between the two sheets results in partial
Figure 2. Schematic drawing illustrating focusing of the ultrasonic energy from several phased-array elements at the interface between welded sheets. The arrows indicate the travel paths of the acoustic waves in and outside of the welded area.
ii-233

FY 2006 Progress Report
reflection of the ultrasonic energy at the interface. This affects the periodicity of the train of echoes; that is, signals that are reflected at the interface have a shorter travel path than signals that propagate through the weld, resulting in echoes in the time domain that are closer together than echoes off the back surface.
In the frequency domain, the power spectrum captures the periodicity of the ultrasonic echoes. The relative magnitude of the peaks in the spectra is indicative of the amount of energy reflected at the interface between the welded sheets. For a satisfactory weld, the ultrasonic wave propagates through the weld and reflects back and forth between the front and back surfaces resulting in a peak that corresponds to the travel path through both sheets. For discrepant welds, where most of the energy is reflected at the interface between the two sheets, there is a peak in the spectrum that corresponds to a travel path equal to twice the thickness of the upper sheet. For each of the 4000 signals that comprise each weld image, the ratio of the peaks in the power spectrum is calculated. To obtain a measure that can be directly compared to buttons and metallographic images, the frequency-ratio images are thresholded, and the largest contiguous area of high transmission is isolated and dimensioned.
The frequency-ratio images allow satisfactory and undersized welds to be distinguished according to the size of the area where there is significant transmission of energy into the lower sheet. Although discrepant welds such as cold welds can result in a large area of transmission into the second sheet, the frequency ratio often shows that the areas of high transmission are relatively sparse and dispersed compared to the well-defined and concentrated areas for the satisfactory and undersized welds. A drawback of this approach is that it requires setting a threshold, which tends to be arbitrary, and also results in ignoring some of the data. For these reasons, we have moved away from thresholding toward measures that use all of the available information. For our most recent study, the frequency ratio is integrated over the total area where there is ultrasonic transmission. In addition, the signals are amplified by the material attenuation rate, to make data obtained for different thickness sheets more comparable.
Automotive Lightweighting Materials
In addition to the signal processing based on Fourier peak ratios, a difference-equation model has been developed that describes the amplitude of the ultrasonic echoes in the time domain as a function of the reflectivity of the weld. At each measurement point, the reflectivity measures the share of acoustic energy incident on the interface between the sheets that is reflected. To create images of the welds, the signal obtained at each location during scanning is reduced to a single bounded value (reflectivity), and these values are plotted to create a reflectivity map of the weld.
The frequency-ratio method and difference-equation models have different advantages and disadvantages, making it valuable to have two approaches to signal processing. For example, the frequency-ratio method is very fast, whereas the difference-equation model enables simulations. Features of the reflectivity model also include the ability to detect and correct for weak signals that are almost always unavoidably present because the edge of the surface indentation tends to “scatter” the ultrasonic signals. Weak signals may also be present because of poor coupling or because of malfunction of one or more elements in the probe. The software identifies and, as far as possible, corrects for these cases as well.
An advantage of phased arrays is that the resulting signals provide an accurate measure of the surface indentation caused by the welding electrode. Knowing the depth and location of the top-surface indentation is necessary for signal processing when the indentation is deep, and is also important in analyzing the quality of the weld. The criteria used in the automotive industry for assessing weld quality include specifications for allowable indentation and loss of material. Although the relationship does not always hold, the depth of the indentation and the size of the weld nugget are often related; thus, the indentation depth may be of some value as a secondary criterion in evaluating quality for those welds that prove difficult to analyze. It is also possible to determine the shape and gradient of the indentation, which provides useful information on the state of the electrodes and may indicate problems in the fit between parts (see Figure 3). All of this information provides useful feedback to the welding process and is easily derived from the ultrasonic signals.
ii-234
Automotive Lightweighting Materials FY 2006 Progress Report
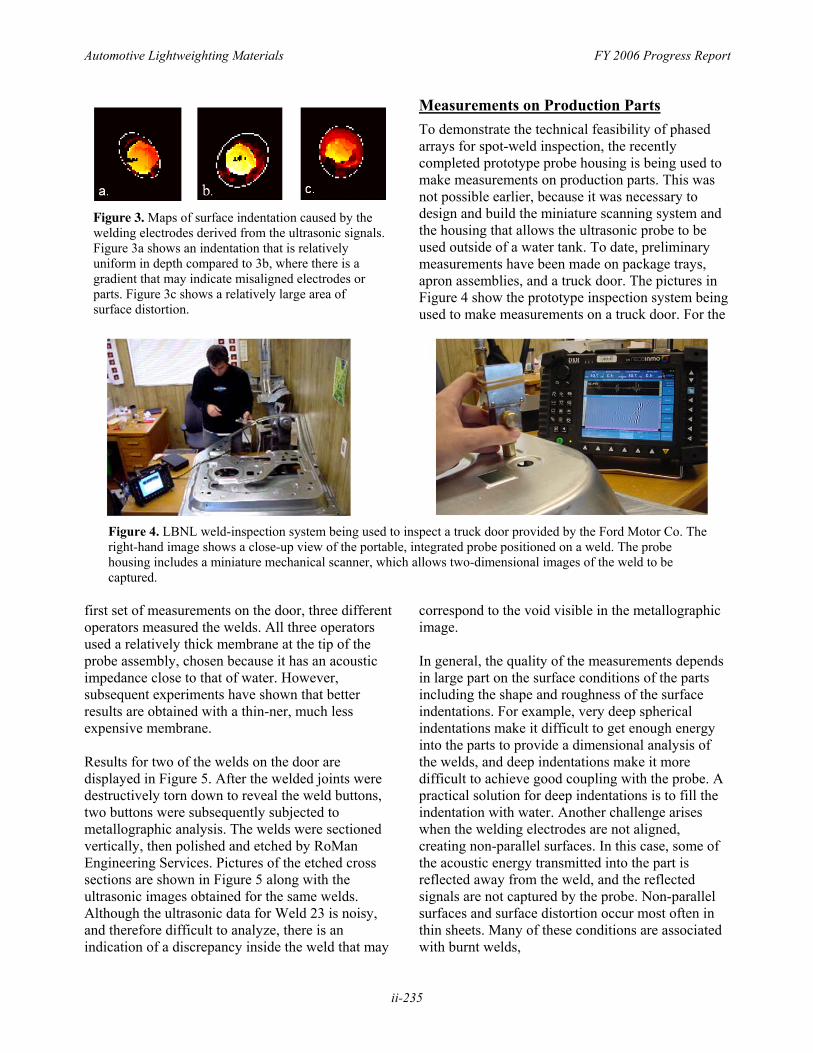
Figure 3. Maps of surface indentation caused by the welding electrodes derived from the ultrasonic signals. Figure 3a shows an indentation that is relatively uniform in depth compared to 3b, where there is a gradient that may indicate misaligned electrodes or parts. Figure 3c shows a relatively large area of surface distortion.
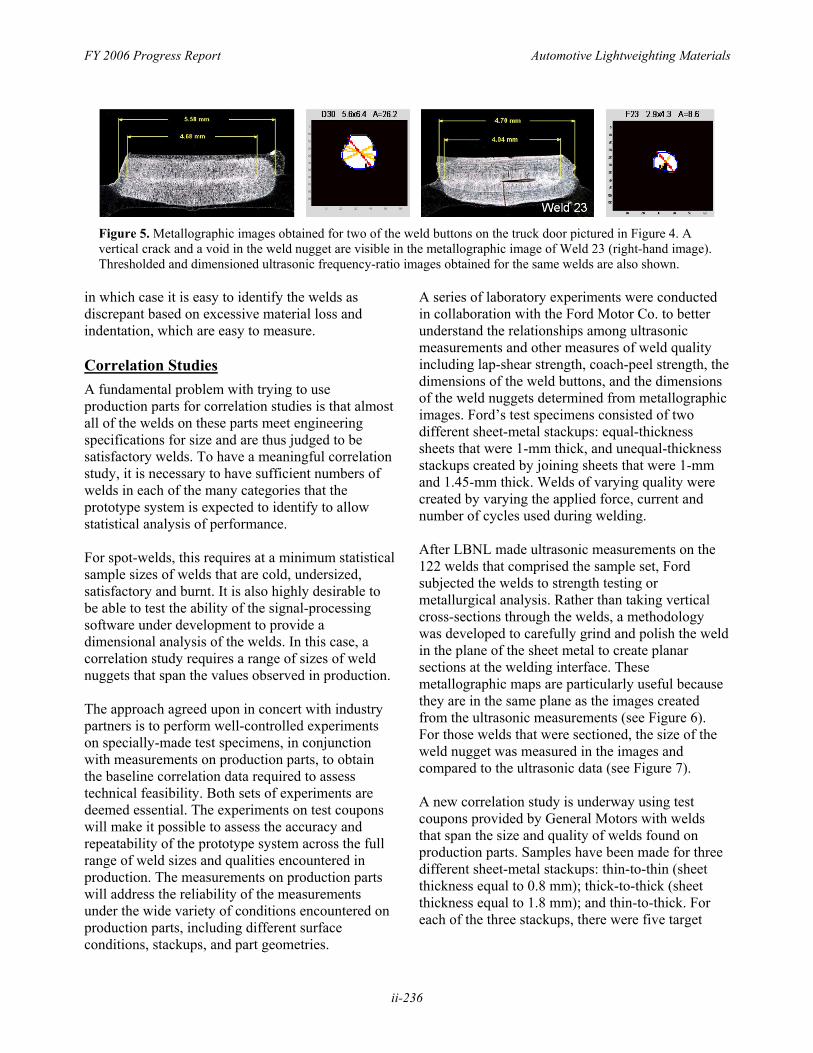
Measurements on Production Parts To demonstrate the technical feasibility of phased arrays for spot-weld inspection, the recently completed prototype probe housing is being used to make measurements on production parts. This was not possible earlier, because it was necessary to design and build the miniature scanning system and the housing that allows the ultrasonic probe to be used outside of a water tank. To date, preliminary measurements have been made on package trays, apron assemblies, and a truck door. The pictures in Figure 4 show the prototype inspection system being used to make measurements on a truck door. For the
Figure 4. LBNL weld-inspection system being used to inspect a truck door provided by the Ford Motor Co. The right-hand image shows a close-up view of the portable, integrated probe positioned on a weld. The probe housing includes a miniature mechanical scanner, which allows two-dimensional images of the weld to be captured.
first set of measurements on the door, three different operators measured the welds. All three operators used a relatively thick membrane at the tip of the probe assembly, chosen because it has an acoustic impedance close to that of water. However, subsequent experiments have shown that better results are obtained with a thin-ner, much less expensive membrane.
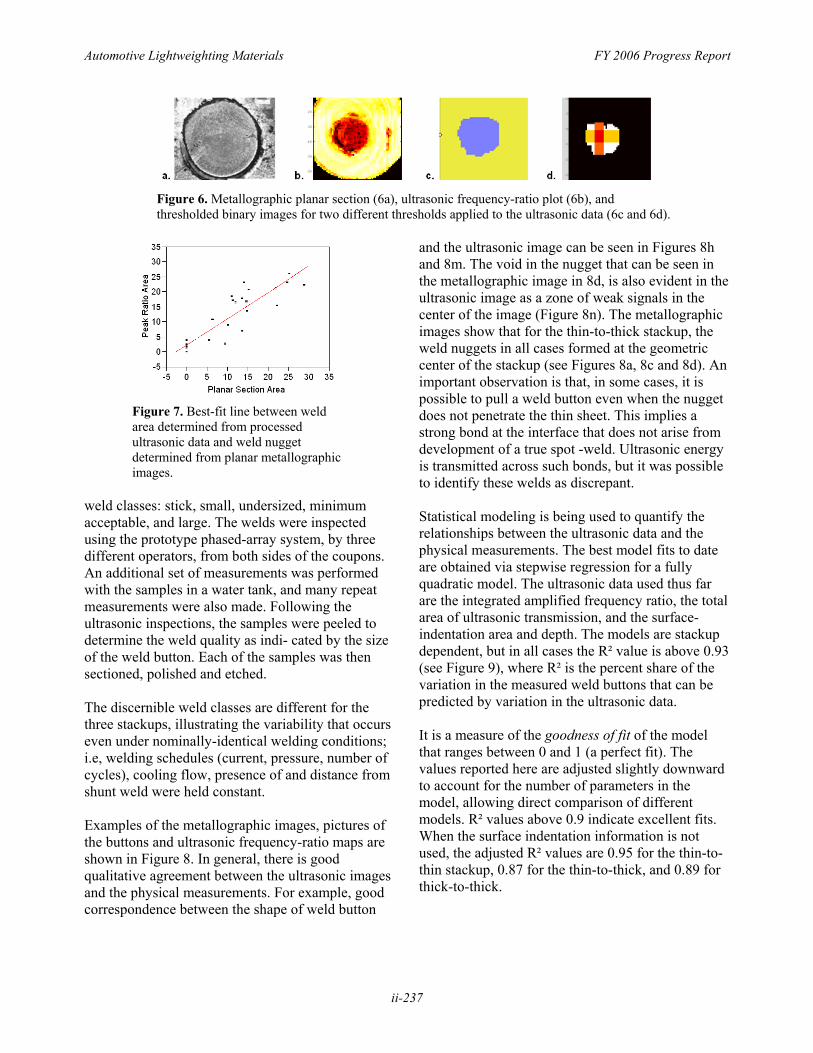
Results for two of the welds on the door are displayed in Figure 5. After the welded joints were destructively torn down to reveal the weld buttons, two buttons were subsequently subjected to metallographic analysis. The welds were sectioned vertically, then polished and etched by RoMan Engineering Services. Pictures of the etched cross sections are shown in Figure 5 along with the ultrasonic images obtained for the same welds. Although the ultrasonic data for Weld 23 is noisy, and therefore difficult to analyze, there is an indication of a discrepancy inside the weld that may
correspond to the void visible in the metallographic image.
In general, the quality of the measurements depends in large part on the surface conditions of the parts including the shape and roughness of the surface indentations. For example, very deep spherical indentations make it difficult to get enough energy into the parts to provide a dimensional analysis of the welds, and deep indentations make it more difficult to achieve good coupling with the probe. A practical solution for deep indentations is to fill the indentation with water. Another challenge arises when the welding electrodes are not aligned, creating non-parallel surfaces. In this case, some of the acoustic energy transmitted into the part is reflected away from the weld, and the reflected signals are not captured by the probe. Non-parallel surfaces and surface distortion occur most often in thin sheets. Many of these conditions are associated with burnt welds,
ii-235
FY 2006 Progress Report Automotive Lightweighting Materials
Figure 5. Metallographic images obtained for two of the weld buttons on the truck door pictured in Figure 4. A vertical crack and a void in the weld nugget are visible in the metallographic image of Weld 23 (right-hand image). Thresholded and dimensioned ultrasonic frequency-ratio images obtained for the same welds are also shown.
in which case it is easy to identify the welds as discrepant based on excessive material loss and indentation, which are easy to measure.
Correlation Studies A fundamental problem with trying to use production parts for correlation studies is that almost all of the welds on these parts meet engineering specifications for size and are thus judged to be satisfactory welds. To have a meaningful correlation study, it is necessary to have sufficient numbers of welds in each of the many categories that the prototype system is expected to identify to allow statistical analysis of performance.
For spot-welds, this requires at a minimum statistical sample sizes of welds that are cold, undersized, satisfactory and burnt. It is also highly desirable to be able to test the ability of the signal-processing software under development to provide a dimensional analysis of the welds. In this case, a correlation study requires a range of sizes of weld nuggets that span the values observed in production.
The approach agreed upon in concert with industry partners is to perform well-controlled experiments on specially-made test specimens, in conjunction with measurements on production parts, to obtain the baseline correlation data required to assess technical feasibility. Both sets of experiments are deemed essential. The experiments on test coupons will make it possible to assess the accuracy and repeatability of the prototype system across the full range of weld sizes and qualities encountered in production. The measurements on production parts will address the reliability of the measurements under the wide variety of conditions encountered on production parts, including different surface conditions, stackups, and part geometries.
A series of laboratory experiments were conducted in collaboration with the Ford Motor Co. to better understand the relationships among ultrasonic measurements and other measures of weld quality including lap-shear strength, coach-peel strength, the dimensions of the weld buttons, and the dimensions of the weld nuggets determined from metallographic images. Ford’s test specimens consisted of two different sheet-metal stackups: equal-thickness sheets that were 1-mm thick, and unequal-thickness stackups created by joining sheets that were 1-mm and 1.45-mm thick. Welds of varying quality were created by varying the applied force, current and number of cycles used during welding.
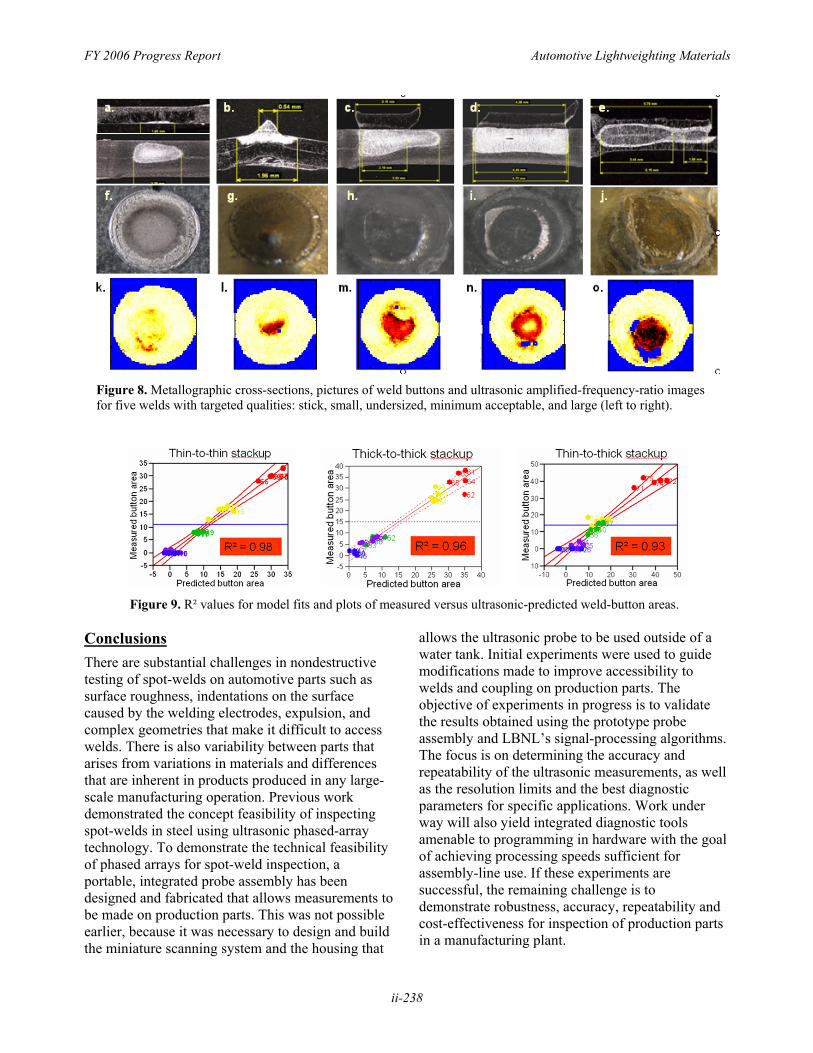
After LBNL made ultrasonic measurements on the 122 welds that comprised the sample set, Ford subjected the welds to strength testing or metallurgical analysis. Rather than taking vertical cross-sections through the welds, a methodology was developed to carefully grind and polish the weld in the plane of the sheet metal to create planar sections at the welding interface. These metallographic maps are particularly useful because they are in the same plane as the images created from the ultrasonic measurements (see Figure 6). For those welds that were sectioned, the size of the weld nugget was measured in the images and compared to the ultrasonic data (see Figure 7).
A new correlation study is underway using test coupons provided by General Motors with welds that span the size and quality of welds found on production parts. Samples have been made for three different sheet-metal stackups: thin-to-thin (sheet thickness equal to 0.8 mm); thick-to-thick (sheet thickness equal to 1.8 mm); and thin-to-thick. For each of the three stackups, there were five target
ii-236
Automotive Lightweighting Materials FY 2006 Progress Report
Figure 6. Metallographic planar section (6a), ultrasonic frequency-ratio plot (6b), and thresholded binary images for two different thresholds applied to the ultrasonic data (6c and 6d).
Figure 7. Best-fit line between weld area determined from processed ultrasonic data and weld nugget determined from planar metallographic images.
weld classes: stick, small, undersized, minimum acceptable, and large. The welds were inspected using the prototype phased-array system, by three different operators, from both sides of the coupons. An additional set of measurements was performed with the samples in a water tank, and many repeat measurements were also made. Following the ultrasonic inspections, the samples were peeled to determine the weld quality as indi- cated by the size of the weld button. Each of the samples was then sectioned, polished and etched.
The discernible weld classes are different for the three stackups, illustrating the variability that occurs even under nominally-identical welding conditions; i.e, welding schedules (current, pressure, number of cycles), cooling flow, presence of and distance from shunt weld were held constant.
Examples of the metallographic images, pictures of the buttons and ultrasonic frequency-ratio maps are shown in Figure 8. In general, there is good qualitative agreement between the ultrasonic images and the physical measurements. For example, good correspondence between the shape of weld button
and the ultrasonic image can be seen in Figures 8h and 8m. The void in the nugget that can be seen in the metallographic image in 8d, is also evident in the ultrasonic image as a zone of weak signals in the center of the image (Figure 8n). The metallographic images show that for the thin-to-thick stackup, the weld nuggets in all cases formed at the geometric center of the stackup (see Figures 8a, 8c and 8d). An important observation is that, in some cases, it is possible to pull a weld button even when the nugget does not penetrate the thin sheet. This implies a strong bond at the interface that does not arise from development of a true spot -weld. Ultrasonic energy is transmitted across such bonds, but it was possible to identify these welds as discrepant.
Statistical modeling is being used to quantify the relationships between the ultrasonic data and the physical measurements. The best model fits to date are obtained via stepwise regression for a fully quadratic model. The ultrasonic data used thus far are the integrated amplified frequency ratio, the total area of ultrasonic transmission, and the surfaceindentation area and depth. The models are stackup dependent, but in all cases the R² value is above 0.93 (see Figure 9), where R² is the percent share of the variation in the measured weld buttons that can be predicted by variation in the ultrasonic data.
It is a measure of the goodness of fit of the model that ranges between 0 and 1 (a perfect fit). The values reported here are adjusted slightly downward to account for the number of parameters in the model, allowing direct comparison of different models. R² values above 0.9 indicate excellent fits. When the surface indentation information is not used, the adjusted R² values are 0.95 for the thin-tothin stackup, 0.87 for the thin-to-thick, and 0.89 for thick-to-thick.
ii-237
FY 2006 Progress Report Automotive Lightweighting Materials
Figure 8. Metallographic cross-sections, pictures of weld buttons and ultrasonic amplified-frequency-ratio images for five welds with targeted qualities: stick, small, undersized, minimum acceptable, and large (left to right).
Figure 9. R² values for model fits and plots of measured versus ultrasonic-predicted weld-button areas.
Conclusions There are substantial challenges in nondestructive testing of spot-welds on automotive parts such as surface roughness, indentations on the surface caused by the welding electrodes, expulsion, and complex geometries that make it difficult to access welds. There is also variability between parts that arises from variations in materials and differences that are inherent in products produced in any largescale manufacturing operation. Previous work demonstrated the concept feasibility of inspecting spot-welds in steel using ultrasonic phased-array technology. To demonstrate the technical feasibility of phased arrays for spot-weld inspection, a portable, integrated probe assembly has been designed and fabricated that allows measurements to be made on production parts. This was not possible earlier, because it was necessary to design and build the miniature scanning system and the housing that
allows the ultrasonic probe to be used outside of a water tank. Initial experiments were used to guide modifications made to improve accessibility to welds and coupling on production parts. The objective of experiments in progress is to validate the results obtained using the prototype probe assembly and LBNL’s signal-processing algorithms. The focus is on determining the accuracy and repeatability of the ultrasonic measurements, as well as the resolution limits and the best diagnostic parameters for specific applications. Work under way will also yield integrated diagnostic tools amenable to programming in hardware with the goal of achieving processing speeds sufficient for assembly-line use. If these experiments are successful, the remaining challenge is to demonstrate robustness, accuracy, repeatability and cost-effectiveness for inspection of production parts in a manufacturing plant.
ii-238

Automotive Lightweighting Materials FY 2006 Progress Report
Presentations Publications 1. D. Hopkins, “Strategic Plan for Nondestructive 1. W.B. Davis, “Simple Models and Methods for
Evaluation Development in the North American Estimating the Ultrasonic Reflectivity of Spot Automotive Industry and Ultrasonic Phased- Welds,” To appear in Proc. 33rd Annual Review Array System for Resistance Spot-Weld of Progress in Quantitative Nondestructive Inspection,” ASNT Automotive Industry Evaluation, Portland, 2007. Advancements with NDT, Birmingham, Alabama, June 7, 2006. 2. D. Hopkins, W.B. Davis and F. Reverdy,
“Diagnostic Capability of Processed Phased2. W.B. Davis, “Signal Processing to Measure Spot Array Images for Resistance-Spot-Weld
Weld Reflectivity with an Ultrasonic Phased Inspection,” To appear Proc. 33rd Annual Array.” 33rd Annual Review of Progress in Review of Progress in Quantitative Quantitative Nondestructive Evaluation, Nondestructive Evaluation, Portland, 2007. Portland, Oregon, August1, 2006.
3. T. Potter, B. Ghaffari, G. Mozurkewich, F. 3. D. Hopkins, “Diagnostic Capability of Reverdy and D. Hopkins, “Comparison of
Processed Phased-Array Images for Resistance- Metallurgical and Ultrasonic Inspections of Spot-Weld Inspection,” 33rd Annual Review of Galvanized Steel Resistance Spot Welds,” Proc. Progress in Quantitative Nondestructive 32nd Annual Review of Progress in Quantitative Evaluation, Portland, Oregon, August 2, 2006. Nondestructive Evaluation, 2006.
4. D. Hopkins, “Development of an Ultrasonic 4. F. Reverdy, D. Hopkins, D. Turler, and K. Phased-Array System for Nondestructive Nihei, “Use of Ultrasonic Phased Arrays for Evaluation of Resistance Spot Welds,” United Weld Inspection and Material Characterization,” States Automotive Materials Partnership Proc. Third US-Japan Symp. on Advancing (USAMP) ― Automotive Materials Division Applications and Capabilities in NDE, 2005. (AMD) Joining Offsite, December 2005, Southfield, Michigan.
ii-239