6. An approach from Spanish urban water supply companies, Fernando...
23
I Climate Change An approach from urban water supply companies Fernando Arlandis Assistant Director of Studies, Programs, and Corporate Social Responsibility Canal de Isabel II International Workshop Climate Change and Water Utilities Madrid, january 2009
Transcript of 6. An approach from Spanish urban water supply companies, Fernando...
I
Climate ChangeAn approach from urban water supply companies
Fernando ArlandisAssistant Director of Studies, Programs, and Corporate Social ResponsibilityCanal de Isabel II
International Workshop Climate Change and Water Utilities
Madrid, january 2009
Introduction
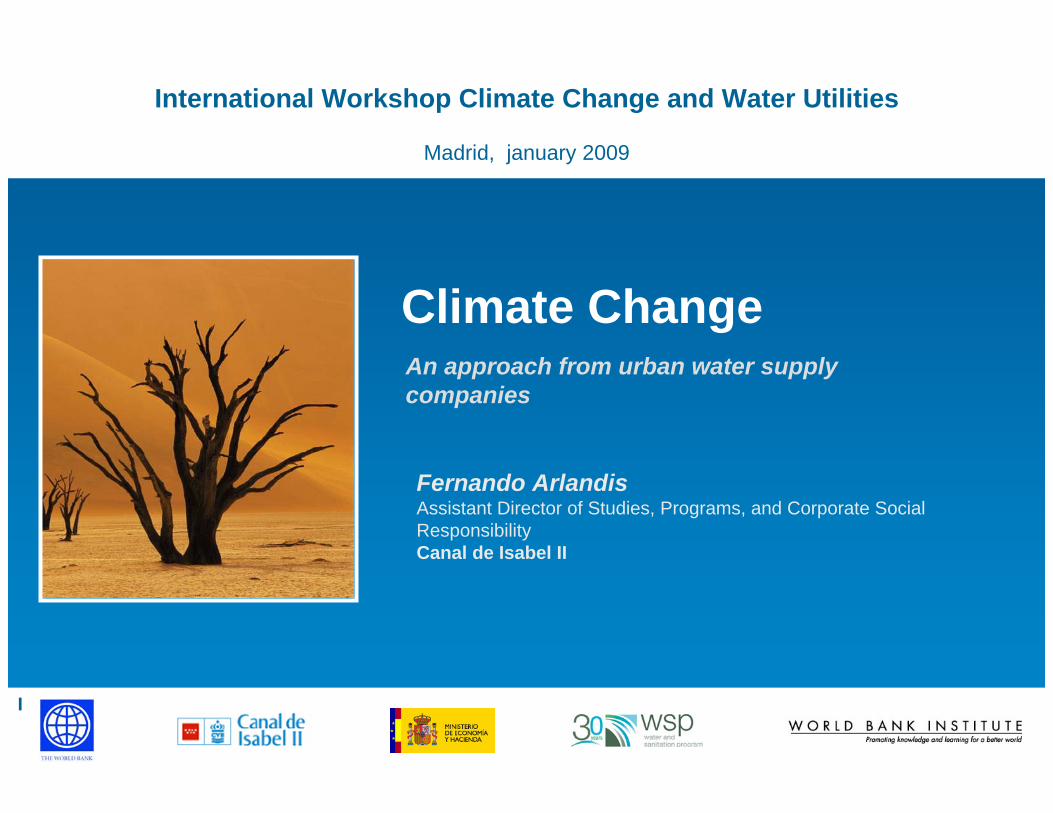
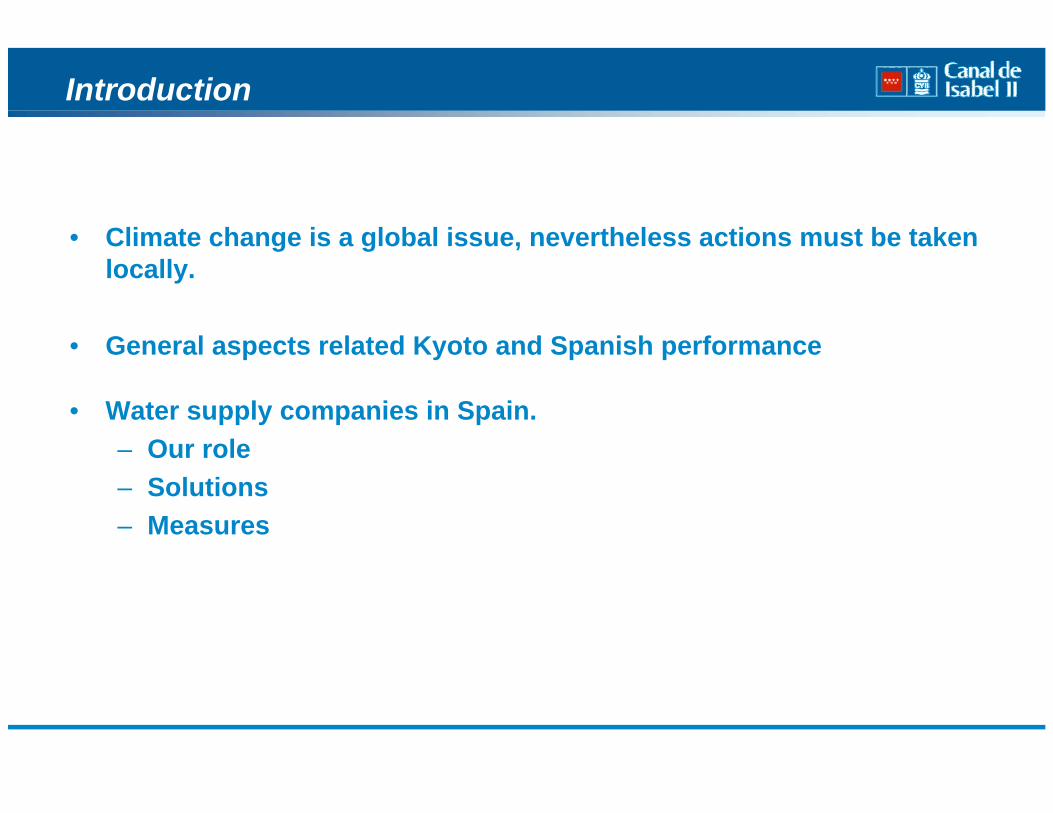
• Climate change is a global issue, nevertheless actions must be taken locally.
• General aspects related Kyoto and Spanish performance
• Water supply companies in Spain.– Our role– Solutions– Measures
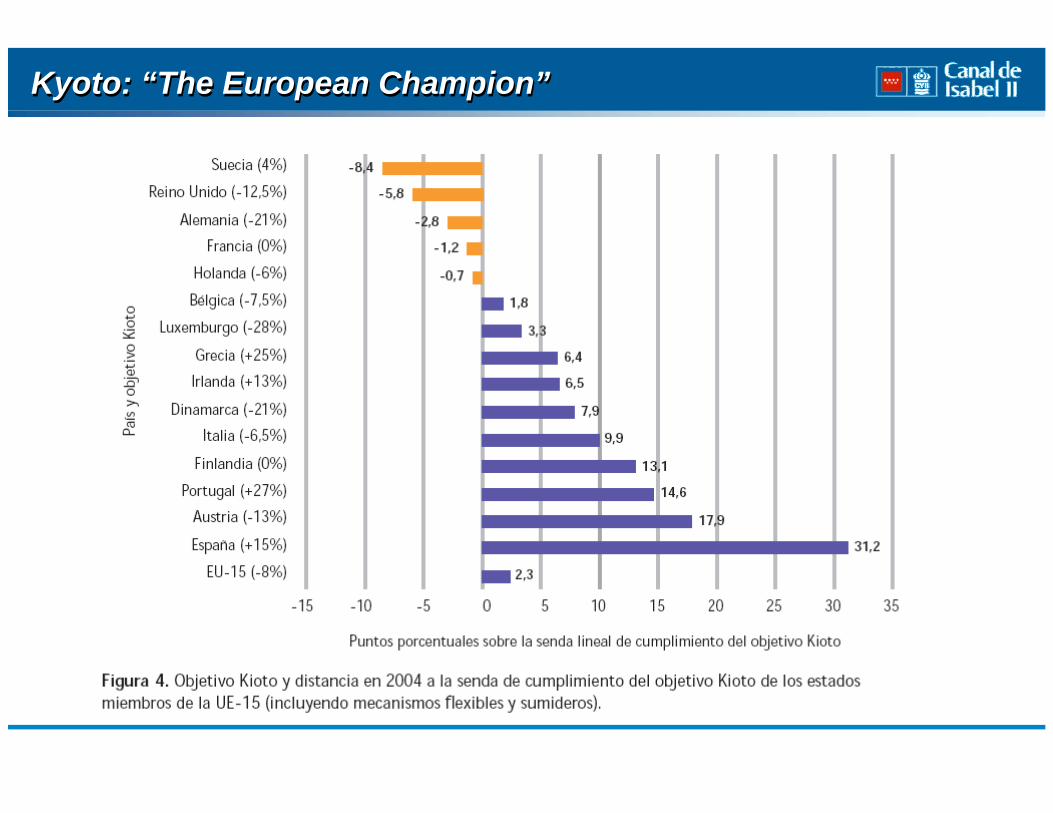
Kyoto: “The European Champion”Kyoto: “The European Champion”

Kyoto: Spanish case (II)Kyoto: Spanish case (II)
5
7
9
11
13
15
17Po
rtug
al
tCO
2/ hab
Media UE
Los que más suben Los que más bajan
EU Commitments
5
7
9
11
13
15
17Po
rtug
al
Spai
n
Gre
ece
UK
Den
mar
k
Ger
man
y
tCO
2/ hab Kyoto Germany
EU
Kyoto SpainAllowed emisions
Allowed emisions
Largest decrease in emissionslargest growing in emissions
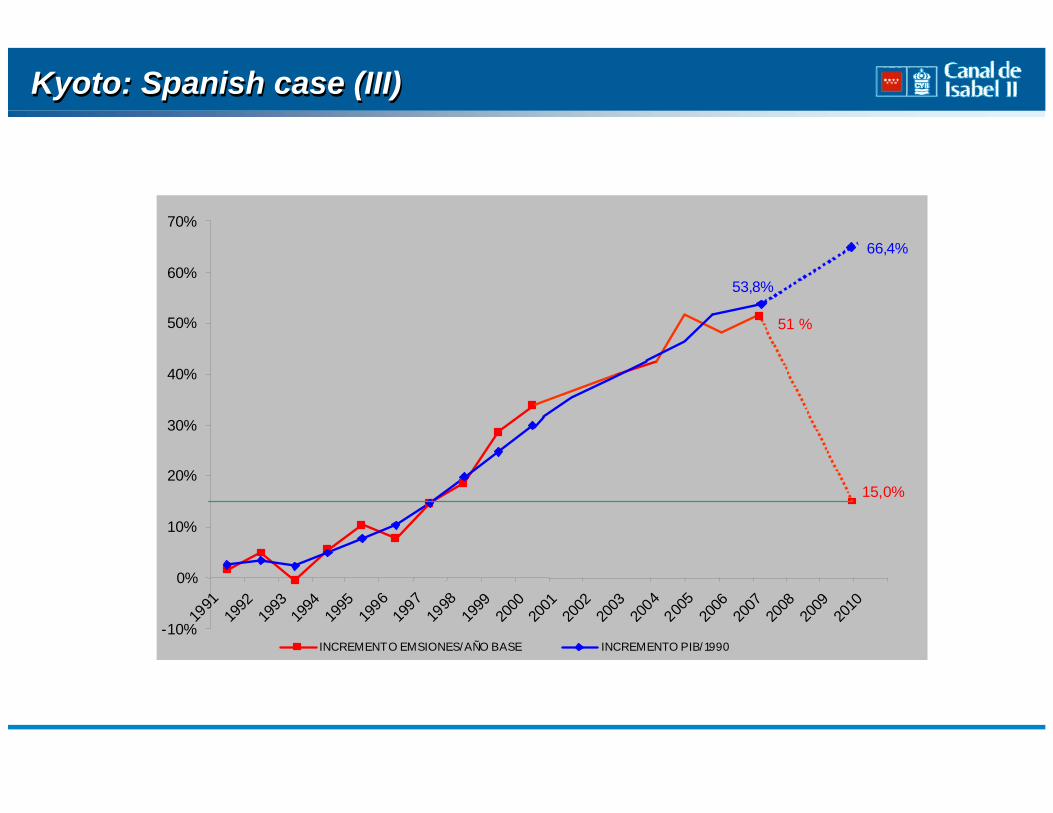
Kyoto: Spanish case (III)Kyoto: Spanish case (III)
15,0%
53,8%
66,4%
51 %
-10%
0%
10%
20%
30%
40%
50%
60%
70%
1991
1992
1993
1994
1995
1996
1997
1998
1999
2000
2001
2002
2003
2004
2005
2006
2007
2008
2009
2010
INCREMENTO EMSIONES/AÑO BASE INCREMENTO PIB/1990
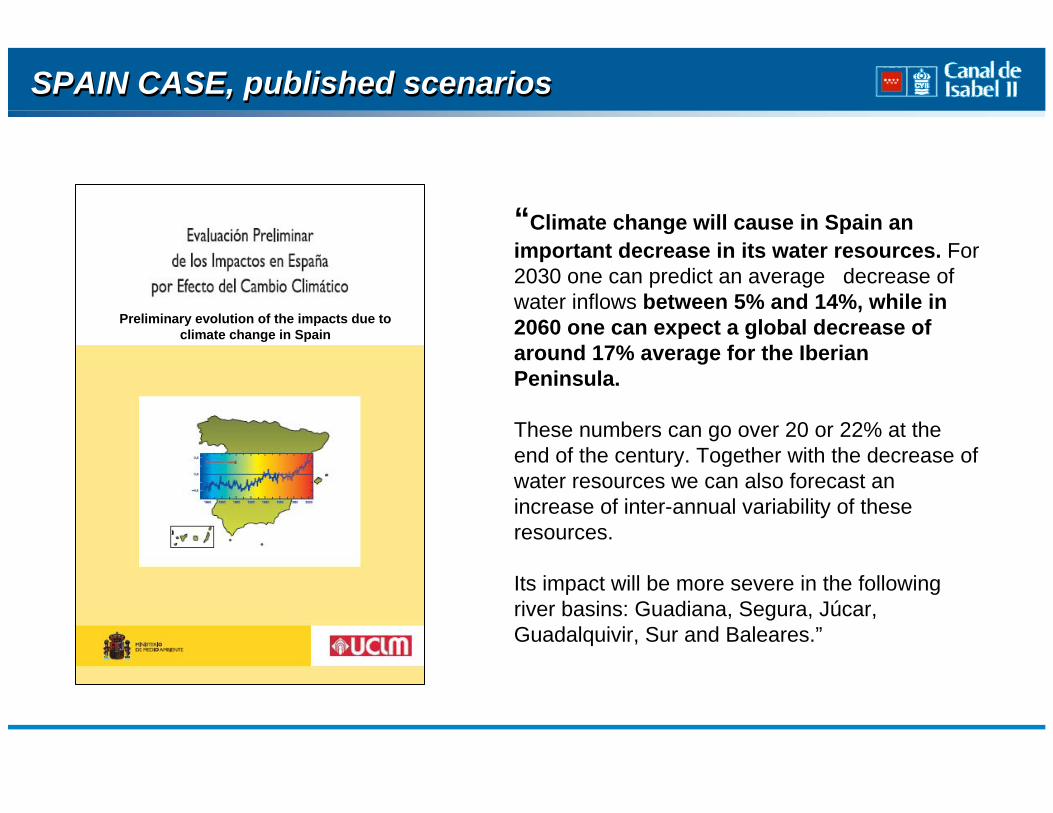
SPAIN CASE, published scenarios SPAIN CASE, published scenarios
“Climate change will cause in Spain an important decrease in its water resources. For 2030 one can predict an average decrease of water inflows between 5% and 14%, while in 2060 one can expect a global decrease of around 17% average for the Iberian Peninsula.
These numbers can go over 20 or 22% at the end of the century. Together with the decrease of water resources we can also forecast an increase of inter-annual variability of these resources.
Its impact will be more severe in the following river basins: Guadiana, Segura, Júcar, Guadalquivir, Sur and Baleares.”
Preliminary evolution of the impacts due to climate change in Spain
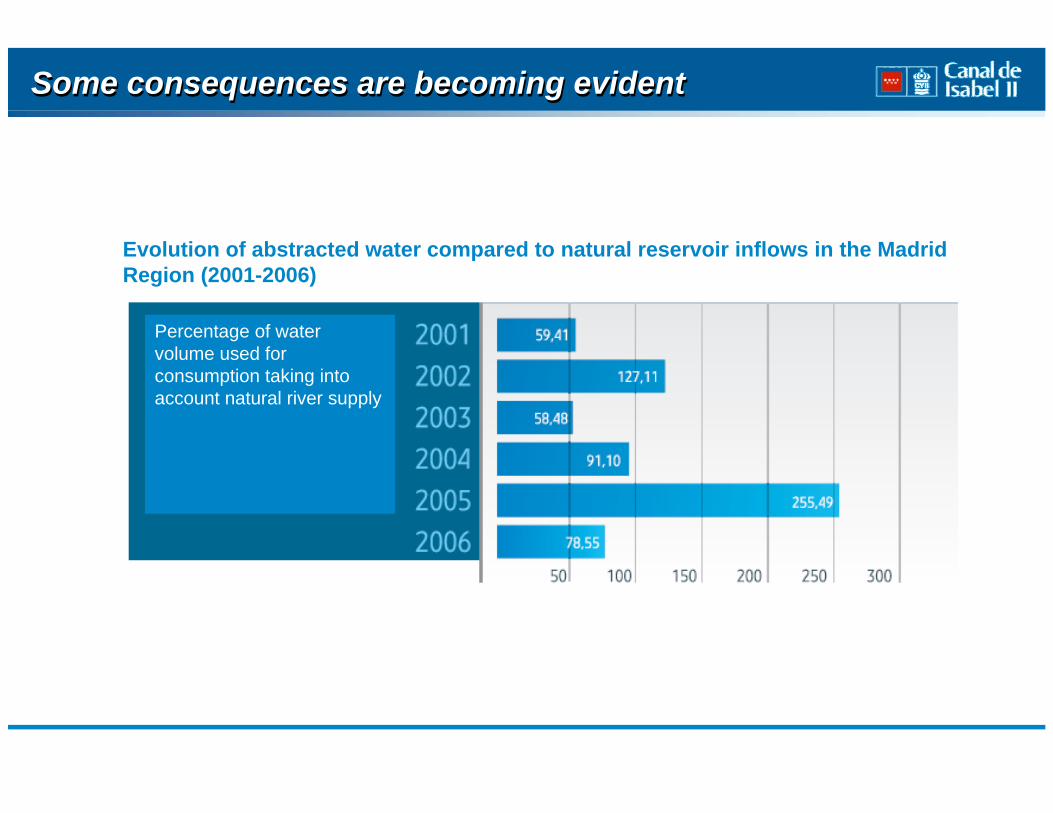
Some consequences are becoming evidentSome consequences are becoming evident
Evolution of abstracted water compared to natural reservoir inflows in the Madrid Region (2001-2006)
Percentage of water volume used for consumption taking into account natural river supply

Urban13%
Indust rial5%
Irrigat ion68%
Coo ling Syst ems
14%
ACTUAL uses and demands
Consumption profile in Spain : Demand StructureConsumption profile in Spain : Demand Structure
Demand composition of water supplies in the main river basins of Spain
Source: INE 2006 y Martínez Hernández (2003)
HM3/YEAR
Irrigation 25.200
Urban 4.667
Cooling 4.915 Industrial 1.647
Total 38.200
Habitants
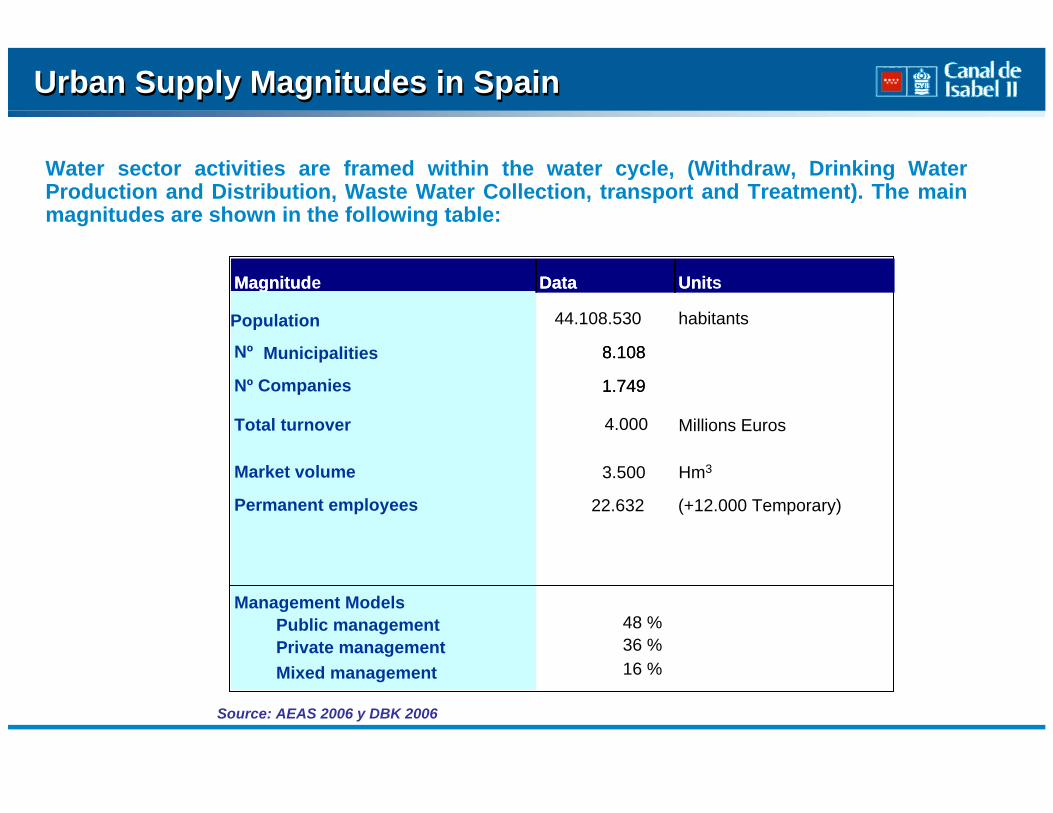
Water sector activities are framed within the water cycle, (Withdraw, Drinking Water Production and Distribution, Waste Water Collection, transport and Treatment). The main magnitudes are shown in the following table:
Magnitud Data Unit
Población servida 44.108.530 habitants
Nº Municipios 8.108
Nº de Empresas 1.749 Mercado en ValorFacturación Abastecimiento
Facturación en Obras y servicios
Mercado en volumen
Empleados fijos del sector
Magnitude Data Units
Population
Nº Municipalities 8.108
Nº Companies 1.749
Source: AEAS 2006 y DBK 2006
22.632 (+12.000 Temporary)
Market volume 3.500 Hm3
Permanent employees
4.000Total turnover Millions Euros
Management ModelsPublic managementPrivate managementMixed management
48 %36 %16 %
Urban Supply Magnitudes in Spain Urban Supply Magnitudes in Spain
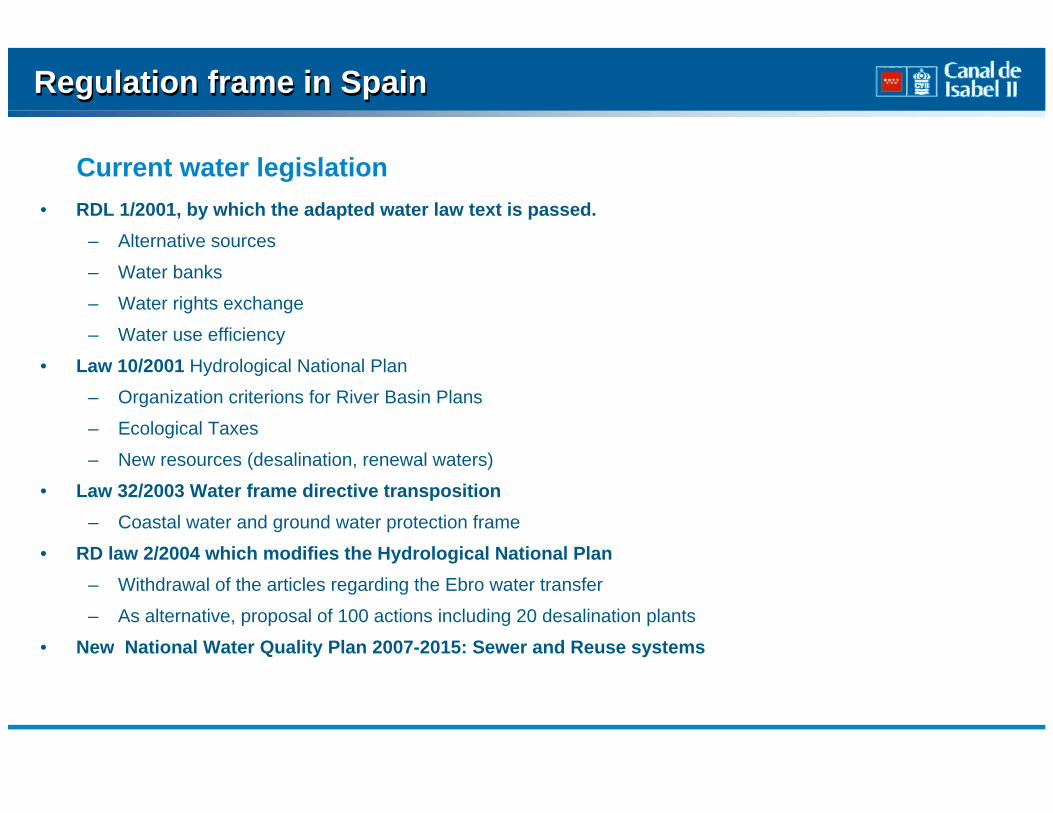
• RDL 1/2001, by which the adapted water law text is passed.– Alternative sources
– Water banks
– Water rights exchange
– Water use efficiency
• Law 10/2001 Hydrological National Plan
– Organization criterions for River Basin Plans
– Ecological Taxes
– New resources (desalination, renewal waters)
• Law 32/2003 Water frame directive transposition– Coastal water and ground water protection frame
• RD law 2/2004 which modifies the Hydrological National Plan– Withdrawal of the articles regarding the Ebro water transfer
– As alternative, proposal of 100 actions including 20 desalination plants
• New National Water Quality Plan 2007-2015: Sewer and Reuse systems
Current water legislation
Regulation frame in SpainRegulation frame in Spain
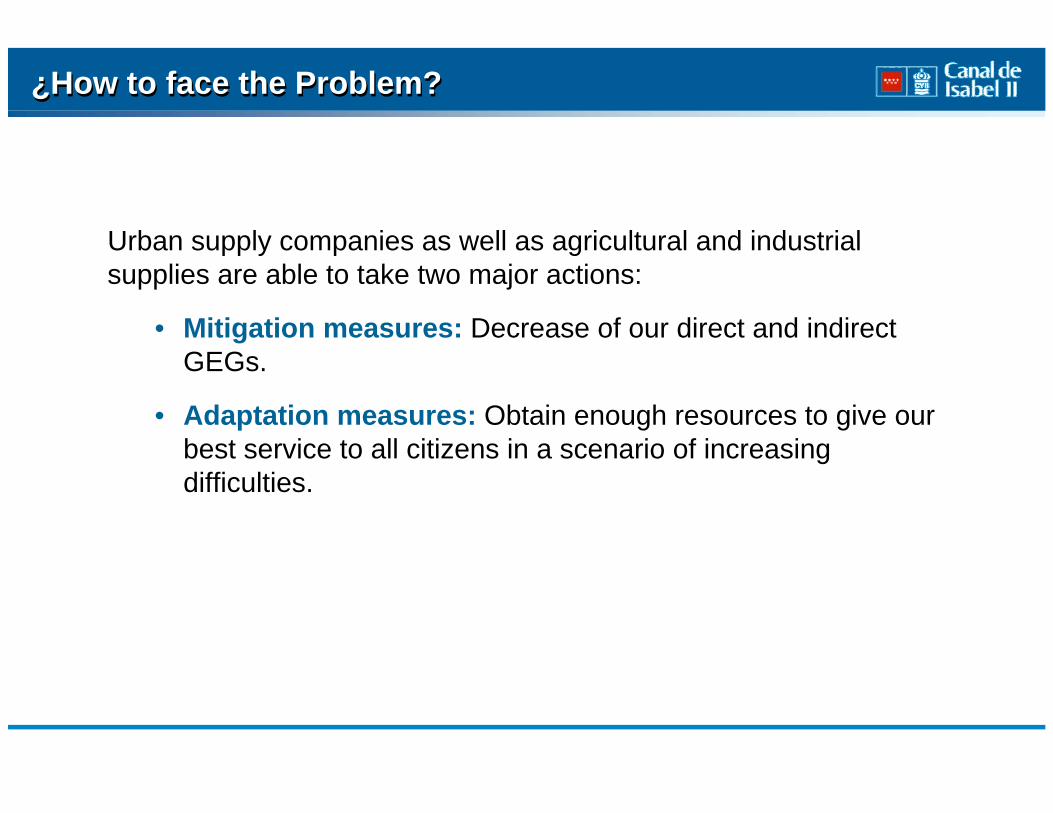
¿How to face the Problem? ¿How to face the Problem?
Urban supply companies as well as agricultural and industrial supplies are able to take two major actions:
• Mitigation measures: Decrease of our direct and indirect GEGs.
• Adaptation measures: Obtain enough resources to give our best service to all citizens in a scenario of increasing difficulties.
Energy consumption kWh/m3
CYCLE PHASES MINIMUM MAXIMUN CYII (03-07)
WITHDRAWAL 0,00 5,41 0,03
TREATMENT 0,03 0,17 0,03
DISTRIBUTION 0,18 0,32 0,24
SEWER SYSTEM 0,00 1,80 0,04
SEWER TREATMENT 0,29 1,30 0,42
WATER REUSE (Recycling) 0,11 0,32 0,04
TOTAL WATER CYCLE 0,61 9,32 0,80
Emissions kgCO2/m3
CYCLE PHASES MINIMUM MAXIMUN CYII (03-07)
WITHDRAWAL 0,00 1,93 0,01
TREATMENT 0,01 0,06 0,01
DISTRIBUTION 0,06 0,11 0,09
SEWER SYSTEM 0,00 0,64 0,01
SEWER TREATMENT 0,10 0,46 0,15
WATER REUSE (Recycling) 0,04 0,11 0,01
TOTAL WATER CYCLE 0,22 3,32 0,28
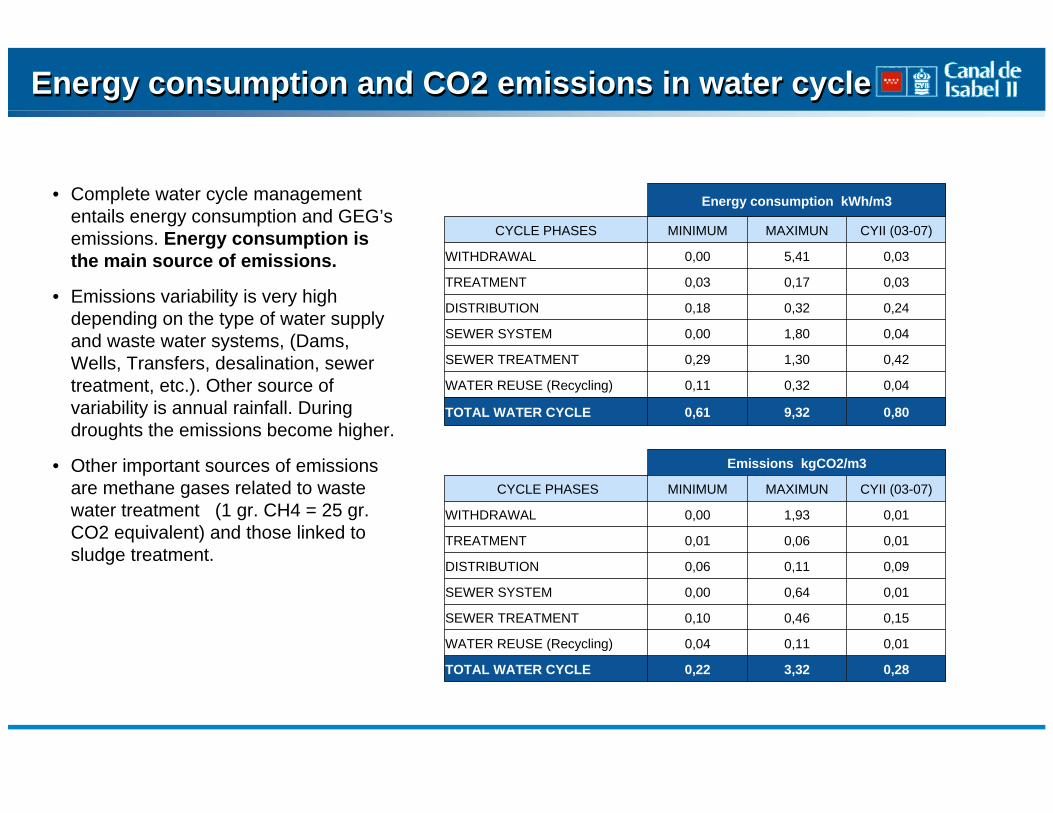
Energy consumption and CO2 emissions in water cycleEnergy consumption and CO2 emissions in water cycle
• Complete water cycle management entails energy consumption and GEG’semissions. Energy consumption is the main source of emissions.
• Emissions variability is very high depending on the type of water supply and waste water systems, (Dams, Wells, Transfers, desalination, sewer treatment, etc.). Other source of variability is annual rainfall. During droughts the emissions become higher.
• Other important sources of emissions are methane gases related to waste water treatment (1 gr. CH4 = 25 gr. CO2 equivalent) and those linked to sludge treatment.

Emissions origen GEG-CYII
24%
68%
8%
Directs
Indirects (other causes)
Indirects (electricity)
Emissions sources % /Total DirectsIndirectEnergy
consumption
OtherIndirect
Elevation Plants 27.20%
Treatment plants and pumping waste waters 25,10%
Agricultural Emissions 20,70%
Other energy consumption 8,60%
Emissions within waste water plants (Microbial activity) 8,15%
Pumping Distribution Network 2,70%
Wells 2,60%
Drinking Water Treatment Plants 2,60%
Sludge to dumps 1,70%
Sludge transport 0,60%
Companies Vehicles 0,05%
¿Where do emissions come from? – An example¿Where do emissions come from? – An example
Total 189,28 kt CO2 eq. year
Alternatives to reduce the emissions in the sectorAlternatives to reduce the emissions in the sector
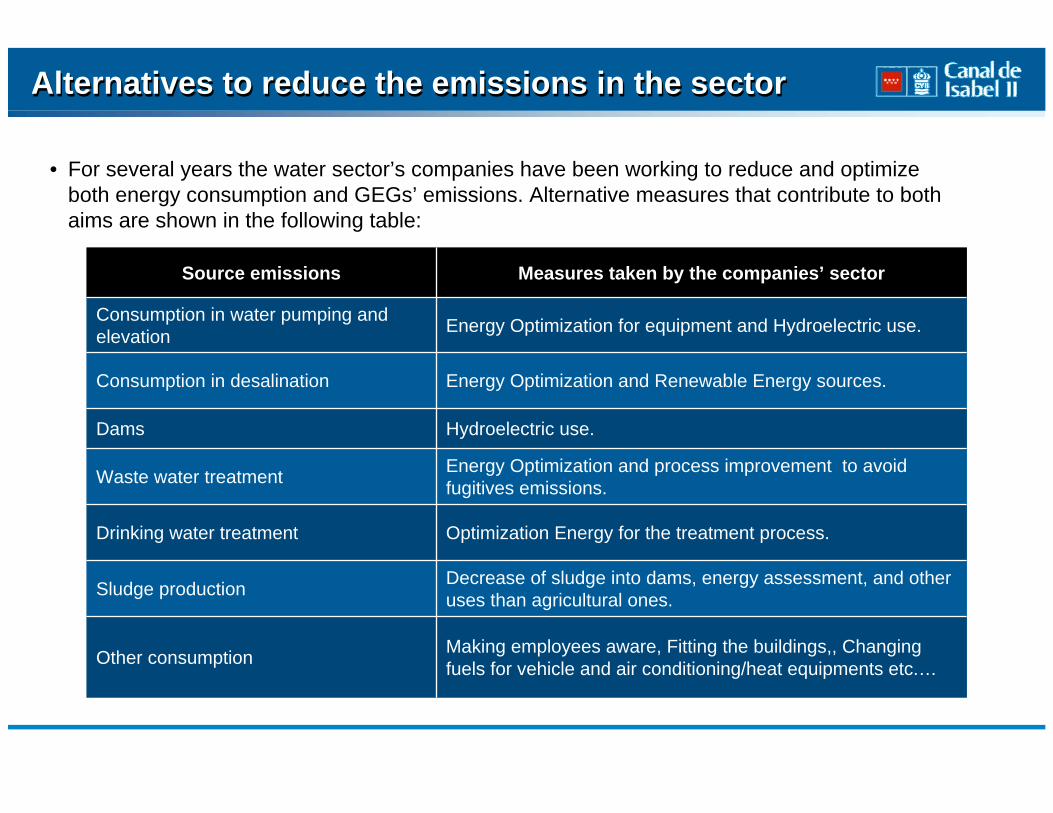
• For several years the water sector’s companies have been working to reduce and optimize both energy consumption and GEGs’ emissions. Alternative measures that contribute to both aims are shown in the following table:
Source emissions Measures taken by the companies’ sector
Consumption in water pumping and elevation Energy Optimization for equipment and Hydroelectric use.
Consumption in desalination Energy Optimization and Renewable Energy sources.
Dams Hydroelectric use.
Waste water treatment Energy Optimization and process improvement to avoid fugitives emissions.
Drinking water treatment Optimization Energy for the treatment process.
Sludge production Decrease of sludge into dams, energy assessment, and other uses than agricultural ones.
Other consumption Making employees aware, Fitting the buildings,, Changing fuels for vehicle and air conditioning/heat equipments etc.…
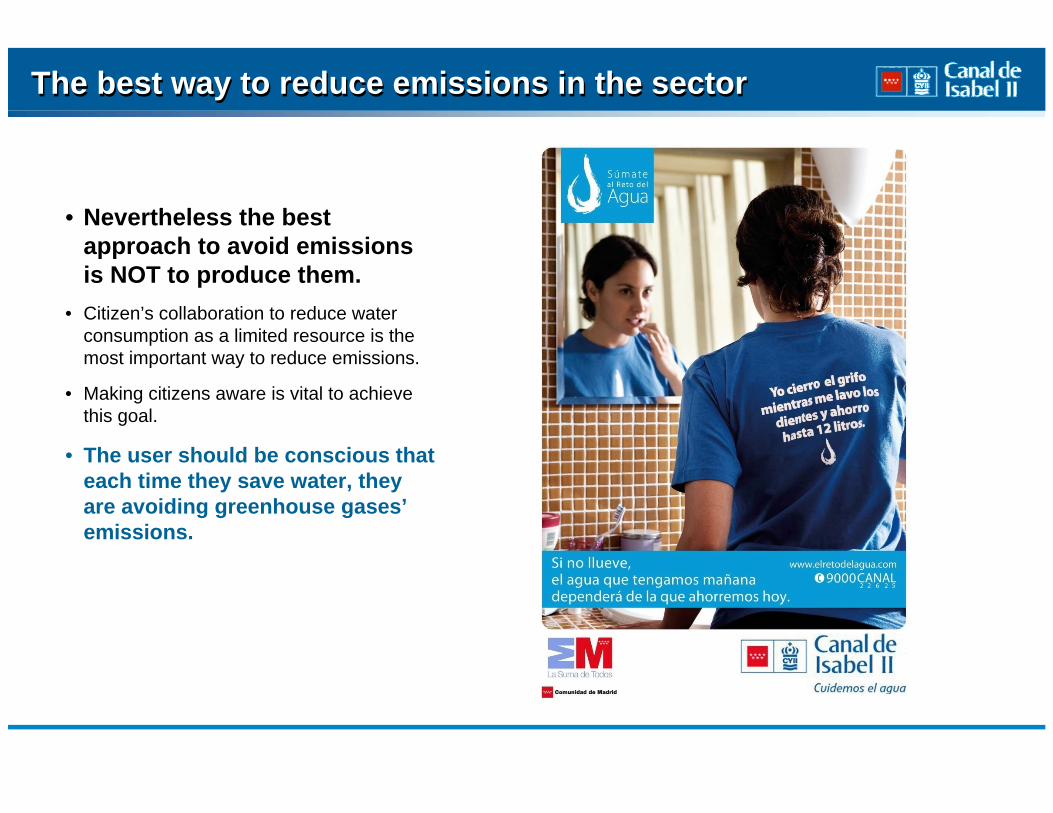
• Nevertheless the best approach to avoid emissions is NOT to produce them.
• Citizen’s collaboration to reduce water consumption as a limited resource is the most important way to reduce emissions.
• Making citizens aware is vital to achieve this goal.
• The user should be conscious that each time they save water, they are avoiding greenhouse gases’emissions.
The best way to reduce emissions in the sectorThe best way to reduce emissions in the sector
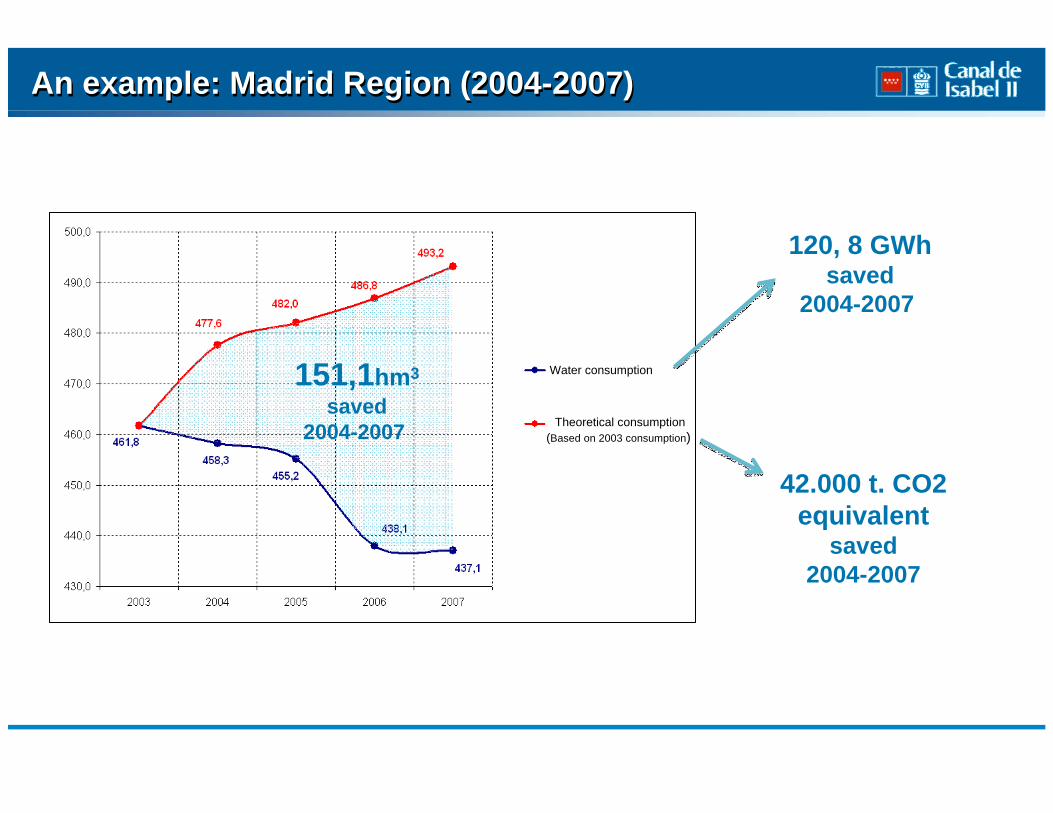
An example: Madrid Region (2004-2007)An example: Madrid Region (2004-2007)
120, 8 GWhsaved
2004-2007
42.000 t. CO2 equivalent
saved2004-2007
151,1hm3
saved2004-2007 Theoretical consumption
(Based on 2003 consumption)
Water consumption

Adaptation: Actual Situation and future perspectivesAdaptation: Actual Situation and future perspectives
In the future, Climate Change will hinder a proper water supply.
We must be prepared to guarantee water supply, reckoning with similar resources to the actual ones or even less since in future scenarios the drought’s periods will be longer and more frequent. Moreover taking into account the social and economic aspects, water companies have a major challenge ahead:
• Population increase (Example: The Madrid Region has grown more than one million people in the last 10 years.)
• The economic growth entails strong demand increases.
• Welfare and quality of life implies new water resources’ uses (sport and recreational uses, households with gardens and swimming pools, etc.).
• Social and regulation’s constraints to increase the capacity of water withdrawal and transfer.
¿What can be done in the water sector?
Protection of the existing resources
Obtaining new resources
Water management improvement
Measures on the demand
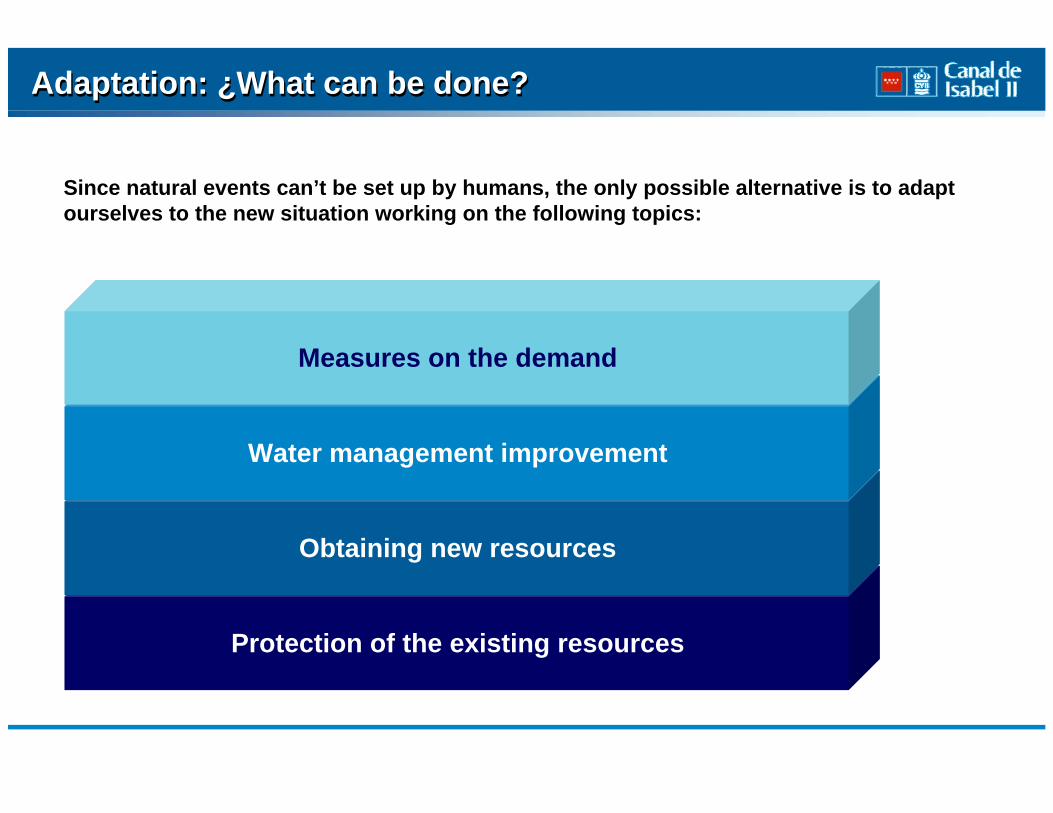
Since natural events can’t be set up by humans, the only possible alternative is to adaptourselves to the new situation working on the following topics:
Adaptation: ¿What can be done?Adaptation: ¿What can be done?
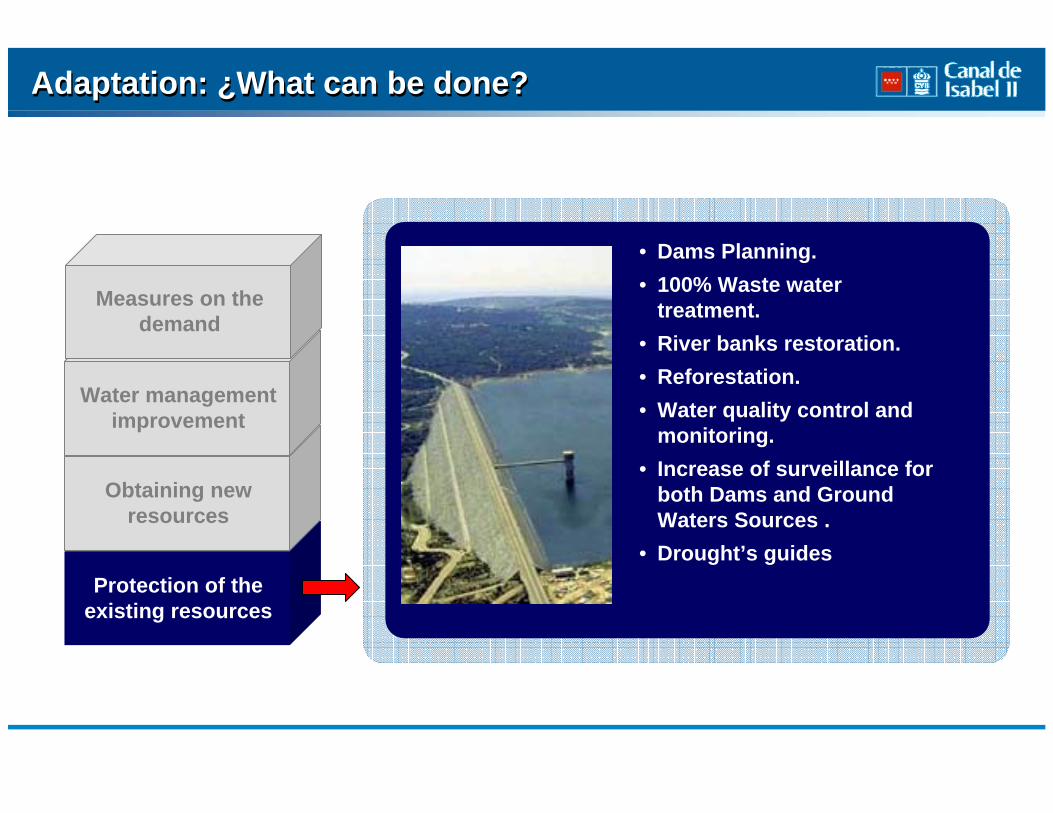
Protection of the existing resources
Obtaining new resources
Water management improvement
Measures on the demand
• Dams Planning.• 100% Waste water
treatment.• River banks restoration.• Reforestation.• Water quality control and
monitoring.• Increase of surveillance for
both Dams and Ground Waters Sources .
• Drought’s guides
Adaptation: ¿What can be done?Adaptation: ¿What can be done?
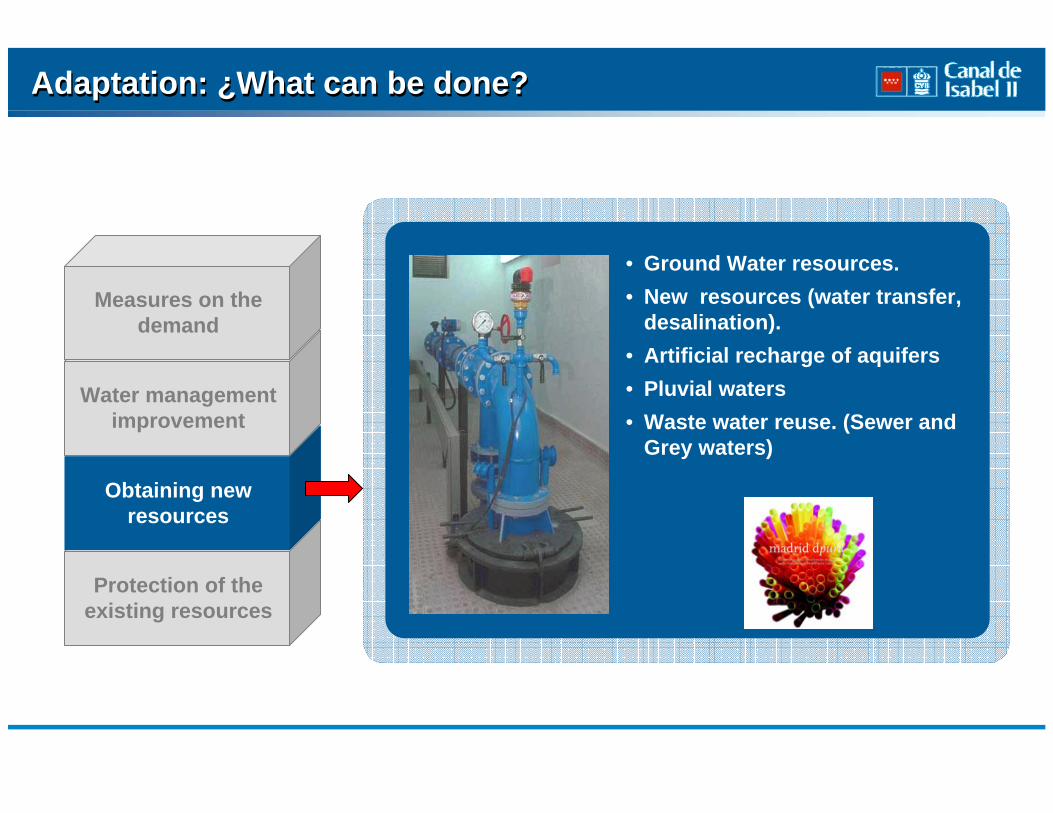
Protection of the existing resources
Obtaining new resources
Water management improvement
Measures on the demand
• Ground Water resources.• New resources (water transfer,
desalination).• Artificial recharge of aquifers • Pluvial waters • Waste water reuse. (Sewer and
Grey waters)
Adaptation: ¿What can be done?Adaptation: ¿What can be done?
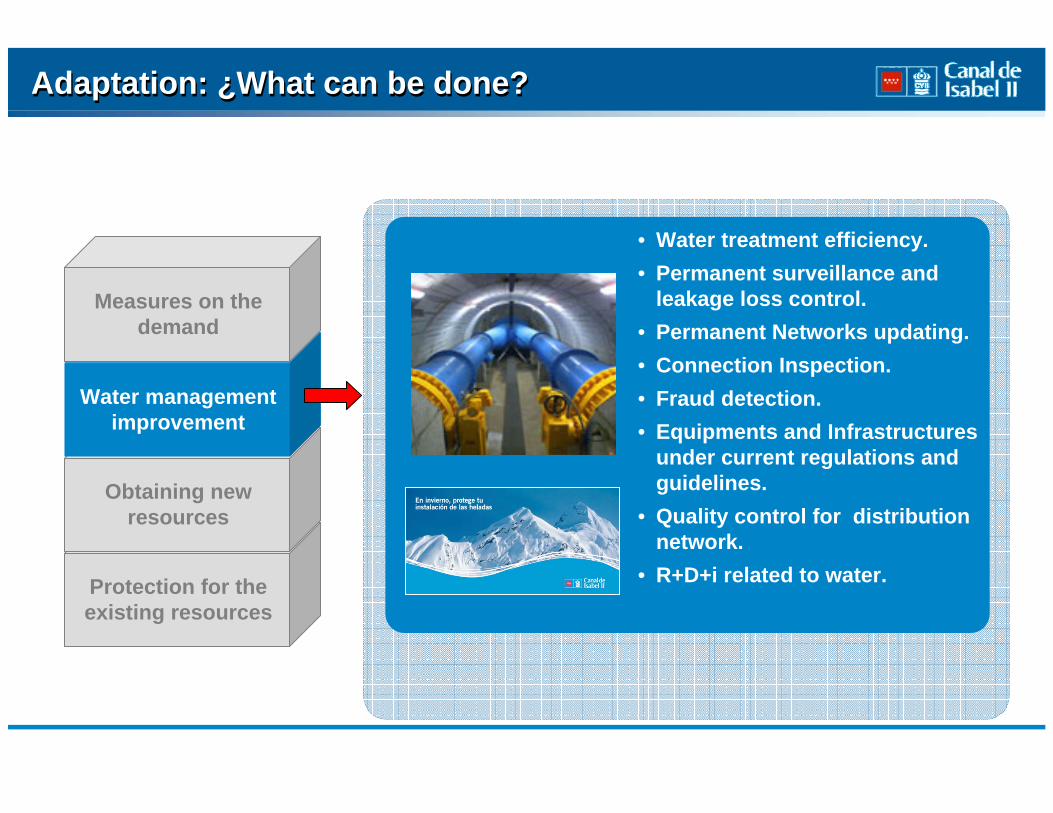
Protection for the existing resources
Obtaining new resources
Water management improvement
Measures on the demand
• Water treatment efficiency.• Permanent surveillance and
leakage loss control.• Permanent Networks updating.• Connection Inspection.• Fraud detection.• Equipments and Infrastructures
under current regulations and guidelines.
• Quality control for distribution network.
• R+D+i related to water.
Adaptation: ¿What can be done?Adaptation: ¿What can be done?

Protection of the existing resources
Obtaining new resources
Water management improvement
Measures on the demand
• Seasonal rate fee (Winter-Summer), which gives a bonus to rational use.
• Permanent communication campaigns to reinforce citizens awareness.
• Education campaigns on rational water use.
• Communication improvement through the Commercial Network.
• Modern irrigation and watering.
Adaptation: ¿What can be done?Adaptation: ¿What can be done?

To summarize: the water sector companies should emphasize the following aspects:
Resource protection: protection and use of new hydrological resources as much as possible.
Reinforce the Efficiency: improvement of all processes related to water cycle to give all citizens the best service. To provide citizens with all the means and resources to achieve the maximum efficiency.
Maintain Sustainability: Set up of actions that entail rational use, consumption’s reduction, renewal and pluvial waters use.
Adaptation: ¿What can be done?Adaptation: ¿What can be done?