document
2
74 Biomed Environ Sci, 2014; 27(1): 74-75 News & Analysis National Data of Class A, B, and C Communicable Diseases in December 2013 in China Case Number Death Number Disease Dec. Last Dec. Cum 2013 Cum 2012 Dec. Last Dec. Cum 2013 Cum 2012 Total 549 233 543 127 6 647 806 7 194 299 1764 1679 16 597 17 307 Plauge 0 0 0 1 0 0 0 1 Cholera 0 1 53 75 0 0 1 0 SARS 0 0 0 0 0 0 0 0 AIDS 5 952 5 849 63 498 58 399 1393 1420 10 974 11 467 Viral hepatitis 112 365 116 033 1 388 790 1 521 303 80 71 767 771 Type A 2 086 1 836 22 391 24 743 0 1 2 7 Type B 87 609 91 441 1 085 959 1 215 585 64 57 571 607 Type C 17 644 17 306 215 678 212 205 14 5 157 108 Type E 2 143 2 195 28 232 27 467 1 2 20 26 Unspecified 2 883 3 255 36 530 41 303 1 6 17 23 Poliomyelitis 0 0 0 1 0 0 0 0 HPAI 0 0 2 1 0 0 2 1 Measles 728 849 27 769 5 993 0 0 27 6 EHF 1 547 2 578 12 957 13 331 12 24 116 98 Rabies 109 109 1 176 1 421 112 135 1 119 1 362 Epidemic encephalitis B 67 21 2 182 1 788 5 7 67 65 Dengue fever 79 24 4 662 573 0 0 0 0 Anthrax 14 15 194 243 0 0 1 1 Pulmonary anthrax 0 0 0 0 0 0 0 0 Cutaneous 13 13 190 240 0 0 1 1 Unspecified 1 2 4 3 0 0 0 0 Dysentery 8 583 9 635 188 946 207 633 2 1 13 14 Bacillary 8 501 9 542 187 572 206 153 2 1 13 14 Amebic 82 93 1 374 1 480 0 0 0 0 Lung Tuberculosis 100 685 98 306 983 655 1 033 098 178 171 2 537 2 619 Bacteria(+) 25 370 27 146 335 243 379 042 85 75 1 282 1 379 Bacteria(-) 50 699 46 669 551 847 554 380 78 78 1 027 996 Not tested 24 247 24 170 93 975 97 173 14 18 219 236 Only Culture(+) 369 321 2 590 2 503 1 0 9 8 Typhoid and paratyphoid 1 065 825 14 146 12 059 0 1 3 4 Typhoid 854 632 10 724 8 877 0 1 3 4 Paratyphoid 211 193 3 422 3 182 0 0 0 0 ECM 20 18 206 202 2 0 22 24 Pertussis 136 85 1 709 2 213 0 0 0 1 Diphtheria 0 0 0 0 0 0 0 0
-
Upload
trinhkhanh -
Category
Documents
-
view
213 -
download
0
Transcript of document
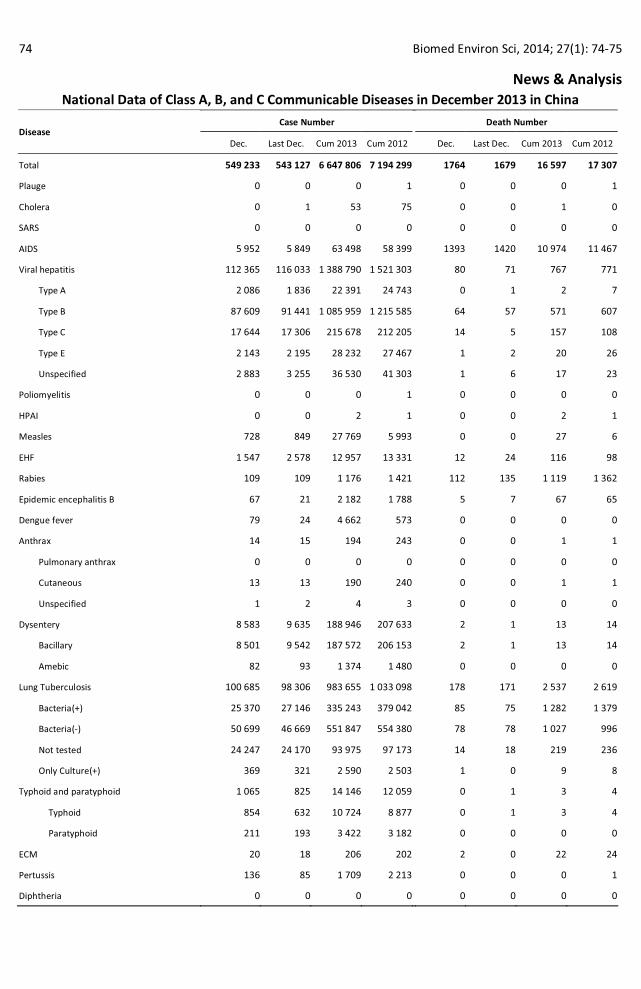
74 Biomed Environ Sci, 2014; 27(1): 74-75
News & Analysis National Data of Class A, B, and C Communicable Diseases in December 2013 in China
Case Number Death Number Disease
Dec. Last Dec. Cum 2013 Cum 2012 Dec. Last Dec. Cum 2013 Cum 2012
Total 549 233 543 127 6 647 806 7 194 299 1764 1679 16 597 17 307
Plauge 0 0 0 1 0 0 0 1
Cholera 0 1 53 75 0 0 1 0
SARS 0 0 0 0 0 0 0 0
AIDS 5 952 5 849 63 498 58 399 1393 1420 10 974 11 467
Viral hepatitis 112 365 116 033 1 388 790 1 521 303 80 71 767 771
Type A 2 086 1 836 22 391 24 743 0 1 2 7
Type B 87 609 91 441 1 085 959 1 215 585 64 57 571 607
Type C 17 644 17 306 215 678 212 205 14 5 157 108
Type E 2 143 2 195 28 232 27 467 1 2 20 26
Unspecified 2 883 3 255 36 530 41 303 1 6 17 23
Poliomyelitis 0 0 0 1 0 0 0 0
HPAI 0 0 2 1 0 0 2 1
Measles 728 849 27 769 5 993 0 0 27 6
EHF 1 547 2 578 12 957 13 331 12 24 116 98
Rabies 109 109 1 176 1 421 112 135 1 119 1 362
Epidemic encephalitis B 67 21 2 182 1 788 5 7 67 65
Dengue fever 79 24 4 662 573 0 0 0 0
Anthrax 14 15 194 243 0 0 1 1
Pulmonary anthrax 0 0 0 0 0 0 0 0
Cutaneous 13 13 190 240 0 0 1 1
Unspecified 1 2 4 3 0 0 0 0
Dysentery 8 583 9 635 188 946 207 633 2 1 13 14
Bacillary 8 501 9 542 187 572 206 153 2 1 13 14
Amebic 82 93 1 374 1 480 0 0 0 0
Lung Tuberculosis 100 685 98 306 983 655 1 033 098 178 171 2 537 2 619
Bacteria(+) 25 370 27 146 335 243 379 042 85 75 1 282 1 379
Bacteria(-) 50 699 46 669 551 847 554 380 78 78 1 027 996
Not tested 24 247 24 170 93 975 97 173 14 18 219 236
Only Culture(+) 369 321 2 590 2 503 1 0 9 8
Typhoid and paratyphoid 1 065 825 14 146 12 059 0 1 3 4
Typhoid 854 632 10 724 8 877 0 1 3 4
Paratyphoid 211 193 3 422 3 182 0 0 0 0
ECM 20 18 206 202 2 0 22 24
Pertussis 136 85 1 709 2 213 0 0 0 1
Diphtheria 0 0 0 0 0 0 0 0
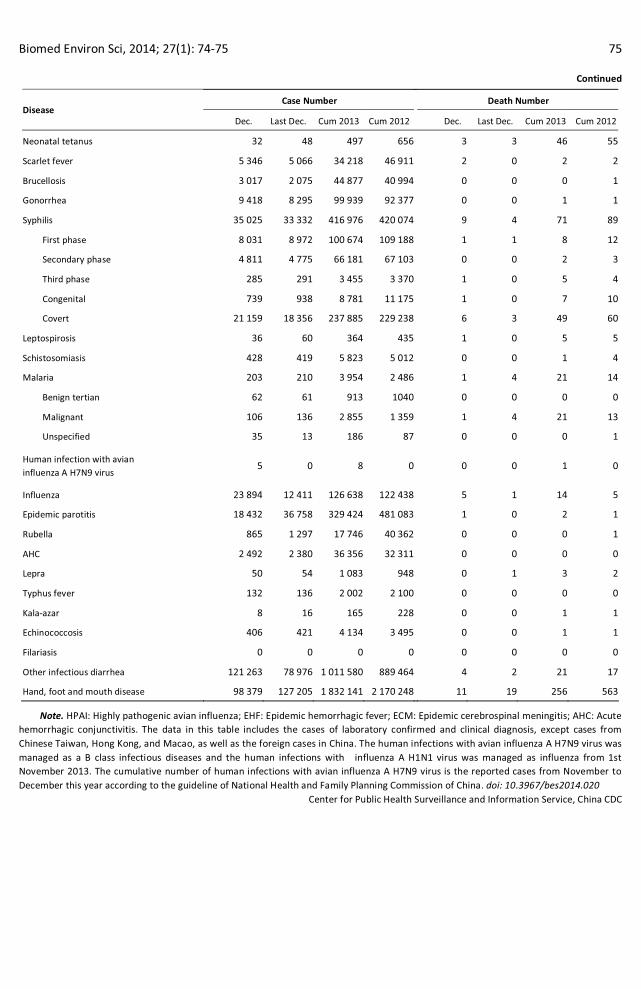
Biomed Environ Sci, 2014; 27(1): 74-75 75
Continued
Case Number Death Number Disease
Dec. Last Dec. Cum 2013 Cum 2012 Dec. Last Dec. Cum 2013 Cum 2012
Neonatal tetanus 32 48 497 656 3 3 46 55
Scarlet fever 5 346 5 066 34 218 46 911 2 0 2 2
Brucellosis 3 017 2 075 44 877 40 994 0 0 0 1
Gonorrhea 9 418 8 295 99 939 92 377 0 0 1 1
Syphilis 35 025 33 332 416 976 420 074 9 4 71 89
First phase 8 031 8 972 100 674 109 188 1 1 8 12
Secondary phase 4 811 4 775 66 181 67 103 0 0 2 3
Third phase 285 291 3 455 3 370 1 0 5 4
Congenital 739 938 8 781 11 175 1 0 7 10
Covert 21 159 18 356 237 885 229 238 6 3 49 60
Leptospirosis 36 60 364 435 1 0 5 5
Schistosomiasis 428 419 5 823 5 012 0 0 1 4
Malaria 203 210 3 954 2 486 1 4 21 14
Benign tertian 62 61 913 1040 0 0 0 0
Malignant 106 136 2 855 1 359 1 4 21 13
Unspecified 35 13 186 87 0 0 0 1
Human infection with avian influenza A H7N9 virus
5 0 8 0 0 0 1 0
Influenza 23 894 12 411 126 638 122 438 5 1 14 5
Epidemic parotitis 18 432 36 758 329 424 481 083 1 0 2 1
Rubella 865 1 297 17 746 40 362 0 0 0 1
AHC 2 492 2 380 36 356 32 311 0 0 0 0
Lepra 50 54 1 083 948 0 1 3 2
Typhus fever 132 136 2 002 2 100 0 0 0 0
Kala-azar 8 16 165 228 0 0 1 1
Echinococcosis 406 421 4 134 3 495 0 0 1 1
Filariasis 0 0 0 0 0 0 0 0
Other infectious diarrhea 121 263 78 976 1 011 580 889 464 4 2 21 17
Hand, foot and mouth disease 98 379 127 205 1 832 141 2 170 248 11 19 256 563
Note. HPAI: Highly pathogenic avian influenza; EHF: Epidemic hemorrhagic fever; ECM: Epidemic cerebrospinal meningitis; AHC: Acute hemorrhagic conjunctivitis. The data in this table includes the cases of laboratory confirmed and clinical diagnosis, except cases from Chinese Taiwan, Hong Kong, and Macao, as well as the foreign cases in China. The human infections with avian influenza A H7N9 virus was managed as a B class infectious diseases and the human infections with influenza A H1N1 virus was managed as influenza from 1st November 2013. The cumulative number of human infections with avian influenza A H7N9 virus is the reported cases from November to December this year according to the guideline of National Health and Family Planning Commission of China. doi: 10.3967/bes2014.020
Center for Public Health Surveillance and Information Service, China CDC


![Integrating the Healthcare Enterprise€¦ · Document Source Document ConsumerOn Entry [ITI Document Registry Document Repository Provide&Register Document Set – b [ITI-41] →](https://static.fdocuments.net/doc/165x107/5f08a1eb7e708231d422f7c5/integrating-the-healthcare-enterprise-document-source-document-consumeron-entry.jpg)