53 - core.ac.ukcore.ac.uk/download/pdf/11066186.pdf · UJI HOMOGENITAS Explore Sisi Case Processing...
18
52
Transcript of 53 - core.ac.ukcore.ac.uk/download/pdf/11066186.pdf · UJI HOMOGENITAS Explore Sisi Case Processing...

52

53
Lampiran 1: Surat Permohonan Ijin Penelitian
54
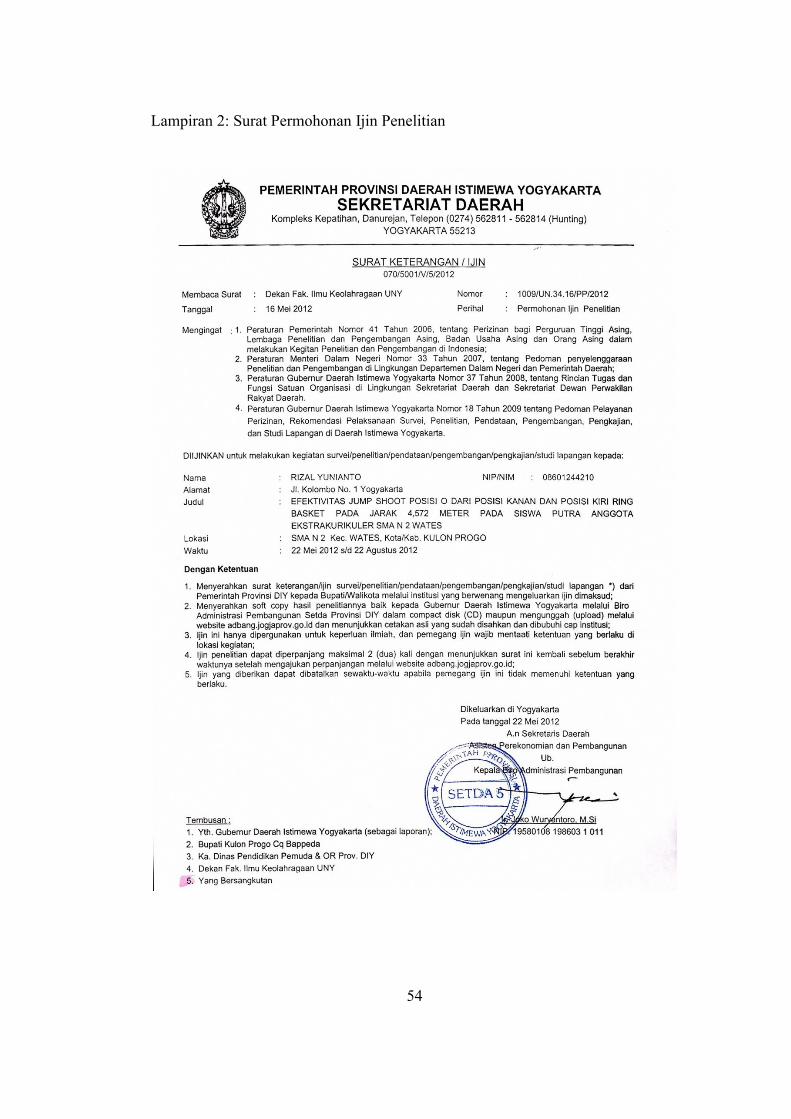
Lampiran 2: Surat Permohonan Ijin Penelitian

55
Lampiran 3: Surat Permohonan Ijin Penelitian

56
Lampiran 4: Surat Keterangan Uji Coba Penelitian

57
Lampiran 5: Surat Keterangan Penelitian

58
Lampiran 6: Sertifikat Peneraan Meter Baja

59

60
Lampiran 7: Data Uji Coba Instrumen1. Jump Shoot Kanan
N Tes 1Tes 2
1 1 32 3 3
3 3 24 2 35 1 1
6 4 37 1 28 2 3
9 4 510 3 3
11 2 312 1 213 6 5
14 3 315 3 316 3 3
17 2 318 5 419 2 4
20 3 22. Jump Shoot Kiri
N Tes 1 Tes 21 0 12 1 1
3 4 54 2 35 1 0
6 4 47 1 18 2 4
9 4 210 3 4
11 2 412 0 213 5 3
14 3 415 3 316 3 3
17 2 318 3 219 2 1
20 2 2

61
Lampiran 8: Validitas dan Reliabilitas Uji Instrumen
1. Jump Shoot Sisi Kanan Correlations
Correlations
Tes1 Tes2
Tes1 Pearson Correlation 1.000 .685**
Sig. (2-tailed) .001
N 20.000 20
Tes2 Pearson Correlation .685** 1.000
Sig. (2-tailed) .001
N 20 20.000
**. Correlation is significant at the 0.01 level (2-tailed).
Reliabil ityScale: ALL VARIABLES
Case Processing Summary
N %
Cases Valid 20 100.0
Excludeda 0 .0
Total 20 100.0
a. Listwise deletion based on all variables in the procedure.
Reliability Statistics
Cronbach's Alpha N of Items
.789 2

62
2. Jump Shoot Sisi Kiri Correlations
Correlations
Tes 1 Tes 2
Tes 1 Pearson Correlation 1.000 .600**
Sig. (2-tailed) .005
N 20.000 20
Tes 2 Pearson Correlation .600** 1.000
Sig. (2-tailed) .005
N 20 20.000
**. Correlation is significant at the 0.01 level (2-tailed). Reliability Scale: ALL VARIABLES
Case Processing Summary
N %
Cases Valid 20 100.0
Excludeda 0 .0
Total 20 100.0
a. Listwise deletion based on all variables in the procedure.
Reliability Statistics
Cronbach's Alpha N of Items
.750 2

63
Lampiran 9: Data Penelitian
Data Penelitian
NJump Shoot Kanan
(X1)Jump Shoot Kiri
(X2)
1 4 22 2 03 5 34 2 55 2 46 3 37 5 38 2 49 2 010 4 011 2 112 3 313 3 214 4 315 2 016 4 217 3 118 5 319 3 120 5 5

64
Lampiran 10: Deskripsi Data Penelitian
Frequencies
Statistics
Kanan Kiri
N Valid 20 20
Missing 0 0
Mean 3.2500 2.2500
Median 3.0000 2.5000
Mode 2.00 3.00
Std. Deviation 1.16416 1.61815
Range 3.00 5.00
Minimum 2.00 .00
Maximum 5.00 5.00
Sum 65.00 45.00
Frequency TableKanan
Frequency Percent Valid Percent Cumulative Percent
Valid 2,00 7 35.0 35.0 35.0
3,00 5 25.0 25.0 60.0
4,00 4 20.0 20.0 80.0
5,00 4 20.0 20.0 100.0
Total 20 100.0 100.0
Kiri
Frequency Percent Valid Percent Cumulative Percent
Valid ,00 4 20.0 20.0 20.0
1,00 3 15.0 15.0 35.0
2,00 3 15.0 15.0 50.0
3,00 6 30.0 30.0 80.0
4,00 2 10.0 10.0 90.0
5,00 2 10.0 10.0 100.0
Total 20 100.0 100.0

65
Lampiran 11: Deskripsi Data Penelitian
UJI NORMALITAS
NPar TestsChi-Square TestFrequencies
Kanan
Observed N Expected N Residual
2,00 7 5.0 2.0
3,00 5 5.0 .0
4,00 4 5.0 -1.0
5,00 4 5.0 -1.0
Total 20
Kiri
Observed N Expected N Residual
,00 4 3.3 .7
1,00 3 3.3 -.3
2,00 3 3.3 -.3
3,00 6 3.3 2.7
4,00 2 3.3 -1.3
5,00 2 3.3 -1.3
Total 20
Test Statistics
Kanan Kiri
Chi-Square 1.200a 3.400b
Df 3 5
Asymp. Sig. .753 .639
a. 0 cells (,0%) have expected frequencies less than 5. The minimum expected cell frequency is 5,0.
b. 6 cells (100,0%) have expected frequencies less than 5. The minimum expected cell frequency is 3,3.

66
Lampiran 12: Deskripsi Data Penelitian
UJI HOMOGENITAS
ExploreSisi
Case Processing Summary
Kelompok
Cases
Valid Missing Total
N Percent N Percent N Percent
Jump Shoot 1,00 20 100.0% 0 .0% 20 100.0%
2,00 20 100.0% 0 .0% 20 100.0%
Test of Homogeneity of Variance
Levene Statistic df1 df2 Sig.
JumpShoot Based on Mean 2.444 1 38 .126
Based on Median 2.587 1 38 .116
Based on Median and with adjusted df
2.587 1 35.958 .116
Based on trimmed mean
2.489 1 38 .123

67
Lampiran 13: Deskripsi Data Penelitian
UJI t
T-TestPaired Samples Statistics
Mean N Std. DeviationStd. Error
Mean
Pair 1 Kanan 3.2500 20 1.16416 .26031
Kiri 2.2500 20 1.61815 .36183
Paired Samples Correlations
N Correlation Sig.
Pair 1 Kanan & Kiri 20 .272 .245
Paired Samples Test
Paired Differences
Mean
Std. Deviatio
n
Std. Error Mean
95% Confidence Interval of the
Difference
t df
Sig. (2-
tailed)Lower Upper
Pair 1 Kanan – Kiri
1.00000 1.71679 .38389 .19652 1.80348 2.605 19 .017
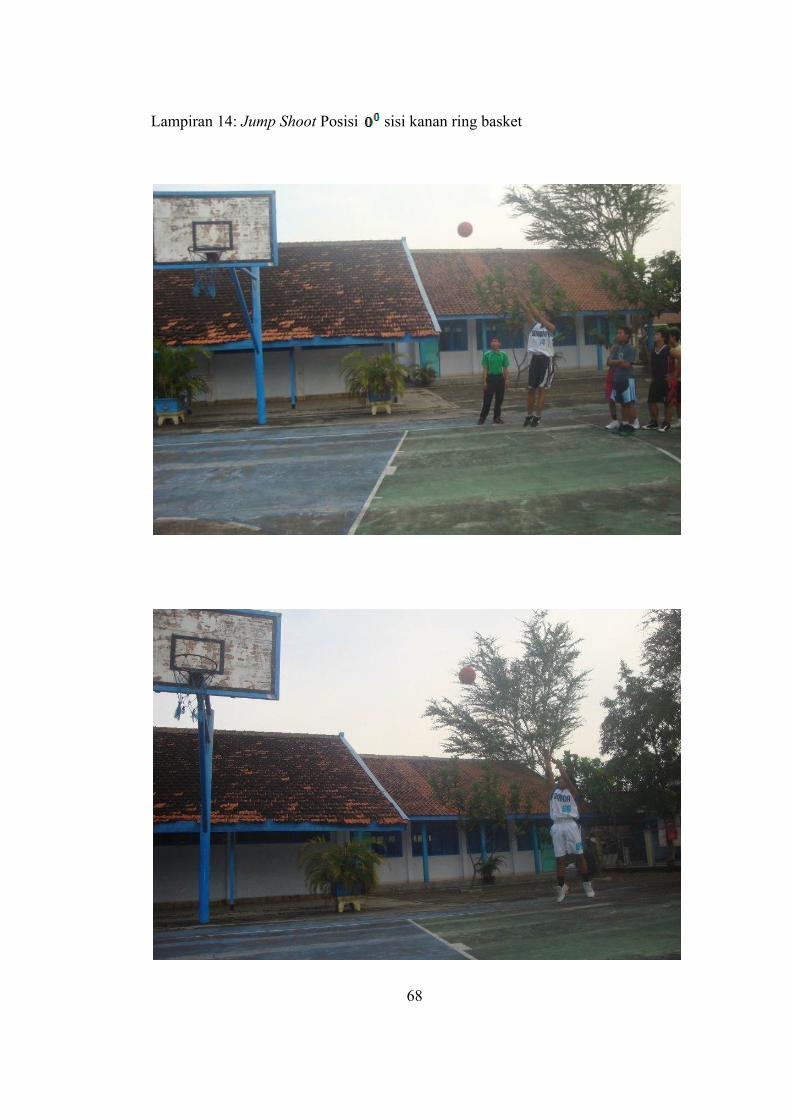
Lampiran 14: Jump Shoot
68
Jump Shoot Posisi sisi kanan ring basket

Lampiran 15: Jump Shoot
69
Jump Shoot Posisi sisi kiri ring basket