5.2.2 AASHTO Bridge Management Design and Overvie€¦ · • Presentation/Demonstration of 5.1.3...
43
5.2.2 AASHTO Bridge Management Design and Overview • Josh Lang • Chris Meredith • Jeremy Shaffer Formerly
Transcript of 5.2.2 AASHTO Bridge Management Design and Overvie€¦ · • Presentation/Demonstration of 5.1.3...

5.2.2 AASHTO Bridge Management Design and Overview
• Josh Lang • Chris Meredith • Jeremy Shaffer
Formerly

Outline of 5.X Presentations • Presentation/Demonstration of 5.1.3
– Support for AASHTO Elements – Currently Available!
• Presentation/Demonstration of 5.2.1 – In last stage of updates and alpha testing – Onsite beta testing next month
• Presentation on next steps 5.2.2 / 5.2.3
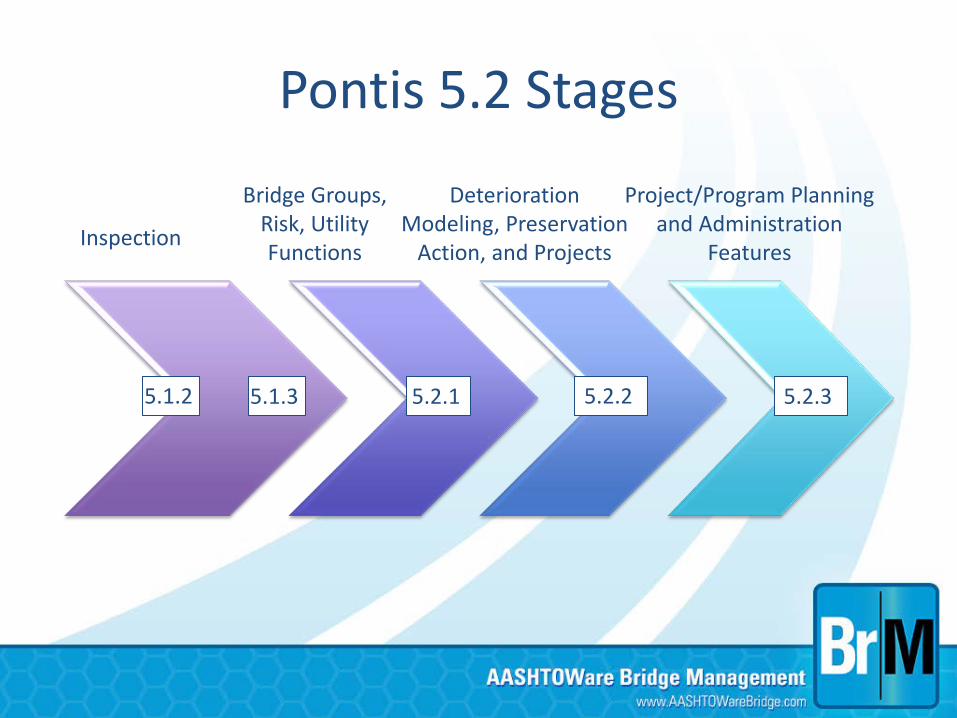
Pontis 5.2 Stages
Inspection
Bridge Groups, Risk, Utility Functions
Deterioration Modeling, Preservation
Action, and Projects
Project/Program Planning and Administration
Features
5.1.2 5.2.1 5.2.2 5.2.3 5.1.3

5.2.1 Demo Part 2 • Dynamic filters, quick filters, and edit SQL
filters • New Layouts • Bridge Analysis Groups (wizard or manual) • GIS • How to create/edit an action and benefit
group
• Users already had the ability to generate filters (searches) and view results in a tabular grid format
• Users want to be able to easily visualize bridge information on a map
• Several other specific use cases were developed in which a map would provide assistance
GIS Requests
• AASHTO Task Force and Bentley evaluated various options to meet user requets
• Main factors: web based, easy and intuitive to use, open API for integration, flexible licensing
• Variety of products identified • Integrated Google Maps into the BrM
product, allowing users to have a GIS system integrated into their existing Bridge Management product
• Ability to export to KML format
GIS Approach

• Displaying standard Google Maps view, as well as Google Maps Satellite view, this allows users to better determine location of bridges
Embedded dual view capability
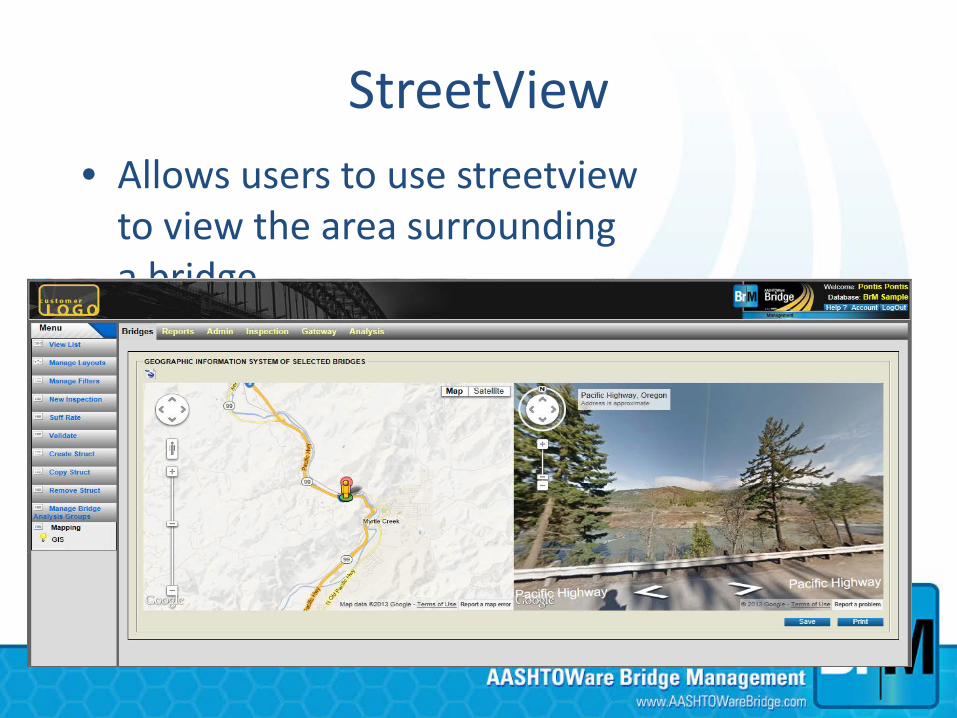
• Allows users to use streetview to view the area surrounding a bridge
StreetView

• Allows users to relocate the associated GPS coordinates of a bridge, ensuring better accuracy
Correct placement of bridges

• Plots many bridges at a time, allowing agencies to plot groups of bridges at a time, and to print out the results
Easily locate new bridges

• Allows agencies to view bridges that have invalid coordinates, and to map them appropriately
Verification
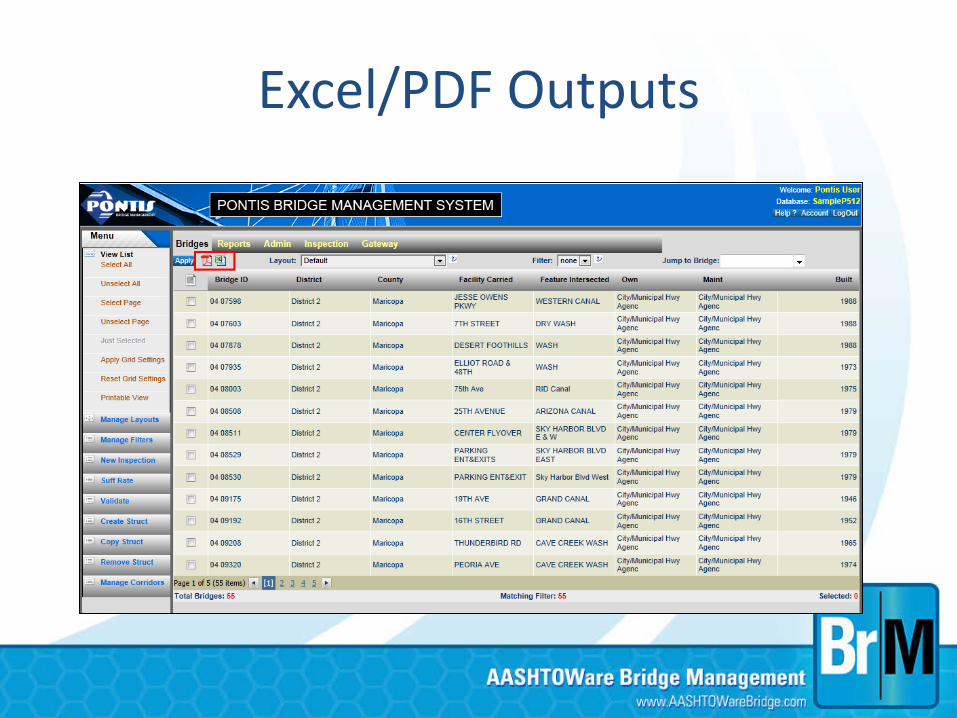
Excel/PDF Outputs

Needs List

5.2.2+ Highlights • Database overhaul • API integration and cross browser
compatibility • Deterioration Modeling • Support for Preservation Actions/Benefits • Project Planning

Database overhaul for New NBEs • The database overhaul will help to normalize the BrM
database, increase performance and allow for full integration of new NBEs.
• Full integration of the new NBEs, as well as their associated support and handling with modeling – Element Categories – Element Classes – Element Inventory – Standardize condition data in database (quantities, calculated
percents) – Standardize and streamline database tables – Convert agency usage to views to retrieve data (rather than
direct tables)
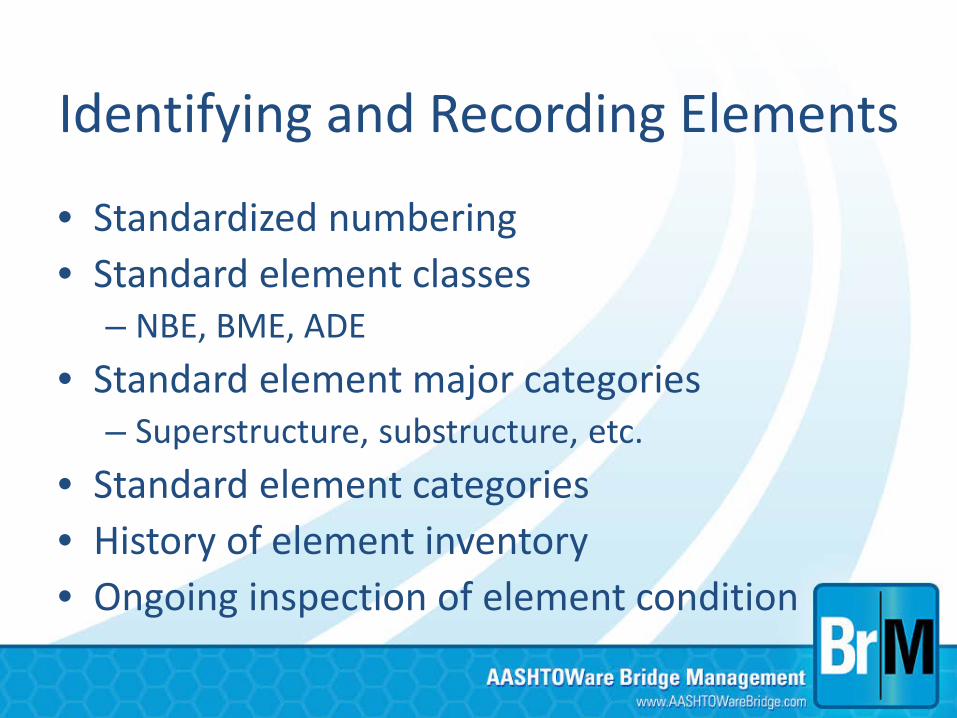
Identifying and Recording Elements
• Standardized numbering • Standard element classes
– NBE, BME, ADE • Standard element major categories
– Superstructure, substructure, etc. • Standard element categories • History of element inventory • Ongoing inspection of element condition

Database Normalization
• Store only state quantities, calculate state percentages – Provide off the shelf view that will calculate
percentages, to allow easier to digest information for users reliant on this feed.
• Store overall element quantity as element inventory item

Element Inventory • Element inventory table will track bridge
element changes over time. – Changes related to any element attributes will
create a new historical inventory record in the inventory table. For example:
• Total Quantity • Structure Unit • Environment • Element Number

Implementing Utility Functions • Create a multi-objective framework that can be
used to show the value (utility) of an action for a bridge
• Utility will also be shown for each sub-area – Mobility – Condition – Risk – Life Cycle Cost (5.2.2 / deterioration models needed)
• Work candidates are evaluated for how they contribute to mobility, lifecycle cost, condition and risk weightings
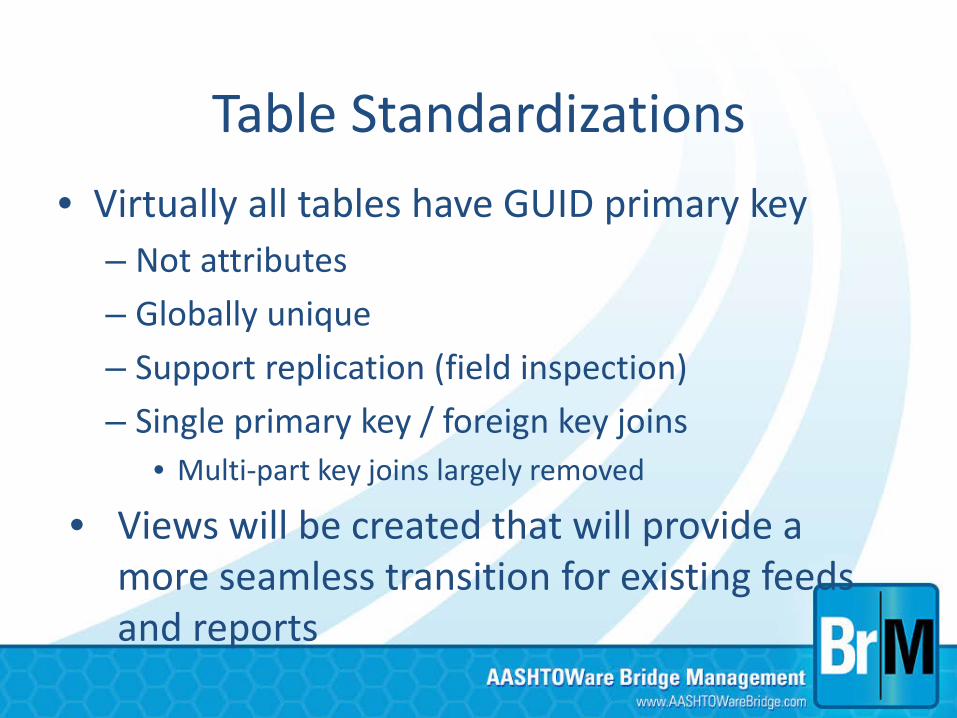
Table Standardizations • Virtually all tables have GUID primary key
– Not attributes – Globally unique – Support replication (field inspection) – Single primary key / foreign key joins
• Multi-part key joins largely removed
• Views will be created that will provide a more seamless transition for existing feeds and reports
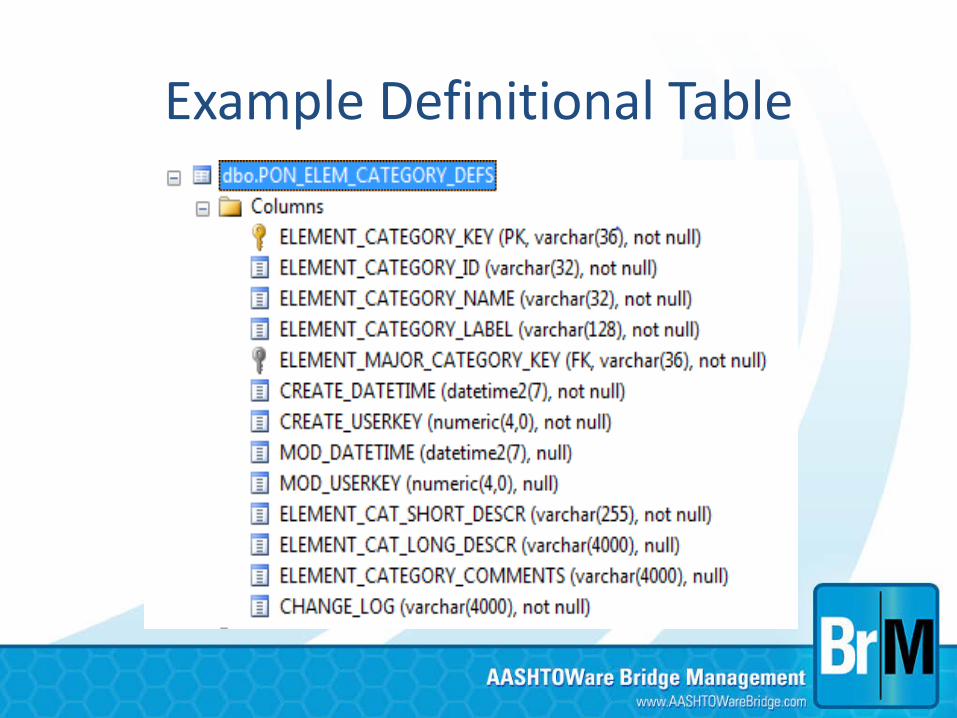
Example Definitional Table

API Integration • Creating API to allow BrM to interface with
external agency software – Reduce reliance on direct database calls. – Reduce risk of BrM internal structure changes
breaking custom agency forms, reports, and data feeds.
– Allow re-use of BrM built-in functionality pieces – Integration into Bentley or 3rd party plug-ins.
Cross browser compatibility • Support for all major browsers
– IE 8,9,10+ – Chrome – Firefox – Safari
• Stabilize BrM interface as new browsers and versions are released and legacy browsers lose support
• Allow for newer technologies to be integrated in the future (e.g. HTML5)
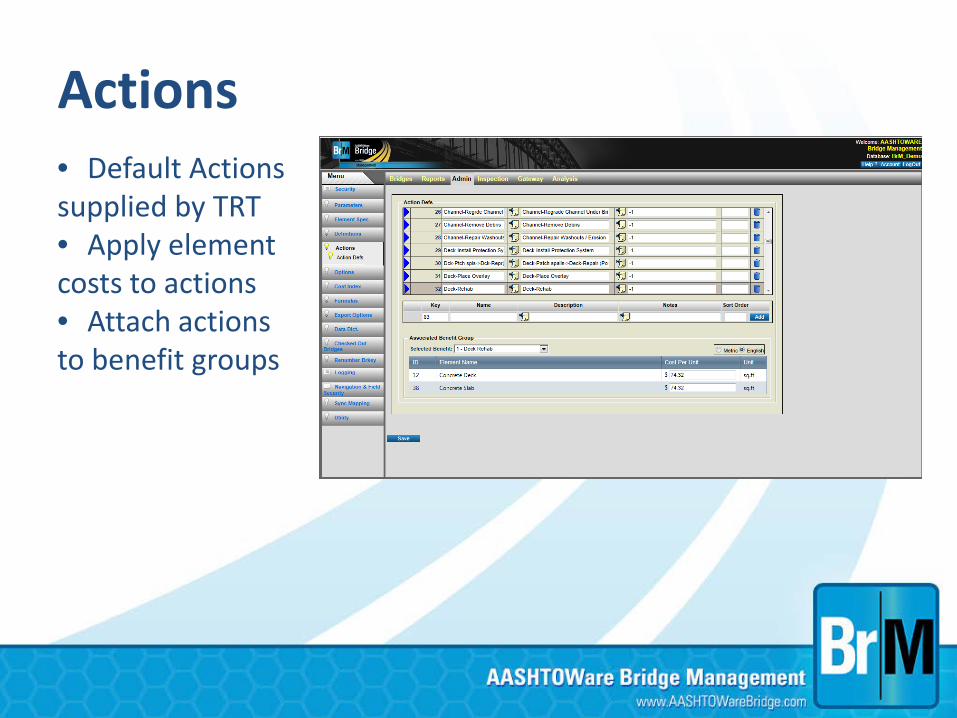
Actions • Default Actions supplied by TRT • Apply element costs to actions • Attach actions to benefit groups

Deterioration Modeling
- Implement new deterioration model logic - Weibull approach to include time factor
- Easy to construct/new elicitation process - Utilize AASHTO Elements
- Protective Systems - Defect Flags
- Allow for Multi-path deterioration

Deterioration Modeling

Deterioration Modeling

Project List

Project Planning and Bridge Level Analysis
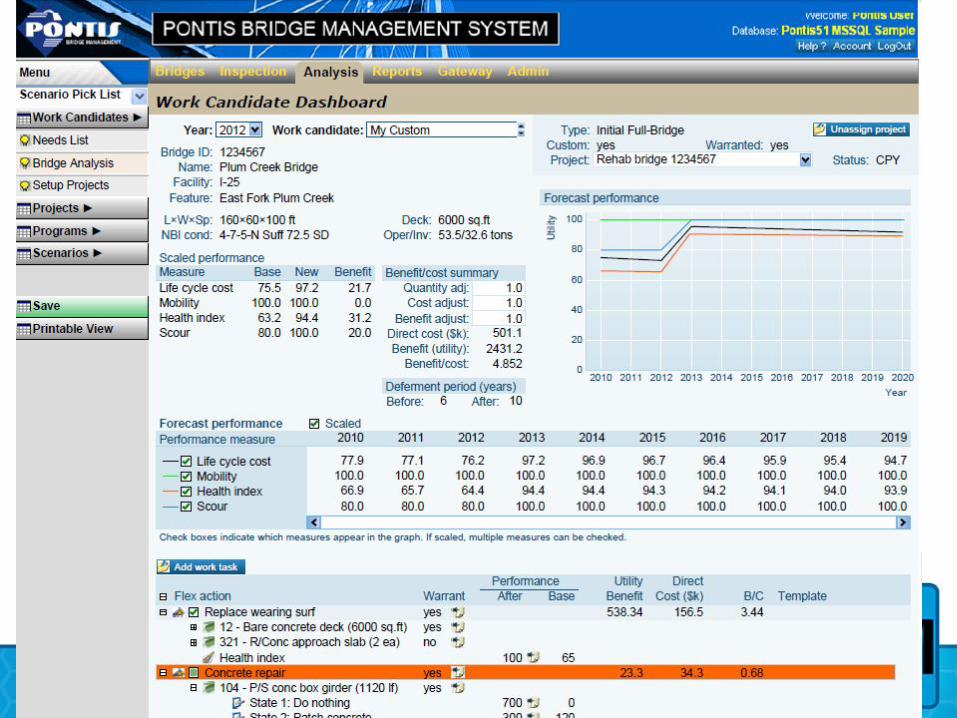
• Bridge Level Analysis – Show the list of specific needs by bridge and all
the associated details and the ability to filter needs by any field and see detailed information. The dashboard will show the basic bridge statistics, information on a bridge’s vulnerability/risks and other utility function related items including their weights and combined results.
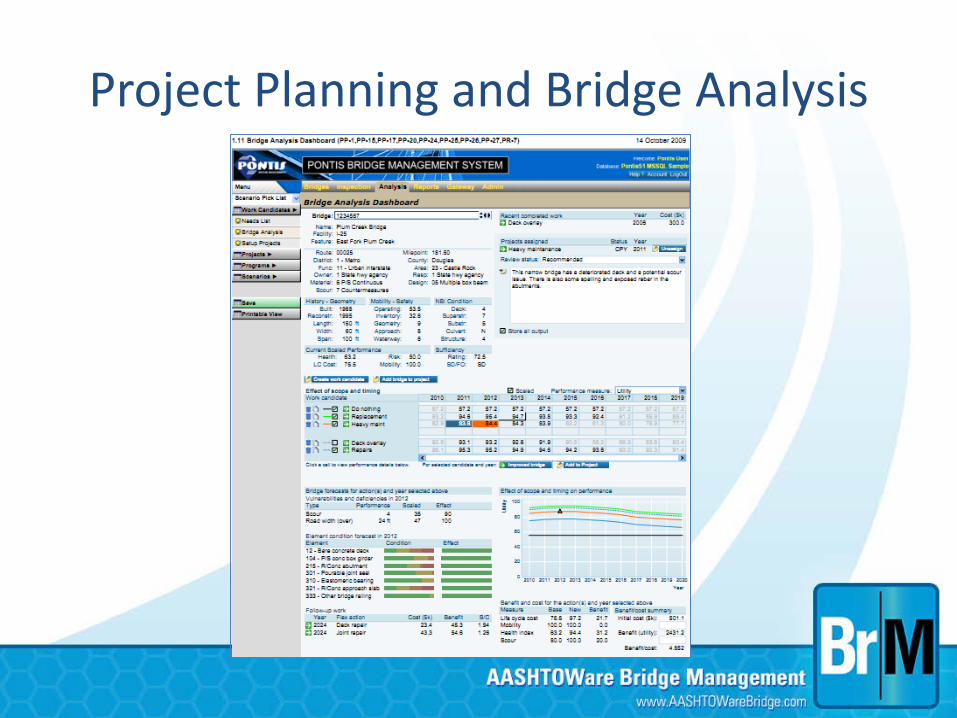
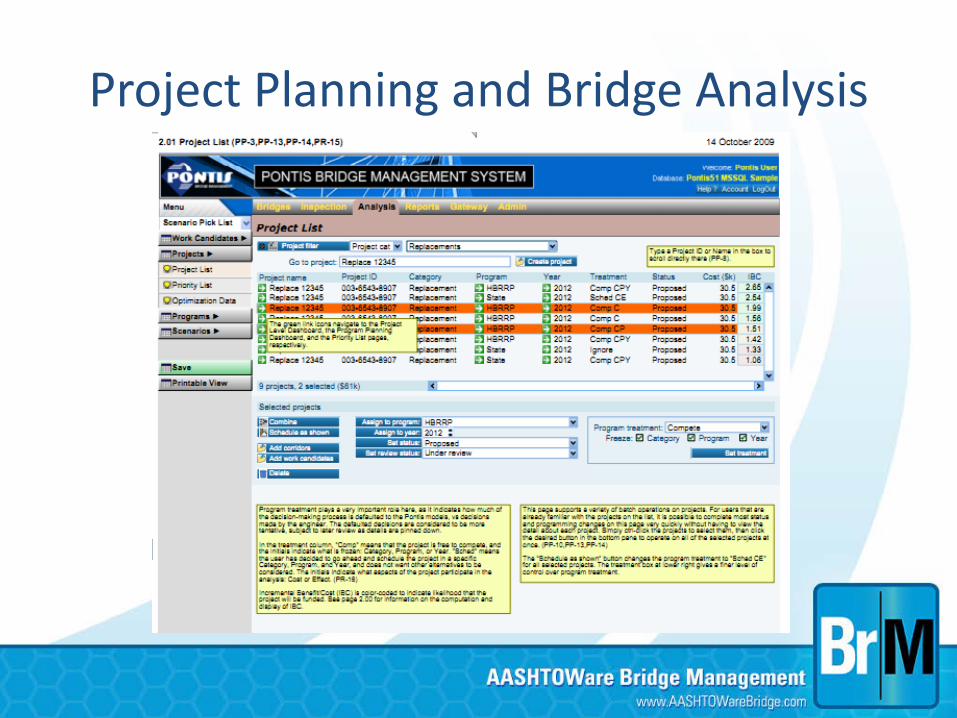
Project Planning and Bridge Analysis
Project Planning and Bridge Level Analysis
• Project Planning – Ability to create and view projects . – Define projects by grouping together work items
and bridges – Determine cost and effectiveness of projects and
the end result of performing the selected work on the selected bridges.
– Dashboards to view higher level numbers and effects, while also being able to drill down to specific results and details
Project Planning and Bridge Analysis

• Completion of programming module • Projects • Programs
• Scenario Creation • Results Browsing/Dashboards • Additional administration features • Complete Project Planning module
Phase III (5.2.3)

Bridge Level Screens –Supporting Future Years
For Phase 1C – look only at effect of action in current year. Can do future years with deterioration model


Network Level Planning
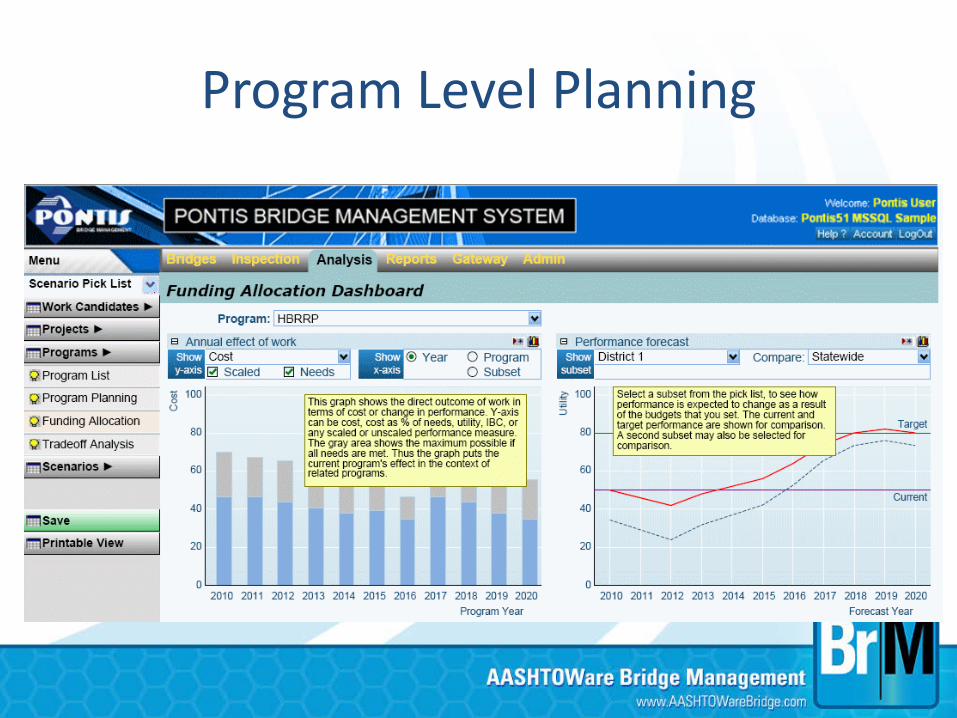
Program Level Planning

• AASHTO / Bentley Agreement supports new add-ons in coordination with Task Force: – Hosting/SaaS – Mobile applications – Workflow – 3D interactive inspection models – ProjectWise linkage – User credentialing
….
Planned Bentley Add-Ons And Services
• Bentley able to provide reliable and secure hosting environment for Pontis solutions
• Bentley applies all patches and updates needed to Pontis
• Storage, processing and servers tuned for Pontis maximum performance
• Can result in significant cost savings to DOT and performance/satisfaction improvement
Hosting / SaaS Solutions
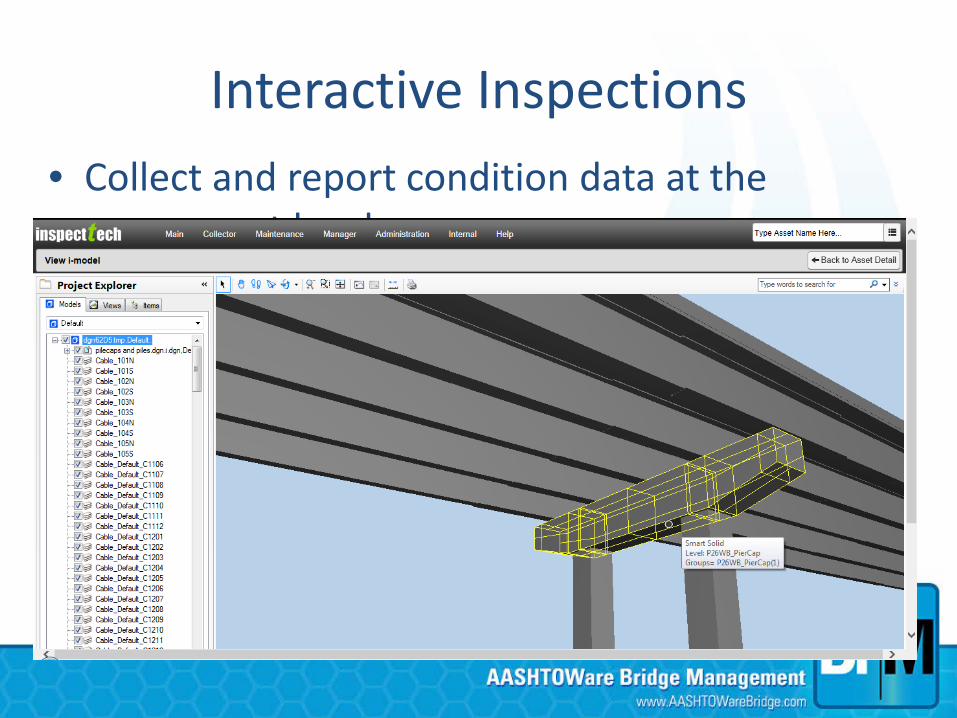
Interactive Inspections • Collect and report condition data at the
component level

Current Activities • Bi-weekly Task Force Meetings (webinar) • Quarterly Task Force Meetings (in person) • Development of Phase 1C – Utility Functions • Coordinate with TRT • Incorporate any TAG feedback on 5.1.3 • Launch Phase 2 • Continue update webinars to the user community • Expanding overall team
Questions?