51295724 Cognos Tutorial
66
Cognos ® 8 Planning ANALYST TUTORIAL
-
Upload
muhammad-zuhair-khan -
Category
Documents
-
view
26 -
download
0
description
Cognos
Transcript of 51295724 Cognos Tutorial

Cognos® 8 Planning
ANALYST
TUTORIAL

Product InformationThis document applies to Cognos 8® Planning Version 8.3 and may also apply to subsequent releases. To check for newer versions of thisdocument, visit the Cognos Global Customer Services Web site (http://support.cognos.com).
CopyrightCopyright © 2007 Cognos Incorporated.Portions of Cognos® software products are protected by one or more of the following U.S. Patents: 6,609,123 B1; 6,611,838 B1; 6,662,188B1; 6,728,697 B2; 6,741,982 B2; 6,763,520 B1; 6,768,995 B2; 6,782,378 B2; 6,847,973 B2; 6,907,428 B2; 6,853,375 B2; 6,986,135 B2;6,995,768 B2; 7,062,479 B2; 7,072,822 B2; 7,111,007 B2; 7,130,822 B1; 7,155,398 B2; 7,171,425 B2; 7,185,016 B1;7,213,199 B2.Cognos and the Cognos logo are trademarks of Cognos Incorporated in the United States and/or other countries. All other names are trademarksor registered trademarks of their respective companies.While every attempt has been made to ensure that the information in this document is accurate and complete, some typographical errors ortechnical inaccuracies may exist. Cognos does not accept responsibility for any kind of loss resulting from the use of information containedin this document.This document shows the publication date. The information contained in this document is subject to change without notice. Any improvementsor changes to either the product or the document will be documented in subsequent editions.U.S. Government Restricted Rights. The software and accompanying materials are provided with Restricted Rights. Use, duplication, ordisclosure by the Government is subject to the restrictions in subparagraph (C)(1)(ii) of the Rights in Technical Data and Computer Softwareclause at DFARS 252.227-7013, or subparagraphs (C)(1) and (2) of the Commercial Computer Software - Restricted Rights at 48CFR52.227-19,as applicable. The Contractor is Cognos Corporation, 15 Wayside Road, Burlington, MA 01803.This software/documentation contains proprietary information of Cognos Incorporated. All rights are reserved. Reverse engineering of thissoftware is prohibited. No part of this software/documentation may be copied, photocopied, reproduced, stored in a retrieval system, transmittedin any form or by any means, or translated into another language without the prior written consent of Cognos Incorporated.
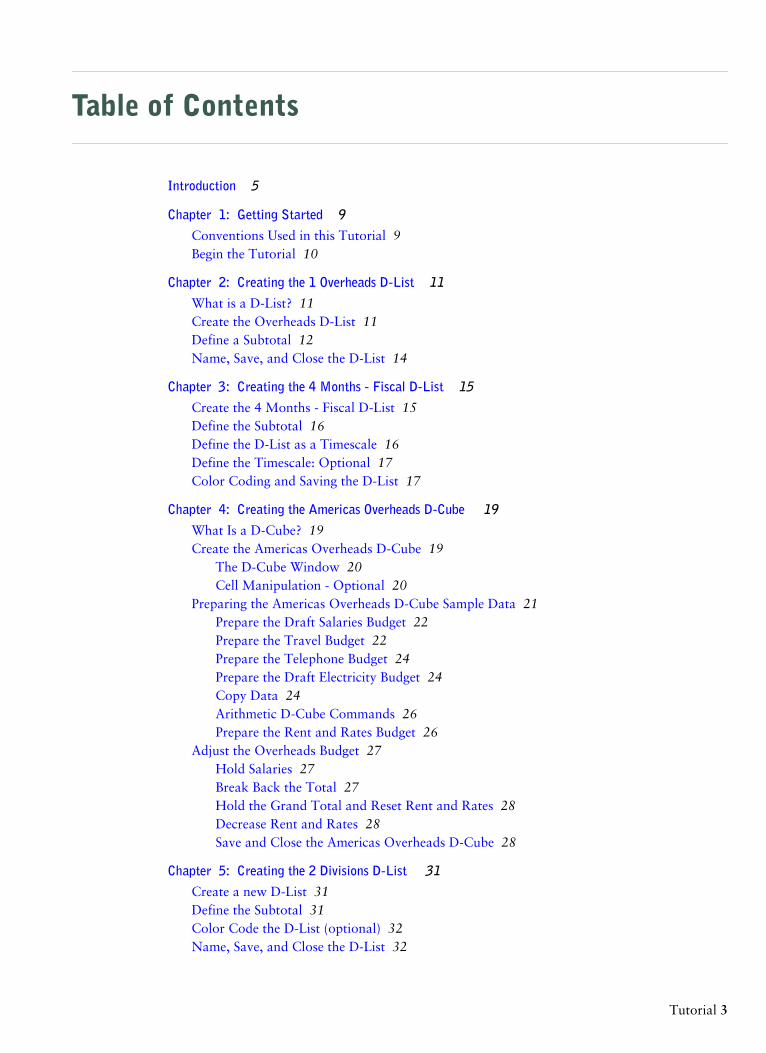
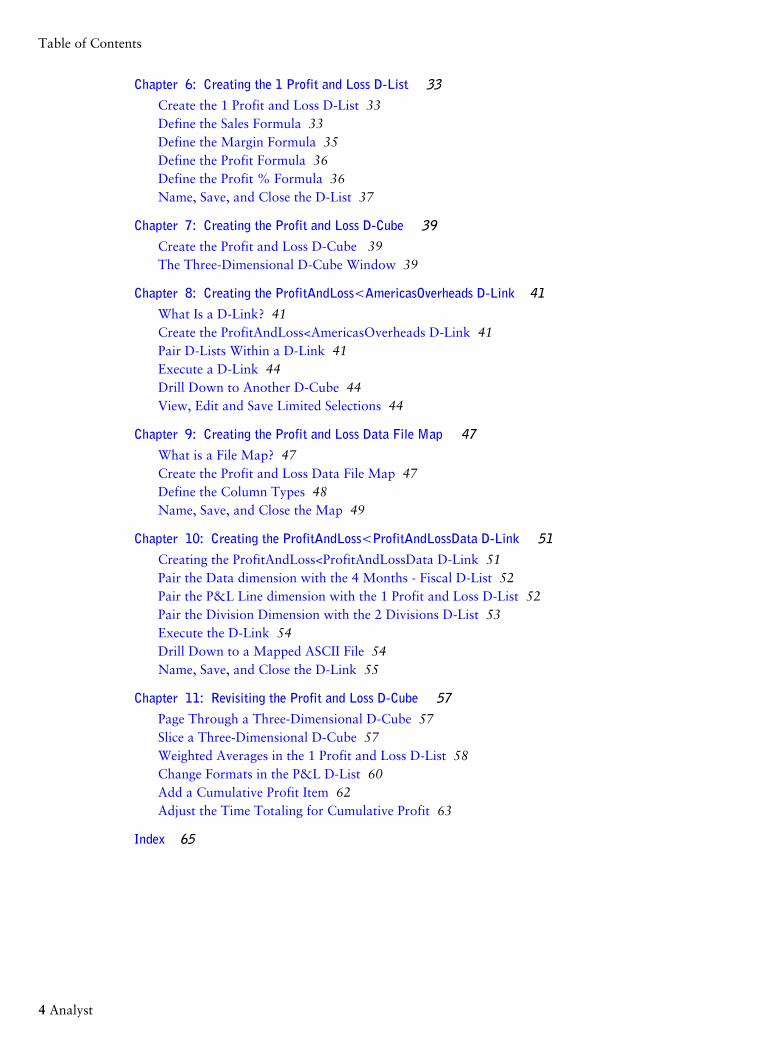
Table of Contents
Introduction 5
Chapter 1: Getting Started 9Conventions Used in this Tutorial 9Begin the Tutorial 10
Chapter 2: Creating the 1 Overheads D-List 11What is a D-List? 11Create the Overheads D-List 11Define a Subtotal 12Name, Save, and Close the D-List 14
Chapter 3: Creating the 4 Months - Fiscal D-List 15Create the 4 Months - Fiscal D-List 15Define the Subtotal 16Define the D-List as a Timescale 16Define the Timescale: Optional 17Color Coding and Saving the D-List 17
Chapter 4: Creating the Americas Overheads D-Cube 19What Is a D-Cube? 19Create the Americas Overheads D-Cube 19
The D-Cube Window 20Cell Manipulation - Optional 20
Preparing the Americas Overheads D-Cube Sample Data 21Prepare the Draft Salaries Budget 22Prepare the Travel Budget 22Prepare the Telephone Budget 24Prepare the Draft Electricity Budget 24Copy Data 24Arithmetic D-Cube Commands 26Prepare the Rent and Rates Budget 26
Adjust the Overheads Budget 27Hold Salaries 27Break Back the Total 27Hold the Grand Total and Reset Rent and Rates 28Decrease Rent and Rates 28Save and Close the Americas Overheads D-Cube 28
Chapter 5: Creating the 2 Divisions D-List 31Create a new D-List 31Define the Subtotal 31Color Code the D-List (optional) 32Name, Save, and Close the D-List 32
Tutorial 3
Chapter 6: Creating the 1 Profit and Loss D-List 33Create the 1 Profit and Loss D-List 33Define the Sales Formula 33Define the Margin Formula 35Define the Profit Formula 36Define the Profit % Formula 36Name, Save, and Close the D-List 37
Chapter 7: Creating the Profit and Loss D-Cube 39Create the Profit and Loss D-Cube 39The Three-Dimensional D-Cube Window 39
Chapter 8: Creating the ProfitAndLoss<AmericasOverheads D-Link 41What Is a D-Link? 41Create the ProfitAndLoss<AmericasOverheads D-Link 41Pair D-Lists Within a D-Link 41Execute a D-Link 44Drill Down to Another D-Cube 44View, Edit and Save Limited Selections 44
Chapter 9: Creating the Profit and Loss Data File Map 47What is a File Map? 47Create the Profit and Loss Data File Map 47Define the Column Types 48Name, Save, and Close the Map 49
Chapter 10: Creating the ProfitAndLoss<ProfitAndLossData D-Link 51Creating the ProfitAndLoss<ProfitAndLossData D-Link 51Pair the Data dimension with the 4 Months - Fiscal D-List 52Pair the P&L Line dimension with the 1 Profit and Loss D-List 52Pair the Division Dimension with the 2 Divisions D-List 53Execute the D-Link 54Drill Down to a Mapped ASCII File 54Name, Save, and Close the D-Link 55
Chapter 11: Revisiting the Profit and Loss D-Cube 57Page Through a Three-Dimensional D-Cube 57Slice a Three-Dimensional D-Cube 57Weighted Averages in the 1 Profit and Loss D-List 58Change Formats in the P&L D-List 60Add a Cumulative Profit Item 62Adjust the Time Totaling for Cumulative Profit 63
Index 65
4 Analyst
Table of Contents
Introduction
This document is intended for use with Cognos 8 Planning - Analyst.
This Tutorial provides an introduction to Analyst and its key features and concepts. You should
be able to work through the Tutorial in one working day.
Everything you need to do to complete the Tutorial is laid out in numbered steps. Generally, concepts
are illustrated by example. You also will encounter longer introductions where it is important that
you are familiar with certain concepts before you continue.
Cognos 8 Planning provides the ability to plan, budget, and forecast in a collaborative, secure
manner. The major components are Analyst and Contributor.
Cognos 8 Planning - Analyst
Analyst is a flexible tool used by financial specialists to define their business models. These models
include the drivers and content required for planning, budgeting, and forecasting. The models can
then be distributed to managers using the Web-based architecture of Cognos 8 Planning -
Contributor.
Cognos 8 Planning - Contributor
Contributor streamlines data collection and workflow management. It eliminates the problems of
errors, version control, and timeliness that are characteristic of a planning system solely based on
spreadsheets. Users have the option to submit information simultaneously through a simple Web
or Microsoft Excel® interface. Using an intranet or secure Internet connection, users review only
what they need to review and enter data where they are authorized.
For more information about using this product, visit the Cognos Global Customer Services Web
site (http://support.cognos.com).
Best Practices for Cognos 8 Planning
The Cognos Innovation Center™ for Performance Management provides a forum and Performance
Blueprints which you can use to discover new ideas and solutions for finance and performance
management issues. Blueprints are pre-defined data, process, and policy models that incorporate
best practice knowledge from Cognos customers and the Cognos Innovation Center. These Blueprints
are free of charge to existing customers or Platinum and Gold partners. For more information about
the Cognos Innovation Center or the Performance Blueprints, visit http://www.cognos.com/
innovationcenter.
Audience
This guide is for new Analyst users, familiarity with financial data is helpful, but not required to
complete the tutorial.
Tutorial 5

Related Documentation
Our documentation includes user guides, getting started guides, new features guides, readmes, and
other materials to meet the needs of our varied audience. The following documents contain related
information and may be referred to in this document.
Note: For online users of this document, a Web page such as The page cannot be found may appear
when clicking individual links in the following table. Documents are made available for your
particular installation and translation configuration. If a link is unavailable, you can access the
document on the Cognos Global Customer Services Web site (http://support.cognos.com). Logon
credentials are available either from your administrator or by request from support.america@cognos.
com.
DescriptionDocument
Using Cognos 8 Planning - AnalystAnalyst User Guide
Using Cognos 8 Planning - ManagerManager User Guide
Getting to know Cognos 8 Planning - Analyst for Microsoft Excel®Analyst for Microsoft
Excel® Tutorial
Finding Information
To find the most current product documentation, including all localized documentation, access the
Cognos Global Customer Services Web site (http://support.cognos.com). Click the Documentation
link to access documentation guides. Click the Knowledge Base link to access all documentation,
technical papers, and multimedia materials.
Product documentation is available in online help from the Help menu or button in Cognos products.
You can also download documentation in PDF format from the Cognos Global Customer Services
Web site.
You can also read PDF versions of the product readme files and installation guides directly from
Cognos product CDs.
Getting Help
For more information about using this product or for technical assistance, visit the Cognos Global
Customer Services Web site (http://support.cognos.com). This site provides product information,
services, user forums, and a knowledge base of documentation and multimedia materials. To create
a case, contact a support person, or to provide feedback, click the Contact Us link. For information
about education and training, click the Training link.
Printing Copyright Material
You can print selected pages, a section, or the whole book. Cognos grants you a non-exclusive,
non-transferable license to use, copy, and reproduce the copyright materials, in printed or electronic
6 Analyst
Introduction

format, solely for the purpose of operating, maintaining, and providing internal training on Cognos
software.
Tutorial 7
Introduction

8 Analyst
Introduction
Chapter 1: Getting Started
In this tutorial you build a simple Analyst model from start to finish. The model is designed to build
a company budget Profit and Loss. The hypothetical company used in this tutorial has five divisions
(Americas, Northern Europe, Central Europe, Southern Europe, and Asia Pacific). The Northern
Europe division’s overheads budget is entered manually. Sales budget data for all divisions is
imported from an ASCII file.
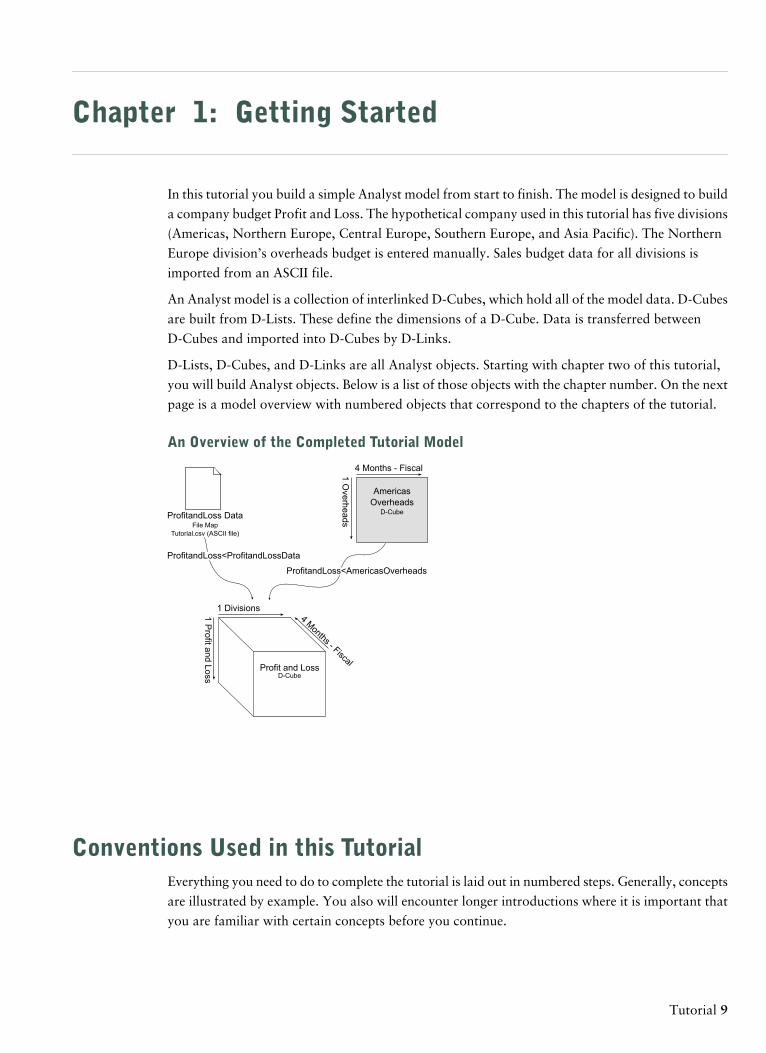
An Analyst model is a collection of interlinked D-Cubes, which hold all of the model data. D-Cubes
are built from D-Lists. These define the dimensions of a D-Cube. Data is transferred between
D-Cubes and imported into D-Cubes by D-Links.
D-Lists, D-Cubes, and D-Links are all Analyst objects. Starting with chapter two of this tutorial,
you will build Analyst objects. Below is a list of those objects with the chapter number. On the next
page is a model overview with numbered objects that correspond to the chapters of the tutorial.
An Overview of the Completed Tutorial Model
1 Divisions
Profit and LossD-Cube
4 Months - Fiscal
1Profitand
Loss
ProfitandLoss DataFile Map
Tutorial.csv (ASCII file)
AmericasOverheads
D-Cube
4 Months - Fiscal1Overheads
ProfitandLoss<AmericasOverheads
ProfitandLoss<ProfitandLossData
Conventions Used in this TutorialEverything you need to do to complete the tutorial is laid out in numbered steps. Generally, concepts
are illustrated by example. You also will encounter longer introductions where it is important that
you are familiar with certain concepts before you continue.
Tutorial 9

Begin the TutorialBefore you can work through this tutorial, you must have Analyst installed on your computer. For
installation instructions, see the Cognos 8 PlanningInstallation Guide.
When going through the tutorial, you will save your work to a Test library. If this Test library is
not installed on your computer, you must create it before you begin the tutorial.
Steps
1. From the Start menu, click Programs, Cognos 8 Planning, Cognos 8 Planning - Analyst.
2. Enter your user id and (optional) password. Click OK.
3. If available, select the Test library to use in this session. Click OK.
If the Test library does not exist, you must select a default library in order to log on. In the
following steps, you will create the Test library where you will save your work.
4. From the File menu, click Administration, Maintain Libraries and Users.
5. Ensure the Libraries tab is selected, then click Add.
6. Type Test for a name.
7. Type Tutorial Test Library. for a description
8. Click Browse. Navigate to the Analyst install location, for example: C:\Program Files\Cognos\
c8\samples\<language>\Planning.
9. Click OK, and then close the Maintain Libraries and Users dialog.
You are ready to begin the tutorial
10 Analyst
Chapter 1: Getting Started

Chapter 2: Creating the 1 Overheads D-List
In this chapter, you will create the first D-List for this tutorial called 1 Overheads D-List. This
D-List contains overhead types and a subtotal.
What is a D-List?A D-List is a list of related items that can be put into formulas that proceed down the rows or across
the columns of a D-Cube. D-Lists commonly encountered in a Cognos 8 Planning - Analyst model
include lists of departments, products, customers, months, Profit & Loss line items, balance sheet
line items, and so on.
D-Cubes are built from D-Lists. The D-Lists define the dimensions of the D-Cube, forming the row,
column, and page headers.
The D-Lists that you will create in this tutorial will include a number before the name. The number
represents one of five categories and reflects the order in which the D-Lists should be processed
when creating a D-Cube. When you create a D-Cube, it is best to choose the D-Lists in a set order
to overcome any priority conflicts on formulas at a later date. In general, select D-Lists with the
most calculations first, particularly when the calculations use IF...THEN...ELSE logical operators.
Select the aggregation D-Lists next (divisions, customers, products) then the timescale D-Lists.
Finish with the versions D-List.
Each item in a D-List is referred to by a unique item name. Some D-List items may be calculated
from other D-List items. Calculated items are called formula items; other items are called detail
items.
You can use letters, numbers, punctuation marks, and spaces in D-List item names. However, you
should avoid using the following:
● The semicolon (;) because it is used in special calculation formulas called built-in functions
(BiFs).
● The at sign (@) and braces ({}) because these are used in formulas, built-in functions, and macros.
● The brackets ([ ]) because this naming convention is used to mark D-List formatted items, which
appear as virtual dimensions in the D-Link editor.
Create the Overheads D-ListThe Overheads D-List is a list of overhead types (Salaries, Travel, Telephone, Electricity, Rent and
Rates) together with a subtotal (Total Overheads).
Steps
1. From the File menu, click New, D-List.
Tutorial 11

2. Type the following six item names into the Enter item names section, pressing Enter after typing
each.
3. Click OK.
The D-List editor appears.
Define a SubtotalDefine the total overheads subtotal as a sum calculation of all overheads.
Steps
1. Select the Total Overheads - Calculation cell.
2. Click Change item attributes.
The D-List editor expands to display the Calculation field.
12 Analyst
Chapter 2: Creating the 1 Overheads D-List
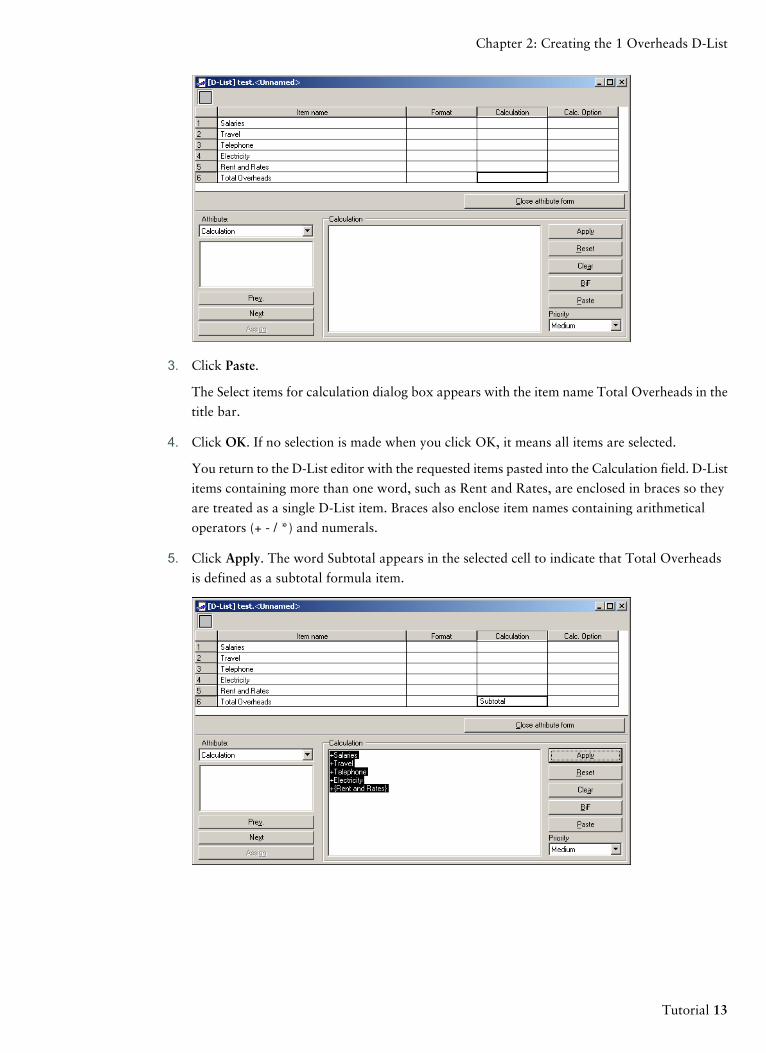
3. Click Paste.
The Select items for calculation dialog box appears with the item name Total Overheads in the
title bar.
4. Click OK. If no selection is made when you click OK, it means all items are selected.
You return to the D-List editor with the requested items pasted into the Calculation field. D-List
items containing more than one word, such as Rent and Rates, are enclosed in braces so they
are treated as a single D-List item. Braces also enclose item names containing arithmetical
operators (+ - / *) and numerals.
5. Click Apply. The word Subtotal appears in the selected cell to indicate that Total Overheads
is defined as a subtotal formula item.
Tutorial 13
Chapter 2: Creating the 1 Overheads D-List
Name, Save, and Close the D-ListFinalize and close the 1 Overheads D-List.
Steps
1. Click Save from the File menu.
2. In the Libraries field, click Test.
3. In the D-List Name field, type 1 Overheads, and then click OK. The title bar of the D-List
editor now displays the Library and D-List name: Test.1 Overheads. The number in the D-List
name, in this case 1, refers to the order the D-List will go when you create the D-Cube.
4. From the File menu, click Close.
Now you have finished creating the 1 Overheads D-List.
14 Analyst
Chapter 2: Creating the 1 Overheads D-List

Chapter 3: Creating the 4 Months - Fiscal D-List
In this chapter, you will now build your second D-List. This D-List will contain the months of one
financial year (Apr to Mar), together with a subtotal (Full Year). Building the 4 Months - Fiscal
D-List is different from building the 1 Overheads D-List in one important respect: the 4 Months -
Fiscal D-List must be defined as a timescale D-List. After you define a D-List as a timescale D-List,
you can apply growth rates across time and use the timescale D-List in certain Built in Functions
(BiFs).
Create the 4 Months - Fiscal D-ListCreate the 4 Months - Fiscal D-List to create a timescale D-List containing each month and a
calculated subtotal for the full year.
Steps
1. From the File menu, click New, D-List.
2. Type the following item names in the Enter item names section, pressing Enter after each:
Apr
May
Jun
Jul
Aug
Sep
Oct
Nov
Dec
Jan
Feb
Mar
Full Year
3. Click OK.
Tutorial 15

Define the SubtotalDefine the full year subtotal as a sum calculation of each month.
Steps
1. Select the Full Year - Calculation cell.
2. Click Change item attributes.
3. Click Paste. The Select items for calculation dialog box appears.
4. Click OK.
You return to the D-List editor with all items pasted into the Calculation field.
5. Click Apply.
Define the D-List as a TimescaleIf the items of a D-List represent time periods (days, weeks, months, years, and so on), the D-List
must be defined as a timescale. This allows the D-List to take advantage of the many forecasting
features reserved for timescale D-Lists.
Steps
1. From the D-List menu, click Options.
2. Select the Use as TimeScale check box.
The timescale definitions are generated automatically.
16 Analyst
Chapter 3: Creating the 4 Months - Fiscal D-List
3. Click OK to return to the D-List Editor.
Define the Timescale: OptionalAnalyst can also generate unique start and end dates for timescale definitions. When these are in
use, they appear in the From and To columns.
Steps
1. From the D-List menu, click Options again.
2. In the Mode drop-down list, click Custom. Another column, Length, appears.
3. Enter the length of time in days and the from date for the first month. Press Enter.
The To date is automatically generated.
4. For the remaining months, enter the length of time in days, the From and To dates are
automatically calculated.
5. Click OK to return to the D-List editor.
A clock icon appears in the upper left corner of the D-List editor to indicate it is defined as a
timescale.
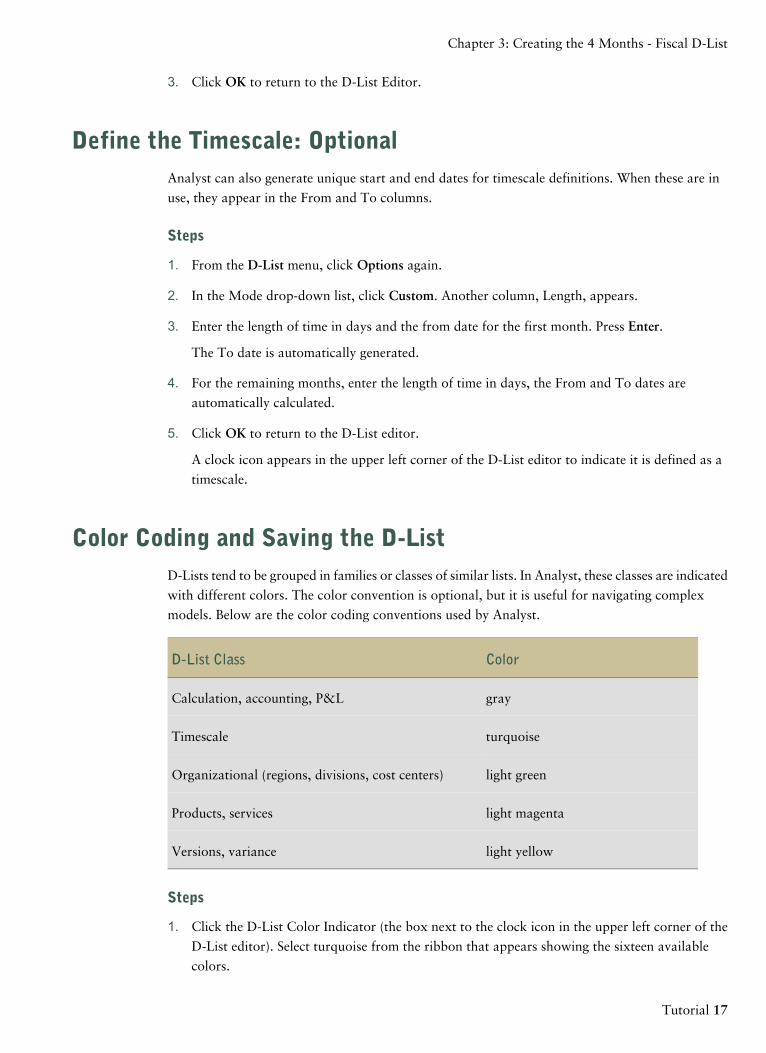
Color Coding and Saving the D-ListD-Lists tend to be grouped in families or classes of similar lists. In Analyst, these classes are indicated
with different colors. The color convention is optional, but it is useful for navigating complex
models. Below are the color coding conventions used by Analyst.
ColorD-List Class
grayCalculation, accounting, P&L
turquoiseTimescale
light greenOrganizational (regions, divisions, cost centers)
light magentaProducts, services
light yellowVersions, variance
Steps
1. Click the D-List Color Indicator (the box next to the clock icon in the upper left corner of the
D-List editor). Select turquoise from the ribbon that appears showing the sixteen available
colors.
Tutorial 17
Chapter 3: Creating the 4 Months - Fiscal D-List

2. From the File menu, click Save.
3. Make sure the Test library is selected, enter 4 Months - Fiscal in the D-List Name field, and
then click OK.
The number in the D-List name, in this case 4, refers to the D-List order when you create the
D-Cube.
4. Close the D-List.
Now you have finished creating the 4 Months - Fiscal D-List.
18 Analyst
Chapter 3: Creating the 4 Months - Fiscal D-List
Chapter 4: Creating the Americas Overheads
D-Cube
In this chapter, you will first create the Americas Overheads D-Cube using the two D-Lists you
created in the previous chapters. Since the Americas Overheads D-Cube contains only two D-Lists,
it is two dimensional, like a single sheet spreadsheet.
After a brief introduction to the parts of the D-Cube window, you will then prepare a draft overheads
budget. This populates the Americas Overheads D-Cube with data and introduces breakback and
other key Cognos 8 Planning - Analyst data entry techniques.
Finally, you will adjust your overheads budget, which introduces the Analyst commands Hold,
Release, and Reset.
What Is a D-Cube?A D-Cube is a stored multidimensional table of data. Each dimension of the table is associated with
a D-List. The D-Lists supply the row, column, and page labels used in the table and also supply the
formulas for calculations.
Typically a D-Cube will contain no more than five or six dimensions.
Create the Americas Overheads D-CubeCreating a D-Cube involves selecting the D-Lists to include as dimensions, naming the D-Cube,
and selecting the portion of the D-Cube to view.
The order in which you include the D-Lists in a D-Cube is important.
In general, select D-Lists with the most calculations first. Select the aggregation D-Lists next
(divisions, customers, products) then the timescale D-Lists. Finish with the versions D-List.
Steps
1. From the File menu, click New D-Cube.
The Create New D-Cube dialog box appears with your two D-Lists shown in the Name section.
2. Click 1 Overheads and click the down arrow to move it to the Object(s) Selected portion of
the screen.
3. Click 4 Months - Fiscal and click the down arrow to move it to the Object(s) Selected portion
of the screen. You also can double-click an item to move it to the Object(s) Selected portion of
the screen.
Tutorial 19
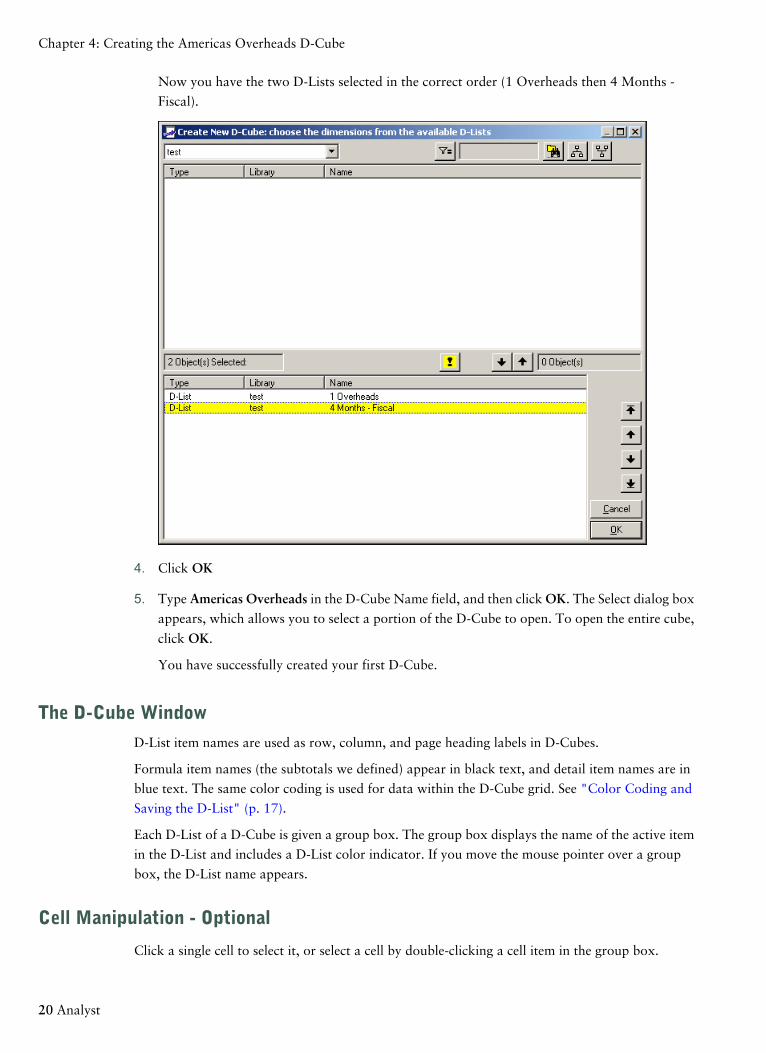
Now you have the two D-Lists selected in the correct order (1 Overheads then 4 Months -
Fiscal).
4. Click OK
5. Type Americas Overheads in the D-Cube Name field, and then click OK. The Select dialog box
appears, which allows you to select a portion of the D-Cube to open. To open the entire cube,
click OK.
You have successfully created your first D-Cube.
The D-Cube WindowD-List item names are used as row, column, and page heading labels in D-Cubes.
Formula item names (the subtotals we defined) appear in black text, and detail item names are in
blue text. The same color coding is used for data within the D-Cube grid. See "Color Coding and
Saving the D-List" (p. 17).
Each D-List of a D-Cube is given a group box. The group box displays the name of the active item
in the D-List and includes a D-List color indicator. If you move the mouse pointer over a group
box, the D-List name appears.
Cell Manipulation - Optional
Click a single cell to select it, or select a cell by double-clicking a cell item in the group box.
20 Analyst
Chapter 4: Creating the Americas Overheads D-Cube
To select a range of cells, click the first cell of the range and drag to include the other cells. You
also can press the Shift key in conjunction with any of the keyboard shortcuts.
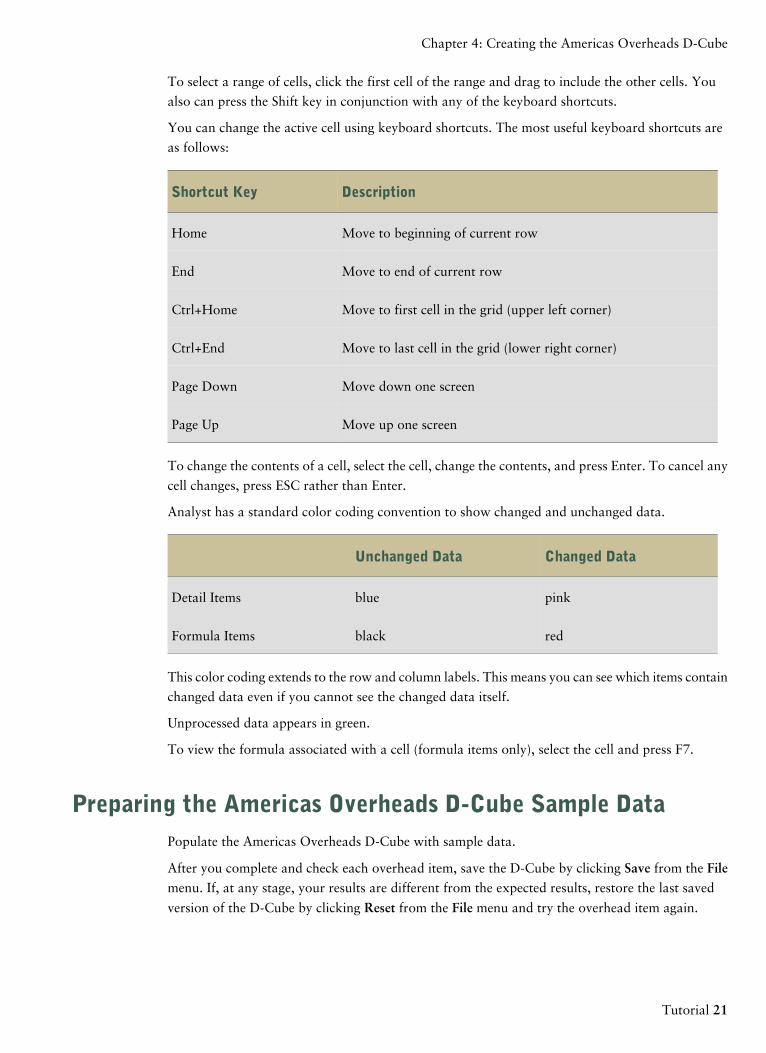
You can change the active cell using keyboard shortcuts. The most useful keyboard shortcuts are
as follows:
DescriptionShortcut Key
Move to beginning of current rowHome
Move to end of current rowEnd
Move to first cell in the grid (upper left corner)Ctrl+Home
Move to last cell in the grid (lower right corner)Ctrl+End
Move down one screenPage Down
Move up one screenPage Up
To change the contents of a cell, select the cell, change the contents, and press Enter. To cancel any
cell changes, press ESC rather than Enter.
Analyst has a standard color coding convention to show changed and unchanged data.
Changed DataUnchanged Data
pinkblueDetail Items
redblackFormula Items
This color coding extends to the row and column labels. This means you can see which items contain
changed data even if you cannot see the changed data itself.
Unprocessed data appears in green.
To view the formula associated with a cell (formula items only), select the cell and press F7.
Preparing the Americas Overheads D-Cube Sample DataPopulate the Americas Overheads D-Cube with sample data.
After you complete and check each overhead item, save the D-Cube by clicking Save from the Filemenu. If, at any stage, your results are different from the expected results, restore the last saved
version of the D-Cube by clicking Reset from the File menu and try the overhead item again.
Tutorial 21
Chapter 4: Creating the Americas Overheads D-Cube

Prepare the Draft Salaries Budget
The Salaries budget is $3,000,000 for the year, allocated evenly across the months.
Steps
1. In the Americas Overheads D-Cube, select the Full Year - Salaries cell and type 3,000,000.
2. Press Enter.
Analyst performs a breakback because you typed a number in a formula item (the Full Year
subtotal). The 3,000,000 you typed in Full Year allocates evenly over the months.
3. If the Full Year - Salaries cell is 3,000,000 and all the months are 250,000, save the D-Cube.
Otherwise reset it and then repeat from step 1.
The Saving dialog box appears.
4. To save the D-Cube, click Yes.
After saving, you will notice that all the data reverts to the blue and black colors showing the
data has been saved.
Prepare the Travel Budget
The Travel budget is $160,000 for the year, allocated across the months according to a profile. In
this case, the profile is the number of trips made in each month. In this example, the number of
trips builds to six in July and declines to zero in January.
Steps to Enter Monthly Travel Data
1. Select the Apr - Travel cell.
2. Type 3 in the cell, but do not press Enter.
Notice that the number 3 is green. This indicates the number is unprocessed. You can input
many numbers in the D-Cube grid before processing them (pressing Enter).
3. Select the May - Travel cell, and type 4 in the cell.
4. Repeat from step 3, typing the following data into the appropriate Months cell. This is the
travel profile that you will use to allocate the travel budget for the entire year.
22 Analyst
Chapter 4: Creating the Americas Overheads D-Cube

DataMonth
5Jun
6Jul
5Aug
4Sep
3Oct
2Nov
1Dec
0Jan
1Feb
2Mar
The numbers you just typed should appear in green.
Note: If you make a mistake when typing, you can reset an unprocessed (green) number to its
previous value by selecting the cell and pressing ESC. You also can change an unprocessed
number by typing a new value over it.
5. If the data is entered correctly, press Enter.
6. If the total number of trips in the Full Year - Travel cell is 36, save the D-Cube.
Otherwise, reset the D-Cube and try again.
Steps to Enter the Travel Budget for the Year
1. Select the Full Year - Travel cell.
2. Type 160K, and then press Enter.
Analyst allocates 160,000 over the months pro rata.
When typing numbers into a D-Cube grid, use the following suffixes: k (or K) for thousands
and m (or M) for millions. For example: 160k = 160,000.
3. If the Full Year - Travel cell is 160,000 and the Jun - Travel cell is 22,222 then save the D-Cube.
Otherwise, reset the D-Cube and try again.
Tutorial 23
Chapter 4: Creating the Americas Overheads D-Cube
Prepare the Telephone Budget
The telephone budget is $15,000 for April, increasing by 10% each month.
Steps to Use the Grow D-Cube Command to Enter Telephone Budget
1. Select the Apr - Telephone cell.
2. Type 15K and press Enter.
3. In the same cell, enter grow10c.
4. Press Enter.
The remaining months increase 10% until the end of the year.
5. If the Full Year - Telephone cell is 320,764 save the D-Cube.
Otherwise, reset the D-Cube and try again.
The Grow command must be followed by a growth percentage (10% in the above example)
and a growth type. Compound growth is indicated by a c after the growth rate, as in the above
example. Linear growth is indicated by an l after the growth rate. If you do not specify a type,
linear growth is assumed.
The Grow command only works with timescale D-Lists. This command can be entered as grow
or abbreviated to gr or g.
Prepare the Draft Electricity Budget
The electricity budget is $4,000 per month maximum. In the Americas, you use electricity for
heating, so the cost is less for the months of Apr - Sep.
Steps to Enter the Data Using the Copy Command.
1. Select the Apr - Electricity cell.
2. Type 4K> and press Enter.
The number 4,000 copies across all the months.
3. If the Full Year - Electricity cell is 48,000 and each month is 4,000, save the D-Cube.
Otherwise, reset the D-Cube and try again.
Copy Data
Data can be copied using the following copying commands.
Copy CommandOperator
Copy right>
24 Analyst
Chapter 4: Creating the Americas Overheads D-Cube

Copy CommandOperator
Copy left<
Copy up^
Copy down|
Break:
These commands can be combined. For example, 4K>| copies the number 4,000 right and down.
You do not have to include the number to be copied with the copy command. For example, if you
type 4K and press Enter, you could copy this number to the right by typing only > in the cell and
pressing Enter.
Steps to Decrease the Electricity Costs in the Americas Summer Months
1. Select the Apr - Electricity cell.
2. Type dec5>, but do not press Enter.
3. Select the Jun - Electricity cell and enter dec10>.
4. Select the Sep - Electricity cell and enter dec5>.
5. Select the Dec - Electricity cell and enter a colon (:).
Note: Copy commands are terminated when they find another command or a colon. Copy
commands also are terminated by unprocessed numbers.
The graphic below shows the unprocessed commands in your D-Cube.
6. Press Enter.
Analyst decreases the initial $4,000 by 5% or 10% as requested.
7. If the Full Year - Electricity cell is 45,800, save the D-Cube.
Otherwise, reset the D-Cube and try again.
Tutorial 25
Chapter 4: Creating the Americas Overheads D-Cube

Arithmetic D-Cube CommandsThere are eight arithmetic commands in Analyst, as outlined in the following table. Each command
must be followed by a number with which to perform the action. For example, dec10 decreases the
cell value by 10%.
FunctionAbbreviationCommand
add toaAdd
subtract fromsSubtract
multiply bymMultiply
divide bydivDivide
take % ofperPercent
increase by %incIncrease
decrease by %decDecrease
raise to powerpowPower
Prepare the Rent and Rates Budget
The Rent and Rates budget starts at $16,000 per month and increases by 20% in the second quarter.
Steps
1. Select the Apr - Rent and Rates cell.
2. Type 16K> and press Enter.
To implement the increase, you could type inc20> in Jul - Rent and Rates. However, another
way of accessing D-Cube commands is illustrated in the next step.
3. Select the range of cells: Jul - Rent and Rates to Mar - Rent and Rates.
4. Right-click within the selected range of cells and click Apply Commands.
5. Select increase from the command list.
6. Type 20 directly after increase in the text box to the right of the list, and then click OK.
Each cell in the selected range increases by 20% to 19,200.
Commands can also be applied to multidimensional D-Cube selections. This is done by using
Commands on the D-Cube menu and making D-Cube selections.
26 Analyst
Chapter 4: Creating the Americas Overheads D-Cube
If the Full Year - Rent and Rates cell is 220,800 and the Full Year - Total Overheads total is
3,747,364 then save the D-Cube. Otherwise, reset the D-Cube and try again.
You now have finished your first draft budget.
Adjust the Overheads BudgetYou receive bad news from the head office: your overheads budget for the year must not exceed
$3,700,000. You must adjust the budget accordingly.
Hold SalariesYou know you are committed to the salary levels you have budgeted, so you plan to hold the salaries
figure and impose the budget restriction.
Holds on cells prevent them from being changed by breakback. However, you can enter or edit
data in a held cell as usual. Held cells are indicated by a light blue background.
You can hold the value of a cell using one of the following methods:
● Type hold or h within the cell.
● Right-click on a selected range and select Hold.
● On the D-Cube menu, select Commands. This is useful for holding multidimensional sections.
You can release the hold on a cell by using one of the following methods:
● Type release or rel within the cell.
● Right-click a selected range and select Release.
● On the D-Cube menu, select Release All Holds. This command releases all holds within the
D-Cube.
Steps
1. Select the Full Year - Salaries cell.
2. Type hold and press Enter.
The Full Year - Salaries cell now should have a light turquoise background indicating that it is
a held cell.
Break Back the TotalBreakback the total to allocate the new budget total across all overheads. Salaries should not change
because of the hold placed on the salary total.
Steps
1. Select the Full Year - Total Overheads cell.
Tutorial 27
Chapter 4: Creating the Americas Overheads D-Cube

2. Type 3.7M and press Enter.
A breakback is performed, allocating the 3,700,000 across all overheads pro rata according to
their previous values. All salaries figures should remain unchanged (blue).
The Full Year figures now should be: Salaries 3,000,000; Travel 149,816; Telephone 300,578;
Electricity 42,868; Rent and Rates 206,738; Total Overheads 3,700,000.
Hold the Grand Total and Reset Rent and RatesThe results of this breakback show that you cannot achieve this saving on Rent and Rates. Therefore,
you now need to hold the grand total and reset Rent and Rates.
Steps
1. Select the Full Year - Total Overheads cell.
2. Type hold and press Enter.
3. Select the Apr - Rent and Rates cell.
4. Type reset> and press Enter.
The Reset command resets cells to their saved value.
All the numbers in Rent and Rates now should be blue.
The Full Year figures now should be: Salaries 3,000,000; Travel 145,543; Telephone 292,032;
Electricity 41,625; Rent and Rates 220,800; Total Overheads 3,700,000.
Decrease Rent and RatesThe budget for your remaining three overheads now is too low. Lower the rent and rates by 10%.
Steps
1. Select the Apr - Rent and Rates cell.
2. Type dec10> and press Enter.
The Full Year figures now should be: Salaries 3,000,000; Travel 152,253; Telephone 305,450;
Electricity 43,577; Rent and Rates 198,720; Total Overheads 3,700,000.
Save and Close the Americas Overheads D-CubeHolds are saved with a D-Cube file, so it is best to release all holds before saving unless you are
sure you want them.
Steps
1. On the D-Cube menu, click Release All Holds.
2. Save and close the D-Cube.
28 Analyst
Chapter 4: Creating the Americas Overheads D-Cube

Your budget now is complete. You have seen how to use Hold and Release in conjunction with
breakback, and you have been introduced to the Reset command.
Tutorial 29
Chapter 4: Creating the Americas Overheads D-Cube

30 Analyst
Chapter 4: Creating the Americas Overheads D-Cube

Chapter 5: Creating the 2 Divisions D-List
In this chapter, you will build your third D-List. This D-List will contain a list of divisions within
the company (Americas, Northern Europe, Central Europe, Southern Europe and Asia Pacific) with
a subtotal (Total Company).
Create a new D-ListBuilding the 2 Divisions D-List is much the same as building the 1 Overheads D-List, so the following
instructions are brief. If you need more detail, refer to the relevant step for the 1 Overheads D-List.
Steps
1. From the File menu, click New, D-List.
2. Type the following names into the Enter item names section, pressing Enter after each:
Americas
Northern Europe
Central Europe
Southern Europe
Asia Pacific
Total Company
3. Click OK.
The D-List editor appears with the six items listed.
Define the SubtotalDefine the total company subtotal as a sum calculation of each division.
Steps
1. Select the Total Company - Calculation cell.
2. Click Change item attributes.
3. Click Paste.
4. In the Select items for calculation dialog box, click OK to select all the items.
Remember that selecting nothing means to select all.
5. Click Apply.
Tutorial 31
Color Code the D-List (optional)Since the Divisions D-List is a geographical D-List, it should be green.
Steps
1. Click the D-List Color Indicator.
2. Click the light green color.
Name, Save, and Close the D-ListFinalize and close the 2 Divisions D-List.
Steps
1. From the File menu, click Save.
The Save D-List As dialog box appears.
2. In the D-List Name field, enter 2 Divisions, and then click OK.
3. From the File menu, click Close.
You now have finished the 2 Divisions D-List.
32 Analyst
Chapter 5: Creating the 2 Divisions D-List
Chapter 6: Creating the 1 Profit and Loss D-List
In this chapter, you will build your fourth and last D-List--a simplified Profit and Loss (P&L)
statement.
Create the 1 Profit and Loss D-ListCreate the 1 Profit and Loss D-List to create a simplified P&L statement with calculations other
than subtotals.
Steps
1. From the File menu, click New, D-List.
2. Type the following item names, pressing Enter after each:
Units Sold
Unit Price
Sales
Margin %
Margin
Overheads
Profit
Profit %
3. Click OK.
The D-List editor appears with the eight items listed.
Define the Sales FormulaSales is calculated by multiplying Units Sold by Unit Price. Cognos 8 Planning - Analyst expresses
the Sales calculation as the following:
+{Units Sold}
*{Unit Price}
Steps
1. Select the Sales - Calculation cell.
2. Click Change item attributes.
Tutorial 33
3. Click Paste.
The Select dialog box appears.
4. Select Units Sold and Unit Price.
5. Click Move>> to transfer these items to the Items included section.
Tip: You also can double-click an item to move it. It is placed after the first selected item. If
no item is selected, it is placed at the end of the list.
6. Click OK.
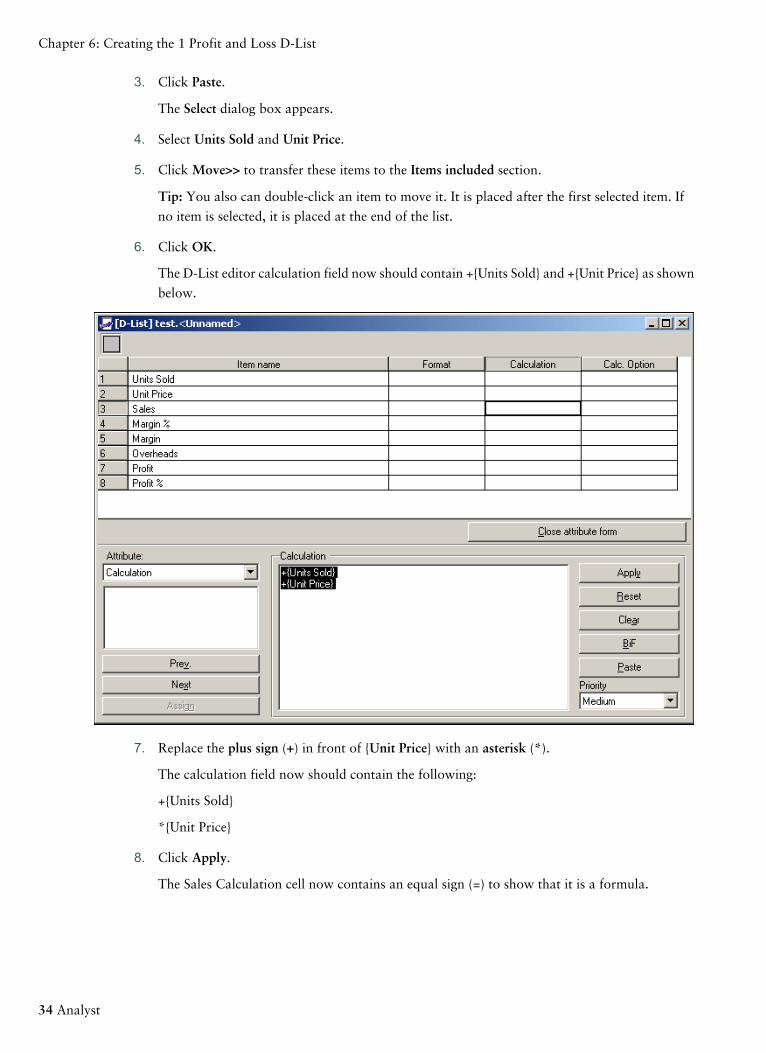
The D-List editor calculation field now should contain +{Units Sold} and +{Unit Price} as shown
below.
7. Replace the plus sign (+) in front of {Unit Price} with an asterisk (*).
The calculation field now should contain the following:
+{Units Sold}
*{Unit Price}
8. Click Apply.
The Sales Calculation cell now contains an equal sign (=) to show that it is a formula.
34 Analyst
Chapter 6: Creating the 1 Profit and Loss D-List
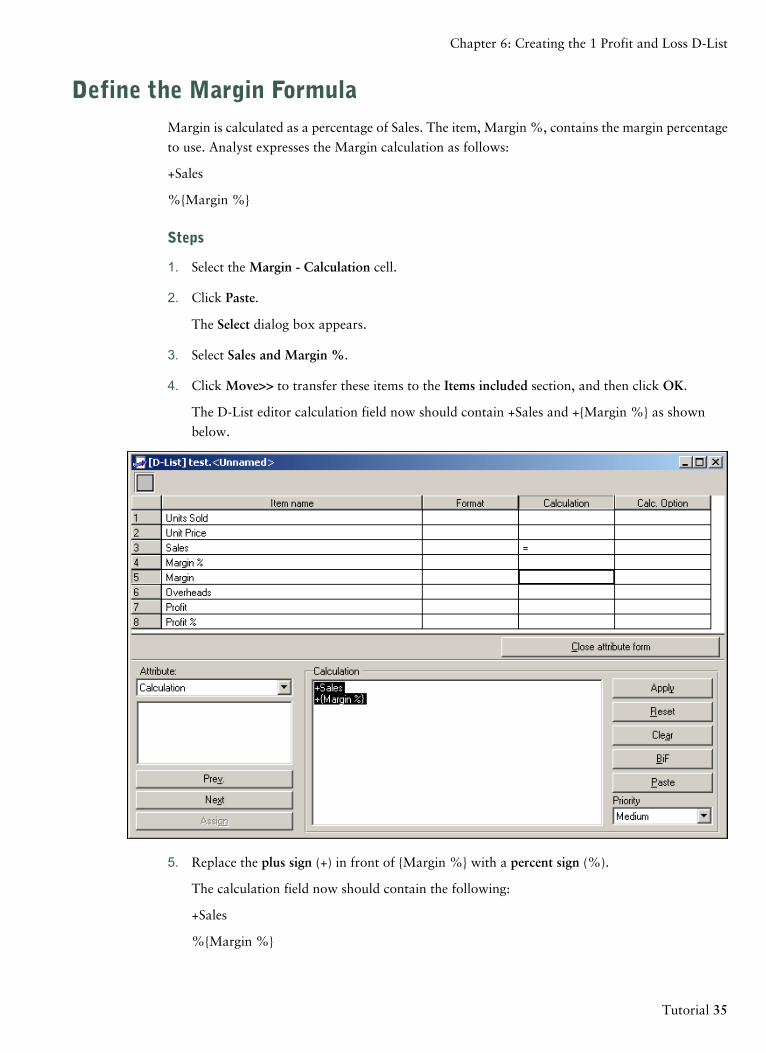
Define the Margin FormulaMargin is calculated as a percentage of Sales. The item, Margin %, contains the margin percentage
to use. Analyst expresses the Margin calculation as follows:
+Sales
%{Margin %}
Steps
1. Select the Margin - Calculation cell.
2. Click Paste.
The Select dialog box appears.
3. Select Sales and Margin %.
4. Click Move>> to transfer these items to the Items included section, and then click OK.
The D-List editor calculation field now should contain +Sales and +{Margin %} as shown
below.
5. Replace the plus sign (+) in front of {Margin %} with a percent sign (%).
The calculation field now should contain the following:
+Sales
%{Margin %}
Tutorial 35
Chapter 6: Creating the 1 Profit and Loss D-List
6. Click Apply.
Define the Profit FormulaProfit is calculated as Margin less Overheads. Analyst expresses the Profit calculation as follows:
+Margin
-Overheads
Steps
1. Select the Profit - Calculation cell.
2. Click Paste.
3. Select Margin and Overheads.
4. Click Move>> to transfer these items to the Items included section, and then click OK.
The calculation field now should contain the following:
+Margin
+Overheads
5. Replace the plus sign (+) in front of Overheads with a minus sign (-).
The calculation field now should contain the following:
+Margin
-Overheads
6. Click Apply.
Define the Profit % FormulaProfit % is calculated as Profit as a percentage of Sales. Analyst expresses the Profit % calculation
as follows:
+Profit
/Sales
*100
Steps to set the calculation
1. Select the Profit % - Calculation cell.
2. Click Paste.
3. Select Sales and Profit.
4. Click Move>> to transfer these items to the Items included section.
36 Analyst
Chapter 6: Creating the 1 Profit and Loss D-List
For this formula, Profit must come before Sales.
Steps to reorder the items
1. Select Profit from the Items included list.
2. Click the up arrow so Profit appears before Sales, and then click OK.
The calculation field now should contain the following:
+Profit
+Sales
Tip: You can reorder items by using the arrow keys or by using Sort. Sort allows you to sort
alphabetically, reverse alphabetically, or in the original D-List order. To sort items, you must
select them first.
3. Replace the plus sign (+) in front of Sales with a forward slash mark (/).
The calculation field now should contain the following:
+Profit
/Sales
4. Type *100 below /Sales.
The calculation field now should contain the following:
+Profit
/Sales
*100
5. Click Apply.
Name, Save, and Close the D-ListFinalize and close the 1 Profit an Loss D-List.
Steps
1. From the File menu, click Save.
2. Type 1 Profit and Loss in the D-List Name field and click OK.
3. From the File menu, click Close.
The 1 Profit and Loss D-List now is completed. You will return to this D-List later to make
adjustments and learn some new concepts.
Tutorial 37
Chapter 6: Creating the 1 Profit and Loss D-List

38 Analyst
Chapter 6: Creating the 1 Profit and Loss D-List

Chapter 7: Creating the Profit and Loss D-Cube
In this chapter, you create a second D-Cube named Profit and Loss. The Profit and Loss D-Cube
contains three D-Lists (1 Profit and Loss, 2 Divisions, and 4 Months - Fiscal).
You already have used the 4 Months - Fiscal D-List in the Americas Overheads D-Cube, and you
will use it again in the Profit and Loss D-Cube. Sharing D-Lists in this way is a key strength of
Cognos 8 Planning - Analyst. Any changes you make to a D-List are reflected in all D-Cubes that
use the D-List. For example, if you add quarterly subtotals to your 4 Months - Fiscal D-List, they
immediately become available in both the Profit and Loss and the Americas Overheads D-Cubes.
Create the Profit and Loss D-CubeCreate the Profit and Loss D-Cube to contain three D-Lists (1 Profit and Loss, 2 Divisions, and 4
Months - Fiscal).
Steps
1. From the File menu, click New, D-Cube.
2. Make sure the Test library is selected.
3. Select 1 Profit and Loss and click the down arrow key to move it to the Object(s) Selectedsection.
Note: Remember that the order you select D-Lists is important.
4. Repeat step 2 for 2 Divisions and then for 4 Months - Fiscal, and then click OK.
5. Type Profit and Loss in the D-Cube Name field, and click OK.
6. Click OK to open the entire D-Cube.
The Three-Dimensional D-Cube WindowThe Profit and Loss D-Cube window looks a little different from the Americas Overheads D-Cube.
This D-Cube has an extra group box, which represents the pages D-List.
Tutorial 39

For any D-Cube with three or more dimensions, the D-Cube window has one rows D-List and one
columns D-List. Each of the remaining D-Lists are pages D-Lists. Later in the Tutorial, after you
have populated the D-Cube with data, you will see how to view data in a three-dimensional D-Cube.
You have successfully created the Profit and Loss D-Cube. Leave the Profit and Loss D-Cube open.
40 Analyst
Chapter 7: Creating the Profit and Loss D-Cube

Chapter 8: Creating the
ProfitAndLoss<AmericasOverheads D-Link
In this chapter, you will transfer the Americas division’s Total Overheads from the Americas
Overheads D-Cube into the Profit and Loss D-Cube. To do this, you create and execute a D-Link.
You also will see how to use drill down to trace data that was transferred using a D-Link. You will
drill down on Americas division’s Overheads, which opens the Americas Overheads D-Cube.
This section also deals with limited and saved selections of D-Cubes. This facility allows you to
hide certain rows, columns, or pages and save this selection for later use.
What Is a D-Link?D-Links transfer data between D-Cubes or between external sources and D-Cubes. External sources
include ASCII files and sources that have an ODBC driver such as SQL databases, dBase files, MS
Access, and Excel. For information on importing data using ODBC, see the Cognos Planning -
Analyst online help.
Create the ProfitAndLoss<AmericasOverheads D-LinkCreate the ProfitAndLoss<AmericasOverheads D-Link to transfer the Total Overheads from the
Americas division into the Profit and Loss D-Cube.
Steps
1. Make sure that Profit and Loss D-Cube is open.
2. From the File menu, click New, D-Link.
The D-Link editor appears.
Note: The target for this D-Link automatically defaults to the Profit and Loss D-Cube because
this D-Cube is open and active.
3. Click Source and select D-Cube.
4. Select Americas Overheads and click OK.
Pair D-Lists Within a D-LinkThe selected source and target dimensions must be paired by D-Lists. D-Lists can be paired using
an Allocation Table or Match Descriptions.
Tutorial 41
The Allocation Table allows you to specify any pairing of source and target items. Allocation tables
support many-to-one allocations, in which many source items are consolidated into one target item
and one-to-many allocations, in which one source item is allocated to more than one target item.
Match Descriptions automatically matches D-List items with the same name. If one D-List is used
in both the source and target D-Cubes, the source D-List and the target D-List are paired
automatically.
After pairing the D-Lists, you frequently are left with unpaired D-Lists. You must select the required
items from unpaired D-Lists. In an unpaired source D-List, you select the item containing the data
you require. If you select more than one item, data from all the selected items is consolidated when
the D-Link is executed. In an unpaired target D-List, you select the items into which you want to
put the data.
In our example, the source D-List Americas Overheads and the target D-List Profit and Loss will
be paired using a simple Allocation Table. You are pairing these two D-Lists because they are both
calculation (white) D-Lists. Generally, source and target D-Lists belonging to the same class are
paired.
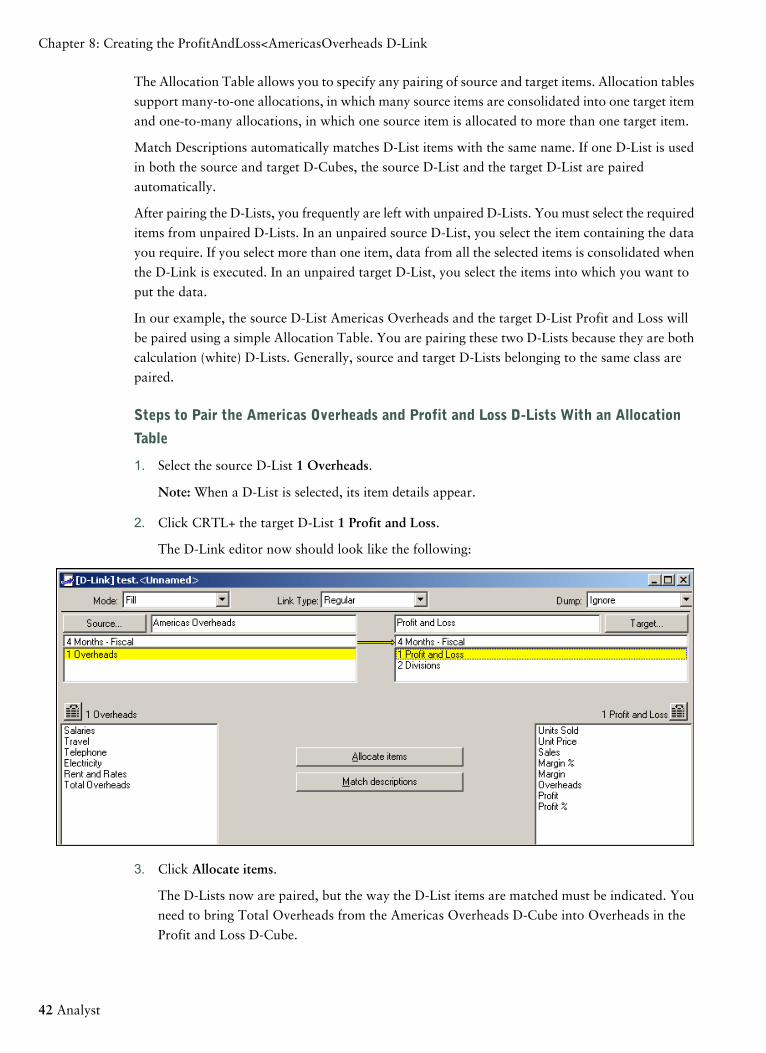
Steps to Pair the Americas Overheads and Profit and Loss D-Lists With an Allocation
Table
1. Select the source D-List 1 Overheads.
Note: When a D-List is selected, its item details appear.
2. Click CRTL+ the target D-List 1 Profit and Loss.
The D-Link editor now should look like the following:
3. Click Allocate items.
The D-Lists now are paired, but the way the D-List items are matched must be indicated. You
need to bring Total Overheads from the Americas Overheads D-Cube into Overheads in the
Profit and Loss D-Cube.
42 Analyst
Chapter 8: Creating the ProfitAndLoss<AmericasOverheads D-Link
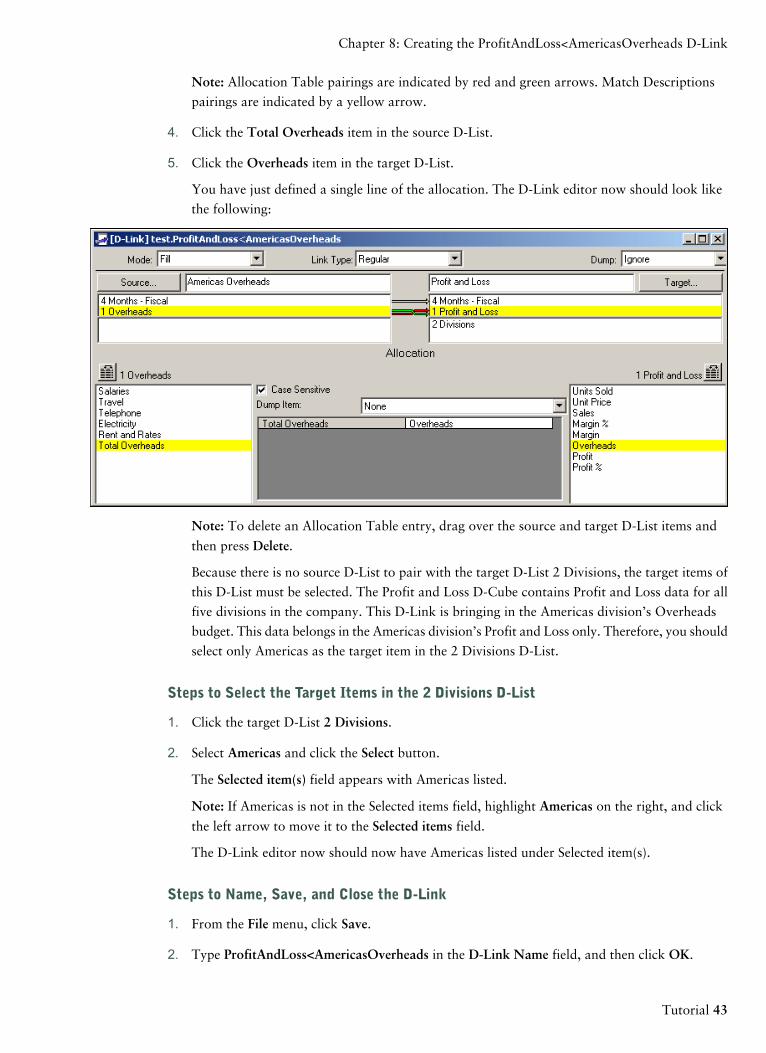
Note: Allocation Table pairings are indicated by red and green arrows. Match Descriptions
pairings are indicated by a yellow arrow.
4. Click the Total Overheads item in the source D-List.
5. Click the Overheads item in the target D-List.
You have just defined a single line of the allocation. The D-Link editor now should look like
the following:
Note: To delete an Allocation Table entry, drag over the source and target D-List items and
then press Delete.
Because there is no source D-List to pair with the target D-List 2 Divisions, the target items of
this D-List must be selected. The Profit and Loss D-Cube contains Profit and Loss data for all
five divisions in the company. This D-Link is bringing in the Americas division’s Overheads
budget. This data belongs in the Americas division’s Profit and Loss only. Therefore, you should
select only Americas as the target item in the 2 Divisions D-List.
Steps to Select the Target Items in the 2 Divisions D-List
1. Click the target D-List 2 Divisions.
2. Select Americas and click the Select button.
The Selected item(s) field appears with Americas listed.
Note: If Americas is not in the Selected items field, highlight Americas on the right, and click
the left arrow to move it to the Selected items field.
The D-Link editor now should now have Americas listed under Selected item(s).
Steps to Name, Save, and Close the D-Link
1. From the File menu, click Save.
2. Type ProfitAndLoss<AmericasOverheads in the D-Link Name field, and then click OK.
Tutorial 43
Chapter 8: Creating the ProfitAndLoss<AmericasOverheads D-Link

3. You are asked if you want to add this link to the Update Link table of the target D-Cube. Click
Yes and click OK in the Update List box.
4. From the File menu, click Close.
You now have created the ProfitAndLoss<AmericasOverheads D-Link.
Execute a D-LinkExecute the D-Link to transfer the Americas Overheads data into the Profit and Loss D-Cube.
Steps
1. From the D-Cube menu, click D-Links, Run.
2. Select the ProfitAndLoss<AmericasOverheads D-Link and click Execute.
3. If the Overheads Total is 3,700,000 and the Profit is (3,700,000), save the Profit and Loss
D-Cube.
You also can execute an open and active D-Link directly. On the D-Link menu, click Execute.
The target D-Cube does not need to be open to execute a D-Link this way. Use this method
also when you want to run a D-Link only once and not save it.
You have transferred data successfully from Americas Overheads to Profit and Loss.
Drill Down to Another D-CubeSuppose you are interested in the breakdown of the first quarter’s Overheads figures in the Profit
and Loss D-Cube.
Steps
1. Select the Apr, May, and Jun- Overheads cells.
2. From the D-Cube menu, click Drill Down.
A breakdown of the total overheads for each of the selected months appears from the Americas
Overheads D-Cube.
Note: You can open a D-Cube in full or take a limited selection. A limited selection includes
only some of the items from the D-Lists of the D-Cube. For example, the Americas Overheads
D-Cube, which was opened by Drill Down, was opened as a limited selection.
View, Edit and Save Limited SelectionsYou can save a limited selection of a D-Cube, such as the small portion of Americas Overheads, as
a Saved Selection. These selections are viewed, edited, and saved by clicking Selections on the
D-Cube menu.
44 Analyst
Chapter 8: Creating the ProfitAndLoss<AmericasOverheads D-Link
To illustrate, look at the current selection of the open Americas Overheads D-Cube.
Steps
1. From the D-Cube menu, click Selections, Reselect.
The Reselect dialog box appears. On the Overheads page, note that all the items are in the
Items included list.
2. Click the 4 Months - Fiscal tab.
Notice that only three items (Apr, May, Jun) are in the Items included list.
3. Select Jul, then click Move>> to transfer it to the Items included list, and then click OK.
The Americas Overheads D-Cube selection now includes July data.
4. This selection can now be saved for reuse. To do this, on the D-Cube menu, point to Selections
and click Save current. Under Selection Name, type Americas Overheads Selection, and click
OK.
5. Close the Americas Overheads D-Cube.
6. Save the Profit and Loss D-Cube.
You have finished looking at limited selections and saved selections.
Tutorial 45
Chapter 8: Creating the ProfitAndLoss<AmericasOverheads D-Link

46 Analyst
Chapter 8: Creating the ProfitAndLoss<AmericasOverheads D-Link
Chapter 9: Creating the Profit and Loss Data File
Map
In this chapter, you will create a file map for an ASCII file. A sample ASCII file named Tutorial.csv
is provided. The Tutorial.csv file is usually located in the TutorialGO folder of your Cognos 8
Planning - Analyst directory. For example, if Analyst is installed on the C:\ drive, the file is located
in the C:\Program Files\Cognos\c8\samples\<language>\Planning\TutorialGO folder.
What is a File Map?A file map translates ASCII files so they can be used by a D-Link. You specify which columns in
the ASCII file correspond to the D-Lists in your Analyst model and which columns contain the data
to transfer.
Create the Profit and Loss Data File MapCreate the Profit and Loss Data File Map to import data from an ASCII file into the Profit and Loss
D-Cube.
Steps
1. From the File menu, click New, File Map.
The Select ASCII File dialog box appears.
2. Select the Tutorial.csv file and click Open.
The first page of the File Map Editor appears.
If Tutorial.csv is not automatically displayed, navigate to the TutorialGO folder, for example:
Program Files\Cognos\c8\samples\<language>\Planning\TutorialGO.
3. Because the Tutorial.csv file is comma delimited, make sure that Delimited is selected, and then
choose Comma.
4. Because the first row of this file contains column headings, click Use row as column names.
Note: Do not change the row number from the default setting of 1 since the column headings
in this example are in row 1.
The Map dialog box now should look like the following:
Tutorial 47
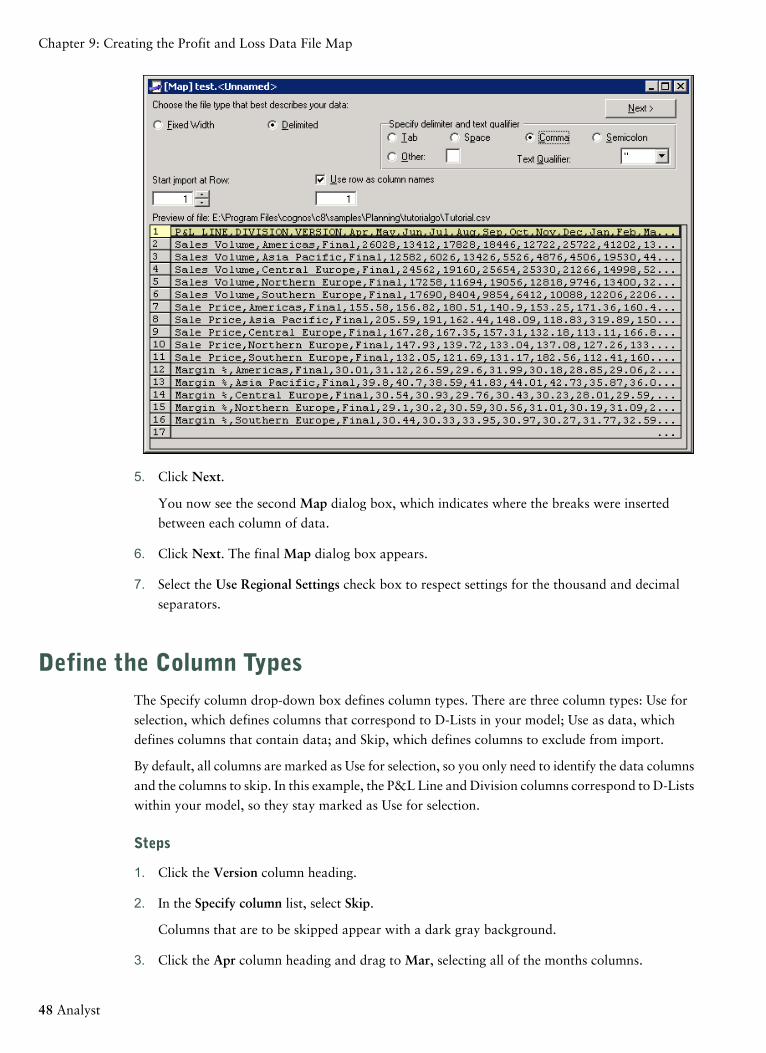
5. Click Next.
You now see the second Map dialog box, which indicates where the breaks were inserted
between each column of data.
6. Click Next. The final Map dialog box appears.
7. Select the Use Regional Settings check box to respect settings for the thousand and decimal
separators.
Define the Column TypesThe Specify column drop-down box defines column types. There are three column types: Use for
selection, which defines columns that correspond to D-Lists in your model; Use as data, which
defines columns that contain data; and Skip, which defines columns to exclude from import.
By default, all columns are marked as Use for selection, so you only need to identify the data columns
and the columns to skip. In this example, the P&L Line and Division columns correspond to D-Lists
within your model, so they stay marked as Use for selection.
Steps
1. Click the Version column heading.
2. In the Specify column list, select Skip.
Columns that are to be skipped appear with a dark gray background.
3. Click the Apr column heading and drag to Mar, selecting all of the months columns.
48 Analyst
Chapter 9: Creating the Profit and Loss Data File Map

In the Name field, the following appears: 12 Items.
4. In the Specify column list, select Use as data.
Name, Save, and Close the MapFinalize and close the map file.
Steps
1. From the File menu, click Save.
2. Type Profit and Loss Data in the File Map Name field, and then click OK.
3. From the File menu, click Close.
You have finished creating the Profit and Loss Data File Map.
Tutorial 49
Chapter 9: Creating the Profit and Loss Data File Map

50 Analyst
Chapter 9: Creating the Profit and Loss Data File Map
Chapter 10: Creating the
ProfitAndLoss<ProfitAndLossData D-Link
In this chapter, you will import data from the Tutorial.csv ASCII file. This file contains the sales
data (Units Sold, Unit Price, and Margin %) for all five divisions.
Now that you have mapped this ASCII file, you can create a D-Link with the Profit and Loss Data
file map as the source, and the Profit and Loss D-Cube as the target. You must create this D-Link
and then execute it.
Finally, you will see how you can use drill down to look at the source data in a mapped ASCII file.
Creating the ProfitAndLoss<ProfitAndLossData D-LinkCreate the ProfitAndLoss<ProfitAndLossData D-Link to match and allocate data from a mapped
ASCII file into the Profit and Loss D-Cube.
Steps
1. Make sure the Profit and Loss D-Cube is open in Full mode.
2. From the File menu, click New, D-Link.
The target for this D-Link automatically defaults to the Profit and Loss D-Cube since this
D-Cube is open and active.
3. Click Source.
4. Click Mapped (ASCII) File.
5. Select Profit and Loss Data and click OK.
You return to the D-Link editor.
The D-Link editor treats the columns (dimensions) of a mapped ASCII file like D-Lists. In this
example, the first two dimensions (DIVISION and P&L LINE) are the two Use for selection
columns. The last dimension is called DATA, which is a grouping of all Use as data columns
identified in the file map.
Tutorial 51
Pair the Data dimension with the 4 Months - Fiscal D-ListPair the Data dimension with the 4 Months - Fiscal D-List to match source and target data
dimensions.
Steps
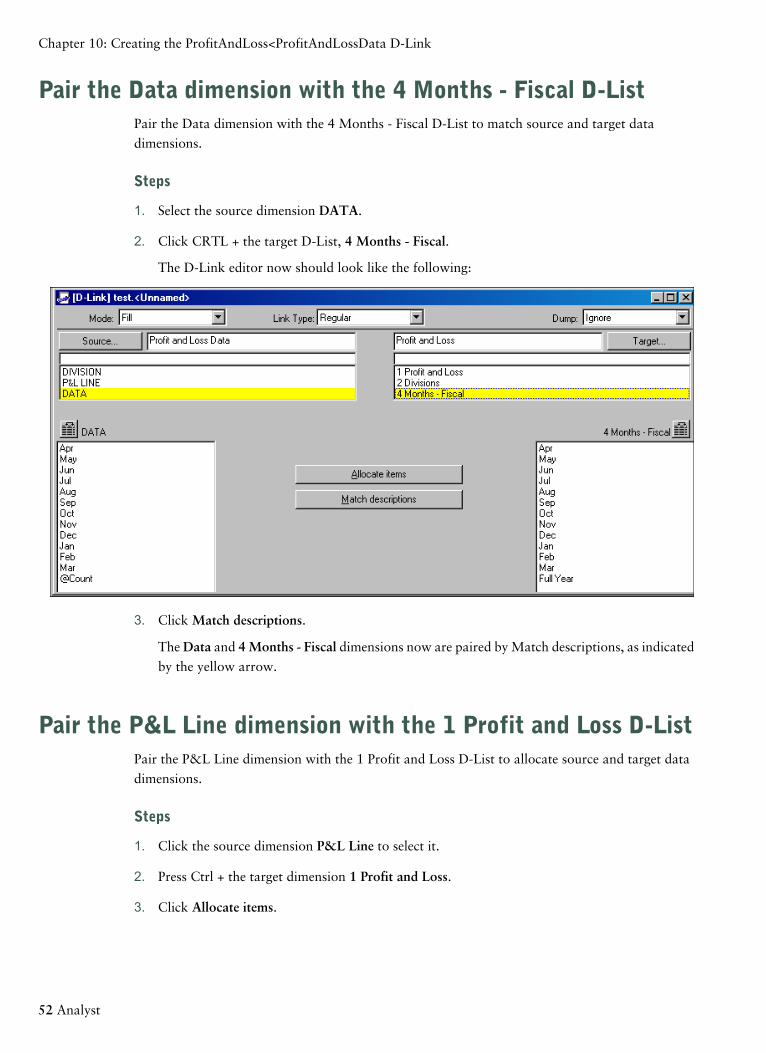
1. Select the source dimension DATA.
2. Click CRTL + the target D-List, 4 Months - Fiscal.
The D-Link editor now should look like the following:
3. Click Match descriptions.
The Data and 4 Months - Fiscal dimensions now are paired by Match descriptions, as indicated
by the yellow arrow.
Pair the P&L Line dimension with the 1 Profit and Loss D-ListPair the P&L Line dimension with the 1 Profit and Loss D-List to allocate source and target data
dimensions.
Steps
1. Click the source dimension P&L Line to select it.
2. Press Ctrl + the target dimension 1 Profit and Loss.
3. Click Allocate items.
52 Analyst
Chapter 10: Creating the ProfitAndLoss<ProfitAndLossData D-Link

In the D-List details section, a blank allocation table appears. You must specify the
correspondence of items. In the following steps, you will allocate the items from the source
D-Cube to the target D-Cube.
4. From the D-Link menu, click Allocation Table, Match descriptions.
This matches item names found in both the source and target dimensions (Margin %, in this
case) and includes them in the allocation table. Make the following matches:
● Select Sales Volume from the source dimension P&L Line.
● Select Units Sold from the target dimension 1 Profit and Loss.
● Select Sale Price from the source dimension P&L Line.
● Select Unit Price from the target dimension 1 Profit and Loss.
The D-Link editor now should look like the following:
Pair the Division Dimension with the 2 Divisions D-ListPair the Division dimension with the 2 Divisions D-List to match the divisions source and target
data dimensions.
Steps
1. Select the source dimension DIVISION.
2. Click CRTL + the target D-List 2 Divisions.
3. Click Match descriptions.
The D-Link dialog box now should look like the following:
Tutorial 53
Chapter 10: Creating the ProfitAndLoss<ProfitAndLossData D-Link

Execute the D-LinkExecute the D-Link to transfer data from the Tutorial.csv file into the Profit and Loss D-Cube.
Steps
1. From the D-Link menu, click Execute.
2. The Profit and Loss D-Cube now should display the new data brought in from the Tutorial.csv
file.
3. Click the Page: 2 Division group box.
4. Double-click the Northern Europe page.
Drill Down to a Mapped ASCII FileFind the derivation of Margin for the Northern Europe division in Apr.
Note: The Profit and Loss D-Cube still should be open on the Northern Europe page.
Steps
1. Select the Apr - Margin cell.
2. From the D-Cube menu, click Drill Down or press F9.
The rows of the Tutorial.csv file used to make up this value display in a text viewer.
3. From the File menu, click Close.
You have finished importing data into the Profit and Loss D-Cube. Leave the Profit and Loss
D-Cube open.
54 Analyst
Chapter 10: Creating the ProfitAndLoss<ProfitAndLossData D-Link
Name, Save, and Close the D-LinkFinalize and close the D-Link.
Steps
1. Click the D-Link window to make it active.
2. From the File menu, click Save.
3. Type ProfitAndLoss<ProfitAndLossData in the D-Link Name field, and then click OK.
4. You are asked if you want to add this link to the Update Link table of the target D-Cube. Click
Yes and then OK.
5. From the File menu, click Close.
The Profit and Loss D-Cube should be active.
6. Save the Profit and Loss D-Cube.
You now have finished creating the D-Link from Tutorial.csv to the Profit and Loss D-Cube.
Tutorial 55
Chapter 10: Creating the ProfitAndLoss<ProfitAndLossData D-Link

56 Analyst
Chapter 10: Creating the ProfitAndLoss<ProfitAndLossData D-Link
Chapter 11: Revisiting the Profit and Loss D-Cube
In this chapter, you will learn how to:
● Page through and take slices from a three-dimensional D-Cube.
● Define D-List items as weighted averages to correct certain D-Cube problems.
● Change the format of D-List items using Saved Formats.
● Use a Built-in Function (BiF).
Page Through a Three-Dimensional D-CubeThe Profit and Loss D-Cube has three dimensions (D-Lists). The first two make up the rows and
columns; the third makes up the pages. Each dimension is shown in the Page, Columns, or Rows
group box. Click the group box to view any D-List item in each page, columns, or rows D-List.
Steps
1. Make sure the Profit and Loss D-Cube is open.
2. Click the Page: 2 Divisions group box.
3. Double-click the item you want.
In a D-Cube with more than three dimensions, there is more than one pages D-List. You can
select an item from any of the pages D-Lists as described above.
Tip: Use your keyboard arrows to move up and down to the next item in the pages D-List.
Slice a Three-Dimensional D-CubeThe orientation of an open D-Cube is known as the slice. When you open a D-Cube, a default slice
is taken--the timescale D-List (where present) forms the columns, the longest D-List (that is, the
D-List with the most items) forms the rows, and any remaining D-Lists form the pages.
Therefore, the Profit and Loss D-Cube opens with the following slice: Profit and Loss by Months,
with Divisions as the pages D-List (that is, the 1 Profit and Loss D-List forms the rows, the 4 Months
- Fiscal D-List forms the columns, and the 2 Divisions D-List forms the pages).
Steps to Change the Slice
1. Select the Apr - Units Sold cell.
2. Point to the color indicator of the pages D-List group box.
Tutorial 57

3. Click and hold the color indicator.
4. Drag and position the arrow over the 4 Months - Fiscal D-List group box.
5. Release the mouse.
Profit and Loss now appears with 2 Divisions as the columns and 4 Months - Fiscal as the
pages.
The active page in the new pages D-List is determined by the item in this D-List that was active
before changing the slice. In the above example, the Apr page is active because the Apr - Units
Sold cell was selected before the slice was changed.
Steps to Select a Page Item as you Change the Slice
1. Move the pointer over the color indicator of the pages (4 Months - Fiscal) D-List group box.
2. Click and hold the color indicator.
3. Drag and position the arrow over the Northern Europe column heading and release the mouse.
Profit and Loss now appears with 4 Months - Fiscal as columns and Northern Europe as the
pages.
Weighted Averages in the 1 Profit and Loss D-ListYou may have noticed that some data in the Profit and Loss D-Cube is not calculated correctly.
For example, look at the Northern Europe division page of the Profit and Loss by 4 Months - Fiscal
slice of the Profit and Loss D-Cube. The Full Year figures for three of the items in the 1 Profit and
Loss D-List (Unit Price, Margin %, and Profit %) are incorrect. Correct these problems by defining
these items as weighted averages.
Weighted averages usually are defined when you initially create a D-List.
To determine what item to weight by, the formula A = B / C is used, where A is the formula item.
Item A should always be weighted by item C.
Note: Remember that A = B / C can also be expressed as B = A * C.
Steps to Define Unit Price as a Weighted Average
1. Open the 1 Profit and Loss D-List.
To open this D-List from the open Profit and Loss D-Cube, right-click the 1 Profit and Loss
D-List group box (Units Sold) and click Edit D-List.
2. Select the Unit Price - Calc. Option cell.
3. Click Change item attributes.
4. In the Calc. Option section, select Weighted Averages.
5. In the Items to weight by list, select Units Sold.
58 Analyst
Chapter 11: Revisiting the Profit and Loss D-Cube

Note: In the P1 Profit and Loss D-List, Sales is calculated from Unit Price multiplied by Units
Sold. You can rearrange the relationship between these items to be {Unit Price} = Sales / {Units
Sold}. Therefore, Unit Price should be weighted by Units Sold. In the equation A = B / C; A is
always weighted by C.
6. Click Apply.
The D-List editor should now look like the following:
Steps to Define Margin % as a Weighted Average
1. Select the Margin % - Calc. Option cell.
2. In the Calc. Option section, select Weighted Averages.
3. In the Items to weight by list, select Sales.
Note: Margin is calculated as Margin = Sales % {Margin %}. This could be rearranged as
Margin % = {Margin} / Sales * 100. Therefore, Margin % should be weighted by Sales.
4. Click Apply.
Steps to Define Profit % as a Weighted Average
1. Select the Profit % - Calc. Option cell.
2. In the Calc. Option section, select Weighted Averages.
3. In the Items to weight by list, select Sales.
Tutorial 59
Chapter 11: Revisiting the Profit and Loss D-Cube
Note: Profit % is calculated as Profit % = Profit / Sales * 100. Therefore, Profit % should be
weighted by Sales.
4. Click Apply.
5. Save the D-List.
The Full Year totals now are calculated correctly.
You have finished setting up the weighted averages in the P&L D-List.
Change Formats in the P&L D-ListNow you need to change the numeric format for some items in the 1 Profit and Loss D-List. Unit
Price should appear in the D-Cube with two decimal places, and Margin % and Profit % should
appear as percentages with two decimal places.
Steps to Change the Numeric Format for Unit Price
1. Make sure the 1 Profit and Loss D-List is active.
Tip: If a D-List is open but not visible, on the Window menu, select the name of the D-List.
2. Double-click the Unit Price - Format cell or click Change item attributes.
The Attribute section of the D-List editor appears.
3. From the Attribute list, select Numeric.
4. In the Decimal Places field, increase the number of decimal places to 2.
5. Click Apply.
Notice that Numeric appears in the D-List editor to indicate that a numeric format is set for
Unit Price.
Steps to Assign a Percentage Format
1. Select the Margin % - Format cell.
2. In the Attribute list, select Numeric.
3. In the Decimal Places field, increase the number to 2.
4. In the Negative Suffix field, type a percent sign (%) before the bracket.
5. In the Positive Suffix field, type a percent sign (%).
The D-List editor now should look like the following:
60 Analyst
Chapter 11: Revisiting the Profit and Loss D-Cube
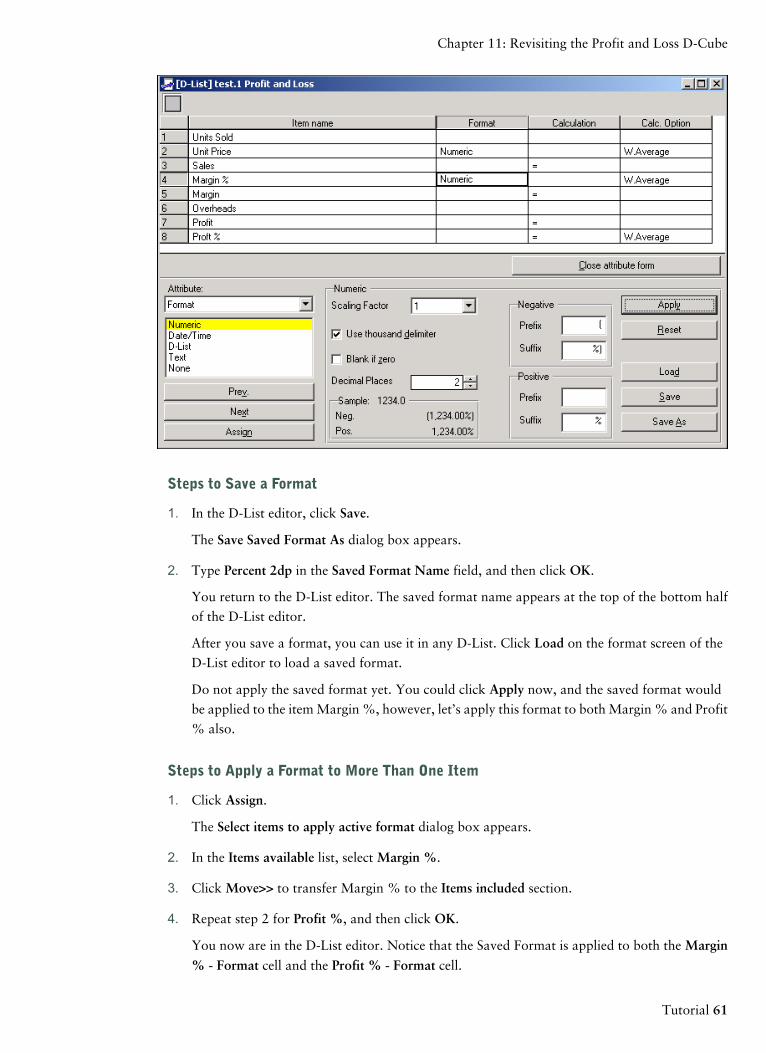
Steps to Save a Format
1. In the D-List editor, click Save.
The Save Saved Format As dialog box appears.
2. Type Percent 2dp in the Saved Format Name field, and then click OK.
You return to the D-List editor. The saved format name appears at the top of the bottom half
of the D-List editor.
After you save a format, you can use it in any D-List. Click Load on the format screen of the
D-List editor to load a saved format.
Do not apply the saved format yet. You could click Apply now, and the saved format would
be applied to the item Margin %, however, let’s apply this format to both Margin % and Profit
% also.
Steps to Apply a Format to More Than One Item
1. Click Assign.
The Select items to apply active format dialog box appears.
2. In the Items available list, select Margin %.
3. Click Move>> to transfer Margin % to the Items included section.
4. Repeat step 2 for Profit %, and then click OK.
You now are in the D-List editor. Notice that the Saved Format is applied to both the Margin
% - Format cell and the Profit % - Format cell.
Tutorial 61
Chapter 11: Revisiting the Profit and Loss D-Cube
5. Save the 1 Profit and Loss D-List.
6. Select the Profit and Loss D-Cube to make it active.
You should see the effects of the formats you have set.
Add a Cumulative Profit ItemIn this section, you insert an extra item to calculate the Cumulative Profit figure in your Company
P&L.
● Add the item Cumulative Profit to the 1 Profit and Loss D-List.
● Use the Cumulative Built-in Function (BiF) to calculate the Cumulative Profit figure in the 1
Profit and Loss D-List. This cannot be done using standard D-List calculations since a time lag
is involved.
● Adjust the time totaling for the Cumulative Profit item so the Full Year gives the correct result.
Steps to Add an Item to the 1 Profit and Loss D-List
1. Make sure the 1 Profit and Loss D-List is active.
2. From the D-List menu, click Add Items, Input.
The Input new Items dialog box appears.
3. Type the item, Cumulative Profit.
4. In the Where drop-down box, click Bottom, and then click OK.
You return to the D-List editor. Cumulative Profit appears at the end of the item list.
Steps to Assign the Cumulative BiF
1. Select the Cumulative Profit - Calculation cell.
2. Make sure the Attribute form is still open. If not, click Change item attributes.
3. Click BiF.
The BiF Function Wizard--Step 1 of 2 screen appears.
4. In the Function Name list, select Cumul.
5. Click Next.
The BiF Function Wizard--Step 2 of 2 screen appears.
6. In the Items drop-down box, select All.
All the D-List items listed should appear, including Profit.
7. Double-click Profit to move it to the Original text box.
This selects the original series of data for which you want to calculate the cumulative total.
62 Analyst
Chapter 11: Revisiting the Profit and Loss D-Cube
8. Click Finish.
You now exit from the Function Wizard and return to the D-List editor. The Calculation field
should contain @Cumul(Profit).
9. Click Apply.
The Cumulative Profit Calculation cell now contains BiF, indicating that the Built-in Function
was set up successfully.
10. Save the D-List.
11. Select the Profit and Loss D-Cube to make it active.
You should be able to view the new Cumulative Profit figures.
You have successfully added an item to the 1 Profit and Loss D-List and defined it as a
Cumulative BiF.
Adjust the Time Totaling for Cumulative ProfitNotice that in the Profit and Loss D-Cube, the item Full Year sums the figures in the new Cumulative
Profit item. You want Full Year to show the Cumulative Profit as the last month of the financial
year. However, it currently adds up figures that are already cumulative totals, giving an incorrect
result.
Steps
1. Make sure the 1 Profit and Loss D-List is active.
2. Select the Cumulative Profit - Calc. Option cell.
3. Make sure the Attribute form is still open. If not, click Change item attributes.
4. Select Time Averages.
5. Select Last period in the Available functions list.
6. Click Apply.
7. Save and close the D-List.
After closing the 1 Profit and Loss D-List, the Profit and Loss D-Cube is active. You will see
that Full Year - Cumulative Profit is no longer a sum of the months but is equal to Cumulative
Profit in Mar, the last period of the financial year.
Tutorial 63
Chapter 11: Revisiting the Profit and Loss D-Cube

8. Save the Profit and Loss D-Cube.
9. Close the 1 Profit and Loss D-List and the Profit and Loss D-Cube.
You have completed the Cognos 8 Planning - Analyst Tutorial.
64 Analyst
Chapter 11: Revisiting the Profit and Loss D-Cube
Index
A
Allocation Table option, 41, 52
arithmetic D-Cube commands, 26
B
best practices, 5
breakback, 22
C
cells
color coding, 20
editing, 20
holding, 27
selecting, 20
viewing formulas, 20
cell selection, 20
closing D-Lists, 14
color coding, 17
cells, 20
D-Lists, 32
column types, defining in file maps, 48
commands, applying to multidimensional D-Cube
selection, 26
compound growth, 24
Copy command, 24
copying D-Cube data, 24
copyright material
printing, 6
D
D-Cube commands
arithmetic, 26
Copy, 24
Grow, 24
Hold, 27
Reset, 28
D-Cubes
cell manipulation, 20
cell selection, 20
creating, 19
defined, 19
drill-down, 44
holding cells within, 27
keyboard shortcuts, 20
limited selections, 44
limited selections, saving, 44
paging, 57
selecting D-List pages, 57
slicing, 57
three-dimensional, 39
D-Cube window, 20
three-dimensional, 39
D-Links
creating, 41
defined, 41
executing, 44
D-Lists
color coding, 17, 32
creating, 11
defined, 11
detail items, 11
editing, 11
formats, 60
formulas, 11
naming, 14
numeric formats, 60
order of, 19
pairing in D-Links, 41
percentage formats, 60
subtotals, defining, 12
time averages, 63
timescale, 15, 24
weighted averages, 58
drill-down, 44
drilling down
to a mapped ASCII file, 54
E
editing cells, 20
Tutorial 65

executing D-Links, 44
F
file maps
column types, defining, 48
creating, 47
defined, 47
finding information, 6
formats
in D-Lists, 60
numeric, 60
percentages, 60
saving, 61
formulas
defining, 33
viewing, 20
G
Global Customer Services Web site, 6
Grow command, 24
H
help
getting, 6
Hold command, 27
holding cells, 27
holds
removing, 27
I
information
finding, 6
L
limited selections, saving, 44
linear growth, 24
lists
formulas, 33
M
mapped ASCII files
drilling down to, 54
Match Descriptions option, 41, 52
N
naming D-Lists, 14
numeric formats, 60
P
paging in D-Cubes, 57
percentage formats, 60
printing copyright material, 6
R
related documentation, 6
Reset command, 28
S
saving
D-Lists, 14
formats, 61
slicing
D-Cubes, 57
subtotals in D-Lists, 12
T
time averages, 63
timescale D-Lists, 15, 24
defining, 16
time totals, adjusting, 63
U
unprocessed numbers
changing, 23
resetting, 23
W
weighted averages, 58
66 Analyst
Index