510(k) SUBSTANTIAL EQUIVALENCE DETERMINATION DECISION ... · Urobilinogen: This test is based on a...
27
510(k) SUBSTANTIAL EQUIVALENCE DETERMINATION DECISION SUMMARY ASSAY ONLY TEMPLATE A. 510(k) Number: k061559 B. Purpose for Submission: Clearance of a new device C. Measurand: Urinary Glucose, Occult Blood, Leukocytes, pH, Nitrite, Protein, Ketones, Urobilinogen, Bilirubin, Specific Gravity and Ascorbic Acid D. Type of Test: Qualitative and semi-quantitative urine tests E. Applicant: ACON Laboratories, Inc. F. Proprietary and Established Names: ACON Urinalysis Reagent Strips G. Regulatory Information: 1. Regulation section: 21 CFR § 862.1340 Urinary Glucose (Non-Quantitative) Test System 21 CFR § 862.1115 Urinary Bilirubin and its Conjugates (Non-Quantitative) Test System 21 CFR § 862.1435 Ketones (Non-Quantitative) Test System 21 CFR § 864.6550 Occult Blood Test 21 CFR § 862.1550 Urinary pH (Non-Quantitative) Test System 21 CFR § 862.1645 Urinary Protein or Albumin (Non-Quantitative) Test System 21 CFR § 862.1785 Urinary Urobilinogen (Non-Quantitative) Test System 21 CFR § 862.1510 Nitrite (Non-Quantitative) Test System 21 CFR § 864.7675 Leukocyte Peroxidase Test 21 CFR § 862.1095 Ascorbic Acid Test System 2. Classification: Class II: Urinary Glucose and Occult Blood Class I: Urinary Leukocytes, Urinary pH, Nitrite, Urinary Protein, Ketones, Urinary Urobilinogen, Urinary Bilirubin, Specific Gravity and Ascorbic Acid 3. Product code: JIL Urinary Glucose (non-quant.) test system JIO Blood, Occult, Colorimetric, in urine 1
Transcript of 510(k) SUBSTANTIAL EQUIVALENCE DETERMINATION DECISION ... · Urobilinogen: This test is based on a...

510(k) SUBSTANTIAL EQUIVALENCE DETERMINATION DECISION SUMMARY
ASSAY ONLY TEMPLATE A. 510(k) Number:
k061559
B. Purpose for Submission: Clearance of a new device
C. Measurand: Urinary Glucose, Occult Blood, Leukocytes, pH, Nitrite, Protein, Ketones, Urobilinogen, Bilirubin, Specific Gravity and Ascorbic Acid
D. Type of Test: Qualitative and semi-quantitative urine tests
E. Applicant: ACON Laboratories, Inc.
F. Proprietary and Established Names: ACON Urinalysis Reagent Strips
G. Regulatory Information: 1. Regulation section:
21 CFR § 862.1340 Urinary Glucose (Non-Quantitative) Test System 21 CFR § 862.1115 Urinary Bilirubin and its Conjugates (Non-Quantitative) Test System 21 CFR § 862.1435 Ketones (Non-Quantitative) Test System 21 CFR § 864.6550 Occult Blood Test 21 CFR § 862.1550 Urinary pH (Non-Quantitative) Test System 21 CFR § 862.1645 Urinary Protein or Albumin (Non-Quantitative) Test System 21 CFR § 862.1785 Urinary Urobilinogen (Non-Quantitative) Test System 21 CFR § 862.1510 Nitrite (Non-Quantitative) Test System 21 CFR § 864.7675 Leukocyte Peroxidase Test 21 CFR § 862.1095 Ascorbic Acid Test System
2. Classification: Class II: Urinary Glucose and Occult Blood Class I: Urinary Leukocytes, Urinary pH, Nitrite, Urinary Protein, Ketones, Urinary Urobilinogen, Urinary Bilirubin, Specific Gravity and Ascorbic Acid
3. Product code: JIL Urinary Glucose (non-quant.) test system JIO Blood, Occult, Colorimetric, in urine
1

LJX Test, Urine Leukocyte CEN Urinary, pH (non-quant.) JMT Nitrite (urinary, non-quant.) test system JIR Protein or Albumin (urinary, non-quant.) test system JIN Ketones (urinary, non-quant.) test system CDM Urinary Urobilinogen (non-quant.) test system JJB Urinary Bilirubin & its conjugates (urinary, non-quant.) test system JMA Acid, Ascorbic, 2, 4-Dinitrophenylhydrazine (Spectrophotometric)
4. Panel: Chemistry (75) Hematology (82)
H. Intended Use: 1. Intended use(s):
The ACON Urinalysis Reagent Strips are for the qualitative and semi-quantitative detection of one or more of the following analytes in urine: glucose, bilirubin, ketone (acetoacetic acid), specific gravity, blood, pH, protein, urobilinogen, nitrite, leukocytes and ascorbic acid. It is intended for professional use only.
2. Indication(s) for use: The ACON Urinalysis Reagent Strips (Urine) are for the qualitative and semi-quantitative for detection of one or more of the following analytes in urine: Glucose, Bilirubin, Ketone (Acetoacetic acid), Specific Gravity, Blood, pH, Protein, Urobilinogen, Nitrite, Leukocytes and Ascorbic Acid. The ACON Urinalysis Reagent Strips (Urine) are for single use in professional near-patient (point-of-care) and centralized laboratory locations. The strips are intended for use in screening at-risk patients to assist diagnosis in the following areas:
• Kidney function • Urinary track infections • Carbohydrate metabolism (e.g. diabetes mellitus) • Liver function • Acid-base balance • Urine concentration
The results can be used along with other diagnostic information to rule out certain disease states and to determine if microscopic analysis is needed. The test is to be read visually. It is intended for professional use only.
3. Special conditions for use statement(s):
For prescription use 4. Special instrument requirements:
2
Not applicable. The device is a visually read single-use device.
I. Device Description: The ACON Urinalysis Reagent Strips are urine test strips of which glucose, bilirubin, ketone, specific gravity, blood, pH, protein, urobilinogen, nitrite and leukocyte reagent pads are affixed onto the plastic strips. The reagent pads react with the urine and provide a visible color reaction. Results are obtained by direct comparison of the test strip with the color blocks printed on the bottle label. The product is packaged with a drying agent in a plastic bottle. The entire reagent strip is disposable when the disposal directions are followed exactly. Laboratory instrumentation is not required. These tests are intended for professional use with human urine.
J. Substantial Equivalence Information: 1. Predicate device name(s): Bayer Multistix 10 SG Reagent Strips for Urinalysis 2. Predicate 510(k) number(s): k905396 3. Comparison with predicate:
Similarities
Item Device Predicate
Intended Use Professional use in point-of-care urine testing Same
Target Population Patients of physicians, hospitals, and clinics Same
Intended Specimen Urine Same
Material Provided Plastic strips affixed with several separate reagent areas.
Same
Visual read test time Varies from 30 Seconds to 2 Minutes Same
Glucose Methodology Same Same Bilirubin Methodology Same Same Ketone Methodology Same Same Specific Gravity Methodology Same Same
Blood Methodology Same Same pH Methodology Same Same Protein Methodology Same Same Urobilinogen Methodology Same Same
Nitrite Methodology Same Same Leukocyte Methodology Same Same
3

Differences
Item Device Predicate
Ascorbic Acid Methodology
This test involves decolorization of Tillmann’s reagent. The presence of ascorbic acid causes the color of the test field to change from blue-green to orange.
This test is not included on Bayer test strip.
Storage 2 to 30ºC 15 to 30ºC
K. Standard/Guidance Document Referenced (if applicable):
None were identified by the applicant.
L. Test Principle: Glucose: This test is based on the enzymatic reaction that occurs between glucose oxidase, peroxidase and chromogen. Glucose if first oxidized to produce gluconic acid and hydrogen peroxide in the presence of glucose oxidase. The hydrogen peroxide reacts with potassium iodide chromogen in the presence of peroxidase. The extent to which the chromogen is oxidized determines the color which is produced, ranging from green to brown. Low amounts of glucose are normally excreted in urine. Glucose concentrations as low as 100 mg/dL, read at either 10 or 30 seconds, may be considered abnormal if results are consistent. At 10 seconds, results should be interpreted qualitatively. For semi-quantitative results, read at 30 seconds only. Bilirubin: This test is based on azo-coupling reaction of bilirubin with diazotized dichloroaniline in a strongly acidic medium. Varying bilirubin levels will produce a pinkish-tan color proportional to its concentration in urine. In normal urine, no bilirubin is detectable by even the most sensitive methods. Even trace amounts of bilirubin require further investigation. Atypical results (colors different from the negative or positive color blocks shown on the color chart) may indicate that bilirubin-derived bile pigments are present in the urine specimen, and are possibly masking the bilirubin reaction. Ketone: This test is based on ketones reacting with nitroprusside and acetoacetic acid to produce a color change ranging from light pink for negative results to a darker pink or purple color for positive results. Ketones are normally not present in urine. Detectable ketone levels may occur in urine during physiological stress conditions such as fasting, pregnancy and frequent strenuous exercise. In starvation diets, or in other abnormal carbohydrate metabolism situations, ketones appear in the urine in excessively high concentration before serum ketones are elevated. Specific Gravity: This test is based on the apparent pKa change of certain pretreated polyelectrolytes in relation to ionic concentration. In the presence of an indicator,
4

colors range from deep blue-green in urine of low ionic concentration to green and yellow-green in urine of increasing ionic concentration. Randomly collected urine may vary in specific gravity from 1.003-1.035. Twenty-four hour urine from healthy adults with normal diets and fluid intake will have a specific gravity of 1.016-1.022. In cases of severe renal damage, the specific gravity is fixed at 1.010, the value of the glomerular filtrate. Blood: This test is based on the peroxidase-like activity of hemoglobin which catalyzes the reaction of cumene-hydroperoxide and 3,3',5,5'-tetramethylbenzidine. The resulting color ranges from orange to green to dark blue. Any green spots or green color development on the reagent area within 60 seconds is significant and the urine specimen should be examined further. Blood is often, but not invariably, found in the urine of menstruating females. pH: This test is based on a double indicator system which gives a broad range of colors covering the entire urinary pH range. Colors range from orange to yellow and green to blue. The expected range for normal urine specimens from newborns is pH 5-7. The expected range for other normal urine specimens is pH 4.5-8, with an average result of pH 6. Protein: This reaction is based on the phenomenon known as the "protein error” of pH indicators where an indicator that is highly buffered will change color in the presence of proteins (anions) as the indicator releases hydrogen ions to the protein. At a constant pH, the development of any green color is due to the presence of protein. Colors range from yellow to yellow-green for negative results and green to green-blue for positive results. 1-14 mg/dL of protein may be excreted by a normal kidney. A color matching any block greater than trace indicates significant proteinuria. Urobilinogen: This test is based on a modified Ehrlich reaction between p-diethylaminobenzaldehyde and urobilinogen acid in strongly acidic medium to produce a pink color. Urobilinogen is one of the major compounds produced in heme this test is 0.2-1.0 mg/dL (3.5-17 μmol/L). A result of 2.0 mg/dL (35 μmol/L) may be of clinical significance, and the patient specimen should be further evaluated. Nitrite: This test depends upon the conversion of nitrate to nitrite by the action of Gram negative bacteria in the urine. In an acidic medium, nitrite in the urine reacts with p-arsanilic acid to form a diazonium compound. The diazonium compound in turn couples with 1 N-(1-naphthyl)-ethylenediamine to produce a pink color. Nitrite is not detectable in normal urine. The nitrite area will be positive in some cases of infection, depending on how long the urine specimens were retained in the bladder prior to collection. Retrieval of positive cases with the nitrite test ranges from as low as 40% in cases where little bladder incubation occurred, to as high as approximately 80% in cases where bladder incubation took place for at least 4 hours. Leukocytes: This test reveals the presence of granulocyte esterases. The esterases cleave a derivatized pyrazole amino acid ester to liberate derivatized hydroxy
5

pyrazole. This pyrazole then reacts with a diazonium salt to produce a beige-pink to purple color. Normal urine specimens generally yield negative results. Trace results may be of questionable clinical significance. When trace results occur, it is recommended to retest using a fresh specimen from the same patient. Repeated trace and positive results are of clinical significance. Ascorbic acid: This test involves decolorization of Tillmann’s reagent. The presence of ascorbic acid causes the color of the test field to change from blue-green to orange.
M. Performance Characteristics (if/when applicable): 1. Analytical performance:
a. Precision/Reproducibility: This reproducibility study employed two Bio-Rad Urinalysis Controls: Bio-Rad Urinalysis Control Level 1 and Bio-Rad Urinalysis Control Level 2. The specifications of these two controls are listed in the following tables.
Bio-Rad Urinalysis Control, Level 1 values
Analyte Control (Level 1) Glucose Neg Bilirubin Neg Ketone Neg
Specific Gravity 1.010 – 1.020 Blood Neg
pH 5.0 – 6.0 Protein Neg
Urobilinogen 0.2 – 1.0 mg/dL Nitrite Neg
Leukocytes Neg Ascorbic Acid Neg
Bio-Rad Urinalysis Control, Level 2 values
Analyte Control (Level 2) Glucose 250 - ≥ 1,000 mg/dL Bilirubin Mod. - Large Ketone 5 – 40 mg/dL
Specific Gravity 1.015 – 1.025 Blood Mod. - Large
pH 6.5 – 7.5 Protein 30 - ≥ 300 mg/dL
Urobilinogen 4.0 - 8.0 mg/dL Nitrite Positive
Leukocytes Small – Large Ascorbic Acid Neg
6

Three lots of the ACON Urinalysis Reagent Strips were used. Tests in duplicates were performed with 10 repeats by 5 operators per day for 10 days. A total of 3,000 strips were used for testing (3 x 2 x 10 x 5 x 10 = 3,000 strips). Results were read by comparing color reaction to the color blocks on the canister label according to the instructions on the package insert. The results indicate that the values obtained were all within the expected values for the control materials. As the urinalysis controls did not have an ascorbic acid level, the sponsor used two ascorbic acid standard positive solutions, 10 mg/dL and 20 mg/dL. Testing was performed according to the package insert and the results were determined by visually comparing the reaction colors with the color chart. The ACON Urinalysis Reagent Strips from 3 lots were used and tests were performed in replicates of 10 for 2 runs by 10 operators per day for 10 days. The results indicate that the values obtained were all within the expected values for the control materials.
b. Linearity/assay reportable range:
Reagent Range
Glucose (GLU)
50-100 mg/dL (2.5-5 mmol/L). Results may be read at 10 seconds for qualitative results or at 30 seconds for semi-quantitative results.
Bilirubin (BIL) 0.4-1.0 mg/dL (6.8-17 µmol/L).
Ketone (KET) 2.5-5 mg/dL (0.25-0.5 mmol/L).
Specific Gravity (SG) Range: 1.000-1.030
Blood (BLO)
0.018-0.06 mg/dL or 5-10 Ery/µL in urine specimens with ascorbic acid content of <50 mg/dL.
pH Range: 5.0-9.0 Protein (PRO) 7.5-15 mg/dL (0.075-0.15 g/L).
Urobilinogen (URO) 0.2-1.0 mg/dL (3.5-17 µmol/L).
Nitrite (NIT)
0.05-0.1 mg/dL in urine with a low specific gravity and less than 30 mg/dL ascorbic acid.
Leukocytes (LEU) 9-15 white blood cells Leu/μL in clinical urine.
Ascorbic Acid (ASC) 5-10 mg/dL (0.28-0.56 mmol/L).
7
c. Traceability, Stability, Expected values (controls, calibrators, or methods):
The sponsor did not indicate any degree of traceability for their devices. Control materials are not specifically identified in the labeling, but the sponsor indicates in the labeling that for best results, performance of reagent strips should be confirmed by testing known positive and negative specimens/controls whenever a new test is performed, or whenever a new canister is first opened. The recommended storage temperature range for the ACON Urinalysis Reagent Strips is between 2 – 30°C. Opened canister stability claim of the strips is that the strips are stable for at least 3 months. Unopened canister stability claim of the strips is that the strips are stable for 24 months from the date of manufacture.
d. Detection limit: The sensitivity of the assay was validated by spiking positive urine samples of known concentrations for each analyte. These positive samples of each analyte were then diluted to the lowest “positive” concentrations indicated on the ACON color chart. For each analyte, aliquots of the lowest positive samples were further diluted to 4:1 or 80%, 3:2 or 60%, 1:1 or 50% and 1:3 or 25% of the originals with negative urine. Urine samples including negative and all spiked and diluted samples were then tested with three lots of the ACON Urinalysis Reagent Strips. For three consecutive days, each sample was tested 21 times by three operators (7 strips per operator per day). A total of 189 strips were used for each concentration tested (3 operators x 3 days x 7 strips x 3 lots = 189 strips). The minimum sensitivity level for each analyte of the ACON Urinalysis Reagent Strips is defined by the sponsor as the lowest level at which over 67% (2/3) of the test results are positive when the diluted positive samples for an analyte of known concentrations were tested. The results of each analyte sensitivity pad are summarized below. Gray blocks identify the low range (sensitivity) of each analyte.
Glucose Pad -
Results Glucose Conc. N Neg. 100
mg/dL* 250 mg/dL 500 mg/dL % Positive
25 mg/dL 189 189 0 0 0 0.0% 50 mg/dL 189 63 125 0 0 67.2% 60 mg/dL 189 0 189 0 0 100.0% 80 mg/dL 189 0 189 0 0 100.0% 100 mg/dL 189 0 189 0 0 100.0%
* Lowest Positive Concentration
8

Bilirubin Pad -
Results Bilirubin Conc. N Neg. 1 mg/dL* 2 mg/dL 4 mg/dL % Positive
0.25 mg/dL 189 189 0 0 0 0.0% 0.4 mg/dL 189 62 127 0 0 67.2% 0.6 mg/dL 189 62 127 0 0 67.2% 0.8 mg/dL 189 0 189 0 0 100.0% 1.0 mg/dL 189 0 189 0 0 100.0%
* Lowest Positive Concentration Ketone Pad -
Results Ketone Conc. n Neg. 5 mg/dL* 15 mg/dL 40 mg/dL 80 mg/dL % Positive
1.25 mg/dL 189 189 0 0 0 0 0.0%
2.5 mg/dL 189 63 126 0 0 0 67.2% 3 mg/dL 189 0 189 0 0 0 100.0% 4 mg/dL 189 0 189 0 0 0 100.0% 5 mg/dL 189 0 189 0 0 0 100.0%
* Lowest Positive Concentration
Blood Pad -
Results Blood Conc. n Neg. 5-10 Ery/μL* 50 Ery/μL % Positive
2.5 Ery/μL 189 94 95 0 50.0% 5 Ery/μL 189 0 189 0 100% 6 Ery/μL 189 0 189 0 100% 8 Ery/μL 189 0 189 0 100% 10 Ery/μL 189 0 189 0 100%
* Lowest Positive Concentration
Results Hemoglobin
Conc. n Neg. +/- Color Block
+ Positive Block % Positive
0.0075 mg/dL 189 189 0 0 0.0% 0.015 mg/dL 189 127 62 0 33.3% 0.018 mg/dL 189 62 127 0 66.7% 0.024 mg/dL 189 0 189 0 100% 0.03 mg/dL 189 0 189 0 100% 0.06 mg/dL 189 0 0 189 100%
9

Protein Pad -
Results Protein Conc. n Neg. 15 mg/dL* 30 mg/dL 100 mg/dL % Positive
3.75 mg/dL 189 189 0 0 0 0.0% 7.5 mg/dL 189 63 126 0 0 67.2% 9.0 mg/dL 189 9 180 0 0 95.2% 12.0 mg/dL 189 0 189 0 0 100.0% 15.0 mg/dL 189 0 189 0 0 100%
* Lowest Positive Concentration
Urobilinogen Pad -
Results Urobilinogen
Conc. n 0.2 mg/dL
1.0 mg/dL
2 mg/dL
4 mg/dL % Agreement
0.2 mg/dL 189 189 0 0 0 100.0% (first color block) 0.25 mg/dL 189 189 0 0 0 100.0% (first color block) 0.5 mg/dL 189 189 0 0 0 100.0% (first color block) 0.6 mg/dL 189 105 84 0 0 44.4% (second color block) 0.8 mg/dL 189 0 189 0 0 100.0% (second color block) 1.0 mg/dL 189 0 189 0 0 100.0% (second color block)
Urine urobilinogen concentration above 1 mg/dL is considered “Abnormal”. The minimum sensitivity level of urobilinogen was selected at 0.2 mg/dL. The test is not a reliable method for the detection of Porphobilinogen. The absence of Urobilinogen cannot be detected by the test.
Nitrite Pad -
Results Nitrite Conc. n Neg. Pos. % Positive 0.025 mg/dL 189 189 0 0.0% 0.05 mg/dL 189 5 184 97.4% 0.06 mg/dL 189 0 189 100% 0.08 mg/dL 189 0 189 100% 0.1 mg/dL 189 0 189 100%
10

Leukocytes Pad -
Results (Cells/μL) Leukocytes Conc. n Neg. 15* 70 125 % Positive
3.75 Cells/μL 189 189 0 0 0 0.0% 7.5 Cells/μL 189 130 59 0 0 31.2% 9 Cells/μL 189 63 126 0 0 67.2% 10 Cells/μL 189 0 189 0 0 100.0% 12 Cells/μL 189 0 189 0 0 100.0% 15 Cells/μL 189 0 189 0 0 100.0%
* Lowest Positive Concentration
Ascorbic Acid Pad -
Results (mg/dL) Ascorbic Acid
Conc. n Neg. 10* 20 40 % Positive
2.5 mg/dL 189 189 0 0 0 0.0% 5 mg/dL 189 0 189 0 0 100% 6 mg/dL 189 0 189 0 0 100% 8 mg/dL 189 0 189 0 0 100% 10 mg/dL 189 0 189 0 0 100%
* Lowest Positive Concentration
e. Analytical specificity:
Negative urine was spiked one at a time with the possible interfering substances with concentrations listed in the following table. Each urine sample was tested with 5 replicates of the ACON Urinalysis Reagent Strips. Results were read by comparing color reaction to the color blocks on the canister label according to the Instructions on the package insert. The following potentially interfering substances at concentrations indicated were added to the urine:
11
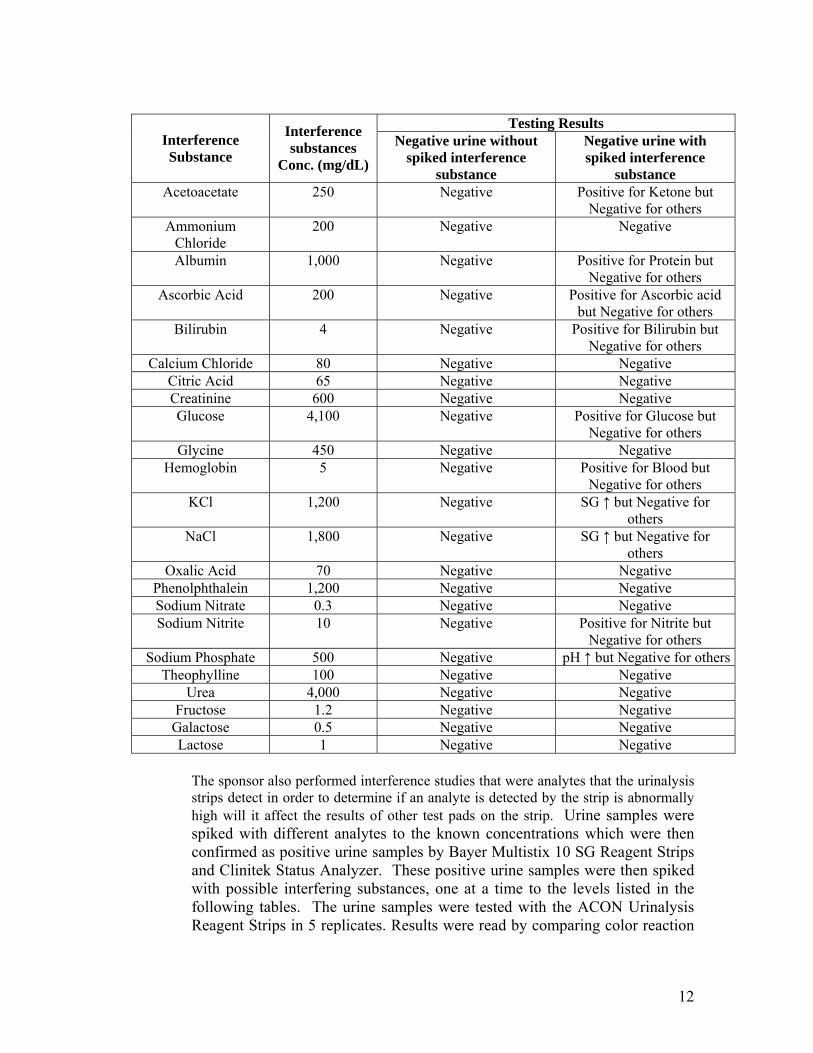
Testing Results
Interference Substance
Interference substances
Conc. (mg/dL)
Negative urine without spiked interference
substance
Negative urine with spiked interference
substance Acetoacetate 250 Negative Positive for Ketone but
Negative for others Ammonium
Chloride 200 Negative Negative
Albumin 1,000 Negative Positive for Protein but Negative for others
Ascorbic Acid 200 Negative Positive for Ascorbic acid but Negative for others
Bilirubin 4 Negative Positive for Bilirubin but Negative for others
Calcium Chloride 80 Negative Negative Citric Acid 65 Negative Negative Creatinine 600 Negative Negative Glucose 4,100 Negative Positive for Glucose but
Negative for others Glycine 450 Negative Negative
Hemoglobin 5 Negative Positive for Blood but Negative for others
KCl 1,200 Negative SG ↑ but Negative for others
NaCl 1,800 Negative SG ↑ but Negative for others
Oxalic Acid 70 Negative Negative Phenolphthalein 1,200 Negative Negative Sodium Nitrate 0.3 Negative Negative Sodium Nitrite 10 Negative Positive for Nitrite but
Negative for others Sodium Phosphate 500 Negative pH ↑ but Negative for others
Theophylline 100 Negative Negative Urea 4,000 Negative Negative
Fructose 1.2 Negative Negative Galactose 0.5 Negative Negative Lactose 1 Negative Negative
The sponsor also performed interference studies that were analytes that the urinalysis strips detect in order to determine if an analyte is detected by the strip is abnormally high will it affect the results of other test pads on the strip. Urine samples were spiked with different analytes to the known concentrations which were then confirmed as positive urine samples by Bayer Multistix 10 SG Reagent Strips and Clinitek Status Analyzer. These positive urine samples were then spiked with possible interfering substances, one at a time to the levels listed in the following tables. The urine samples were tested with the ACON Urinalysis Reagent Strips in 5 replicates. Results were read by comparing color reaction
12

to the color blocks on the canister label according to the Instructions on the package insert. Acceptance Criteria The reagent pad must produce expected color-reaction when testing with the corresponding spiked samples.
The Effect of Ascorbic Acid on ACON Glucose Reagent Strip Glucose Concentration (mg/dL)
Test Results on 5 Replicates
Ascorbic Acid
Concentration
(mg/dL) Negative 100 250 500 1,000
0 N 100* 250 500 1,000
10 N 100 250 500 1,000
25 N N(1)** -100(4)** 250 500 1,000
30 N N 100 500 1,000
* 5 Replicates
** 1 tested at negative level and 4 tested at 100 mg/dL level
Ascorbic acid concentrations of 25 mg/dL or greater may reduce the sensitivity of the test.
The Effect of Acetoacetic Acid on ACON Glucose Reagent Strip Glucose Concentration (mg/dL)
Test Results on 5 Replicates
Acetoacetic Acid
Concentration
(mg/dL) Negative 100 250 500 1,000 2,000
0 N 100 250 500 1,000 2,000
80 N 100 250 500 1,000 2,000
100 N N(1) -100(4) 100 250 500 1,000
120 N N 100 250 500 1,000
140 N N 100 250 500 1,000
Acetoacetic acid concentration of 100 mg/dL or higher decreases the sensitivity of the test.
13

The Effect of Specific Gravity on ACON Glucose Reagent Strip Glucose Concentration (mg/dL) Specific
Gravity Test Results on 5 Replicates
Negative 100 250 500 1,000 2,000
1.005 N 100 250 500 1,000 2,000
1.010 N 100 250 500 1,000 2,000
1.015 N 100 250 500 1,000 2,000
1.020 N 100 250 500 1,000 2,000
1.025 N N(1) -100(4) 100 500 1,000 2,000
1.030 N N(1) -100(4) 100 500 1,000 2,000
As the Specific Gravity increases to 1.025, the sensitivity of the Glucose reagent pad decreases.
The Effect of Specific Gravity on ACON Blood Reagent Strip Blood Concentration (Cells/uL)
Test Results on 5 Replicates Specific
Gravity Negative
10
(Trace)
25
(Small)
80
(Mod)
200
(Large)
1.005 N 10 25 80 200
1.010 N 10 25 80 200
1.015 N 10 25 80 200
1.020 N 10 25 80 200
1.025 N 10 25 80 200
1.030 N 10 25 80 200
Specific Gravity does not influence the sensitivity of the blood reagent pad.
14
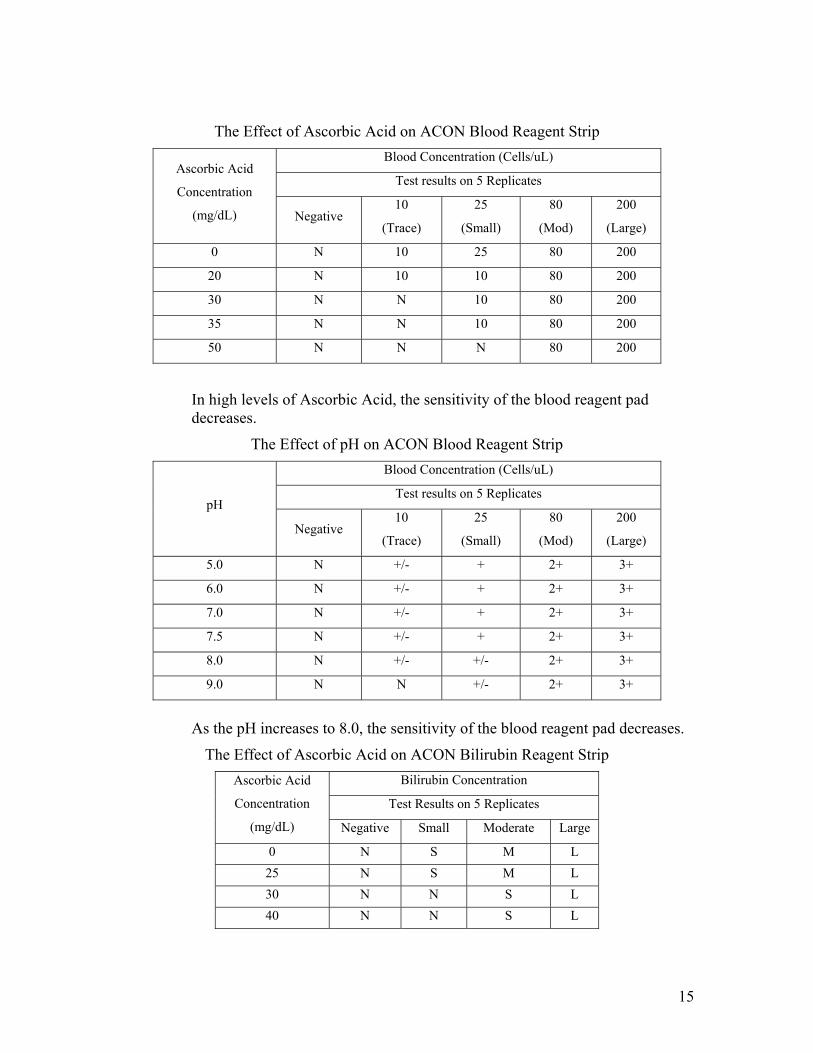
The Effect of Ascorbic Acid on ACON Blood Reagent Strip Blood Concentration (Cells/uL)
Test results on 5 Replicates Ascorbic Acid
Concentration
(mg/dL) Negative 10
(Trace)
25
(Small)
80
(Mod)
200
(Large)
0 N 10 25 80 200
20 N 10 10 80 200
30 N N 10 80 200
35 N N 10 80 200
50 N N N 80 200
In high levels of Ascorbic Acid, the sensitivity of the blood reagent pad decreases.
The Effect of pH on ACON Blood Reagent Strip Blood Concentration (Cells/uL)
Test results on 5 Replicates pH
Negative 10
(Trace)
25
(Small)
80
(Mod)
200
(Large)
5.0 N +/- + 2+ 3+
6.0 N +/- + 2+ 3+
7.0 N +/- + 2+ 3+
7.5 N +/- + 2+ 3+
8.0 N +/- +/- 2+ 3+
9.0 N N +/- 2+ 3+
As the pH increases to 8.0, the sensitivity of the blood reagent pad decreases.
The Effect of Ascorbic Acid on ACON Bilirubin Reagent Strip Bilirubin Concentration
Test Results on 5 Replicates
Ascorbic Acid
Concentration
(mg/dL) Negative Small Moderate Large
0 N S M L 25 N S M L 30 N N S L 40 N N S L
15

As the Ascorbic Acid increases to 30 mg/dL, the sensitivity of the bilirubin reagent pad decreases.
The Effect of Acetone on ACON Ketone Reagent Strip Ketone Acetone
Concentration (mg/dL) Test Results on 5 Replicates 100 No Color Changed on Strips
500 No Color Changed on Strips
10,000 No Color Changed on Strips
Acetone does not influence the Ketone reagent pad.
The Effect of Specific Gravity on ACON Nitrite Reagent Strip Nitrite Concentration (mg/dL)
Test Results on 5 Replicates Standard Material
Specific Gravity Negative 0.05 0.1 1.0
1.005 N P P P 1.010 N P P P 1.015 N P P P 1.020 N P P P 1.025 N P P P 1.030 N N P P
As the Specific Gravity increases to 1.030 or over, the sensitivity (accuracy) of the Nitrite reagent pad decreases.
The Effect of Ascorbic Acid on ACON Nitrite Reagent Strip Nitrite Concentration (mg/dL)
Test Results on 5 Replicates Ascorbic Acid
(mg/dL) Negative 0.05 0.1 0.5
0 N P P P 25 N P P P 30 N N P P 35 N N P P
In high levels of Ascorbic acid, the sensitivity of the Nitrite reagent pad decreases.
16

The Effect of pH on ACON Nitrite Reagent Strip Nitrite Concentration (mg/dL)
Test Results on 5 Replicates pH
Negative 0.05 0.1 1.0
5.0 N P P P 6.0 N P P P 7.0 N P P P 7.5 N P P P 8.0 N P P P 9.0 N P P P
The pH value does not influence the sensitivity of the Nitrite reagent pad.
The Effect of Specific Gravity on ACON Protein Reagent Strip Protein Concentration (mg/dL)
Test Results on 5 Replicates Specific
Gravity Negative 15 30 100 300 2,000
1.005 N 15 30 100 300 2,000
1.010 N 15 30 100 300 2,000
1.015 N 15 30 100 300 2,000
1.020 N 15 30 100 300 2,000
1.025 N N 30 100 300 2,000
1.030 N N 30 100 300 2,000
As the Specific Gravity increases to 1.025, the sensitivity of the Protein reagent pad decreases.
17
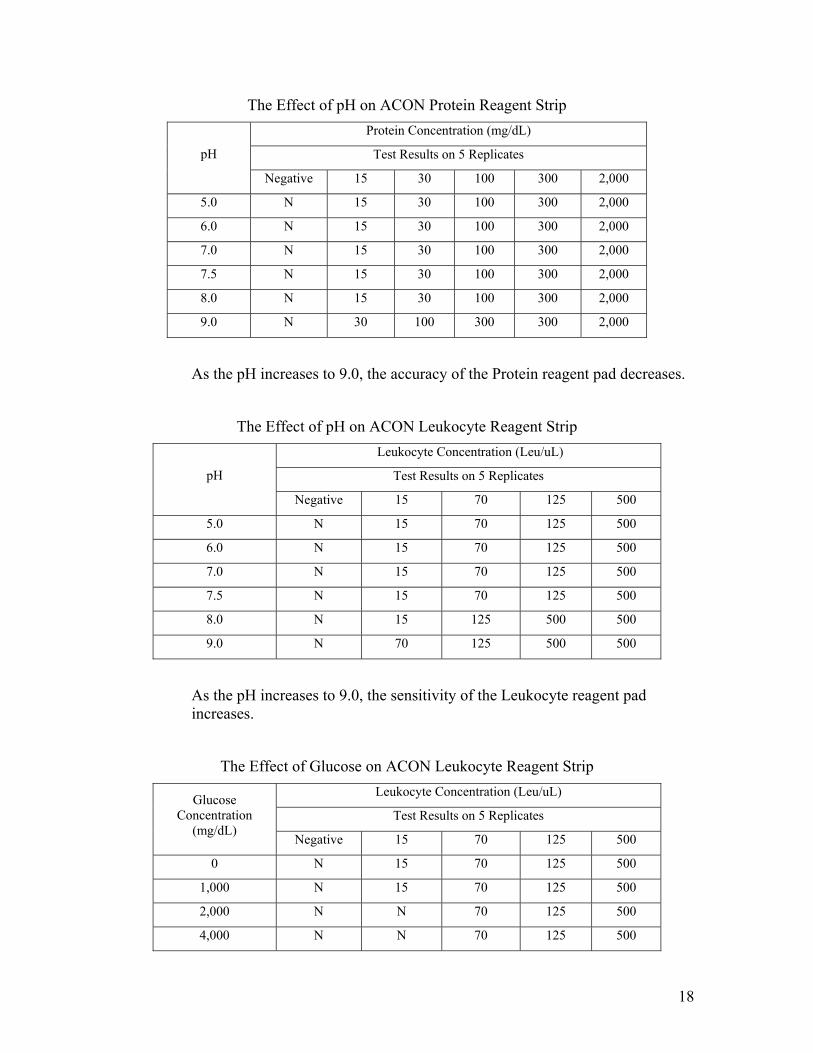
The Effect of pH on ACON Protein Reagent Strip Protein Concentration (mg/dL)
Test Results on 5 Replicates pH
Negative 15 30 100 300 2,000
5.0 N 15 30 100 300 2,000
6.0 N 15 30 100 300 2,000
7.0 N 15 30 100 300 2,000
7.5 N 15 30 100 300 2,000
8.0 N 15 30 100 300 2,000
9.0 N 30 100 300 300 2,000
As the pH increases to 9.0, the accuracy of the Protein reagent pad decreases.
The Effect of pH on ACON Leukocyte Reagent Strip Leukocyte Concentration (Leu/uL)
Test Results on 5 Replicates pH
Negative 15 70 125 500
5.0 N 15 70 125 500
6.0 N 15 70 125 500
7.0 N 15 70 125 500
7.5 N 15 70 125 500
8.0 N 15 125 500 500
9.0 N 70 125 500 500
As the pH increases to 9.0, the sensitivity of the Leukocyte reagent pad increases.
The Effect of Glucose on ACON Leukocyte Reagent Strip Leukocyte Concentration (Leu/uL)
Test Results on 5 Replicates Glucose
Concentration (mg/dL)
Negative 15 70 125 500
0 N 15 70 125 500
1,000 N 15 70 125 500
2,000 N N 70 125 500
4,000 N N 70 125 500
18

As the concentration of Glucose increases to 2,000 mg/dL, the sensitivity of the Leukocyte reagent pad decreases.
The Effect of Specific Gravity on ACON Leukocyte Reagent Strip Leukocyte Concentration (Leu/uL)
Test Results on 5 Replicates Specific Gravity
Negative 15 70 125 500
1.005 N 15 70 125 500
1.010 N 15 70 125 500
1.015 N 15 70 125 500
1.020 N 15 70 125 500
1.025 N N 70 125 500
1.030 N N 15 125 500
As the specific gravity increases to 1.025 and over, the accuracy of the Leukocyte reagent pad decreases.
The effect of Protein (Human Albumin) on ACON Leukocyte Reagent Strip Leukocyte Concentration (Leu/uL)
Test Results on 5 Replicates Human Albumin
Concentration
(mg/dL) Negative 15 75 125 500
0 Neg 15 75 125 500
500 Neg 15 75 125 500
1,000 Neg Neg 75 125 500
1,500 Neg Neg 75 125 500
As protein concentration increases to 1,000 mg/dL, the sensitivity of the Leukocyte reagent pad decreases.
19

The Effect of Nitrite on ACON Urobilinogen Reagent Strip Urobilinogen Concentration (mg/dL )
Test Results on 5 Replicates Nitrite Concentration
(mg/dL) 0.2 1.0 2.0 4.0
8.0
12
0 0.2 1.0 2.0 4.0 8.0 12
1 0.2 1.0 2.0 4.0 8.0 12
10 0.2 1.0 2.0 4.0 8.0 12
20 0.2 1.0 2.0 4.0 8.0 12
The concentrations of Nitrite tested do not influence the accuracy of the Leukocyte reagent pad.
The Effect of pH on ACON Specific Gravity Reagent Strip Specific Gravity
Test Results on 5 Replicates pH
1.000 1.005 1.010 1.015 1.020 1.025 1.030
4.5 1.005 1.010 1.015 1.020 1.025 1.030 1.030
5 1.000 1.005 1.010 1.015 1.020 1.025 1.030
6 1.000 1.005 1.010 1.015 1.020 1.025 1.030
6.5 1.000 1.005 1.010 1.015 1.020 1.025 1.030
7 1.000 1.005 1.010 1.015 1.020 1.025 1.030
7.5 1.000 1.005 1.010 1.010 1.015 1.020 1.025
8 1.000 1.005 1.005 1.010 1.015 1.020 1.025
8.5 1.000 1.005 1.005 1.010 1.015 1.020 1.025
9 1.000 1.000 1.005 1.010 1.015 1.020 1.025
As the pH is higher than 7.5, the sensitivity of the Specific Gravity reagent pad decreases 0.005. As the pH is less than 5, the sensitivity of the Specific Gravity reagent pad increases 0.005.
20
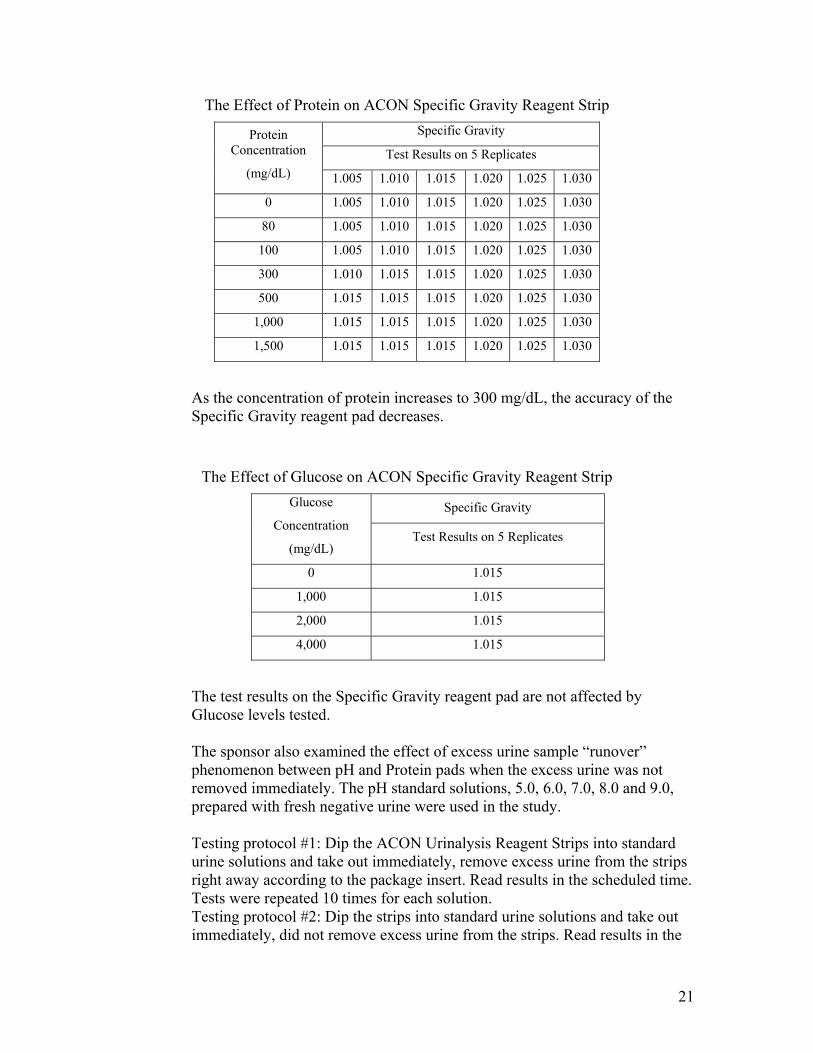
The Effect of Protein on ACON Specific Gravity Reagent Strip Specific Gravity
Test Results on 5 Replicates Protein
Concentration
(mg/dL) 1.005 1.010 1.015 1.020 1.025 1.030
0 1.005 1.010 1.015 1.020 1.025 1.030
80 1.005 1.010 1.015 1.020 1.025 1.030
100 1.005 1.010 1.015 1.020 1.025 1.030
300 1.010 1.015 1.015 1.020 1.025 1.030
500 1.015 1.015 1.015 1.020 1.025 1.030
1,000 1.015 1.015 1.015 1.020 1.025 1.030
1,500 1.015 1.015 1.015 1.020 1.025 1.030
As the concentration of protein increases to 300 mg/dL, the accuracy of the Specific Gravity reagent pad decreases.
The Effect of Glucose on ACON Specific Gravity Reagent Strip
Specific Gravity Glucose
Concentration
(mg/dL) Test Results on 5 Replicates
0 1.015
1,000 1.015
2,000 1.015
4,000 1.015
The test results on the Specific Gravity reagent pad are not affected by Glucose levels tested. The sponsor also examined the effect of excess urine sample “runover” phenomenon between pH and Protein pads when the excess urine was not removed immediately. The pH standard solutions, 5.0, 6.0, 7.0, 8.0 and 9.0, prepared with fresh negative urine were used in the study. Testing protocol #1: Dip the ACON Urinalysis Reagent Strips into standard urine solutions and take out immediately, remove excess urine from the strips right away according to the package insert. Read results in the scheduled time. Tests were repeated 10 times for each solution. Testing protocol #2: Dip the strips into standard urine solutions and take out immediately, did not remove excess urine from the strips. Read results in the
21

scheduled time. Tests were repeated 10 times for each solution. Testing was performed and results were determined visually by comparing the reaction colors with the color chart. Results were summarized in the following table.
Test Results with Excess Urine
Sample Removed Test Results without
Excess Urine Sample Removed pH
Expected Results Testing
Results Percent
Agreement Percent
DisagreementTesting Results
Percent Agreement
Percent Disagreement
5.0 5.0 10 @ 5.0
100% 0% 10 @ 5.0
100% 0%
6.0 6.0 10 @ 6.0
100% 0% 10 @ 6.0
100% 0%
7.0 7.0 10 @ 7.0
100% 0% 7 @ 7.0 3 @ 6.5
70% 30%
8.0 8.0
10 @ 8.0
100% 0% 6 @ 8.0 3 @ 7.0 1 @ 5.0
60% 40%
9.0 9.0
10 @9.0
100% 0% 7 @ 9.0 2 @ 8.0 1 @ 5.0
70% 30%
From the testing results, if the excess urine was not removed immediately, the edge of pH reagent pad became red as the result of the acidic component runover from the Protein pad onto the pH pad. The sponsor also indicates that urinalysis reagent strips may be affected by substances that cause abnormal urine color such as drugs containing azo dyes (e.g. Pyridium® , Azo Gantrisin® , Azo Gantanol® ), nitrofurantoin (Microdantin® , Furadantin®), and riboflavin. The color development on the test pad may be masked or a color reaction may be produced that could be interpreted as false results. In addition, the sensitivity of the Nitrite pad is reduced for urine specimens with highly buffered alkaline (e.g. Sodium Bicarbonate).
f. Assay cut-off: See Detection Limit above.
22

2. Comparison studies:
a. Method comparison with predicate device:
The sponsor performed a consumer study consisting of 125 professionals (the intended users of the device) to determine how results recoded by users correlated with results read on the predicate device. The study was performed at 3 different clinical sites, and the 125 samples were tested among the 3 sites, 72 samples at the first, 42 samples at the second, and 11 samples from the third. Results from 125 urine specimens were tested and recorded with the results outlined below.
Leukocyte
Observed Expected Comparison of Total Agreements Within +/- One Color Block # of Correct
Results Within +/- 1 Color Block
# of Correct Results Within +/-
1 Color Block ACON (Visual) vs. Bayer (Visual) 121 125 ACON (Visual) vs. Bayer (Instrument) 122 125 Bayer (Visual) vs. Bayer (Instrument) 122 125
Nitrite
Observed Expected Comparison of Total Agreements Within +/- One Color Block # of Correct
Results Within +/- 1 Color Block
# of Correct Results Within +/-
1 Color Block ACON (Visual) vs. Bayer (Visual) 124 125 ACON (Visual) vs. Bayer (Instrument) 125 125 Bayer (Visual) vs. Bayer (Instrument) 125 125
Urobilinogen
Observed Expected Comparison of Total Agreements Within +/- One Color Block # of Correct
Results Within +/- 1 Color Block
# of Correct Results Within +/-
1 Color Block ACON (Visual) vs. Bayer (Visual) 124 125 ACON (Visual) vs. Bayer (Instrument) 125 125 Bayer (Visual) vs. Bayer (Instrument) 123 125
23

Protein Observed Expected Comparison of Total Agreements
Within +/- One Color Block # of Correct Results Within
+/- 1 Color Block
# of Correct Results Within +/-
1 Color Block ACON (Visual) vs. Bayer (Visual) 118 125 ACON (Visual) vs. Bayer (Instrument) 110 125 Bayer (Visual) vs. Bayer (Instrument) 118 125
pH
Observed Expected Comparison of Total Agreements Within +/- One Color Block # of Correct
Results Within +/- 1 Color Block
# of Correct Results Within +/-
1 Color Block ACON (Visual) vs. Bayer (Visual) 103 125 ACON (Visual) vs. Bayer (Instrument) 89 125 Bayer (Visual) vs. Bayer (Instrument) 109 125
Blood
Observed Expected Comparison of Total Agreements Within +/- One Color Block # of Correct
Results Within +/- 1 Color Block
# of Correct Results Within +/-
1 Color Block ACON (Visual) vs. Bayer (Visual) 121 125 ACON (Visual) vs. Bayer (Instrument) 120 125 Bayer (Visual) vs. Bayer (Instrument) 118 125
Specific Gravity
Observed Expected Comparison of Total Agreements Within +/- One Color Block # of Correct
Results Within +/- 1 Color Block
# of Correct Results Within +/-
1 Color Block ACON (Visual) vs. Bayer (Visual) 117 125 ACON (Visual) vs. Bayer (Instrument) 98 125 Bayer (Visual) vs. Bayer (Instrument) 104 125
Ketone
Observed Expected Comparison of Total Agreements Within +/- One Color Block # of Correct
Results Within +/- 1 Color Block
# of Correct Results Within +/-
1 Color Block ACON (Visual) vs. Bayer (Visual) 125 125 ACON (Visual) vs. Bayer (Instrument) 123 125 Bayer (Visual) vs. Bayer (Instrument) 124 125
24

Bilirubin Observed Expected Comparison of Total Agreements
Within +/- One Color Block # of Correct Results Within
+/- 1 Color Block
# of Correct Results Within +/-
1 Color Block ACON (Visual) vs. Bayer (Visual) 124 125 ACON (Visual) vs. Bayer (Instrument) 123 125 Bayer (Visual) vs. Bayer (Instrument) 125 125
Glucose
Observed Expected Comparison of Total Agreements Within +/- One Color Block # of Correct
Results Within +/- 1 Color Block
# of Correct Results Within +/-
1 Color Block ACON (Visual) vs. Bayer (Visual) 124 125 ACON (Visual) vs. Bayer (Instrument) 124 125 Bayer (Visual) vs. Bayer (Instrument) 124 125
The sponsor also compared the pH of the ACON Urinalysis Reagent Strips to the Bayer Multistix 10 SG Urine Strips using two different methods:
MBrb
Method
ethod #1: Seven pH standard solutions (pH from 5.02 to 9.0) were tested with the ayer Multistix 10 SG Urine Strips and the ACON Urinalysis Reagent Strips,
espectively, according to their package inserts. Results are summarized in the table elow.
#1:
pH Meter 5.02 6.01 6.49 7.0 7.51 8.0 9.0 ACON 5.0 6.0 6.5 7.0 7.5 8.0 9.0 Bayer 5.0 6.0 7.0 7.0 8.0 8.0 8.5*
* Bayer color chart doesn’t have the color block for pH 9.0.
MU serts t
ethod #2: 47 clinical urine samples were tested with the Bayer Multistix 10 SG rine Strips, the ACON Urinalysis Reagent Strips according to their package in
ogether with a pH meter. Results are summarized in the table below.
25
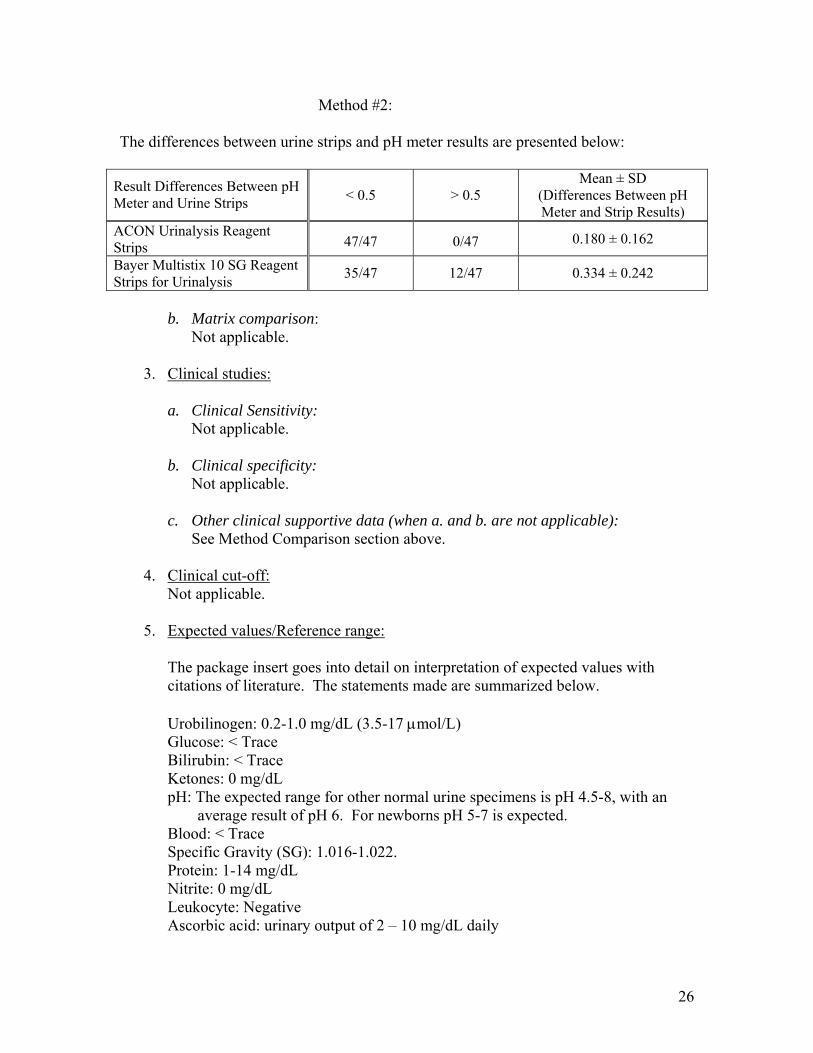
Method
#2:
The differences between urine strips and pH meter results are presented below:
Result Differences Between pH Meter and Urine Strips
< 0.5
> 0.5
Mean ± SD (Differences Between pH Meter and Strip Results)
ACON Urinalysis Reagent Strips 47/47 0/47 0.180 ± 0.162
Bayer Multistix 10 SG Reagent Strips for Urinalysis 35/47 12/47 0.334 ± 0.242
b. Matrix comparison:
Not applicable. 3. Clinical studies: a. Clinical Sensitivity:
Not applicable. b. Clinical specificity:
Not applicable.
c. Other clinical supportive data (when a. and b. are not applicable): See Method Comparison section above.
4. Clinical cut-off:
Not applicable.
5. Expected values/Reference range:
The package insert goes into detail on interpretation of expected values with citations of literature. The statements made are summarized below.
Urobilinogen: 0.2-1.0 mg/dL (3.5-17 μmol/L) Glucose: < Trace
Bilirubin: < Trace Ketones: 0 mg/dL pH: The expected range for other normal urine specimens is pH 4.5-8, with an
average result of pH 6. For newborns pH 5-7 is expected. Blood: < Trace Specific Gravity (SG): 1.016-1.022. Protein: 1-14 mg/dL Nitrite: 0 mg/dL Leukocyte: Negative Ascorbic acid: urinary output of 2 – 10 mg/dL daily
26
N. Proposed Labeling:
The labeling is sufficient and it satisfies the requirements of 21 CFR Part 809.10. O. Conclusion:
The submitted information in this premarket notification is complete and supports a substantial equivalence decision.
27