504
18
SCIENCE UNIT TESTS Louise Moore Revised by: Steve Sizmur Series Editor: Colin McCarty FREE SAMPLE COPY
Transcript of 504

SCIENCEUNIT TESTS
Louise MooreRevised by: Steve Sizmur
Series Editor: Colin McCarty
FREE SAMPLE COPY

Use the mark scheme and your own professional judgement to awardmarks. Do not award half marks. The tests can be swapped and markedby pupils – this is a good opportunity for peer assessment.The mark schemes include details of the National Curriculum level ofeach question.
Step 2 Mark the test
The tests are based on the content of the units of the QCA Scheme ofWork for Science. Explain to the class that they will take up to four unittests each year. The four unit tests are each worth ten marks and can beused as follows:• Test 1 – to assess prior learning of the topic;• Test 2 – to assess knowledge and understanding after teaching thetopic;
• Test 3 – to assess scientific enquiry skills after teaching the topic;• Test 4 – for end-of-year assessment.
This will give pupils the opportunity to show what they know and cando. The tests are designed to check understanding and results can beused to record and monitor progress throughout the year.
UNIT 3ATeeth and eating 3
10 Page 1 of 2 © Rising Stars UK Ltd 2008. You may photocopy this page.
☺��Name: Class: Date:
Total forthis page
1 mark
2
2 marks
3a
1 mark
1
1 mark
3b
How are these two teeth different?1
Ali and Carys test how different amounts of sugaraffect teeth. They put teeth into water and add sugar.
3
b) What thing do they change in their test?
a) Write down two things they must keep the same to help make theirtest fair.
i)
ii)
2g 3g 4g 5g 6g 7g 8g 9g 10g1g
What is the mass of this tooth?2
g
Step 1 Introduce the tests
Quick start guide to Rising Stars Assessment
Use the mark and level threshold tables to convert the pupil’s mark to asub-level. The final row in each table gives an overall sub-level for eachterm’s end-of-unit tests. If you have the CD-ROM version of ScienceUnit Tests, you can use the interactive Level Calculator to convert marksto levels automatically.The mark and level threshold pages also include a summary of thedistribution of marks and levels for each test.
Use a five-minute session with pupils to talk through the test and givethem the opportunity to make their own corrections. Identify strengthsand weaknesses and agree targets for learning.Encourage pupils to complete the pupil record sheets for each unit after each test. Pupils can keepthese sheets and use them to record their progress throughout the year.
Step 4 Feed back to the pupils
59
The marks and level thresholds for Year 3
Mark ranges for sub-levels for all six summative Test 4s (end-of-year tests)
2c 2b 2a 3c 3b 3a 4c 4b 4a
*15–19 20–25 26–30 31–35 36–41 42–46 47–51 52–57 58–60
* For marks between 8 and 14 award a level 1a
NC level Test 1 Test 2 Test 3 Test 412 3 3 5 23 7 7 3 64 2 2
Overall mark ranges for sub-levels for Tests 1-4Mark ranges for sub-levels for Test 1 (prior learning)
2c 2b 2a 3c 3b 3a 4c 4b 4a3 4 5 6 6 7 8 9 10
Mark ranges for sub-levels for Test 2 (knowledge and understanding)2c 2b 2a 3c 3b 3a 4c 4b 4a2 3 4 5 6 7 8 9 10
Mark ranges for sub-levels for Test 3 (mainly Sc1)2c 2b 2a 3c 3b 3a 4c 4b 4a3 4 5 6 6 7 8 9 10
Mark ranges for sub-levels for Test 4 (part of end-of-year summative Test 4s)2c 2b 2a 3c 3b 3a 4c 4b 4a2 3 4 5 6 7 8 9 10
Mark ranges for sub-levels for summative Tests 2 and 32c 2b 2a 3c 3b 3a 4c 4b 4a6 7–8 9–10 11 12–13 14–15 16 17–18 19–20
Topic A Teeth and eating
43
Teeth and eating3A 1 Mark Extra information
a suitable food added to each group, e.g.pasta or cakesfish or poultryany fruit
1 a
b
2
2
three groups for both markstwo groups 1 mark
three labels joined correctly 2 marksone label joined correctly 1 mark
an incisorcut and/or bitefront
2 111
a description involving another tooth growinga description making it clear that another toothwill not grow
3 ab
11
any one from:get rid of loose food; remove plaque;clean teeth; stop decay; prevent gum disease
4 1
food for growth food for activity
Teeth and eating3A 2 Mark Extra information
activitygrowth
1 11
accept keep our bodies goingaccept healing
any one from:brush your teeth; visit the dentist; floss;chew sugar-free gum
2 1
3 2 three labels joined correctly 2 marksone label joined correctly 1 mark
molarsincisors canines
5 2 three labels joined correctly 2 marksone label joined correctly 1 mark
eats only meateats only plants eats plants and meat
canine — tears or rips foodmolar — grinds foodincisor — cuts or bites food
4 abc
111
accept chews food
Answers and mark schemes for tests 1 – 3
Step 3 Generate a level

Introduction
Why use Rising Stars Assessment?Rising Stars Science Unit Tests have been developed to help teachers provide effective assessment forlearning in science and to deliver formative assessment of progress across Years 1 to 6. The tests areorganised by units, to reflect the structure of the QCA Scheme of Work for Science, and have been:
• designed by an assessment expert;• written by primary science assessment specialists;• checked by practising classroom teachers;• reviewed by a language expert to ensure accessibility of the language;• trialled with schools;• equated and standardised by an assessment expert to ensure reliability of the levels.
The tests are easy to use and mark. The scores for each test have been converted to sub-levels. Thesub-levels can then be used to investigate, monitor and report on the performance of every pupil by:
• plotting each pupil’s progress from term to term (summative assessment);• diagnosing each pupil’s strengths and weaknesses in each topic of the QCA Scheme of Work forScience (diagnostic assessment);
• informing your own assessment for learning strategy and supporting your lesson planning(formative assessment).
Combined, the results from the tests can be used to gather reliable evidence to assist target settingand predict a pupil’s future performance.
A National Curriculum level is given to each question in every test. The table below summarises therange of levels covered in each year. Further detail is provided on the mark schemes, the pupil recordsheets and the mark and level threshold section.
About the Science Unit TestsThe tests are designed to assess knowledge, understanding and skills taught through the units of theQCA Scheme of Work for Science. The tests for each unit are structured as follows:
• Test 1 – to assess prior learning;• Tests 2 and 3 – to assess knowledge and understanding after teaching the unit. Test 2 focuses onknowledge and understanding while Test 3 focuses on assessing scientific enquiry skills (Sc1);
• Test 4 – for end-of-year summative assessment.
Each test is worth ten marks. Further information about these tests is provided in the section How touse Science Unit Tests.
Determining prior learningTest 1 is designed for use before teaching a unit in KS2 so that the teacher is able to determine theprior knowledge and understanding of individuals and the class as a whole. The lessons that followmay then be focused on the areas the pupils have yet to learn. Much empirical and anecdotalevidence indicates that the time spent investigating prior learning is recovered through reducing theamount of time wasted on areas that are already understood.
Year 1 Year 2 Year 3 Year 4 Year 5 Year 6
1c–2b 1c–3a 2c–4b 2c–4a 3c–5c 3c–5a

Measuring summative and diagnostic progress for a topicAt the end of each unit, Tests 2 and 3 may be used to:• measure the ‘value added’ through the teaching of the topic;• determine the pupils’ progress and their sub-levels;• explore where further teaching may be required;• assist with target setting.
Summative assessment for the yearIf your school’s assessment policy values an overall test toward the end of the academic year, it isrecommended that all six Test 4s be used in order to obtain a summative level for the year. (If onlyfive topics have been covered, you may scale the marks to obtain a level.) We suggest they be given intwo sessions to prevent pupil fatigue.
How to use Science Unit TestsPreparation and timings1 Copy the required number of sheets to form the chosen assessment.
2 Ensure pupils are seated appropriately to prevent overlooking each other’s papers.
3 Pupils will need pens or pencils, rulers and erasers. Angle measurers should be available. Pupilsshould be encouraged to cross out answers rather than rub them out.
4 There are no time limits for the tests, but a pair (e.g. Tests 2 and 3) should take about 15-20minutes. Help with reading may be given using the same rules as when providing a reader with QCAKS2 tests (i.e. 25% extra time allowance for poor readers).
Supporting pupils during the testsBefore the test, explain to the pupils that the test is an opportunity to show what they know,understand and can do. They will not be asked questions about topics they have not yet been taught.
Many pupils will be able to work independently in the tests, with minimal support from the personadministering the tests (usually the teacher or teaching assistant). This person may encourage thepupils to ‘have a go’ at a question, or to move on to a fresh question if they appear to be stuck,ensuring that no pupil becomes distressed.
It is important that pupils receive appropriate support, but are not unfairly advantaged ordisadvantaged. Throughout the tests, therefore, the teacher may read, explain or sign to a pupil anyparts of the test that include instructions, for example, by demonstrating how to circle an answer.
With younger age groups you may also consider projecting the test onto a whiteboard to support awhole class or group to take the end-of-unit tests. You may choose to refer to the words on thewhiteboard and read them aloud so that pupils can follow them on the screen and on their own testpaper. They can then write their answers on their papers individually.
Marking the testUse the detailed mark scheme and your professional judgement to award marks. Do not award halfmarks. Note that a number of questions in each test may require pupils to do more than one thing forone mark. This reflects the style of the optional and end of Key Stage tests. Questions of this naturehave been included to familiarise pupils with the types of questions they will encounter in those tests.
Pupils should be encouraged to make their own corrections. In this way they will become more awareof their own strengths and weaknesses.
YEAR 3/INTRODUCTION
Use a five-minute feedback session with a pupil to help them review and transfer the information tothe pupil record sheets. This provides a useful opportunity to discuss progress and to explore any areasof uncertainty.
Obtaining levels and sub-levelsThe mark and level thresholds (pages 63–66) give the mark ranges for each sub-level for each test.The final row in each table gives an overall mark range of each sub-level for the Test 4s, which mayact as the summative record of progress in each topic.
The CD-ROM version of Science Unit Tests includes an interactive Level Calculator, which allows you toenter the raw score gained on each test by each pupil. The sub-levels are displayed including:• a sub-level for each test;• a level for the unit from the combined Tests 2 and 3;• an overall year level for the Test 4s.
The CD-ROM also includes a data exporter to allow you to export data from the Level Calculator. Thisenables you to manipulate test information easily and allows for analysis of the data by pupil, bygroup and by class.
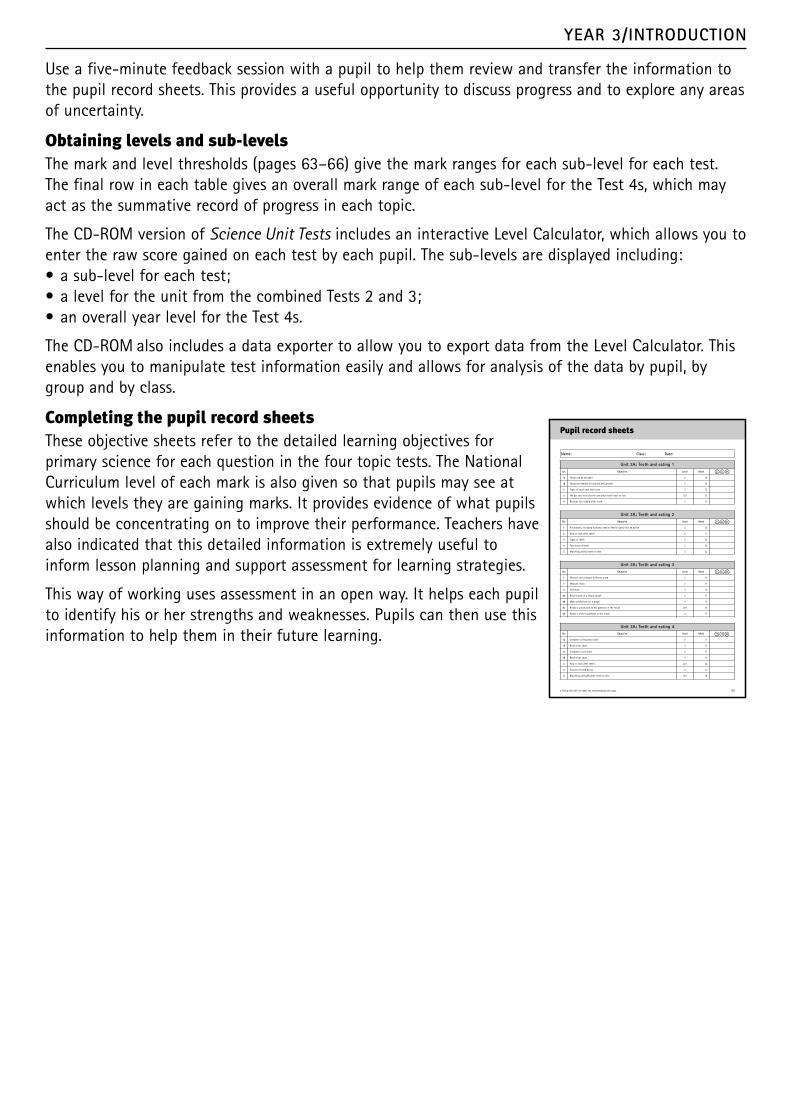
Completing the pupil record sheetsThese objective sheets refer to the detailed learning objectives forprimary science for each question in the four topic tests. The NationalCurriculum level of each mark is also given so that pupils may see atwhich levels they are gaining marks. It provides evidence of what pupilsshould be concentrating on to improve their performance. Teachers havealso indicated that this detailed information is extremely useful toinform lesson planning and support assessment for learning strategies.
This way of working uses assessment in an open way. It helps each pupilto identify his or her strengths and weaknesses. Pupils can then use thisinformation to help them in their future learning.
Unit 3A: Teeth and eating 1Qn Objective Level Mark
1a Foods can be grouped 2 /2
1b Foods are needed for activity and growth 3 /2
2 Types of teeth and their uses 3 /3
3 We get two sets of teeth and adult teeth have to last 2/3 /2
4 Reasons for looking after teeth 3 /1
Unit 3A: Teeth and eating 2Qn Objective Level Mark
1 All animals, including humans, need to feed to grow and be active 2 /2
2 How to look after teeth 2 /1
3 Types of teeth 3 /2
4 Functions of teeth 3 /3
5 Matching animal teeth to diet 3 /2
☺��
☺��
Unit 3A: Teeth and eating 3Qn Objective Level Mark
1 Observe and compare different teeth 2 /1
2 Measure mass 2 /1
3 Fair tests 3 /3
4a Read results in a simple graph 2 /1
4b Make predictions on a graph 3 /1
4c Relate a conclusion to the patterns in the result 3/4 /2
4d Relate a view to patterns in the result 4 /1
☺��
Unit 3A: Teeth and eating 4Qn Objective Level Mark
1a Complete a frequency table 2 /1
1b Read a bar chart 3 /1
1c Complete a bar chart 3 /1
1d Read a bar chart 3 /1
2 How to look after teeth 2/3 /2
3 Causes of tooth decay 4 /1
4 Matching animal/human teeth to diet 3/4 /3
☺��
Name: Class: Date:
Pupil record sheets
© Rising Stars UK Ltd 2008. You may photocopy this page. 55
YEAR 3/INTRODUCTION

UNIT 3ATeeth and eating 1
© Rising Stars UK Ltd 2008. You may photocopy this page.
☺��Name: Class: Date:
b) Amy is 27 years old. Her tooth is taken out.What happens in the space left in her mouth?
2 marks
1b
3 marks
2
2 marks
1a
1 mark
3b
1 mark
3a
1 mark
4
a) Write the name of one more food in each group beside the pictures.b) Join each group to a box to show if it is food for activity or foodfor growth.
1
2
a) Tom is 8 years old. His tooth falls out.What happens in the space left in his mouth?
3
Why should you clean your teeth?4
food for growth food for activity
This tooth is called a .
This tooth is used to .
In the bottom gum of the mouth, this tooth is
found at the .
potatoes
meat
apple
sausages
bread
bottom gum
/10Total forthis test

UNIT 3ATeeth and eating 2
© Rising Stars UK Ltd 2008. You may photocopy this page.
☺��Name: Class: Date:Name: Class: Date:
2 marks
1
1 mark
2
2 marks
3
2 marks
5
1 mark
4a
1 mark
4b
1 mark
4c
eats only plants eats plants and meat eats only meat
Give two reasons why we need food.
i)
ii)
1
A good way to look after your teeth is to
.
2
Join each group of teeth to the correct box.3
Match the sets of teeth to the food eaten.5
a) What is the job of a canine tooth?4
b) What is the job of a molar tooth?
c) What is the job of an incisor tooth?
incisorscanines molars
/10Total forthis test

UNIT 3ATeeth and eating 3
Page 1 of 2 © Rising Stars UK Ltd 2008. You may photocopy this page.
☺��Name: Class: Date:
Total forthis page
1 mark
2
2 marks
3a
1 mark
1
1 mark
3b
How are these two teeth different?1
Ali and Carys test how different amounts of sugaraffect teeth. They put teeth into water and add sugar.
3
b) What thing do they change in their test?
a) Write down two things they must keep the same to help make theirtest fair.
i)
ii)
2g 3g 4g 5g 6g 7g 8g 9g 10g1g
What is the mass of this tooth?2
g

UNIT 3ATeeth and eating 3
Total forthis test
© Rising Stars UK Ltd 2008. You may photocopy this page. Page 2 of 2
☺��
/10Total forthis test
1 mark
4a
1 mark
4b
2 marks
4c
1 mark
4d
Ali and Carys make a bar chart of their results.4
d) Ben says that eating a little bit of sugar is not bad for your teeth.Use the graph to explain if he is right or not.
c) What does the bar chart show?
a) How many spoons of sugar give a decay level of 8?
b) Draw the bar for the decay level for 3 spoons of sugar.
00 1 2 3 4 5
5
6
7
8
9
10
1
2
3
4
Spoons of sugar
How sugar affects teeth
Levelofdecay

© Rising Stars UK Ltd 2008. You may photocopy this page. Page 1 of 2
Total forthis page
☺��
Total forthis page
Name: Class: Date:
UNIT 3ATeeth and eating 4
1 mark
1a
Daniel finds out how many times the pupils in Class 3 clean their teetheach day.a) Fill in the empty boxes in Daniel’s table.
1
Number of times Tally Frequency1 5
2 11
3 6
4
From the bar chart:b) How many pupils clean their teeth once a day?
c) Fill in the missing bar for brushing twice a day.
d) How many pupils brush their teeth more thantwice a day?
He makes a bar chart of his findings.
0
0
2
4
6
8
10
1 2 3 4Number of times
How many times we brushour teeth each day
Num
berofpupils
1 mark
1d
1 mark
1b
1 mark
1c
12

Page 2 of 2 © Rising Stars UK Ltd 2008. You may photocopy this page.
☺��
UNIT 3ATeeth and eating 4
i) A lion tears off meat.
Lions need strong .
ii) A sheep bites off grass.
Sheep need very sharp .
b) Humans need all three kinds of teeth because
.
canines molars
a) Choose one word from the boxes to finish the two sentences.4
What substance causes tooth decay?3
incisors
Savas brushes his teeth in the morning and at night.Give two other ways he can look after his teeth.
i)
ii)
22 marks
2
1 mark
3
2 marks
4a
1 mark
4b
/10Total forthis test

Teeth and eating3A 1 Mark Extra information
a suitable food added to each group, e.g.pasta or cakesfish or poultryany fruit
1 a
b
2
2
three groups for both markstwo groups 1 mark
three labels joined correctly 2 marksone label joined correctly 1 mark
an incisorcut and/or bitefront
2 111
a description involving another tooth growinga description making it clear that another toothwill not grow
3 ab
11
any one from:get rid of loose food; remove plaque;clean teeth; stop decay; prevent gum disease
4 1
food for growth food for activity
Teeth and eating3A 2 Mark Extra information
activitygrowth
1 11
accept keep our bodies goingaccept healing
any one from:brush your teeth; visit the dentist; floss;chew sugar-free gum
2 1
3 2 three labels joined correctly 2 marksone label joined correctly 1 mark
molarsincisors canines
5 2 three labels joined correctly 2 marksone label joined correctly 1 mark
eats only meateats only plants eats plants and meat
canine — tears or rips foodmolar — grinds foodincisor — cuts or bites food
4 abc
111
accept chews food
Answers and mark schemes for Tests 1–3

Teeth and eating3A 3 Mark Extra information
a relevant difference, e.g. single or double root,single or double tooth, one twice as big asother, one flat on top, the other pointed
1 1
72 1
any two from:same amount of water or temperature or placeor time in waterthe amount of sugar
3 a
b
2
1 do not accept sugar on its own
five spoonfuls5the more sugar there is, the more decay thereis or the less sugar, the less decayyes — a small amount causes only a smallamount of decayno — even a small amount of sugar causesdecay
4 abc
d
112
1
a bar in the range 4 to 6accept a lot of sugar causes decay for1 markeither yes or no with appropriatejustification

Answers and mark schemes for Test 4s
both needed
Extra informationTeeth and eating3A 4 Mark
any two from:use sugarless gum; brush teeth after meals;floss; visit dentist regularly; eat less sugar
2 2
tally of IIII I, frequency of 25bar drawn to 118
1 abcd
1111
plaque or acid3 1 accept bacteria or sugar
caninesincisorswe have a varied diet, or eat several differentkinds of food
4 aiiib
111

The marks and level thresholds for Year 3
Mark ranges for sub-levels for all six summative Test 4s (end-of-year tests)
2c 2b 2a 3c 3b 3a 4c 4b 4a
*15–19 20–25 26–30 31–35 36–41 42–46 47–51 52–57 58–60
* For marks between 8 and 14 award a level 1a
NC level Test 1 Test 2 Test 3 Test 41 0 0 0 02 3 3 5 23 7 7 3 64 0 0 2 2
Overall mark ranges for sub-levels for Tests 1-4Mark ranges for sub-levels for Test 1 (prior learning)
2c 2b 2a 3c 3b 3a 4c 4b 4a3 4 5 6 6 7 8 9 10
Mark ranges for sub-levels for Test 2 (knowledge and understanding)2c 2b 2a 3c 3b 3a 4c 4b 4a2 3 4 5 6 7 8 9 10
Mark ranges for sub-levels for Test 3 (mainly Sc1)2c 2b 2a 3c 3b 3a 4c 4b 4a3 4 5 6 6 7 8 9 10
Mark ranges for sub-levels for Test 4 (part of end-of-year summative Test 4s)2c 2b 2a 3c 3b 3a 4c 4b 4a2 3 4 5 6 7 8 9 10
Mark ranges for sub-levels for summative Tests 2 and 32c 2b 2a 3c 3b 3a 4c 4b 4a6 7–8 9–10 11 12–13 14–15 16 17–18 19–20
Topic A Teeth and eating

Reliability and predictions
The first and most critical step in producing high-quality tests is to ensure that each questionaddresses the part of the topic that has been taught. Equally importantly, a reliable level needs to beattributed to every mark. Finally, every test must cover the content of the topic in a fair and balancedmanner. That is, it should contain some easy, some medium and some hard questions. It is thenpossible to work out a set of theoretical pass mark thresholds and these are discussed below. Theoryand practice must come together, however, and the Rising Stars tests need to be standardised andlinked to the National Curriculum levels established by QCA for the tests to be reliable and valid.These equated sub-levels are given on pages 59–62.
Standardising the testsRising Stars conducted research with a sample of schools in April, May and June 2008. Pupils sat anumber of the end-of-year tests in science (i.e. the Test 4s) of the topics they had been taught thatyear. The scores the pupils obtained on each test were used to generate an overall score – equivalentto taking all six end-of-year tests for the year.
In Year 6, this score was then standardised by equating to the results the pupils obtained in the KS2national tests.
In other years, the standardisation process involved averaging sub-levels obtained from the QCAoptional tests in mathematics, reading and writing and equating to them. (In Year 1, this was teacherassessment.)
This method was chosen to provide an externally validated test-based comparison for the levels. Inaddition, a check was made in each year of the average science teacher assessment to this averagelevel of the combined reading, writing and mathematics levels from the optional tests. See theAppendix for further details. There is a strong similarity, year on year, but as all teachers know, somechildren are more talented at science than English or mathematics. This difference will be highlightedby the teacher’s own assessment, which draws on a wider range of information and evidence.
The table below summarises the number of schools and pupils participating in the research.
Some of the schools were unable to complete the research or could only provide partial data.Consequently, the final sample was approximately one third of the above numbers in each year.
Teachers and pupils in the schools also commented on the language, illustrations and suitability of thequestions in the tests. A number of the questions were refined and improved thanks to this advice.
The equating data for the end-of-year testsThe raw scores from the schools for the end-of-year tests (Test 4s) were collated and equated to theaverage of the sub-levels and reported by the schools for the relevant year. These standardisingexercises were undertaken by an independent specialist, who for many years undertook similar workfor QCA.
Year 1 2 3 4 5 6
Number of pupils 238 256 303 301 386 483
Number of schools 8 9 8 7 8 10

Standardisation of tests – technical information
The equating data was used to validate an algorithm that could then be applied to Tests 1, 2 and 3.This algorithm is shown below. The algorithm works on the understanding that pupils will do better oneasier questions and score less well on harder ones.
• Questions at their working level – pupils get correct 50% of the marks available;• Questions at one level below their working level – pupils get correct 70% of the marks
available;• Questions at two levels below their working level – pupils get correct all of the marks available;• Questions at one level above their working level – pupils are able to get correct 20% of the
marks available;• Questions at two levels above their working level – are too hard for pupils and they get correct
none of the marks available.
By applying the above algorithm to the test scores, they can be translated into a consistent set ofindicative levels and sub-levels from a standardised theoretical base.
A word of warning
Level threshold information is provided for all tests, but it is recommended that at least two tests –e.g. Tests 2 and 3 – be used to ensure there is sufficient coverage and balance for a valid and reliablesummative level for the topic.
Appendix
Comparison of science levels and the average of reading, writing and mathematics
The table below is a comparison of the average science TA sub-levels with the average sub-level ofreading, writing and mathematics obtained from the QCA optional tests in Years 2 to 5 and betweenKS2 levels in Year 6. The sub-levels are expressed as decimals as follows:
• sub-level a being worth 0.7;• sub-level b being worth 0.3;• sub level c being the whole number for the level.
There is close agreement between the two sets of averages. The pattern also shows a steady increasein levels from Year 1 to Year 6, as might be expected. Note that the level for Year 1 is close to 2. Thissuggests rapid progress in Year 1 or pupils now start school with a significant amount of priorlearning.
YEAR 3/RELIABILITY AND PREDICTIONS
Year Average science TA sub-level Average English andmathematics sub-level
1 1.84 1.80
2 2.08 2.08
3 2.98 2.87
4 3.25 3.06
5 3.99 4.03
6 4.59 4.48

Percentiles and standard scores for end-of-year science Test 4s
The standard score and percentile table below shows the distribution of marks and provides relativeinformation about a pupil’s performance against his or her year group. Standard scores greater than115 are well above average, while those less than 85 are well below average.
This combined end-of-year Test 4s has a reasonably good correlation of pupils' levels with their testscore giving Pearson's r= 0.44 and a reasonably good correlation of pupils' science TA levels with theirtest score giving Pearson's r= 0.48. There was a fairly weak correlation between pupils' ages and theirtest score, giving Pearson's r=0.25.
Overall, the tests have a number of fairly easy marks. They also contain a significant proportion ofdemanding marks, however, which enable the tests to differentiate able pupils.
YEAR 3/RELIABILITY AND PREDICTIONS
Standard score 70 80 85 90 100 110 115 120 130
Percentile 2% 9% 16% 26% 50% 74% 84% 91% 98%
End-of-year testscore (out of 60marks)
10 17 18 24 30 36 37 42 48
0.00
1.00
2.00
3.00
4.00
5.00
0.00 10.00 20.00 30.00 40.00 50.00 60.00
QCAlevel
RS test mark
QCA level equated with RS test mark