5 Work and Retirement
58
235 * 5 Work and Retirement Ed. Agar Brugiavini 5.1 Labour Force Participation of the Elderly: Unused Capacity? 236 Agar Brugiavini, Enrica Croda, and Franco Mariuzzo 5.2 Public and Private Pension Claims 241 Johann K. Brunner, Cornelia Riess, and Rudolf Winter-Ebmer 5.3 Pathways to Retirement 246 Didier Blanchet, Agar Brugiavini, and Roberta Rainato 5.4 Work Disability and Health 253 Axel Börsch-Supan 5.5 Volunteer Work 259 Karsten Hank and Marcel Erlinghagen 5.6 How Do European Older Adults Use Their Time? 265 Enrica Croda and Jorge Gonzalez-Chapela Appendix Tables 272
Transcript of 5 Work and Retirement

235
*5 Work and Retirement Ed. Agar Brugiavini
5.1 Labour Force Participation of the Elderly: Unused Capacity? 236Agar Brugiavini, Enrica Croda, and Franco Mariuzzo
5.2 Public and Private Pension Claims 241Johann K. Brunner, Cornelia Riess, and Rudolf Winter-Ebmer
5.3 Pathways to Retirement 246Didier Blanchet, Agar Brugiavini, and Roberta Rainato
5.4 Work Disability and Health 253Axel Börsch-Supan
5.5 Volunteer Work 259Karsten Hank and Marcel Erlinghagen
5.6 How Do European Older Adults Use Their Time? 265Enrica Croda and Jorge Gonzalez-Chapela
Appendix Tables 272
236
Work and Retirement
5.1 Labour Force Participation of the Elderly: Unused Capacity?Agar Brugiavini, Enrica Croda, and Franco Mariuzzo
IntroductionEurope has witnessed an unprecedented increase in longevity and at the same time Eu-
ropeans excel in early retirement. Isn’t there a huge unused capacity for active work?Economic activities and retirement decisions of the older population in Europe occupy
much of the political debate around pensions reforms. The focus is on the possibility of increasing the working lives of current and future cohorts of workers, also in view of higher life expectancy, in order to provide adequate resources for retirement. The question rests on the opportunities to work longer offered by the institutional set up of the differ-ent countries (namely social security and pension arrangements) and on the ability that individuals have, given their health and social conditions, to supply labour in older ages. Economic research has explored the determinants of retirement (exits from the labour force) by stressing the role of economic incentives embedded in social security and pen-sion systems (Gruber and Wise 1999, 2004). To what extent social security and pension rules play a role in shaping labour supply decisions? Some workers may be leaving the labour market earlier than it would be desirable, given their health conditions and their socio-demographic characteristics, possibly because “pushed” by the generosity of the pension system.
Of course measuring “unused work capacity” is not an easy task, precisely because one needs information on the labour market position of individuals as well as their health conditions, social conditions and preferences for leisure. This contribution shows that the SHARE sample permits new views on these questions because all the relevant dimensions of the individual’s decision framework are jointly documented. A richer analysis of the responses of individuals to changes in one of these dimension (e.g. onset of a disease or a policy change) and a full description of the transition from work to retirement will be possible on a longitudinal sample.
Economic Activities of the Elderly: An OverviewOur analysis is mainly based on the self-reported current economic status of the respon-
dents, which is elicited by presenting a mutually exclusive set of answers. We distinguish six possible cases: worker, retired, unemployed, disabled, homemaker and “other”. This question is asked to all age-eligible individuals (including the first respondent’s spouse, ir-respective of age). In Figure 1 we focus on workers and retired individuals and group all others activities into “all other”: it is immediately apparent that work and retirement are the two prevalent economic activities in the SHARE sample.
Tables 5A.1 and 5A.2 (see the Appendix to this chapter) provide the (weighted) aver-age distribution of all the six categories with their standard errors, by country and also by country-gender. A first inspection of Tables 5A.1 and 5A.2 suggests a rather stable distribution of activities, with the proportion of workers ranging between 17% (Austria) and 38% (Switzerland), while retired individuals range between 34% (Spain) and 66% (Austria). However, a detailed cross-country and gender analysis unveils the heterogeneity possibly due to institutional differences and social norms (Table 5A.3). Other individual characteristics could explain the pattern in the labour force participation. Throughout this paper we focus on three relevant dimensions of variability in economic activities: age, gen-der and countries and then correlate with health conditions. In Austria, France, Italy and

237
Labour Force Participation of the Elderly: Unused Capacity?
Greece the percentage of men reporting themselves as retired is much higher than in other countries (58% and above), while in Sweden, Denmark and Switzerland we find a high percentage of workers. Furthermore, the Netherlands have a larger fraction of respondent reporting to be permanently sick or disabled than the other SHARE countries.
Figure 1 Self-reported economic activity by age
The prevalence of self-reported “working” is generally lower for women than for men, mostly because of the relatively large fraction of women who report their status as ‘home-maker’.
Figure 2 Distribution of economically active individuals by gender and age-class
By and large a general pattern emerges, whereby men have higher rates of labour market participation or retirement (the latter most likely from a previous job). It is highly probable
���
���
���
���
���
���
����������������������
��������������
�� �� �� �� ��
0.0
0.2
0.4
0.6
0.8
1.0
GRESITATCHFRNLDEDKSE
Age 50-54 Age 55-59 Age 60-64 Age 65+
Women working
����
0.0
0.2
0.4
0.6
0.8
1.0
GRESITATCHFRNLDEDKSE
Age 50-54 Age 55-59 Age 60-64 Age 65+
Men working

238
Work and Retirement
that “homemaker” women never had a labour market experience during their lifetime, in this sense the “unused labour capacity” interpretation does not apply to this group of the SHARE-population. Once we will have actual transitions we will be able to study the pathways from work to retirement, however the age distribution of work (and retirement) provided in Figure 2 and Table 5A.3 already suggests possible interpretations.
Less than 1 out of 10 men over 65 report themselves as working in all countries (except Switzerland), the age-work pattern of women is less clear-cut. Austrians and Italians, both men and women, seem to exit the labour force at earlier ages than other Europeans (pos-sibly moving into retirement). In particular 19% of Italian men between age 60 and age 64 define themselves as worker, compared to 60% of Swedish men. This evidence suggests that pension policies adopted by the different countries are an important determinant of labour force participation decisions at older ages.
Unused Labour Capacity, Full-Time Work and Part-Time Work
Figure 3 Distribution of self-reported and actual economic activity
Labour market participation rates are of extreme policy relevance in Europe and it is worth investigating labour supply behaviour in relation to actual current economic activity of the SHARE sample.
In fact, self-reported economic status could be affected by individual perceptions and also by institutional features of the pensions systems: for example in some countries indi-viduals may be allowed to work while collecting pension benefits (possibly subject to an earnings test) and report themselves retired even if working. To investigate this further we
���
���
���
���
���
��������������������
�������������������� ������ ���������������������
�������������������������
���
���
���
���
���
���
��������������������
�������������������� ������ ���������������������
�����������������������
239
Labour Force Participation of the Elderly: Unused Capacity?
make use of actual current work status (Figure 3) and also distinguish between full-time and part-time workers on the basis of hours worked (Table 5A.4). We define a full-time worker reporting working hours of 30 or more per week. Although this threshold may vary between countries when looking at actual contractual agreements, we find this defini-tion to be prevalent in the SHARE countries and strictly comparable with the ELSA study (English Longitudinal Study on Ageing). Figure 3 shows that on average there are more elderly people in paid work than self-reported, even when we restrict the condition to people with 15 hours or more of work.
Table A5.3 shows a related fact: the distribution of economically active individuals be-tween full-time and part-time for different age groups, across countries and disaggregated by gender. The distribution of types of economic activity within the active groups varies considerably by gender and also by age.
Before age 65, the proportion of economically active respondents working part-time is much higher for women than for men. However, the frequency of part-time work increas-es for both genders at older ages (after 65). Across countries, at all ages women are more likely than men to be working part-time. These findings suggest that in some countries partial or gradual retirement could be an important feature of the labour market.
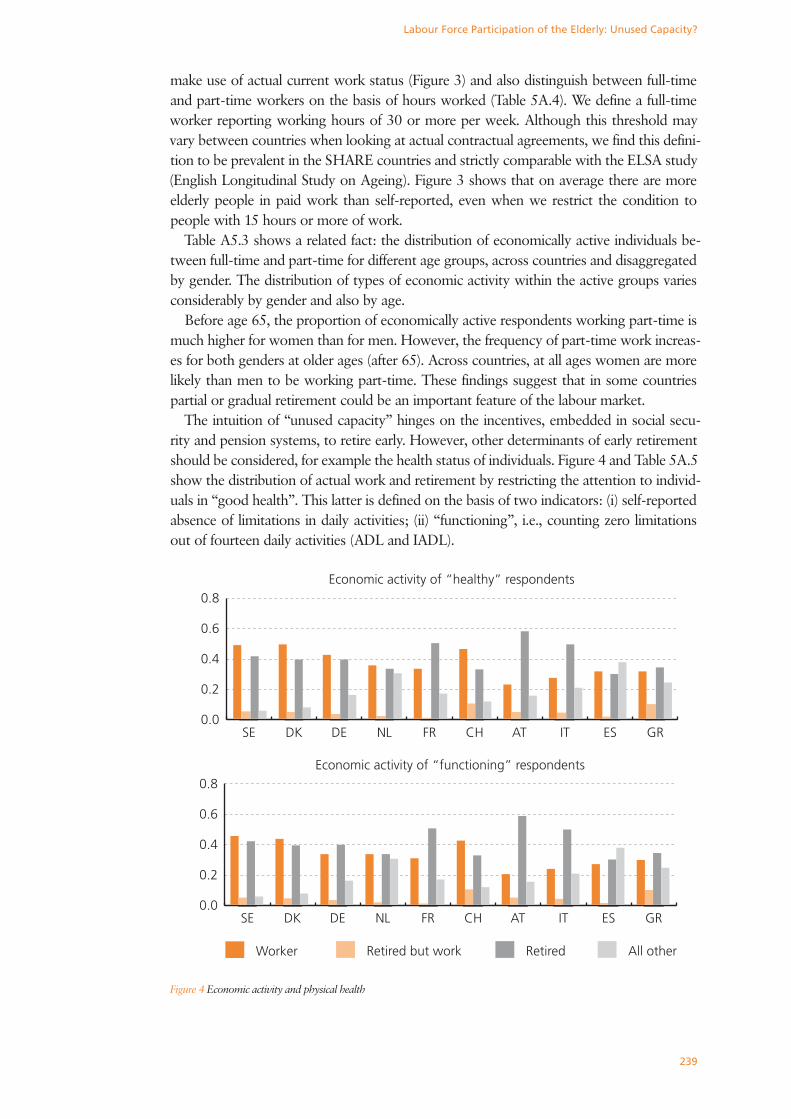
The intuition of “unused capacity” hinges on the incentives, embedded in social secu-rity and pension systems, to retire early. However, other determinants of early retirement should be considered, for example the health status of individuals. Figure 4 and Table 5A.5 show the distribution of actual work and retirement by restricting the attention to individ-uals in “good health”. This latter is defined on the basis of two indicators: (i) self-reported absence of limitations in daily activities; (ii) “functioning”, i.e., counting zero limitations out of fourteen daily activities (ADL and IADL).
Figure 4 Economic activity and physical health
���
���
���
���
���
��������������������
������ ���������������� ������� ���������
������������������������������������������
���
���
���
���
���
��������������������
������ ���������������� ������� ���������
����������������������������������������������

240
Work and Retirement
In order to make the comparison sharper we focus on three groups of individuals: those who are self-reported working and are actually currently active, those who are self-reported retired and have no hours of work (retired) and those who are self-reported retired but do some hours of work (retired but work). Results are obviously affected by the
“health” composition of the population in different countries, but there is a strikingly high frequency of people with no limitations (or who are “functioning”) who report themselves fully retired, in Austria, France and Italy. This is true even for people in early retirement (younger than 60). Further evidence in support of the cross-country variability in “unused labour capacity” can be found in Table 5A.6, which looks at the “main reason for retire-ment” for three age groups (age 55-59; 60-64 and 65+). While health-related problems are one of the reasons for retirement, there exists a substantial proportion of retirees who report eligibility for retirement, early- or pre-retirement as a cause, particularly in Germany, the Netherlands and France.
Conclusions
• Institutional differences in welfare systems clearly affect the distribution and the age pattern of participation to the labour market and of retirement. Countries where early retirement is allowed and/or is generous see a prevalence of early retirees (typically Southern countries, but also Austria and France).
• There is potentially huge unused labour capacity in countries such as Austria, Italy and France where “healthy” individuals are not in the labour force.
• Longitudinal data will allow us to further clarify the role of health and family condi-tions, as opposed to policy incentives, in shaping work and retirement decisions.
ReferencesGruber J. and D. Wise. 1999. Social Security and Retirement around the World. Chicago: The University of
Chicago Press.
———. 2004. Social Security Programs and Retirement around the World: Micro-Estimation. Chicago: The Uni-
versity of Chicago Press.
Marmot M., J. Banks, R. Blundell, C. Lessof, and J. Nazroo. 2003. Health, Wealth and the Lifestyle of the older
population in England. The 2002 ELSA. London: The Institute for Fiscal Studies.
241
Public and Private Pension Claims
5.2 Public and Private Pension ClaimsJohann K. Brunner, Cornelia Riess, and Rudolf Winter-Ebmer
IntroductionWhen assessing the sustainability of a country’s pension system, an important aspect is
to know to which extent it relies on public and private institutions, respectively. Generally, public pension systems are established on a pay-as-you-go basis, that is, what the currently active contribute is immediately transferred to the pensioners. As public pension systems are therefore directly exposed to the demographic development, they require appropriate decisions by politicians in order to maintain their fiscal stability. Private pension systems, on the other hand, can only be organised according to a fully-funded method: pensioners are entitled to the returns their prior contributions earned on the capital market. While there is no immediate dependency on the age composition of the population, there are other risks related to investments in the capital market. For this reason, an appropriate mix of the two systems might be preferable.
From the point of view of social policy it is interesting to know which demographic groups do in fact have access to the various forms of old-age provision. For example, one expects that low-educated persons rely on the public, mandatory system to a larger extent than high-educated, which means that when reforming the public pension system one has to observe carefully how the former group is affected. The SHARE survey, in particular the section on Employment and Pensions provides very valuable information on these is-sues. Retired respondents are asked from which sources they received (pension or transfer) income last year, which gives the desired information for retired persons, while active respondents are asked about entitlement to future pensions. There are also questions concerning the amount of pension payments and the first eligibility year. Combining the answers with other characteristics of the respondents, one obtains a comprehensive view on the structure of pension income of the elderly. It should be stressed that while some of these questions could also be answered in the new EU Statistics on Income and Living Conditions (SILC), information about future pension claims is unique to SHARE, along with a more detailed decomposition of private and occupational pensions.
North-South Gradient Among Private Pension ReceiptsCoverage by the public pension system is quite universal in all European countries
where the SHARE survey was carried out. There is either a general basic pension, to which almost every one living in the country is entitled to (as in the Nordic countries), or there is an occupation-related pension, which is mandatory for all employed or self-employed, as in the central and southern European countries. For this reason we mainly concentrate on the so-called second and third pillars of old-age provision. The second pillar comprises retirement income from private occupational pension arrangements, while the third pillar is usually defined as purely private old-age provision. Obviously, in a broad sense the latter could consist of all long-term investments people accumulate during their active period, which are available for consumption in the period of retirement. However, in this analysis we use a narrow definition and include only private individual retirement accounts and private life insurance.
One observes in Figure 1 that non-public pension claims are generally not wide-spread in Europe, moreover there are remarkable cross-country differences: in France, Spain and Greece (but also in Italy and Austria) only a negligible share of the retirees receives an oc-

242
Work and Retirement
cupational pension, while more than sixty percent of the Dutch and the Swedish pension-ers get one. The share is also above thirty percent in Switzerland and in Denmark while in Germany it is about one fifth of the pensioners. These findings can be compared with numbers reported in Whitehouse (2003) for the Netherlands (50%) and Germany (21% for men). Coverage by the third pillar is generally rather low in Europe: in nearly all countries less than ten percent of the retirees receive income from private accounts or life insurance, while in Sweden it is almost one fifth.
Table 5A.7 in the Appendix to this chapter shows the source of the retirement income for those pensioners who are covered by at least one public pension. Across European countries most retirees are covered by a regular old age pension, but a high proportion draws public early retirement pensions. This share clearly falls with educational level: for those with only primary education one third of males and one fourth of females have retired early, whereas these percentages are around 10% for those with tertiary education. Similarly, public disability or invalidity pension varies with education: due to more physi-cally demanding jobs, the drawing of disability pensions is more prevalent for persons with primary education only.
Table 5A.8 in the Appendix details past participation to occupational and private pen-sions by education. In all cases participation is higher for males - participation rates range between 10% higher to 100% higher than those observed for females. Both for occupa-tional pensions and private pensions, higher income individuals – which we proxy by higher education – tend to have better coverage.
A rather low coverage by the second and the third pillar becomes even more apparent when one considers the composition of the pension income of the retired, as is shown in Figure 2. The first pillar provides by far the largest part, only in the Netherlands it is as low as 56 percent; in Switzerland, Sweden and Denmark it is between 70 and 80 percent, while it is clearly over 90 percent in the other countries. The share of the third pillar is generally very low; only in the Netherlands it reaches more than five percent. As we defined the
Figure 1 Coverage of 2nd and 3rd Pension Pillar among retirees who have been in workforce before retirement.
2nd Pillar 3rd Pillar
0%
10%
20%
30%
40%
50%
60%
70%
80%
GRESITATCHFRNLDEDKSE

243
Public and Private Pension Claims
third pillar in a narrow way – including only payments from individual retirement accounts and life insurances –, our figures are significantly lower than those in e.g. Börsch-Supan and Brugiavini (2001), who include also all other asset income (including real estate in-come), net transfers received and earnings in the third pillar.
Table 5A.10 in the Appendix shows the year when the respective type of pension was received for the first time. While target retirement age is 65 years now almost everywhere in Europe, the effective retirement age deviates considerably in some of the countries: considering only old-age pensions, the eligibility age is indeed around the target year in Denmark (66.5 for males), the Netherlands, Switzerland and Sweden, but it is even below 60 for males and females in Austria and Italy, while it is around 60 in the other countries. US figures exhibit a significantly higher effective retirement age as compared to European countries: in the USA the overall median retirement age was 64.6 for males and 63.4 for females in 1999 (OECD 2001). The difference is particularly striking for large countries such as Germany, France and Italy. Only for four countries the effective retirement age is relatively close to the target; therefore both the early retirement schemes and the regular old-age pension system seem to encourage early exits from the labour force. Except for France, private occupational old-age pensions are received even earlier than public old-age pensions in almost all countries. Early retirement may well be regarded as the main prob-lem of the European pension systems: our findings suggest that there may be scope for reforming also occupational pensions.
Private Pension Claims Are Higher Among Non-Retirees
What kind of pensions are working individuals entitled to? In Figure 3 we concentrate on respondents in the workforce (employed, self-employed and unemployed). In all coun-
Figure 2 Composition of Pension-Income
1st Pillar Share 2nd Pillar Share 3rd Pillar Share
0%
10%
20%
30%
40%
50%
60%
70%
80%
90%
100%
GRESITATCHFRNLDEDKSE

244
Work and Retirement
tries – except Sweden –, the entitlement to occupational pensions (2nd pillar) is consid-erably high as compared to income sources of the already retired persons (this question did not apply to France because there is now a mandatory supplementary scheme). En-titlement to occupational pensions differs widely across Europe; it ranges between 2.4% in Greece, 10% in Austria and more than two thirds in Denmark and the Netherlands. Entitlement among working individuals differs most from pensioners’ entitlements in Den-mark, Italy and Switzerland. In many countries, occupational pensions used to be “direct-pension-guarantees”, where an employer promised to pay a supplementary pension once the worker reached retirement age (Kaar 2004). Recently, it has become more common to offer “portable” occupational pensions; workers also request negotiable pensions, e.g. in Austria and Germany. Sweden, Denmark and the Netherlands have a long-lasting tra-dition of collectively bargained occupational pensions and participation in these plans is obviously higher than elsewhere in Europe.
Entitlements to private pensions are lower than those reported from the OECD (White-house 2003): we find only 25% for Germany, and 68% and 51% for the Netherlands and Sweden, respectively, as opposed to 46 % for German workers and 90% for Dutch and Swedish workers estimated by the OECD. Figures from the European Commission (Kaar 2004) are very similar to ours in the case of Austria, Italy and Spain.
Given the close relation of occupational pensions to the employment status, it is in-teresting to see how the prevalence of these pensions varies by occupation and educa-tion (Appendix Table 5A.9). Across Europe, the entitlement to occupational pensions is somewhat higher for workers with higher education: for males the rates range between 23% for those with only primary education to some 34% for those with tertiary education. The range for females is between 13% and 25%. For both the very low and the very high educated, there is a marked gender difference in participation.
Similarly to what observed for occupational pensions, participation to private pensions
Figure 3 Entitlement to 2nd and 3rd Pension Pillar among non-retirees in workforce (employed, self-employed, unemployed)
2nd Pillar 3rd Pillar
0%
10%
20%
30%
40%
50%
60%
70%
80%
GRESITATCHFRNLDEDKSE
PERC
ENTA
GE
CO
VER
AG
E

245
Public and Private Pension Claims
(3rd pillar) is considerably higher for the generation of working individuals across Europe as compared to those already retired. Many more workers above age 50 have individual retirement accounts and/or life insurances than the older, retired, generation. Participation ranges from more than two thirds in Sweden, 53% in Switzerland to a low of 3% in Greece and close to 10 % in France, Italy and Spain. It is a well known fact that claiming and re-ceiving a pension may require a time-lag: with longitudinal data we will be able to further analyse participation rates by properly counting also those cases which might be currently recorded as neither collecting nor contributing. Table 5A.9 in the Appendix shows that also for private pensions there are significant socio-economic differences: less coverage for females and individuals with low-education.
ConclusionSHARE provides very valuable data on the current economic condition of the elderly.
This information is necessary to design pension reforms and evaluate their impact. We have shown that most retirees rely on public pensions in Europe. There are remarkable so-cio-economic differences in participation rates to private pensions: individuals from lower educational backgrounds have considerably less claims to both occupational and private pension. Hence future reforms, aimed at reducing public pensions, will have to take into account important redistributional issues. Similar considerations arise for attempts to re-form the retirement age in Europe: the SHARE-sample confirms that early retirement is widespread amongst the low-education groups. On the other hand, data from SHARE show that some countries have indeed managed to supplement the public pension system by occupational and private pension schemes, tackling at the same time the early retire-ment problem through this route.
ReferencesBörsch-Supan, A. and A. Brugiavini. 2001. Savings: The Policy Debate in Europe. Oxford Review of Economic
Policy 17 (1):116-43.
Kaar, R. v. h. 2004. Occupational pensions and industrial relations. mimeo, University of Amsterdam, Faculty
of Law.
OECD. 2001. Ageing and income. Financial resources and retirement in 9 OECD countries.
Whitehouse, E. 2003. The value of pension entitlements: a model of nine OECD countries. OECD social,
employment and migration working papers no. 9.
246
Work and Retirement
5.3 Pathways to RetirementDidier Blanchet, Agar Brugiavini, and Roberta Rainato
A common view about retirement is to describe it as a direct transition between a situ-ation of full employment and a situation where the individual is fully inactive and where most of his resources consist of pension benefits. Over the last decades, this description has become increasingly less relevant (Kohli et al. 1991). In response to labour market ri-gidities, many European countries have allowed and sometimes encouraged various forms of early exit from the labour force, before access to normal retirement (soft “landing” plans). The main tools for doing so have been unemployment insurance, an extended access to sickness or disability benefits, or the development of specific pre-retirement schemes. As a consequence, a wedge has been created between employment and retire-ment. But there also exist some opposite cases where employment and retirement move together: retirement is gradual and workers combine labour income and pension benefits for a given period of time.
The patterns of transition to retirement have already been largely documented using various data sources, but the SHARE survey offers many interesting perspectives for the study of institutional and individual determinants of transitions through these different routes. Moving to a panel survey will increase further these possibilities, since it will allow a dynamic view of these transition processes. At this stage, this contribution will restrict itself to cross-sectional insights about the prevalence of these different patterns of transi-tion across the 10 participating countries. It will be based on a labour-market self-reported status.
Unemployment and Disability as Forms of Pre-RetirementContribution 5.1 has already documented cross-country differences concerning age at
exits from employment. The question here is to assess the intermediate role played, in the different countries, by non standard—but sometimes dominant—forms of transitions between employment and the full status of retiree. These routes are generally classified in three main categories:
Unemployment: people are laid-off from their last job before being able to benefit from normal pension benefits, and are therefore forced to spend some time in unemployment before being effectively retired.
Sickness or disability insurance: stricto sensu, this route should only apply to people for whom early exits from the labour force result from objective health problems. But some countries also tended to use this category as a device for managing general cases of “un-easiness” about work or even obsolescence of the worker, due for instance to the fact that the skills of an old worker are no more recognised or demanded by employers.
Pre-retirement schemes: these allow early exits from the labour force, at times they are sector-specific (for managing large scale redundancies in some declining industries), but in most cases these are nation-wide programs.
The quantitative importance of these various routes displays strong variation across countries, in particular because of institutional differences. More detailed descriptions of these institutional arrangements can be found in Blöndal and Scarpetta (1998) or the na-tional chapters in Gruber and Wise (2004). Depending on national arrangements, access to either of these routes may be easy or strongly limited, or it could be designed to be more attractive or less attractive to the retiree. Labour demand also plays a crucial role in these patterns. It will be one strength of the SHARE data to allow new and detailed analysis
247
Pathways to Retirement
of the way institutional settings interact with individual or industry-level factors for ex-plaining cross national variations in the development of these routes. In this contribution, the objective will be mainly descriptive, i.e. to examine the relative importance of these routes, as revealed by the self-reported activity status. How are these self-assessments collected by SHARE? Pre-retired respondents simply judge for themselves whether they are unemployed or retired. Alternatively question EP005 (which will be used throughout this contribution) explicitly offers the respondent the possibility of reporting oneself as
“permanently sick or disabled”.Our analysis will therefore concentrate on three situations: “unemployed”, “permanent-
ly sick or disabled” and “retired”. Figures 1 and 2 give the relative frequencies of these situ-ations, by age, for the 10 countries with available data, grouped in three regions: Northern Europe, Mid-European countries and Southern countries. Age profiles are given by single year-of-age groups, but they have been previously smoothed to remove most of the sam-pling variability that is observed in the raw data.
Among the three Northern countries the Dutch case provides a well-known illustration of the substitutability that can exist between the unemployment route and the disability route. The importance of disability for the Netherlands is a well-known and well-docu-mented aspect of the management of older workers in this country: it is correctly captured by SHARE. The percentage of disabled people in the 60-64 age group peaks to reach 15%, while the Dutch unemployment rate in this group is indeed quite low, one of the lowest in the entire SHARE-sample. We also observe that the share of disabled people drops from 15% to about 2% around 65, which is the age at which the majority of Dutch people, in-cluding the disabled, move to the “retired” category.
The situation in the two other Nordic countries will need further investigation: self-re-ported disability appears lower than disability measured from other sources (OECD 2004) or from answers collected elsewhere in the EP module, based on benefits received, as illustrated by contribution 5.4 in this chapter. Among the Mid-European countries, Swit-zerland appears to be the country where age at entry into retirement is the highest, and where both disability and unemployment almost never represent more than 5% of the age groups under investigation.

248
Work and Retirement
The three other Mid-European countries are less successful in this respect. They sig-nificantly differ in terms of profiles of final transitions into retirement. The ages at which about 50% of people from the SHARE sample self-report themselves as retired are around 58 in Austria, 59.5 in France, and 62 in Germany. Before these ages, the three countries exhibit relatively comparable unemployment or disability rates, with, for the three cases, a certain predominance of the unemployment route.
Figure 1 Pathways to retirement for Northern and Mid-Europe Countries
Distribution of Unemployed forNorthern Countries
00.
050.
10.
15
50 55 60 65 70 75 80
Age of Respondent
SE NL DK
00.
050.
10.
15
00.
050.
10.
15
Age of Respondent
Age of Respondent
Age of Respondent
SE NL DK
Distribution of Unemployed for Mid-Europe Countries
00.
050.
10.
15
50 55 60 65 70 75 80
AT DE FR CH
AT DE FR CH
Age of Respondent
AT DE FR CH
Distribution of Disabled forNorthern Countries
50 55 60 65 70 75 80
Age of Respondent
SE NL DK
Distribution of disabled forMid-Europe Countries
50 55 60 65 70 75 80
Distribution of Retirees forNorthern Countries
00.
20.
40.
60.
81
50 55 60 65 70 75 80
Distribution of Retirees forMid-Europe Countries
00.
20.
40.
60.
81
50 55 60 65 70 75 80

249
Pathways to Retirement
Pathways to retirement for Mediterranean countries, displayed in Figure 2, show less regularity. Here again the ages at transition to retirement differ significantly across coun-tries: the age at which 50% of the people report themselves as retired is 59 for Italy, 63 for Greece and 65 for Spain. Of course these ages cannot be exactly interpreted as median ages at retirement, since there exists a significant number of people who permanently report themselves as homemakers, essentially women, and for whom there is no notion of transition to retirement. This phenomenon is particularly pronounced for these three Mediterranean countries, and results from the low levels of women’s labour force partici-pation in these countries for the relevant cohorts. For instance, in Spain, the number of people reporting themselves as retired stays at 60% between ages 70 and 80. As a conse-quence, the “median” age at retirement should be better defined as the age at which one half of these 60% are retired, which takes us closer to 63. Nevertheless, it remains that transition into retirement occurs later in Spain than in Greece, and later in Greece than in Italy. A variety of patterns emerges for the three countries at younger ages. Disability if almost non existent for Italy and Greece before age 60. It remains so also after age 60 in Italy. This may be due to the prevalence of early retirement at a very young age: Italy displays low or very low rates for both unemployment and disability. In Greece, disability increases rather than decreasing at the age where people move into retirement: a puzzle
Figure 2 Pathways to retirement for Southern countries
Distribution of Unemployed forSouthern Countries
00.
050.
10.
15
50 55 60 65 70 75 80
Age of Respondent
GRES IT
GRES IT
GRES IT
Age of Respondent
Distribution of Disabled forSouthern Countries
00.
050.
10.
15
50 55 60 65 70 75 80
Age of Respondent
Distribution of Retirees forSouthern Countries
00.
20.
40.
60.
81
50 55 60 65 70 75 80
250
Work and Retirement
to be further investigated. Spain is atypical: the profile of unemployment is relatively flat before retirement age, and it drops after age 60, it is clearly the mirror image of exits into retirement.
Partial or Gradual RetirementPartial or gradual retirement corresponds to situations where an individual simultane-
ously receives earnings and draws resources from pension benefits, for example because the transition out of work is gradual. The worker might well go on working in the same firm or activity as he used to do, but for a reduced amount of hours, and the prevailing pension regulation allows him to cumulate his part-time earnings with partial pension benefits. Another possibility corresponds to the case of an individual who has fully retired from his initial activity, but who takes up a new job with a different employer (or becomes self-employed) and once again adds up the resulting earnings with pension benefits (pos-sibly means tested).
Promoting the development of such gradual retirement is one interesting policy option for countries facing the problem of an ageing population. Under the assumption that this additional labour supply does not crowd-out other groups of employees, it offers to work-ers flexibility without forcing them to spend additional years in full work. Besides reducing pension expenditures, further advantages may be felt by society as it is often the case that a sudden transition from work to full inactivity can alter health conditions and/or social relations of the elderly.
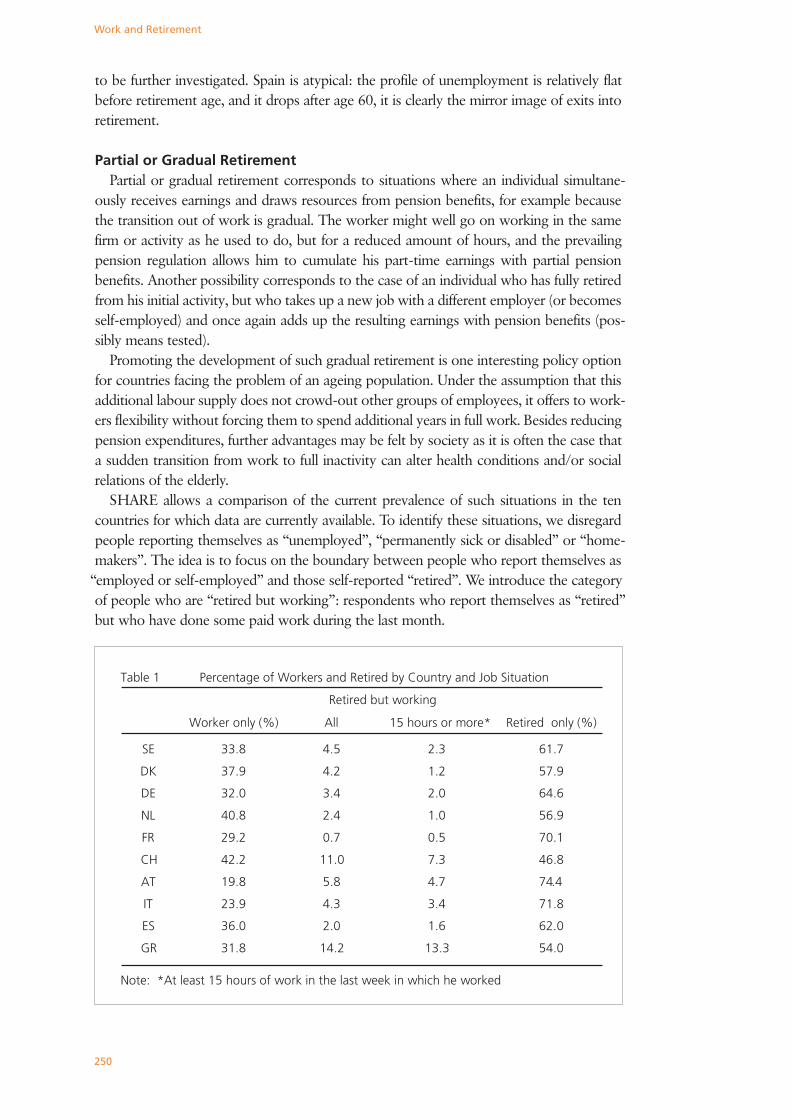
SHARE allows a comparison of the current prevalence of such situations in the ten countries for which data are currently available. To identify these situations, we disregard people reporting themselves as “unemployed”, “permanently sick or disabled” or “home-makers”. The idea is to focus on the boundary between people who report themselves as
“employed or self-employed” and those self-reported “retired”. We introduce the category of people who are “retired but working”: respondents who report themselves as “retired” but who have done some paid work during the last month.
Table 1 Percentage of Workers and Retired by Country and Job Situation
Retired but working
Worker only (%) All 15 hours or more* Retired only (%)
SE 33.8 4.5 2.3 61.7
DK 37.9 4.2 1.2 57.9
DE 32.0 3.4 2.0 64.6
NL 40.8 2.4 1.0 56.9
FR 29.2 0.7 0.5 70.1
CH 42.2 11.0 7.3 46.8
AT 19.8 5.8 4.7 74.4
IT 23.9 4.3 3.4 71.8
ES 36.0 2.0 1.6 62.0
GR 31.8 14.2 13.3 54.0
Note: *At least 15 hours of work in the last week in which he worked
251
Pathways to Retirement
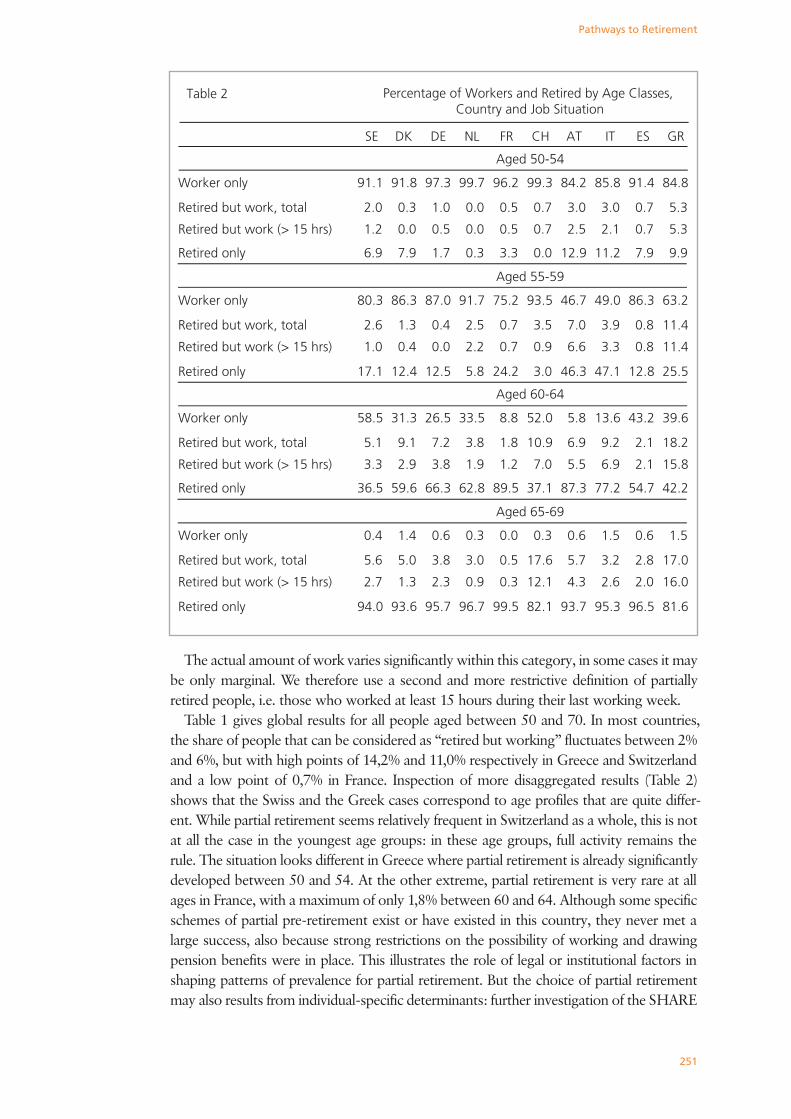
The actual amount of work varies significantly within this category, in some cases it may be only marginal. We therefore use a second and more restrictive definition of partially retired people, i.e. those who worked at least 15 hours during their last working week.
Table 1 gives global results for all people aged between 50 and 70. In most countries, the share of people that can be considered as “retired but working” fluctuates between 2% and 6%, but with high points of 14,2% and 11,0% respectively in Greece and Switzerland and a low point of 0,7% in France. Inspection of more disaggregated results (Table 2) shows that the Swiss and the Greek cases correspond to age profiles that are quite differ-ent. While partial retirement seems relatively frequent in Switzerland as a whole, this is not at all the case in the youngest age groups: in these age groups, full activity remains the rule. The situation looks different in Greece where partial retirement is already significantly developed between 50 and 54. At the other extreme, partial retirement is very rare at all ages in France, with a maximum of only 1,8% between 60 and 64. Although some specific schemes of partial pre-retirement exist or have existed in this country, they never met a large success, also because strong restrictions on the possibility of working and drawing pension benefits were in place. This illustrates the role of legal or institutional factors in shaping patterns of prevalence for partial retirement. But the choice of partial retirement may also results from individual-specific determinants: further investigation of the SHARE
Table 2 Percentage of Workers and Retired by Age Classes, Country and Job Situation
SE DK DE NL FR CH AT IT ES GR
Aged 50-54
Worker only 91.1 91.8 97.3 99.7 96.2 99.3 84.2 85.8 91.4 84.8
Retired but work, total 2.0 0.3 1.0 0.0 0.5 0.7 3.0 3.0 0.7 5.3
Retired but work (> 15 hrs) 1.2 0.0 0.5 0.0 0.5 0.7 2.5 2.1 0.7 5.3
Retired only 6.9 7.9 1.7 0.3 3.3 0.0 12.9 11.2 7.9 9.9
Aged 55-59
Worker only 80.3 86.3 87.0 91.7 75.2 93.5 46.7 49.0 86.3 63.2
Retired but work, total 2.6 1.3 0.4 2.5 0.7 3.5 7.0 3.9 0.8 11.4
Retired but work (> 15 hrs) 1.0 0.4 0.0 2.2 0.7 0.9 6.6 3.3 0.8 11.4
Retired only 17.1 12.4 12.5 5.8 24.2 3.0 46.3 47.1 12.8 25.5
Aged 60-64
Worker only 58.5 31.3 26.5 33.5 8.8 52.0 5.8 13.6 43.2 39.6
Retired but work, total 5.1 9.1 7.2 3.8 1.8 10.9 6.9 9.2 2.1 18.2
Retired but work (> 15 hrs) 3.3 2.9 3.8 1.9 1.2 7.0 5.5 6.9 2.1 15.8
Retired only 36.5 59.6 66.3 62.8 89.5 37.1 87.3 77.2 54.7 42.2
Aged 65-69
Worker only 0.4 1.4 0.6 0.3 0.0 0.3 0.6 1.5 0.6 1.5
Retired but work, total 5.6 5.0 3.8 3.0 0.5 17.6 5.7 3.2 2.8 17.0
Retired but work (> 15 hrs) 2.7 1.3 2.3 0.9 0.3 12.1 4.3 2.6 2.0 16.0
Retired only 94.0 93.6 95.7 96.7 99.5 82.1 93.7 95.3 96.5 81.6
252
Work and Retirement
data will allow us to unravel the interaction between these individual factors and the gen-eral institutional framework.
Conclusions
• The variety of transition paths to retirement across European countries is a well-known fact and SHARE will offer many possibilities for analysing both causes and conse-quences of transitions through these different paths at the micro level: how are these transitions related to institutions, to the characteristics of the last job, or to health be-fore retirement; what are there consequences for health after retirement, for standards of living and for general well-being?
• This contribution focuses on self-assessed labour market status. This could differ from the “activities” distribution based on sources of income (say). Cross-checking these answers, also available in SHARE, will help also clarifying the links between these perceptions and the actual labour market position of individuals. Having at hand com-parable data on transitions into retirement across Europe is a relevant achievement.
• Additional perspectives will be opened if panel data become available, since they will allow a full dynamic view of these transitions.
ReferencesBlöndal, S. and Scarpetta. 1998. The retirement decision in OECD countries. OECD Economics Department
Working Papers 202.
Gruber, J. and D. A. Wise. Eds. 2004. Social security programs and retirement around the world: micro-estima-
tion. Chicago: The University of Chicago Press
Kohli, M., M. Rein, A. M. Guillemard, and H. Van Gusteren. 1991. Time for retirement: comparative studies of
the decreasing age of exit from the labour force. Cambridge: Cambridge University Press.
OECD. 2003. Disability programmes in need for reform. Policy Brief, March.

253
Work Disability and Health
5.4 Work Disability and HealthAxel Börsch-Supan
Disability insurance—the insurance against the loss of the ability to work—is a substantial part of social security expenditures in almost all European countries. Disability insurance faces a trade-off like many elements of modern social security systems: One the one hand, disability insurance is a welcome and necessary part of the social safety net as it prevents income losses for those who loose their ability to work before the normal retirement age. One the other hand, disability insurance may be misused to serve as an early retirement route even if the normal ability to work is not affected at all. Understanding the trade-off between social safety provision and its misuse is important for the design of a modern social security system which maximizes social safety provision under increasingly tight financial budget constraints (Aarts et al. 1996).
A striking finding is the great variation across European countries in the number of per-sons who receive disability insurance benefits. This is shown in Figure 1.
Figure 1 Disability insurance enrolment in Europe, 2004
Note: Based on 17,731 individuals aged 50 through 65 interviewed in the SHARE 2004 survey. Weighted data. Standard errors are indicated. The data refers to disability insurance take up, unlike disability definitions according to health or labour force status used elsewhere in this book. Dis-ability insurance is: Sweden (SE): “förtidspension (sjukersättning)”, “yrkess-kadepension”, and “sjukbidrag”. Denmark (DK): ”offentlig sygedagpenge” and “offentlig førtidspension”. Germany (DE):
“Erwerbsminderungsrente“ and „Beamtenpension wegen Dienstunfähigkeit“. The Netherlands (NL): “WAO, Waz of invalidi-teitspensioen and Algemene bijstandswet (Abw), IOAW/IOAZ, aanvullende bijstandsuitkering, Toeslagenwet (TW)”. France (FR): “prestation publique d’invalidité (AAH, APA)”. Switzerland (CH): “Invalidenrente aus IV”, “assurance in-validité légale (AI)“ and “Rendità invalidità (AI)”. Austria (AT): “Staatliche Invaliditätspension“. Italy (IT): “assicurazione pubblica di disabi-lità (anche assegno di accompagnamento)” and “pen-sione pubblica di invalidità o di inabilità”. Spain (ES): “pensión pública contributiva y no con-tributiva de invalidez/incapacidad”. Greece (GR): „Ʃύνταξη αναπηρίας”.
We can distinguish four country groups. Very high enrolment rates exist in Denmark, Sweden and the Netherlands. Between 14 and 16 percent of individuals aged between 50 and 65 receive disability insurance benefits in this first group of countries. Lower, but still above average enrolment rates exist in the second country group consisting of Spain and Switzerland. Here the enrolment ranges from 7 to 9 percent. France, Germany and Italy, the third group, feature below average enrolment rates between 4 and 5 percent. Finally,
����������������������
��
��
��
��
���
���
���
���
���
���
254
Work and Retirement
in Austria and Greece less than 3 percent of individuals aged between 50 and 65 receive disability insur-ance benefits.
Potential Causes for Disability Insurance EnrolmentHow did these strikingly different enrolment rates emerge? There are three popular
explanations: demographics, health and institutions. First, while all Euro-pean countries are aging, the extent of population varies considerably. We have seen this in Chapter 2. The first explanation claims that a country with an older population also has a higher prevalence of disability insurance uptake. A second potential cause for the cross-national variation is differences in health status. Can the differences in physical and mental health which we have described in Chapter 3 explain why disability insurance is taken up so much more frequently in some countries than in others? Third and finally, recent studies such as Blöndal and Scarpetta (1998) based on the Gruber and Wise (1999) methodology have shown that public old age pension systems exert large incentive effects which, ac-cording to each country’s legislation, significantly increase the uptake of early retirement provisions. Do similar incentive effects arise also from disability insurance? Are differences in the European countries’ legislations causing different disability insurance take-up rates?
The SHARE data permit a new look at this question because they include a de-tailed description of which kind of public transfer payments each individual re-ceives and at the same time carry an extensive and comparable inventory of physical and mental health measures across ten European countries. Hence, the SHARE data provide a unique op-portunity to relate disability insurance enrolment of European individuals to their demo-graphic characteristics as well as their health status.
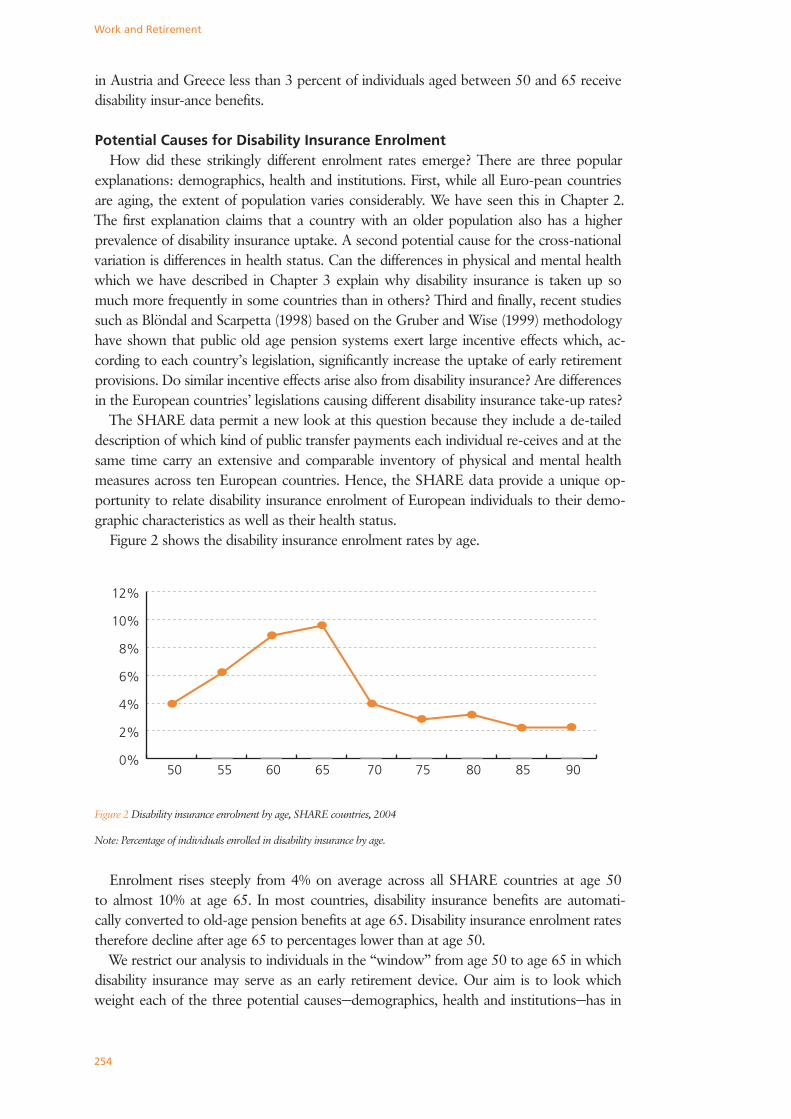
Figure 2 shows the disability insurance enrolment rates by age.
Figure 2 Disability insurance enrolment by age, SHARE countries, 2004
Note: Percentage of individuals enrolled in disability insurance by age.
Enrolment rises steeply from 4% on average across all SHARE countries at age 50 to almost 10% at age 65. In most countries, disability insurance benefits are automati-cally converted to old-age pension benefits at age 65. Disability insurance enrolment rates therefore decline after age 65 to percentages lower than at age 50.
We restrict our analysis to individuals in the “window” from age 50 to age 65 in which disability insurance may serve as an early retirement device. Our aim is to look which weight each of the three potential causes—demographics, health and institutions—has in
�� �� �� �� �� �� �� �� ����
��
��
��
��
���
���
255
Work Disability and Health
explaining disability enrolment in Europe. Our strategy is straightforward. We exploit the richness of the SHARE data to first relate individ-ual disability insurance enrolment prob-abilities to demographic characteristics and a broad set of health measures ranging from self-reported health to more objective measurements of the functional physical and mental health status. We then predict how enrolment rates would look like if demographics were equal across countries. If demographic differences were the main cause, enrolment rates should be very similar after taking demographic differences out. We then go through the same procedure for differences in health status. If enrolment rates are still very different after accounting for demographic and health differences, the third explanation—differences in the institutional regulations—is a likely cause.
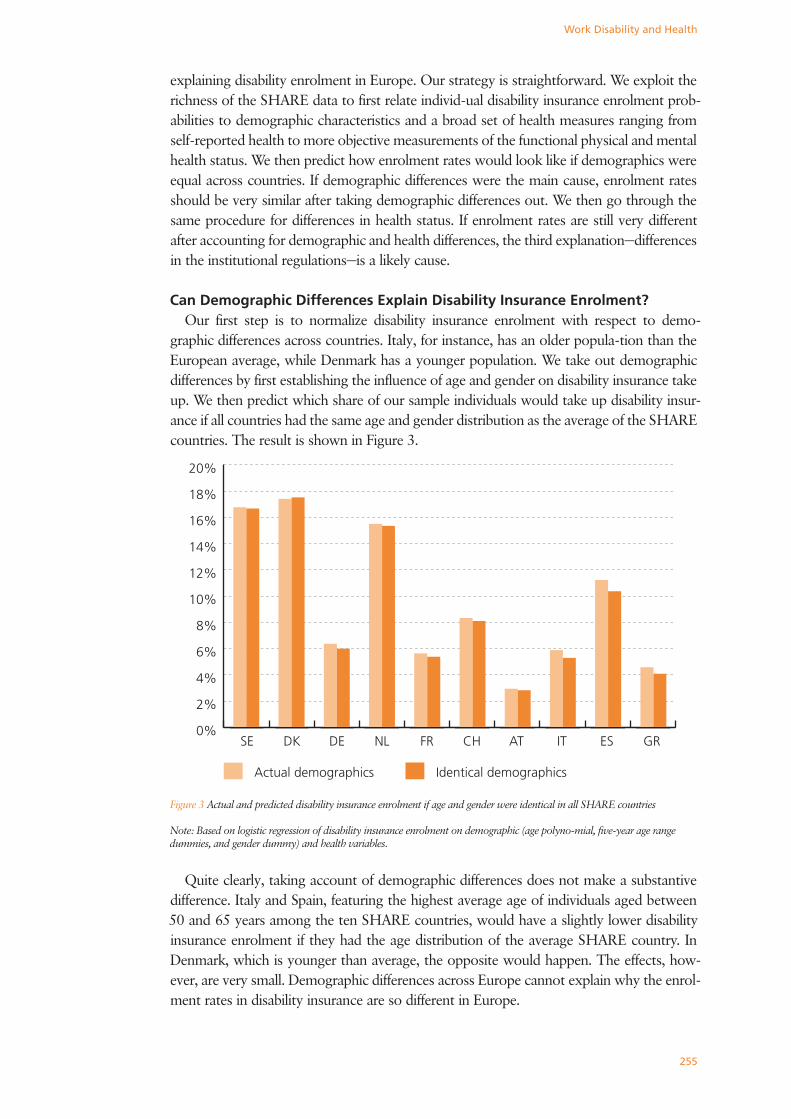
Can Demographic Differences Explain Disability Insurance Enrolment?Our first step is to normalize disability insurance enrolment with respect to demo-
graphic differences across countries. Italy, for instance, has an older popula-tion than the European average, while Denmark has a younger population. We take out demographic differences by first establishing the influence of age and gender on disability insurance take up. We then predict which share of our sample individuals would take up disability insur-ance if all countries had the same age and gender distribution as the average of the SHARE countries. The result is shown in Figure 3.
Figure 3 Actual and predicted disability insurance enrolment if age and gender were identical in all SHARE countries
Note: Based on logistic regression of disability insurance enrolment on demographic (age polyno-mial, five-year age range dummies, and gender dummy) and health variables.
Quite clearly, taking account of demographic differences does not make a substantive
difference. Italy and Spain, featuring the highest average age of individuals aged between 50 and 65 years among the ten SHARE countries, would have a slightly lower disability insurance enrolment if they had the age distribution of the average SHARE country. In Denmark, which is younger than average, the opposite would happen. The effects, how-ever, are very small. Demographic differences across Europe cannot explain why the enrol-ment rates in disability insurance are so different in Europe.
����������������������
��
��
��
��
���
���
���
���
���
���
������������������� ����������������������
256
Work and Retirement
Can Health Differences Explain Disability Insurance Enrolment?Our second step is therefore to account for difference in the health status of the popula-
tion. The health status differs along many dimensions across countries. A first dimension is self-assessed health. Self-assessed health is relatively poor in Italy and Spain, it is best in Switzerland. As we have seen in Chapter 3, self-assessed health does not always corre-spond to the physical performance in daily activities such as walking or bathing. In this sec-ond dimension, Germany exhibits the most limitations and Greece the least. A third and important health dimension is physical strength, e.g. as measured by hand grip strength. Also this health measure features remarkable cross-national differences. Again, Spain and Italy show the lowest readings, while Germany and the Netherlands perform strongest on this scale. A fourth dimension is mental health. Depression, an often named reason for taking up disability insurance, varies quite substantially across the SHARE countries. Spain, Italy and France show the worst scores on the EURO-D depression scale, while Denmark, Germany and Switzerland have the lowest share of depression cases. Hence, the cross-national variation in health status looks like a good candidate to explain the variation in disability insurance enrolment.
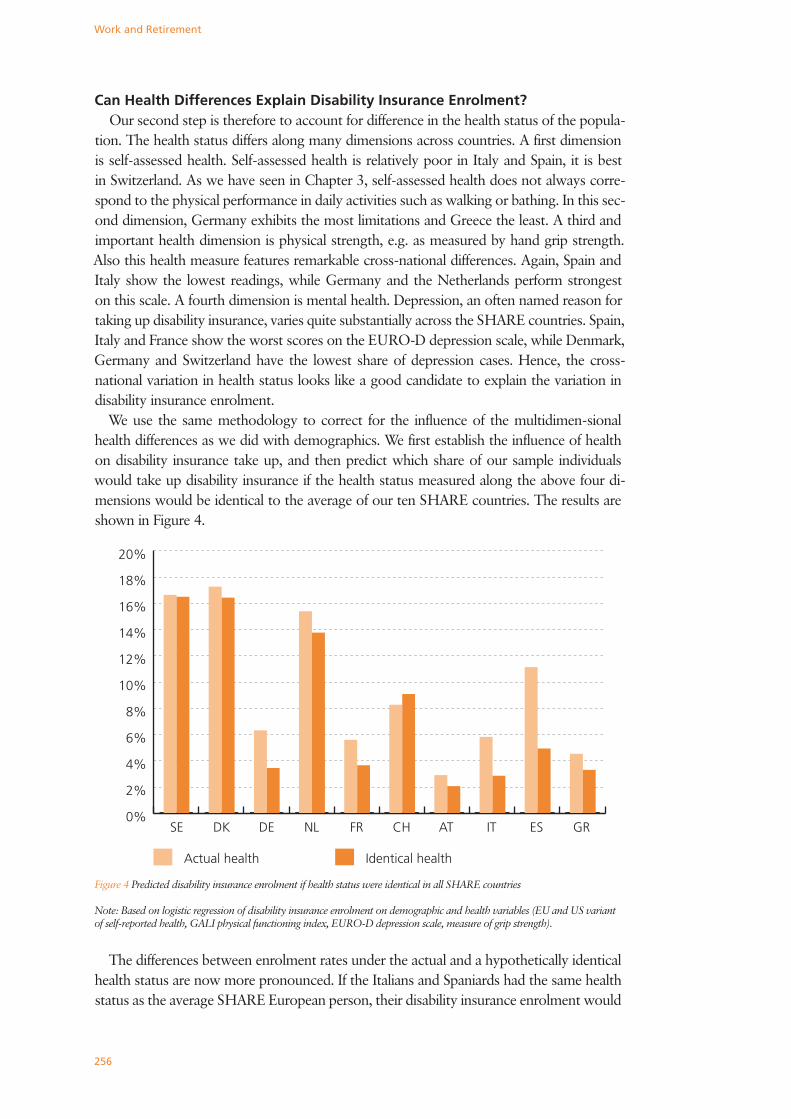
We use the same methodology to correct for the influence of the multidimen-sional health differences as we did with demographics. We first establish the influence of health on disability insurance take up, and then predict which share of our sample individuals would take up disability insurance if the health status measured along the above four di-mensions would be identical to the average of our ten SHARE countries. The results are shown in Figure 4.
Figure 4 Predicted disability insurance enrolment if health status were identical in all SHARE countries
Note: Based on logistic regression of disability insurance enrolment on demographic and health variables (EU and US variant of self-reported health, GALI physical functioning index, EURO-D depression scale, measure of grip strength).
The differences between enrolment rates under the actual and a hypothetically identical health status are now more pronounced. If the Italians and Spaniards had the same health status as the average SHARE European person, their disability insurance enrolment would
����������������������
��
��
��
��
���
���
���
���
���
���
������������� ����������������
257
Work Disability and Health
be much lower, less than half of the actual enrolment. In Switzerland, it would be slightly higher. However, if health would be the dominant explanation for disability insurance enrolment, the predicted shares should be equal across countries, once health is identical in all countries. As Figure 4 shows, this is clearly not the case. There are still pronounced differences, even after accounting for the statistical errors as depicted in Figure 1 and after carefully including a broad spectrum of health dimensions. Especially the high enrolment rates in Sweden, Denmark and the Netherlands remain relatively stable after correcting for health differences. We conclude that differences in health across Europe cannot explain the cross-national variation in the European disability insurance enrolment.
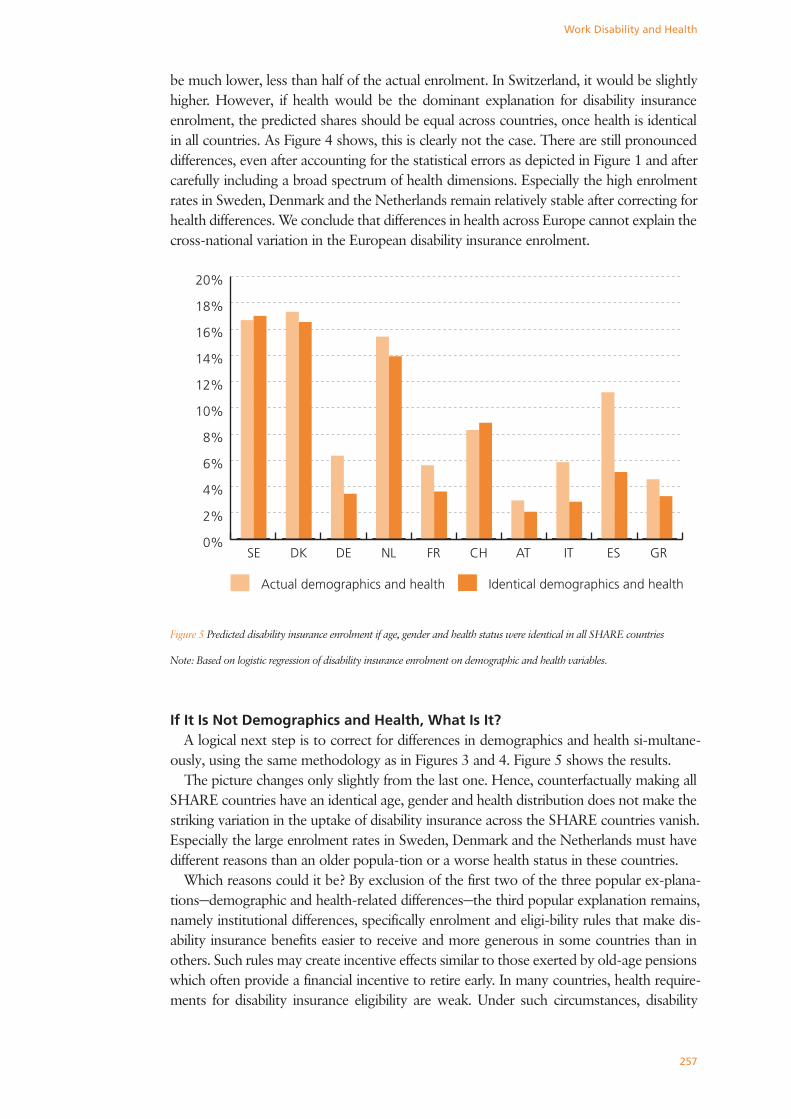
Figure 5 Predicted disability insurance enrolment if age, gender and health status were identical in all SHARE countries
Note: Based on logistic regression of disability insurance enrolment on demographic and health variables.
If It Is Not Demographics and Health, What Is It?A logical next step is to correct for differences in demographics and health si-multane-
ously, using the same methodology as in Figures 3 and 4. Figure 5 shows the results.The picture changes only slightly from the last one. Hence, counterfactually making all
SHARE countries have an identical age, gender and health distribution does not make the striking variation in the uptake of disability insurance across the SHARE countries vanish. Especially the large enrolment rates in Sweden, Denmark and the Netherlands must have different reasons than an older popula-tion or a worse health status in these countries.
Which reasons could it be? By exclusion of the first two of the three popular ex-plana-tions—demographic and health-related differences—the third popular explanation remains, namely institutional differences, specifically enrolment and eligi-bility rules that make dis-ability insurance benefits easier to receive and more generous in some countries than in others. Such rules may create incentive effects similar to those exerted by old-age pensions which often provide a financial incentive to retire early. In many countries, health require-ments for disability insurance eligibility are weak. Under such circumstances, disability
����������������������
��
��
��
��
���
���
���
���
���
���
������������������������������ ���������������������������������

258
Work and Retirement
insurance may work as a labour market exit route to early retirement (Börsch-Supan 2001). Many countries have established very lenient work disability eligibility rules under the conditions of high unemployment.
A final step of our argument would therefore be a counterfactual analysis which makes disability eligibility rules identical for all individuals in the SHARE sample and then predicts the take-up outcomes in the same sprit as Figures 3 through 5 did. The SHARE data are an ideal starting point for such an institutional analysis. Eligibility rules can be expressed as variables to be constructed from individual employment history data in combination with detailed institutional knowledge, similar to the variables constructed by the Gruber and Wise (1999) project. This is not an easy task which requires time and international cooperation, such as in the SHARE team. It is very promising future research which will shed light on the working of our European social institutions.
Conclusions
• The variation in disability insurance take-up rates across European coun-tries is strik-ing. It reaches from some 15 percent of individuals aged be-tween 50 and 65 in Den-mark, Sweden and the Netherlands to less than 3 percent in Austria and Greece.
• Correcting for differences in the age, gender and health distribution across countries does not explain this striking variation. Especially the large en-rolment rates in Sweden, Denmark and the Netherlands have different rea-sons than an older population or a worse health status than in the other European countries.
• Institutional factors—incentives created by enrolment and eligibility rules—are a more likely explanation. The SHARE data are an ideal starting point for a deeper analysis of this hypothesis because they uniquely cover health status, income components and institutional variation comparably measured across Europe.
ReferencesAarts, L.J.M., R.V. Burkhauser and Ph.R. de Jong. Eds. 1996. Curing the Dutch Disease, An In-ternational Per-
spective on Disability Policy Reform, Avebury: Aldershot.
Blöndal, S. and S. Scarpetta. 1998. The retirement decisions in OECD countries, OECD Economics Depart-
ment Working Paper, No. 202, Paris: OECD.
Börsch-Supan, A. 2001. Incentive Effects of Social Security Under an Uncertain Disability Op-tion. In Themes
in the Economics of Aging, ed. D.A. Wise, , 281-310, Chicago: University of Chicago Press.
Gruber, J. and Wise, D. Eds. 1999. Social Security and Retirement around the World, Chicago: University of
Chicago Press.
259
Volunteer Work
5.5 Volunteer WorkKarsten Hank and Marcel Erlinghagen
Productive Ageing in Europe – How Does the Societal Context Matter?Today’s discussion about the growing ‘burden of ageing’ must not neglect the sub-
stantial productive potential of the elderly population (e.g., O’Reilly and Caro 1994). The present contribution focuses on the participation of older Europeans in volunteer work, which can be defined as “unpaid work provided to parties to whom the worker owes no contractual, familial, or friendship obligations” (Wilson and Musick 1997: 694).
Many studies show that retirement does not necessarily result in higher participation rates (e.g., Mutchler et al. 2003). However, “[w]hen it comes to hours of volunteering […] older men and women actually spend more time than do their younger counterparts, even when employment status is controlled” (Gallagher 1994: 576), suggesting that older volunteers are more highly committed than other age-groups. This is attributed to the fact that the productive nature of volunteering should be particularly beneficial for older people’s life-satisfaction or health (e.g., Siegrist et al. 2004).
Volunteerism, though, should not be seen in isolation of the broader societal context in which it takes place: “as a cultural and economic phenomenon, volunteering is part of the way societies are organised, how they allocate social responsibilities, and how much engagement and participation they expect from citizens.” (Anheier and Salamon 1999: 43) So far, however, cross-nationally comparable data on active participation in volunteer work are scarce.
This contribution investigates cross-national patterns of volunteering among Europe’s population aged 50 and over. Moreover, the broad range of multidisciplinary information in SHARE allows us to provide (descriptive) statistics on the correlation between demo-graphic, socio-economic, and health characteristics on the one hand, and participation in volunteer work on the other hand. Our conclusions stress the need to take a contextual perspective in future analyses of volunteering, and support policies and programs designed to encourage elderly citizens to make use of their productive potential – for the benefit of themselves and society.
Measuring Volunteer Work in SHAREWhile many studies focus on membership in voluntary associations, we exploit informa-
tion on whether the respondent has been actively engaged in voluntary or charity work during the month before the interview. Although membership is highly correlated with activity, the former measure might lead to an overestimation of actual engagement. Since volunteer work is often performed on a rather irregular basis and other studies’ retrospec-tive questions regarding participation cover a longer period of time (e.g. the last year), our figures are even more likely to give a very conservative estimate of the prevalence of vol-unteering in the SHARE countries.
We use a binary indicator of volunteering (including charity work), which is comple-mented by information on the frequency of engagement and the individual’s motivation to do so (these variables are taken from a questionnaire module developed by the SHARE working group on ‘Well-being and social productivity’, lead by Johannes Siegrist). In ad-dition, we consider a broad set of covariates in our analysis, including indicators of other social activities, demographic characteristics, education and employment status, as well as health variables. Further waves of SHARE will allow an investigation into more complex behavioural aspects of volunteer work and causal relationships.

260
Work and Retirement
Who Volunteers? Comparing Different Groups of Europe’s 50+Volunteering – levels, frequency, motivations (see Table 5A.12 in the Appendix to this
chapter for details): With regard to levels of volunteering, the SHARE countries may be divided into three groups (Figure 1). First, the Mediterranean ‘low participation’ countries, where 7 percent of the Italian and only 2-3 percent of the Greek and Spanish respondents engaged in volunteer work during the preceding month. Secondly, with 9-14 percent volunteers in the population 50+, Germany, France, Switzerland, and Austria exhibit me-dium activity levels. The remaining ‘high participation’ countries are, thirdly, Sweden and Denmark (where 17 percent report to have volunteered) and the Netherlands with more than 20 percent volunteers in the older population.
Among those who report to have volunteered in the last month, almost one fifth (18 percent) has done so almost daily, nearly half of the volunteers have been engaged almost every week (47 percent), and slightly more than one third has worked less often (36 percent). Although a remarkably high share of Dutch volunteers has worked in almost every week (58 percent), there appears to be no correlation between the overall level of
Figure 1 Spatial pattern of participation in volunteer work
������� ������
�����

261
Volunteer Work
volunteering in a country and the frequency of engagement. The two most frequently mentioned motivations to volunteer are the desire to contribute something useful (68 per-cent), followed by the joy derived from volunteering (56 percent). In some countries, e.g. in Sweden and the Netherlands, this rank order is reversed. Beyond the social value of their activity, many volunteers apparently expect an additional, non-monetary personal gain.
Other social activities and volunteering (see Table 5A.13 for details): The spatial pattern of the provision of informal help or care is very similar to the one observed for volunteer-ing. On an overall higher level – 21 percent of the respondents report to have helped in the last month – we find substantially lower activity rates in the Mediterranean coun-tries (from 7 percent in Spain to 17 percent in Greece) than in the Nordic countries (34 percent in Denmark and 41 percent in Sweden), for example. This is interesting, as help provided to family is at least partially covered here and one might rather have expected a reverse pattern with more helping or caring in southern Europe. Moreover, 27 percent of the SHARE sample participated in activities of an organisation. Despite significant cross-national variation, there is no clear spatial pattern of participation, though. While, for example, only about 15-20 percent of Italians and Spaniards took part in some kind of activity, almost half of the Greek and Swiss respondents (45-50 percent) were involved in an organisation’s activities.
With regard to the relationship between volunteering and other social activities, it is in-teresting to note that in all countries the share of volunteers among those who have helped or cared is between 1.5 (Sweden, Denmark, Netherlands) and more than two times (Italy, Greece) higher than in the general population. When turning to participation in organised activities, the respective factors are in most cases even somewhat larger. The association suggested here is also reflected in similarly higher shares of helpers and carers (participants, respectively) among those who report to have volunteered.
Demographic characteristics of volunteers (see Table 5A.14 for details): Gender differ-ences in volunteering are generally small (in the order of 2 percentage points). While there is some tendency of men to be more active than women (particularly in Sweden and France), there are also exceptions like the Netherlands and Switzerland, where slightly higher shares of women engage in voluntary work. Variations in volunteering by partner-ship status are also small (on average by 2 percentage points), with some indication of a greater engagement among those who live with a partner versus those living alone (par-ticularly so in Denmark and Germany, for example).
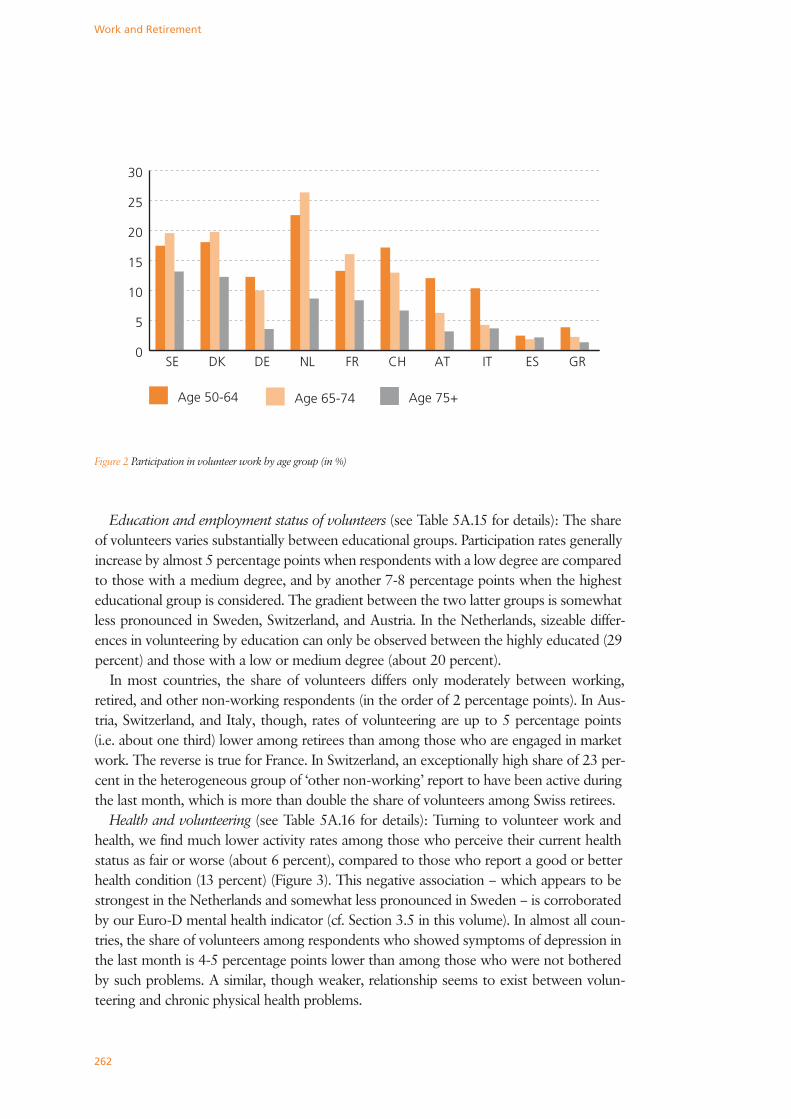
The age gradient of volunteer activity among the elderly is quite clear (Figure 2). In most countries, volunteering decreases only modestly between the two ‘younger’ age groups: from 12 percent among those who are 50-64 years old to 9 percent among respondents aged 65-74. While this decline in the share of volunteers till age 74 is stronger than the average in Austria and Italy (minus 6 percentage points), the Netherlands and France even exhibit an increase of 3-4 percentage points in that age group. However, when respon-dents age 75 or older are considered, activity rates drop by at least one third everywhere (in the Netherlands even by two thirds), to an average level of 5 percent. Still, in the Nor-dic countries as much as 12-13 percent of the population 75+ continue to be engaged in voluntary work.
262
Work and Retirement
Education and employment status of volunteers (see Table 5A.15 for details): The share of volunteers varies substantially between educational groups. Participation rates generally increase by almost 5 percentage points when respondents with a low degree are compared to those with a medium degree, and by another 7-8 percentage points when the highest educational group is considered. The gradient between the two latter groups is somewhat less pronounced in Sweden, Switzerland, and Austria. In the Netherlands, sizeable differ-ences in volunteering by education can only be observed between the highly educated (29 percent) and those with a low or medium degree (about 20 percent).
In most countries, the share of volunteers differs only moderately between working, retired, and other non-working respondents (in the order of 2 percentage points). In Aus-tria, Switzerland, and Italy, though, rates of volunteering are up to 5 percentage points (i.e. about one third) lower among retirees than among those who are engaged in market work. The reverse is true for France. In Switzerland, an exceptionally high share of 23 per-cent in the heterogeneous group of ‘other non-working’ report to have been active during the last month, which is more than double the share of volunteers among Swiss retirees.
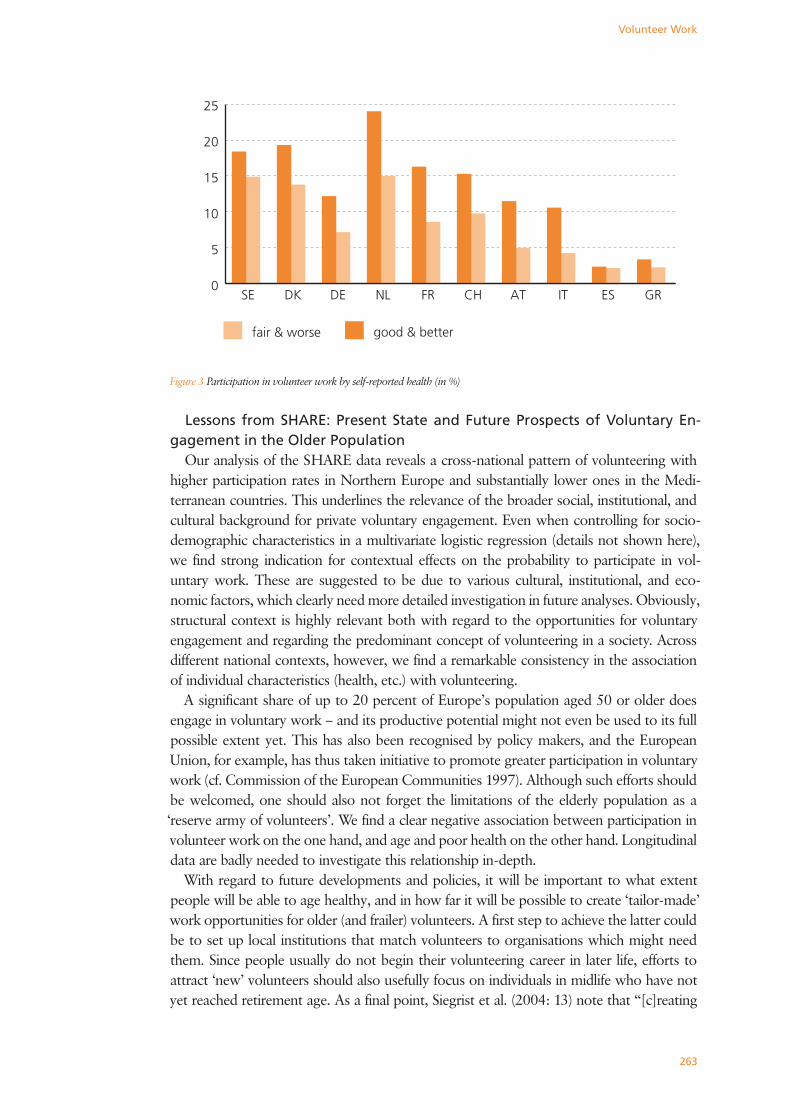
Health and volunteering (see Table 5A.16 for details): Turning to volunteer work and health, we find much lower activity rates among those who perceive their current health status as fair or worse (about 6 percent), compared to those who report a good or better health condition (13 percent) (Figure 3). This negative association – which appears to be strongest in the Netherlands and somewhat less pronounced in Sweden – is corroborated by our Euro-D mental health indicator (cf. Section 3.5 in this volume). In almost all coun-tries, the share of volunteers among respondents who showed symptoms of depression in the last month is 4-5 percentage points lower than among those who were not bothered by such problems. A similar, though weaker, relationship seems to exist between volun-teering and chronic physical health problems.
Figure 2 Participation in volunteer work by age group (in %)
0
5
10
15
20
25
30
Age 75+Age 65-74Age 50-64
GRESITATCHFRNLDEDKSE
263
Volunteer Work
Lessons from SHARE: Present State and Future Prospects of Voluntary En-gagement in the Older Population
Our analysis of the SHARE data reveals a cross-national pattern of volunteering with higher participation rates in Northern Europe and substantially lower ones in the Medi-terranean countries. This underlines the relevance of the broader social, institutional, and cultural background for private voluntary engagement. Even when controlling for socio-demographic characteristics in a multivariate logistic regression (details not shown here), we find strong indication for contextual effects on the probability to participate in vol-untary work. These are suggested to be due to various cultural, institutional, and eco-nomic factors, which clearly need more detailed investigation in future analyses. Obviously, structural context is highly relevant both with regard to the opportunities for voluntary engagement and regarding the predominant concept of volunteering in a society. Across different national contexts, however, we find a remarkable consistency in the association of individual characteristics (health, etc.) with volunteering.
A significant share of up to 20 percent of Europe’s population aged 50 or older does engage in voluntary work – and its productive potential might not even be used to its full possible extent yet. This has also been recognised by policy makers, and the European Union, for example, has thus taken initiative to promote greater participation in voluntary work (cf. Commission of the European Communities 1997). Although such efforts should be welcomed, one should also not forget the limitations of the elderly population as a ‘reserve army of volunteers’. We find a clear negative association between participation in volunteer work on the one hand, and age and poor health on the other hand. Longitudinal data are badly needed to investigate this relationship in-depth.
With regard to future developments and policies, it will be important to what extent people will be able to age healthy, and in how far it will be possible to create ‘tailor-made’ work opportunities for older (and frailer) volunteers. A first step to achieve the latter could be to set up local institutions that match volunteers to organisations which might need them. Since people usually do not begin their volunteering career in later life, efforts to attract ‘new’ volunteers should also usefully focus on individuals in midlife who have not yet reached retirement age. As a final point, Siegrist et al. (2004: 13) note that “[c]reating
Figure 3 Participation in volunteer work by self-reported health (in %)
0
5
10
15
20
25
fair & worse good & better
GRESITATCHFRNLDEDKSE

264
Work and Retirement
systems and opportunities in which motivations, efforts and rewards are marked by reci-procity seems to be of vital importance […] in increasing meaningful participation, not least in view of their powerful implications for well-being and health.” It is therefore crucial to always keep in mind the beneficial aspect of volunteering for those who volunteer: older people shall not be ‘exploited’ for the benefit of others, but will hopefully experience a higher quality of life themselves through their active participation in society!
In sum, three main lessons can be learned from our analysis:
• Substantial regional variation in levels of volunteering exists between the countries under consideration, with higher activity rates in Northern Europe and lower ones in the Mediterranean countries.
• Across all SHARE countries, there is a remarkable consistency in the association of a broad range of individual characteristics, such as age or health, with volunteering.
• Although a significant share of Europe’s population 50+ already engages in voluntary work, its yet unused productive potential needs to be activated through specifically designed policies and programs.
ReferencesAnheier, H.K., and L.M. Salamon. 1999. Volunteering in Cross-National Perspective: Initial Comparisons. Law
and Contemporary Problems 62:43-65.
Commission of the European Communities. 1997. Promoting the Role of Voluntary Organisations in Europe.
Luxemburg.
Gallagher, S.K. 1994. Doing Their Share: Comparing Patterns of Help Given by Older and Younger Adults.
Journal of Marriage and the Family 56:567-78.
Mutchler, J.E., J.A. Burr, and F.G. Caro. 2003. From Paid Worker to Volunteer: Leaving the Paid Labor Force
and Volunteering in Later Life. Social Forces 81:1267-93.
O’Reilly, P., and F.G. Caro. 1994. Productive Aging: An Overview of the Literature. Journal of Aging and Social
Policy 6:39-71.
Siegrist, J., O. von dem Knesebeck, and C.E. Pollack. 2004. Social Productivity and Well-Being of Older People:
A Sociological Exploration. Social Theory and Health 2:1-17.
Wilson, J., and M. Musick. 1997. Who Cares? Towards an Integrated Theory of Volunteer Work. American
Sociological Review 62:694-713.
265
How Do European Older Adults Use Their Time?
5.6 How Do European Older Adults Use Their Time?Enrica Croda and Jorge Gonzalez-Chapela
IntroductionTime is at the heart of most economic phenomena, and an accurate measurement of the
temporal characteristics of the economic activities is crucial to fully understand individual and societal economic behaviour (see Gershuny, Harvey, and Merz 2004). Furthermore, time-use information can be utilised to better understand the well-being of the population and the implications of public policies. Even though specific time-use surveys are being collected in some countries, the range of accompanying information they provide is not abundant. As a consequence, their ability to answer interdisciplinary research questions is very limited. In contrast, SHARE collects a significant amount of demographic, socio-economic, health, and time-use information for the population of Europeans aged fifty and older, which can be combined to address interdisciplinary research questions in an internationally comparative framework.
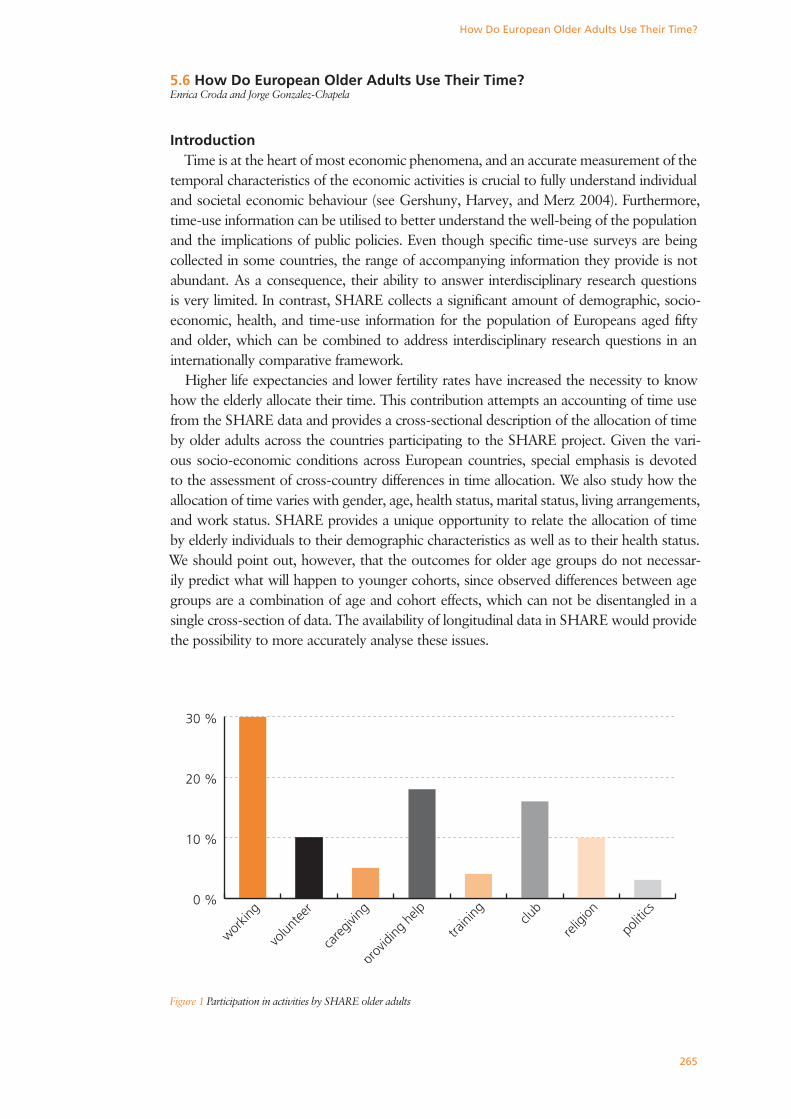
Higher life expectancies and lower fertility rates have increased the necessity to know how the elderly allocate their time. This contribution attempts an accounting of time use from the SHARE data and provides a cross-sectional description of the allocation of time by older adults across the countries participating to the SHARE project. Given the vari-ous socio-economic conditions across European countries, special emphasis is devoted to the assessment of cross-country differences in time allocation. We also study how the allocation of time varies with gender, age, health status, marital status, living arrangements, and work status. SHARE provides a unique opportunity to relate the allocation of time by elderly individuals to their demographic characteristics as well as to their health status. We should point out, however, that the outcomes for older age groups do not necessar-ily predict what will happen to younger cohorts, since observed differences between age groups are a combination of age and cohort effects, which can not be disentangled in a single cross-section of data. The availability of longitudinal data in SHARE would provide the possibility to more accurately analyse these issues.
Figure 1 Participation in activities by SHARE older adults
0 %
10 %
20 %
30 %
politi
cs
relig
ionclub
traini
ng
prov
iding
help
care
giving
volun
teer
workin
g

266
Work and Retirement
Figure 1 offers an overview of the proportion of respondents in the whole SHARE sample who engaged in several activities in the month prior to the interview. Older adults are very active: about 30 percent of them were working in the market, while 23 percent provided help to relatives and friends, or cared for a sick or disabled adult. They are also fairly involved in social activities: doing voluntary or charity work; going to sport, social or other kind of clubs; taking part in religious, political, or community-related organisations. Some of them even attended an educational or training course. The rest of the contribu-tion investigates the prevalence and time devoted to three activities that represent impor-tant aspects of older adults’ lives: market work; the provision of help to relatives outside household, friends and neighbours; and the care for grandchildren. In contrast to the rest of the chapter, we consider as working to all respondents who have worked a positive number of hours in the market.
The Allocation of Time by European Older Adults: PrevalenceIn addition to asking detailed information on market work, as already discussed in
Contribution 5.1, the SHARE questionnaire explicitly asks about the help respondents may have given during the past twelve months to family members outside the household, friends, or neighbours with personal care, practical household help, and help with paper-work. It also asks separately whether during the last twelve months respondents have looked after their grandchildren (without the presence of the parents). These activities become more and more important as people age.
Figure 2 Prevalence of market and non-market activities by country and gender
0 %
10 %
20 %
30 %
40 %
caring for grandchildrenproviding helpmarket work
GRESITATCHFRNLDEDKSE
WOMEN
0 %
20 %
40 %
60 %
caring for grandchildrenproviding helpmarket work
GRESITATCHFRNLDEDKSE
MEN
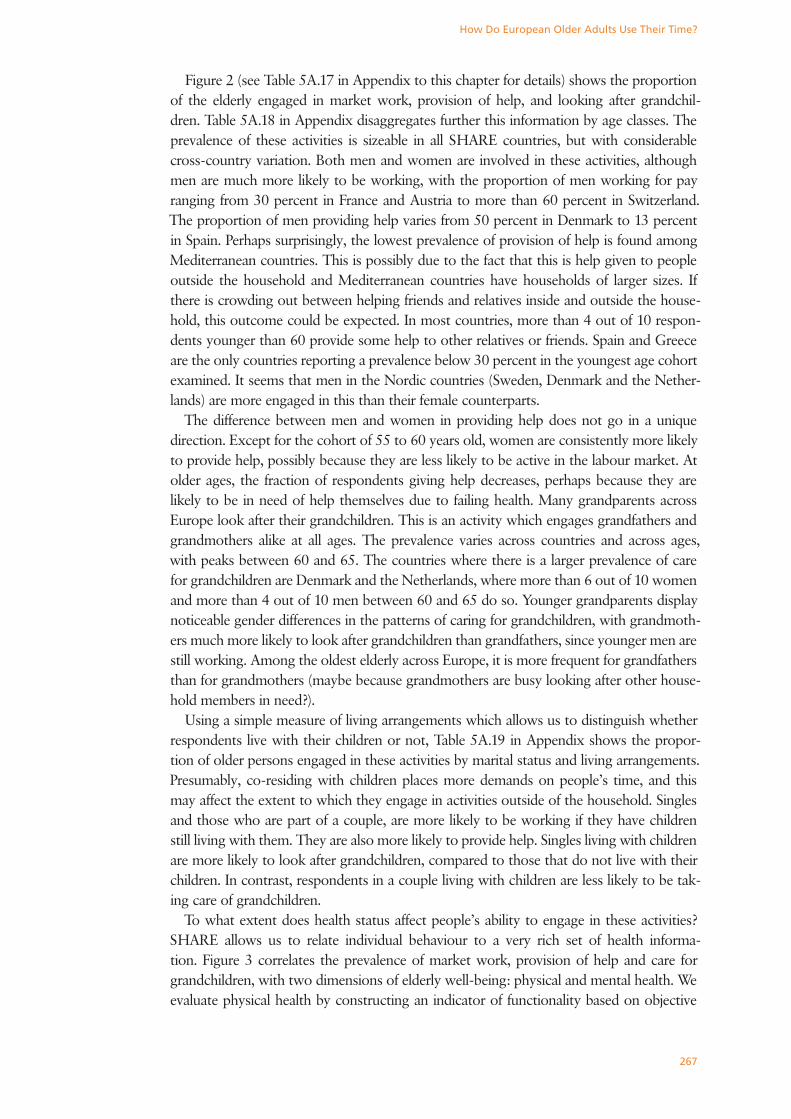
267
How Do European Older Adults Use Their Time?
Figure 2 (see Table 5A.17 in Appendix to this chapter for details) shows the proportion of the elderly engaged in market work, provision of help, and looking after grandchil-dren. Table 5A.18 in Appendix disaggregates further this information by age classes. The prevalence of these activities is sizeable in all SHARE countries, but with considerable cross-country variation. Both men and women are involved in these activities, although men are much more likely to be working, with the proportion of men working for pay ranging from 30 percent in France and Austria to more than 60 percent in Switzerland. The proportion of men providing help varies from 50 percent in Denmark to 13 percent in Spain. Perhaps surprisingly, the lowest prevalence of provision of help is found among Mediterranean countries. This is possibly due to the fact that this is help given to people outside the household and Mediterranean countries have households of larger sizes. If there is crowding out between helping friends and relatives inside and outside the house-hold, this outcome could be expected. In most countries, more than 4 out of 10 respon-dents younger than 60 provide some help to other relatives or friends. Spain and Greece are the only countries reporting a prevalence below 30 percent in the youngest age cohort examined. It seems that men in the Nordic countries (Sweden, Denmark and the Nether-lands) are more engaged in this than their female counterparts.
The difference between men and women in providing help does not go in a unique direction. Except for the cohort of 55 to 60 years old, women are consistently more likely to provide help, possibly because they are less likely to be active in the labour market. At older ages, the fraction of respondents giving help decreases, perhaps because they are likely to be in need of help themselves due to failing health. Many grandparents across Europe look after their grandchildren. This is an activity which engages grandfathers and grandmothers alike at all ages. The prevalence varies across countries and across ages, with peaks between 60 and 65. The countries where there is a larger prevalence of care for grandchildren are Denmark and the Netherlands, where more than 6 out of 10 women and more than 4 out of 10 men between 60 and 65 do so. Younger grandparents display noticeable gender differences in the patterns of caring for grandchildren, with grandmoth-ers much more likely to look after grandchildren than grandfathers, since younger men are still working. Among the oldest elderly across Europe, it is more frequent for grandfathers than for grandmothers (maybe because grandmothers are busy looking after other house-hold members in need?).
Using a simple measure of living arrangements which allows us to distinguish whether respondents live with their children or not, Table 5A.19 in Appendix shows the propor-tion of older persons engaged in these activities by marital status and living arrangements. Presumably, co-residing with children places more demands on people’s time, and this may affect the extent to which they engage in activities outside of the household. Singles and those who are part of a couple, are more likely to be working if they have children still living with them. They are also more likely to provide help. Singles living with children are more likely to look after grandchildren, compared to those that do not live with their children. In contrast, respondents in a couple living with children are less likely to be tak-ing care of grandchildren.
To what extent does health status affect people’s ability to engage in these activities? SHARE allows us to relate individual behaviour to a very rich set of health informa-tion. Figure 3 correlates the prevalence of market work, provision of help and care for grandchildren, with two dimensions of elderly well-being: physical and mental health. We evaluate physical health by constructing an indicator of functionality based on objective
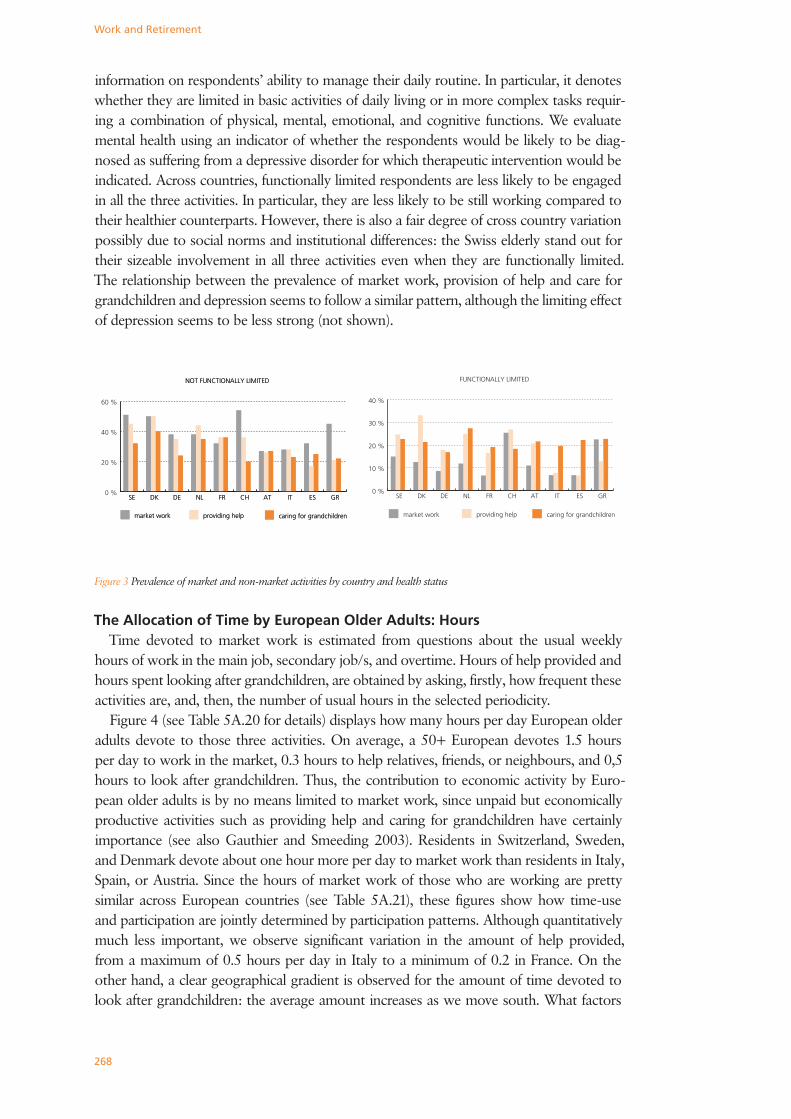
268
Work and Retirement
information on respondents’ ability to manage their daily routine. In particular, it denotes whether they are limited in basic activities of daily living or in more complex tasks requir-ing a combination of physical, mental, emotional, and cognitive functions. We evaluate mental health using an indicator of whether the respondents would be likely to be diag-nosed as suffering from a depressive disorder for which therapeutic intervention would be indicated. Across countries, functionally limited respondents are less likely to be engaged in all the three activities. In particular, they are less likely to be still working compared to their healthier counterparts. However, there is also a fair degree of cross country variation possibly due to social norms and institutional differences: the Swiss elderly stand out for their sizeable involvement in all three activities even when they are functionally limited. The relationship between the prevalence of market work, provision of help and care for grandchildren and depression seems to follow a similar pattern, although the limiting effect of depression seems to be less strong (not shown).
The Allocation of Time by European Older Adults: HoursTime devoted to market work is estimated from questions about the usual weekly
hours of work in the main job, secondary job/s, and overtime. Hours of help provided and hours spent looking after grandchildren, are obtained by asking, firstly, how frequent these activities are, and, then, the number of usual hours in the selected periodicity.
Figure 4 (see Table 5A.20 for details) displays how many hours per day European older adults devote to those three activities. On average, a 50+ European devotes 1.5 hours per day to work in the market, 0.3 hours to help relatives, friends, or neighbours, and 0,5 hours to look after grandchildren. Thus, the contribution to economic activity by Euro-pean older adults is by no means limited to market work, since unpaid but economically productive activities such as providing help and caring for grandchildren have certainly importance (see also Gauthier and Smeeding 2003). Residents in Switzerland, Sweden, and Denmark devote about one hour more per day to market work than residents in Italy, Spain, or Austria. Since the hours of market work of those who are working are pretty similar across European countries (see Table 5A.21), these figures show how time-use and participation are jointly determined by participation patterns. Although quantitatively much less important, we observe significant variation in the amount of help provided, from a maximum of 0.5 hours per day in Italy to a minimum of 0.2 in France. On the other hand, a clear geographical gradient is observed for the amount of time devoted to look after grandchildren: the average amount increases as we move south. What factors
Figure 3 Prevalence of market and non-market activities by country and health status
40 %
60 %
caring for grandchildrenproviding helpmarket work
GRESITATCHFRNLDEDKSE
NOT FUNCTIONALLY LIMITED
0 %
20 %
caring for grandchildrenproviding helpmarket work
GRESITATCHFRNLDEDKSE
NOT FUNCTIONALLY LIMITED
0 %
10 %
20 %
30 %
40 %
caring for grandchildrenproviding helpmarket work
GRESITATCHFRNLDEDKSE
FUNCTIONALLY LIMITED
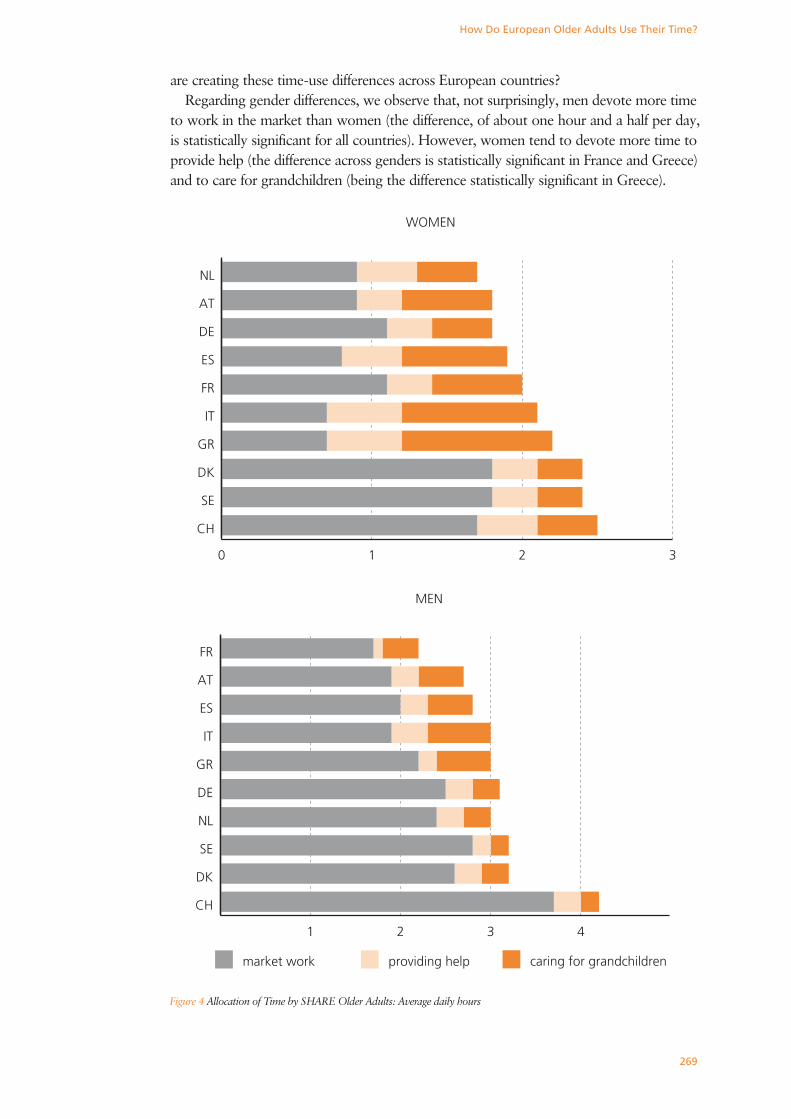
269
How Do European Older Adults Use Their Time?
are creating these time-use differences across European countries?Regarding gender differences, we observe that, not surprisingly, men devote more time
to work in the market than women (the difference, of about one hour and a half per day, is statistically significant for all countries). However, women tend to devote more time to provide help (the difference across genders is statistically significant in France and Greece) and to care for grandchildren (being the difference statistically significant in Greece).
Figure 4 Allocation of Time by SHARE Older Adults: Average daily hours
caring for grandchildrenproviding helpmarket work
WOMEN
0 1 2 3
CH
SE
DK
GR
IT
FR
ES
DE
AT
NL
caring for grandchildrenproviding helpmarket work
MEN
1 2 3 4
CH
DK
SE
NL
DE
GR
IT
ES
AT
FR
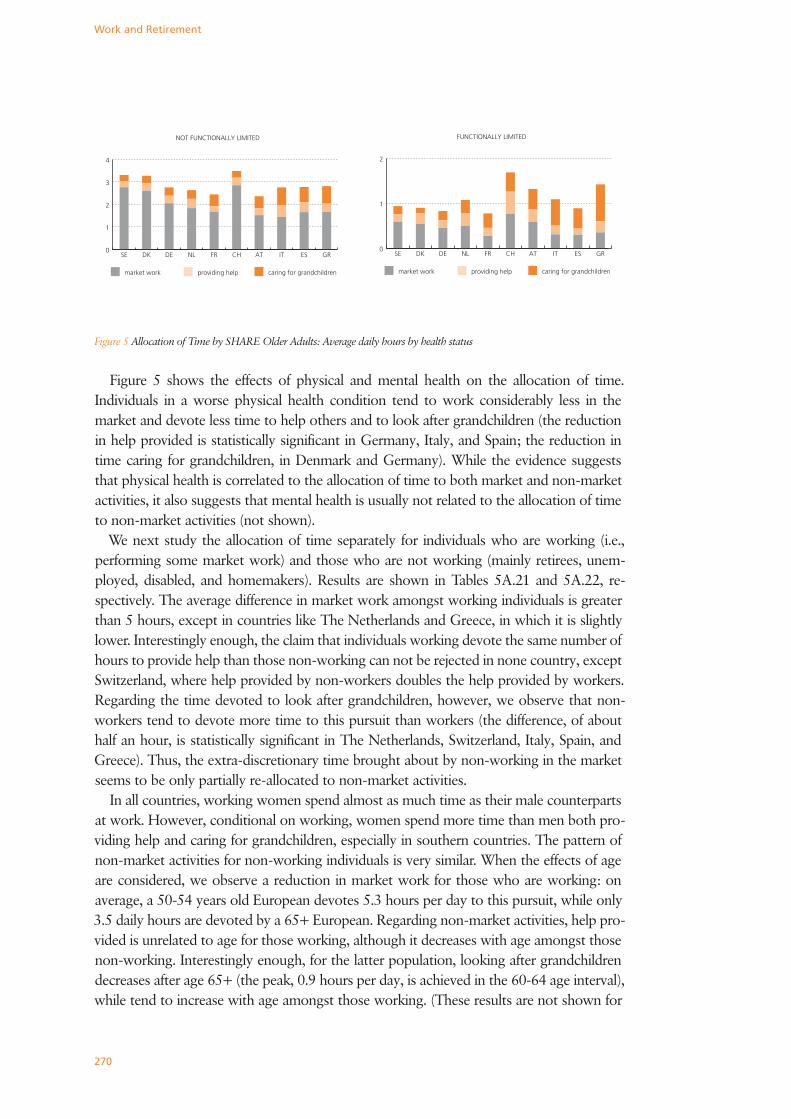
270
Work and Retirement
Figure 5 shows the effects of physical and mental health on the allocation of time. Individuals in a worse physical health condition tend to work considerably less in the market and devote less time to help others and to look after grandchildren (the reduction in help provided is statistically significant in Germany, Italy, and Spain; the reduction in time caring for grandchildren, in Denmark and Germany). While the evidence suggests that physical health is correlated to the allocation of time to both market and non-market activities, it also suggests that mental health is usually not related to the allocation of time to non-market activities (not shown).
We next study the allocation of time separately for individuals who are working (i.e., performing some market work) and those who are not working (mainly retirees, unem-ployed, disabled, and homemakers). Results are shown in Tables 5A.21 and 5A.22, re-spectively. The average difference in market work amongst working individuals is greater than 5 hours, except in countries like The Netherlands and Greece, in which it is slightly lower. Interestingly enough, the claim that individuals working devote the same number of hours to provide help than those non-working can not be rejected in none country, except Switzerland, where help provided by non-workers doubles the help provided by workers. Regarding the time devoted to look after grandchildren, however, we observe that non-workers tend to devote more time to this pursuit than workers (the difference, of about half an hour, is statistically significant in The Netherlands, Switzerland, Italy, Spain, and Greece). Thus, the extra-discretionary time brought about by non-working in the market seems to be only partially re-allocated to non-market activities.
In all countries, working women spend almost as much time as their male counterparts at work. However, conditional on working, women spend more time than men both pro-viding help and caring for grandchildren, especially in southern countries. The pattern of non-market activities for non-working individuals is very similar. When the effects of age are considered, we observe a reduction in market work for those who are working: on average, a 50-54 years old European devotes 5.3 hours per day to this pursuit, while only 3.5 daily hours are devoted by a 65+ European. Regarding non-market activities, help pro-vided is unrelated to age for those working, although it decreases with age amongst those non-working. Interestingly enough, for the latter population, looking after grandchildren decreases after age 65+ (the peak, 0.9 hours per day, is achieved in the 60-64 age interval), while tend to increase with age amongst those working. (These results are not shown for
Figure 5 Allocation of Time by SHARE Older Adults: Average daily hours by health status
caring for grandchildrenproviding helpmarket work
NOT FUNCTIONALLY LIMITED
0
1
2
3
4
GRESITATCHFRNLDEDKSE
caring for grandchildrenproviding helpmarket work
FUNCTIONALLY LIMITED
0
1
2
GRESITATCHFRNLDEDKSE
271
How Do European Older Adults Use Their Time?
brevity, but are available upon request) These patterns are suggesting that the effects at-tributed to „age“ can be as a matter of fact caused by other variables like health status (not in vain, chronological time elapses exogenously to individuals).
Tables 5A.23 and 5A.24 in Appendix address the allocation of time among these ac-tivities by marital status and living arrangements, showing that single respondents and respondents who are part of a couple are more likely to be working if they have children still living with them. Consistent with our intuition, single respondents living with children are more likely to spend the time devoted to non-market activities by taking care of their grandchildren than by providing help to others outside their household.
Conclusions
• SHARE allows us to jointly investigate the allocation of time to both market and non-market activities along different dimensions. Time spent during a typical day varies considerably across countries, even after gender, age, marital status, living arrange-ments and health status are conditioned out. Social norms and institutional arrange-ments may explain part of the variability we have documented.
• The contribution to economic activity by older adults is by no means limited to market work. The SHARE data allow us to account for about twenty percent of available daily time of the total population, and for about forty percent of available daily time of the working population.
• The amount of hours spent helping others or looking after grandchildren is not trivial. To the extent that if they were not provided by the respondents, these services should be bought in the marketplace, the economic value of these non-market activities is of a relevant magnitude.
ReferencesGauthier, A. and T. M. Smeeding. 2003. Time Use at Older Ages: Cross-National Differences. Research on
Aging 25 (3):247-278.
Gershuny, J., A. S. Harvey, and J. Merz. 2004. Editors‘ Introduction. Electronic International Journal of Time
Use Research 1 (1):I-II.
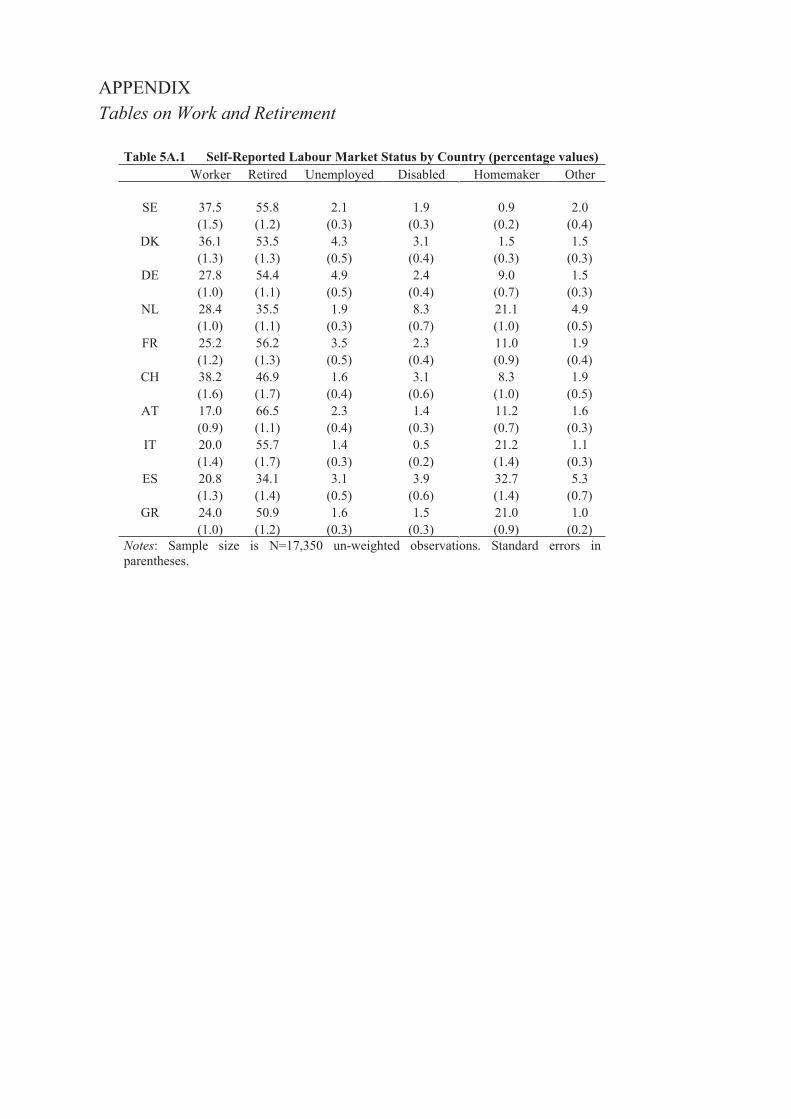
APPENDIXTables on Work and Retirement
Table 5A.1 Self-Reported Labour Market Status by Country (percentage values) Worker Retired Unemployed Disabled Homemaker Other
SE 37.5 55.8 2.1 1.9 0.9 2.0 (1.5) (1.2) (0.3) (0.3) (0.2) (0.4)
DK 36.1 53.5 4.3 3.1 1.5 1.5 (1.3) (1.3) (0.5) (0.4) (0.3) (0.3)
DE 27.8 54.4 4.9 2.4 9.0 1.5 (1.0) (1.1) (0.5) (0.4) (0.7) (0.3)
NL 28.4 35.5 1.9 8.3 21.1 4.9 (1.0) (1.1) (0.3) (0.7) (1.0) (0.5)
FR 25.2 56.2 3.5 2.3 11.0 1.9 (1.2) (1.3) (0.5) (0.4) (0.9) (0.4)
CH 38.2 46.9 1.6 3.1 8.3 1.9 (1.6) (1.7) (0.4) (0.6) (1.0) (0.5)
AT 17.0 66.5 2.3 1.4 11.2 1.6 (0.9) (1.1) (0.4) (0.3) (0.7) (0.3)
IT 20.0 55.7 1.4 0.5 21.2 1.1 (1.4) (1.7) (0.3) (0.2) (1.4) (0.3)
ES 20.8 34.1 3.1 3.9 32.7 5.3 (1.3) (1.4) (0.5) (0.6) (1.4) (0.7)
GR 24.0 50.9 1.6 1.5 21.0 1.0 (1.0) (1.2) (0.3) (0.3) (0.9) (0.2)
Notes: Sample size is N=17,350 un-weighted observations. Standard errors in parentheses.
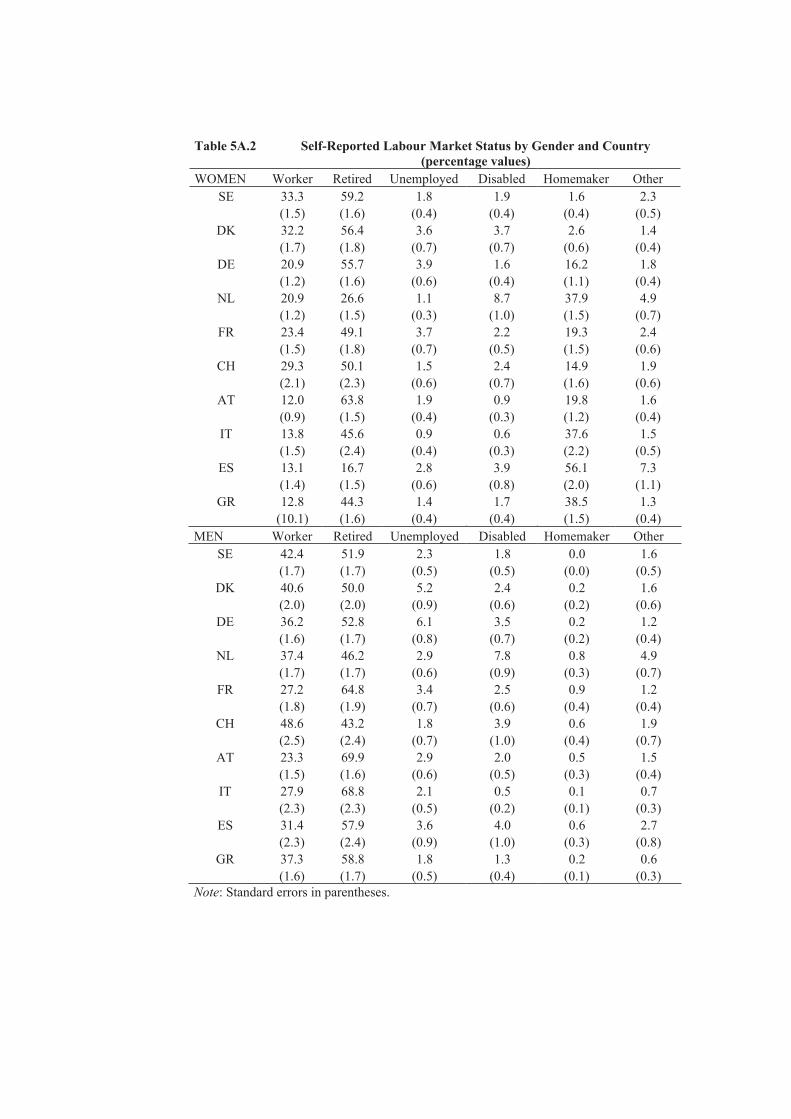
Table 5A.2 Self-Reported Labour Market Status by Gender and Country (percentage values)
WOMEN Worker Retired Unemployed Disabled Homemaker Other SE 33.3 59.2 1.8 1.9 1.6 2.3
(1.5) (1.6) (0.4) (0.4) (0.4) (0.5) DK 32.2 56.4 3.6 3.7 2.6 1.4
(1.7) (1.8) (0.7) (0.7) (0.6) (0.4) DE 20.9 55.7 3.9 1.6 16.2 1.8
(1.2) (1.6) (0.6) (0.4) (1.1) (0.4) NL 20.9 26.6 1.1 8.7 37.9 4.9
(1.2) (1.5) (0.3) (1.0) (1.5) (0.7) FR 23.4 49.1 3.7 2.2 19.3 2.4
(1.5) (1.8) (0.7) (0.5) (1.5) (0.6) CH 29.3 50.1 1.5 2.4 14.9 1.9
(2.1) (2.3) (0.6) (0.7) (1.6) (0.6) AT 12.0 63.8 1.9 0.9 19.8 1.6
(0.9) (1.5) (0.4) (0.3) (1.2) (0.4) IT 13.8 45.6 0.9 0.6 37.6 1.5 (1.5) (2.4) (0.4) (0.3) (2.2) (0.5)
ES 13.1 16.7 2.8 3.9 56.1 7.3 (1.4) (1.5) (0.6) (0.8) (2.0) (1.1)
GR 12.8 44.3 1.4 1.7 38.5 1.3 (10.1) (1.6) (0.4) (0.4) (1.5) (0.4)
MEN Worker Retired Unemployed Disabled Homemaker Other SE 42.4 51.9 2.3 1.8 0.0 1.6
(1.7) (1.7) (0.5) (0.5) (0.0) (0.5) DK 40.6 50.0 5.2 2.4 0.2 1.6
(2.0) (2.0) (0.9) (0.6) (0.2) (0.6) DE 36.2 52.8 6.1 3.5 0.2 1.2
(1.6) (1.7) (0.8) (0.7) (0.2) (0.4) NL 37.4 46.2 2.9 7.8 0.8 4.9
(1.7) (1.7) (0.6) (0.9) (0.3) (0.7) FR 27.2 64.8 3.4 2.5 0.9 1.2
(1.8) (1.9) (0.7) (0.6) (0.4) (0.4) CH 48.6 43.2 1.8 3.9 0.6 1.9
(2.5) (2.4) (0.7) (1.0) (0.4) (0.7) AT 23.3 69.9 2.9 2.0 0.5 1.5
(1.5) (1.6) (0.6) (0.5) (0.3) (0.4) IT 27.9 68.8 2.1 0.5 0.1 0.7 (2.3) (2.3) (0.5) (0.2) (0.1) (0.3)
ES 31.4 57.9 3.6 4.0 0.6 2.7 (2.3) (2.4) (0.9) (1.0) (0.3) (0.8)
GR 37.3 58.8 1.8 1.3 0.2 0.6 (1.6) (1.7) (0.5) (0.4) (0.1) (0.3)
Note: Standard errors in parentheses.

Table 5A.3 Self-Reported Labour Market Status by Gender, Country and Age Classes (percentage values)
SE DK DE NL FR CH AT IT ES GRWOMEN Age 50-54 Worker 76.1 79.9 69.4 56.7 66.4 72.6 54.8 50.4 41.9 37.0 Retired 10.9 6.3 2.5 0.4 0.7 1.1 12.6 5.9 2.4 13.4 All other 13.0 13.8 28.1 43.0 32.9 26.3 32.6 43.7 55.8 49.6 Age 55-59 Worker 72.6 66.0 45.9 40.9 50.0 54.7 22.6 24.0 26.3 24.1 Retired 12.8 9.6 7.6 1.7 10.7 3.6 45.7 16.2 2.6 24.0 All other 14.7 24.4 46.5 57.4 39.3 41.7 31.7 59.9 71.1 52.0 Age 60-64 Worker 55.2 17.9 14.3 12.3 14.1 29.0 3.2 8.4 13.0 15.1 Retired 31.2 70.9 52.5 11.8 57.9 39.7 75.5 59.7 9.1 30.8 All other 13.6 11.3 33.2 75.9 28.1 31.3 21.4 31.9 77.9 54.1 Age 65+ Worker 0.9 2.9 1.1 0.3 0.0 2.1 0.8 3.0 0.9 0.2 Retired 97.3 92.5 85.2 52.5 79.0 90.4 78.4 60.7 26.5 65.2 All other 1.8 4.6 13.7 47.1 21.0 7.5 20.7 36.3 72.6 34.7MEN Age 50-54 Worker 88.9 77.4 80.9 81.7 82.5 85.7 71.9 78.5 70.4 87.1 Retired 2.4 6.7 1.5 0.0 4.9 0.0 10.8 14.5 7.4 8.2 All other 8.7 15.8 17.6 18.3 12.6 14.3 17.3 7.0 22.2 4.8 Age 55-59 Worker 73.9 69.8 70.2 67.6 51.5 86.7 53.7 46.2 72.8 66.2 Retired 13.7 9.8 8.7 6.8 21.9 5.3 31.6 50.6 12.4 28.3 All other 12.5 20.4 21.1 25.6 26.7 8.0 14.7 3.2 14.8 5.6 Age 60-64 Worker 60.7 42.2 28.8 22.1 4.1 55.0 7.1 18.8 31.2 39.8 Retired 30.0 51.8 52.3 39.7 92.8 29.3 88.5 74.3 49.6 53.2 All other 9.3 6.0 19.0 38.2 3.1 15.7 4.4 6.9 13.3 6.9 Age 65+ Worker 2.0 2.9 2.4 1.7 0.3 4.7 0.3 3.4 0.3 3.0 Retired 97.6 95.6 97.4 97.3 98.7 93.9 98.8 95.9 97.8 95.2 All other 0.4 1.5 0.2 1.1 1.0 1.4 0.9 0.8 1.9 1.8TOTAL Age 50-54 Worker 82.7 78.6 75.3 68.8 74.3 79.1 63.9 63.9 55.5 60.7 Retired 6.6 6.5 2.0 0.2 2.7 0.5 11.6 10.0 4.8 10.9 All other 10.8 14.9 22.8 31.1 23.0 20.3 24.5 26.1 39.7 28.4 Age 55-59 Worker 73.2 67.7 58.6 53.9 50.6 70.6 35.9 35.5 47.2 45.5 Retired 13.2 9.7 8.2 4.2 15.5 4.4 39.7 33.9 7.0 26.2 All other 13.6 22.6 33.3 41.9 33.9 25.0 24.4 30.6 45.8 28.3 Age 60-64 Worker 57.9 30.0 21.2 17.0 9.5 42.2 5.1 13.0 21.1 27.3 Retired 30.6 61.3 52.4 25.3 73.9 34.4 81.7 66.1 27.2 41.8 All other 11.5 8.7 26.4 57.7 16.6 23.4 13.3 20.9 51.7 30.9 Age 65+ Worker 1.4 2.9 1.6 0.9 0.1 3.2 0.7 3.2 0.6 1.4 Retired 97.4 93.8 90.0 70.9 87.7 91.8 86.8 74.5 54.2 77.8 All other 1.2 3.3 8.4 28.2 12.2 5.0 12.5 22.4 45.2 20.8Note: Sample size is N=17,350 un-weighted observations.
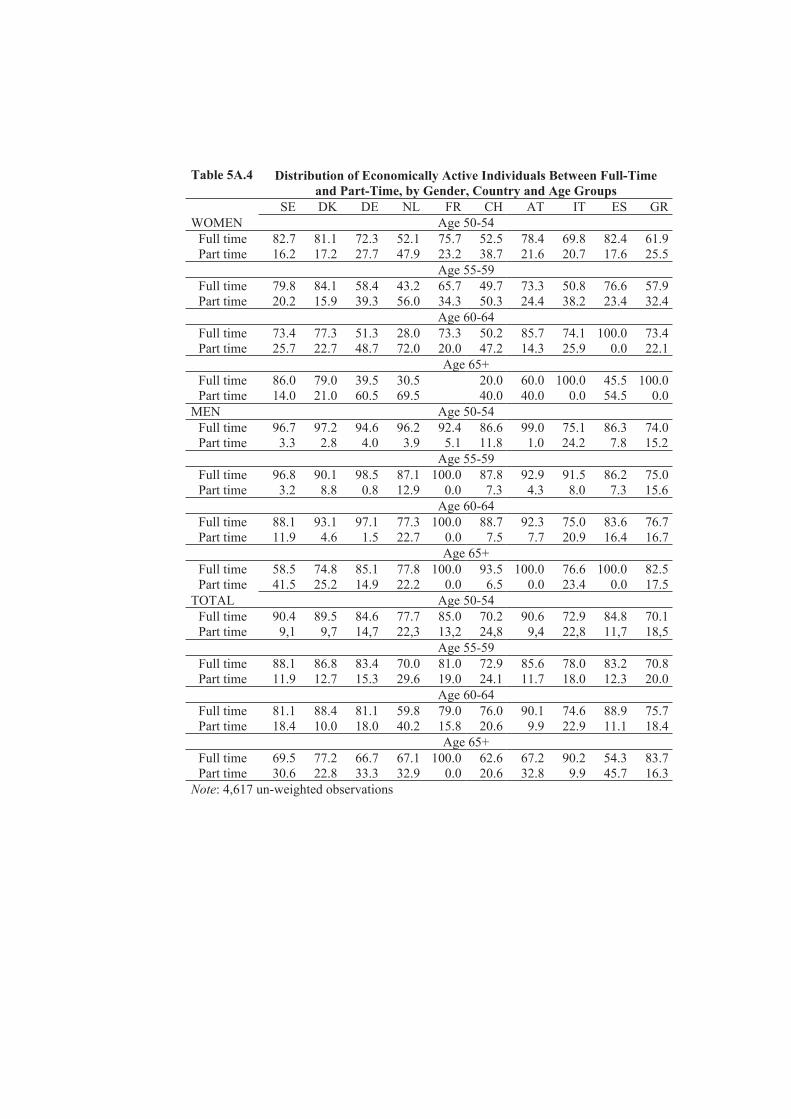
Table 5A.4 Distribution of Economically Active Individuals Between Full-Time and Part-Time, by Gender, Country and Age Groups
SE DK DE NL FR CH AT IT ES GR WOMEN Age 50-54
Full time 82.7 81.1 72.3 52.1 75.7 52.5 78.4 69.8 82.4 61.9 Part time 16.2 17.2 27.7 47.9 23.2 38.7 21.6 20.7 17.6 25.5
Age 55-59 Full time 79.8 84.1 58.4 43.2 65.7 49.7 73.3 50.8 76.6 57.9 Part time 20.2 15.9 39.3 56.0 34.3 50.3 24.4 38.2 23.4 32.4
Age 60-64 Full time 73.4 77.3 51.3 28.0 73.3 50.2 85.7 74.1 100.0 73.4 Part time 25.7 22.7 48.7 72.0 20.0 47.2 14.3 25.9 0.0 22.1
Age 65+ Full time 86.0 79.0 39.5 30.5 20.0 60.0 100.0 45.5 100.0 Part time 14.0 21.0 60.5 69.5 40.0 40.0 0.0 54.5 0.0
MEN Age 50-54 Full time 96.7 97.2 94.6 96.2 92.4 86.6 99.0 75.1 86.3 74.0 Part time 3.3 2.8 4.0 3.9 5.1 11.8 1.0 24.2 7.8 15.2
Age 55-59 Full time 96.8 90.1 98.5 87.1 100.0 87.8 92.9 91.5 86.2 75.0 Part time 3.2 8.8 0.8 12.9 0.0 7.3 4.3 8.0 7.3 15.6
Age 60-64 Full time 88.1 93.1 97.1 77.3 100.0 88.7 92.3 75.0 83.6 76.7 Part time 11.9 4.6 1.5 22.7 0.0 7.5 7.7 20.9 16.4 16.7
Age 65+ Full time 58.5 74.8 85.1 77.8 100.0 93.5 100.0 76.6 100.0 82.5 Part time 41.5 25.2 14.9 22.2 0.0 6.5 0.0 23.4 0.0 17.5
TOTAL Age 50-54 Full time 90.4 89.5 84.6 77.7 85.0 70.2 90.6 72.9 84.8 70.1 Part time 9,1 9,7 14,7 22,3 13,2 24,8 9,4 22,8 11,7 18,5
Age 55-59 Full time 88.1 86.8 83.4 70.0 81.0 72.9 85.6 78.0 83.2 70.8 Part time 11.9 12.7 15.3 29.6 19.0 24.1 11.7 18.0 12.3 20.0
Age 60-64 Full time 81.1 88.4 81.1 59.8 79.0 76.0 90.1 74.6 88.9 75.7 Part time 18.4 10.0 18.0 40.2 15.8 20.6 9.9 22.9 11.1 18.4
Age 65+ Full time 69.5 77.2 66.7 67.1 100.0 62.6 67.2 90.2 54.3 83.7 Part time 30.6 22.8 33.3 32.9 0.0 20.6 32.8 9.9 45.7 16.3 Note: 4,617 un-weighted observations

Table 5A.5 Economically Active Individuals in the Sub-Sample of “Healthy” Individuals, by country
Worker Retired but work Retired All other SE 48.6 4.7 41.4 5.2
(1.6) (0.7) (1.6) (0.8) DK 0.0 4.2 39.0 7.5
(1.9) (0.7) (1.8) (1.0) DE 42.3 2.9 39.1 15.7
(1.6) (0.6) (1.6) (1.1) NL 35.1 1.7 33.0 30.1
(1.5) (0.4) (1.5) (1.4) FR 33.0 0.6 50.1 16.4
(1.6) (0.3) (1.7) (1.3) CH 46.3 9.9 32.4 11.5
(2.1) (1.2) (1.9) (1.3) AT 22.5 4.5 58.0 15.1
(1.3) (0.7) (1.6) (1.1) IT 26.9 3.7 49.1 20.3
(1.9) (0.7) (2.1) (1.8) ES 31.5 1.3 29.7 37.4
(2.0) (0.4) (1.8) (2.0) GR 31.3 9.5 33.9 24.1
(1.3) (0.8) (1.4) (1.2)
SE DK DE NL FR CH AT IT ES GR Age 60<
Worker 87.4 84.9 76.9 70.9 68.9 82.5 55.0 51.3 64.2 58.0 (1.7) (1.9) (1.9) (2.1) (2.3) (2.3) (2.5) (3.2) (3.0) (2.0)
Retired but working 1.5 0.0 0.3 0.8 0.3 1.5 3.9 3.1 0.0 4.2
(0.6) (0.0) (0.3) (0.4) (0.3) (0.8) (1.0) (0.1) (0.0) (0.8)Retired 2.2 2.2 2.5 1.5 9.4 1.3 18.8 21.5 2.3 11.0
(0.8) (0.8) (0.7) (0.5) (1.5) (0.7) (2.0) (2.7) (0.8) (1.3)All others 8.9 13.0 20.3 26.8 21.5 14.7 22.3 24.0 33.5 26.4
(1.5) (1.8) (1.8) (2.0) (2.1) (2.2) (2.1) (2.4) (3.0) (1.8) Age 60>
Worker 20.4 17.4 10.5 7.0 3.4 16.1 2.6 9.0 7.5 11.4 (1.6) (1.9) (1.3) (1.0) (0.8) (2.0) (0.6) (1.6) (1.4) (1.3)
Retired but working 7.1 7.9 5.2 2.5 0.8 16.9 4.8 4.1 2.3 13.5
(1.1) (1.4) (1.0) (0.6) (0.4) (2.1) (0.9) (0.9) (0.8) (0.1)Retired 69.8 72.0 72.7 57.8 83.7 58.2 81.9 69.3 49.9 50.9
(1.9) (2.3) (1.9) (2.0) (1.8) (2.7) (1.5) (2.8) (2.6) (1.9)All others 2.6 2.7 11.6 32.7 12.1 8.8 10.6 17.6 40.3 22.4
(0.7) (0.8) (1.4) (1.9) (1.6) (1.5) (1.2) (2.6) (2.6) (1.6)Note: Sample size is N=9,844 un-weighted observations (total respondents in “good health”).
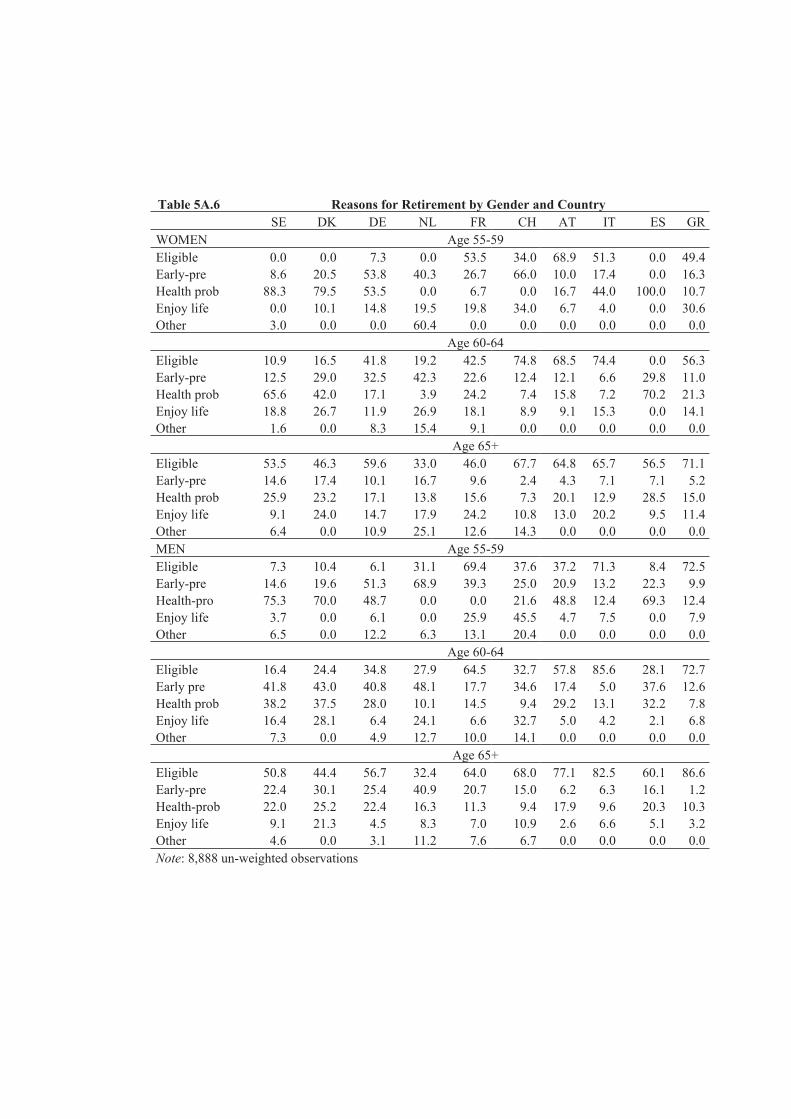
Table 5A.6 Reasons for Retirement by Gender and Country SE DK DE NL FR CH AT IT ES GRWOMEN Age 55-59 Eligible 0.0 0.0 7.3 0.0 53.5 34.0 68.9 51.3 0.0 49.4Early-pre 8.6 20.5 53.8 40.3 26.7 66.0 10.0 17.4 0.0 16.3Health prob 88.3 79.5 53.5 0.0 6.7 0.0 16.7 44.0 100.0 10.7Enjoy life 0.0 10.1 14.8 19.5 19.8 34.0 6.7 4.0 0.0 30.6Other 3.0 0.0 0.0 60.4 0.0 0.0 0.0 0.0 0.0 0.0 Age 60-64 Eligible 10.9 16.5 41.8 19.2 42.5 74.8 68.5 74.4 0.0 56.3Early-pre 12.5 29.0 32.5 42.3 22.6 12.4 12.1 6.6 29.8 11.0Health prob 65.6 42.0 17.1 3.9 24.2 7.4 15.8 7.2 70.2 21.3Enjoy life 18.8 26.7 11.9 26.9 18.1 8.9 9.1 15.3 0.0 14.1Other 1.6 0.0 8.3 15.4 9.1 0.0 0.0 0.0 0.0 0.0 Age 65+ Eligible 53.5 46.3 59.6 33.0 46.0 67.7 64.8 65.7 56.5 71.1Early-pre 14.6 17.4 10.1 16.7 9.6 2.4 4.3 7.1 7.1 5.2Health prob 25.9 23.2 17.1 13.8 15.6 7.3 20.1 12.9 28.5 15.0Enjoy life 9.1 24.0 14.7 17.9 24.2 10.8 13.0 20.2 9.5 11.4Other 6.4 0.0 10.9 25.1 12.6 14.3 0.0 0.0 0.0 0.0MEN Age 55-59 Eligible 7.3 10.4 6.1 31.1 69.4 37.6 37.2 71.3 8.4 72.5Early-pre 14.6 19.6 51.3 68.9 39.3 25.0 20.9 13.2 22.3 9.9Health-pro 75.3 70.0 48.7 0.0 0.0 21.6 48.8 12.4 69.3 12.4Enjoy life 3.7 0.0 6.1 0.0 25.9 45.5 4.7 7.5 0.0 7.9Other 6.5 0.0 12.2 6.3 13.1 20.4 0.0 0.0 0.0 0.0 Age 60-64 Eligible 16.4 24.4 34.8 27.9 64.5 32.7 57.8 85.6 28.1 72.7Early pre 41.8 43.0 40.8 48.1 17.7 34.6 17.4 5.0 37.6 12.6Health prob 38.2 37.5 28.0 10.1 14.5 9.4 29.2 13.1 32.2 7.8Enjoy life 16.4 28.1 6.4 24.1 6.6 32.7 5.0 4.2 2.1 6.8Other 7.3 0.0 4.9 12.7 10.0 14.1 0.0 0.0 0.0 0.0 Age 65+ Eligible 50.8 44.4 56.7 32.4 64.0 68.0 77.1 82.5 60.1 86.6Early-pre 22.4 30.1 25.4 40.9 20.7 15.0 6.2 6.3 16.1 1.2Health-prob 22.0 25.2 22.4 16.3 11.3 9.4 17.9 9.6 20.3 10.3Enjoy life 9.1 21.3 4.5 8.3 7.0 10.9 2.6 6.6 5.1 3.2Other 4.6 0.0 3.1 11.2 7.6 6.7 0.0 0.0 0.0 0.0Note: 8,888 un-weighted observations
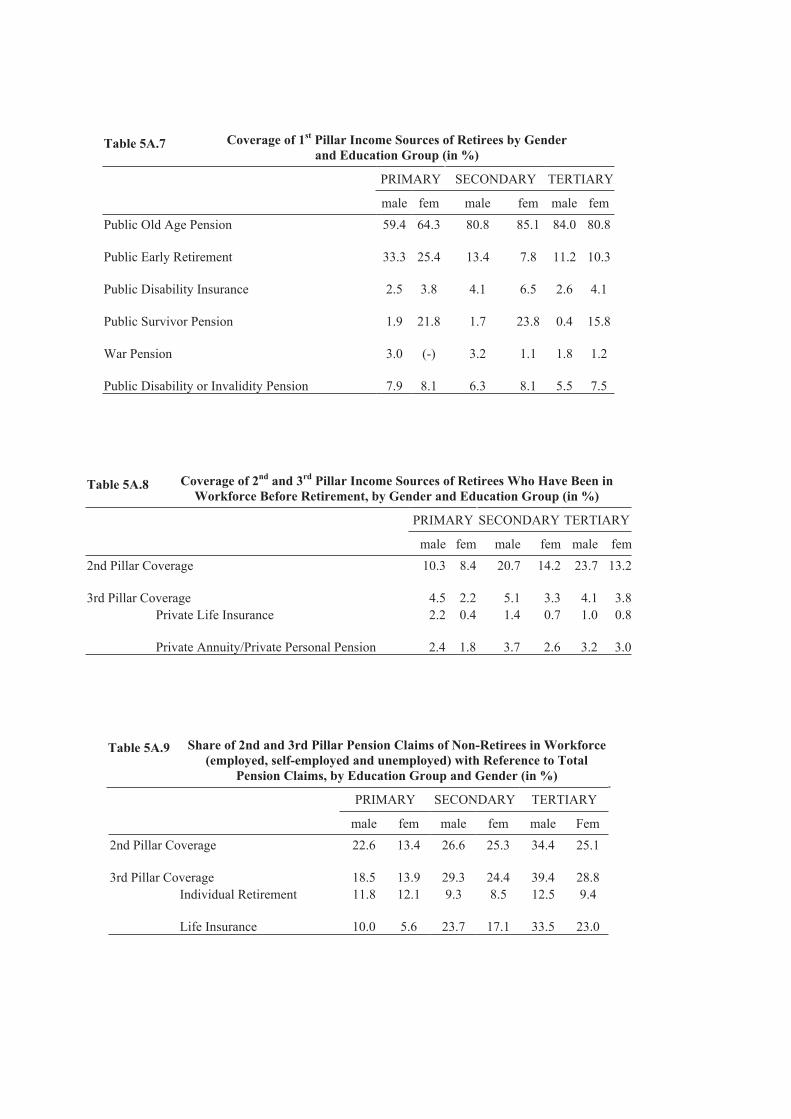
Table 5A.7 Coverage of 1st Pillar Income Sources of Retirees by Gender and Education Group (in %)
PRIMARY SECONDARY TERTIARY
male fem male fem male fem Public Old Age Pension 59.4 64.3 80.8 85.1 84.0 80.8 Public Early Retirement 33.3 25.4 13.4 7.8 11.2 10.3 Public Disability Insurance 2.5 3.8 4.1 6.5 2.6 4.1 Public Survivor Pension 1.9 21.8 1.7 23.8 0.4 15.8 War Pension 3.0 (-) 3.2 1.1 1.8 1.2 Public Disability or Invalidity Pension 7.9 8.1 6.3 8.1 5.5 7.5
Table 5A.8 Coverage of 2nd and 3rd Pillar Income Sources of Retirees Who Have Been in Workforce Before Retirement, by Gender and Education Group (in %)
PRIMARY SECONDARY TERTIARY
male fem male fem male fem2nd Pillar Coverage 10.3 8.4 20.7 14.2 23.7 13.2
3rd Pillar Coverage 4.5 2.2 5.1 3.3 4.1 3.8Private Life Insurance 2.2 0.4 1.4 0.7 1.0 0.8
Private Annuity/Private Personal Pension 2.4 1.8 3.7 2.6 3.2 3.0
Table 5A.9 Share of 2nd and 3rd Pillar Pension Claims of Non-Retirees in Workforce (employed, self-employed and unemployed) with Reference to Total
Pension Claims, by Education Group and Gender (in %)
PRIMARY SECONDARY TERTIARY
male fem male fem male Fem 2nd Pillar Coverage 22.6 13.4 26.6 25.3 34.4 25.1
3rd Pillar Coverage 18.5 13.9 29.3 24.4 39.4 28.8
Individual Retirement 11.8 12.1 9.3 8.5 12.5 9.4
Life Insurance 10.0 5.6 23.7 17.1 33.5 23.0
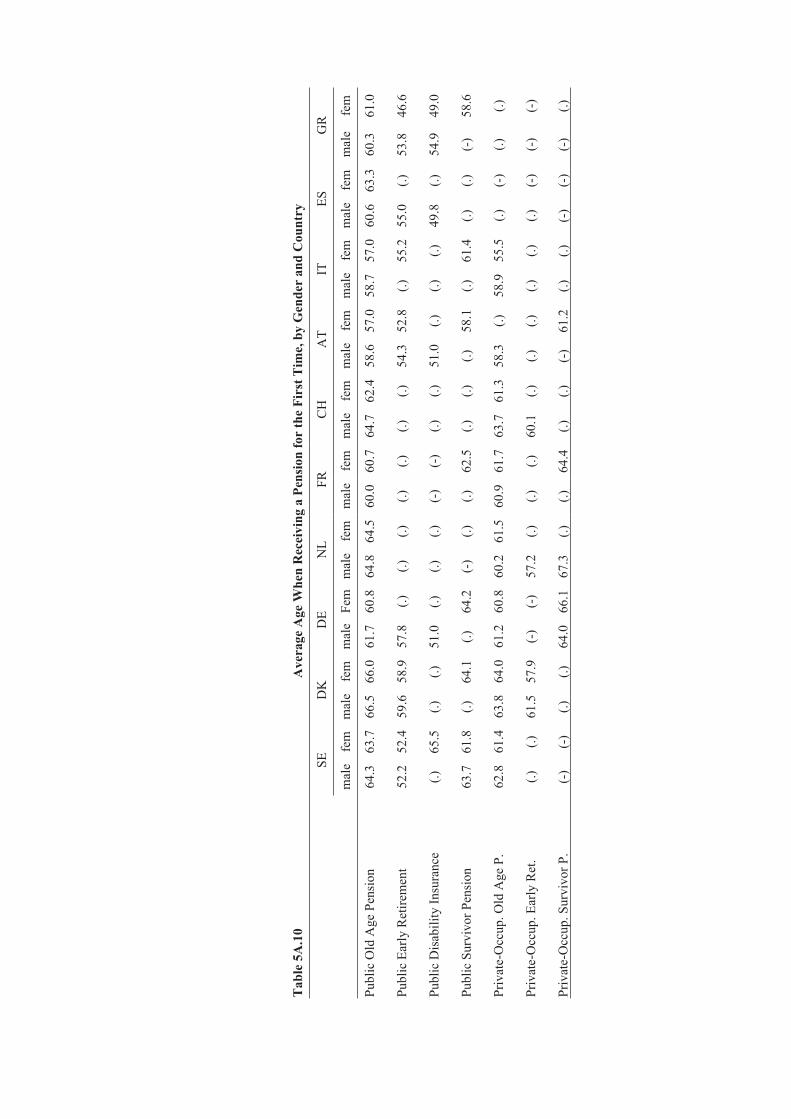
Tab
le 5
A.1
0A
vera
ge A
ge W
hen
Rec
eivi
ng a
Pen
sion
for
the
Firs
t Tim
e, b
y G
ende
r an
d C
ount
ry
SE
D
KD
EN
LFR
CH
AT
ITES
GR
mal
efe
mm
ale
fem
mal
eFe
mm
ale
fem
mal
e fe
m
mal
efe
mm
ale
fem
mal
efe
mm
ale
fem
mal
efe
m
Publ
ic O
ld A
ge P
ensi
on
64.3
63.7
66.5
66.0
61.7
60.8
64.8
64.5
60.0
60
.7
64.7
62.4
58.6
57.0
58.7
57.0
60.6
63.3
60.3
61
.0
Publ
ic E
arly
Ret
irem
ent
52.2
52.4
59.6
58.9
57.8
(.)
(.)
(.)
(.)
(.)
(.)
(.)
54.3
52.8
(.)
55.2
55.0
(.)
53.8
46
.6
Pu
blic
Dis
abili
ty In
sura
nce
(.)
65.5
(.)
(.)
51.0
(.)
(.)
(.)
(-)
(-)
(.)
(.)
51.0
(.)
(.)
(.)
49.8
(.)
54.9
49
.0
Publ
ic S
urvi
vor P
ensi
on
63.7
61.8
(.)
64.1
(.)
64.2
(-)
(.)
(.)
62.5
(.)
(.)
(.)
58
.1(.)
61
.4(.)
(.)
(-
) 58
.6
Pr
ivat
e-O
ccup
. Old
Age
P.
62.8
61.4
63.8
64.0
61.2
60.8
60.2
61.5
60.9
61
.7
63.7
61.3
58.3
(.)
58.9
55.5
(.)
(-)
(.)
(.)
Priv
ate-
Occ
up. E
arly
Ret
. (.)
(.)
61
.557
.9(-
) (-
) 57
.2(.)
(.)
(.)
60
.1(.)
(.)
(.)
(.)
(.)
(.)
(-
) (-
) (-
)
Pr
ivat
e-O
ccup
. Sur
vivo
r P.
(-)
(-)
(.)
(.)
64.0
66.1
67.3
(.)
(.)
64.4
(.)
(.)
(-
) 61
.2(.)
(.)
(-
) (-
) (-
) (.)
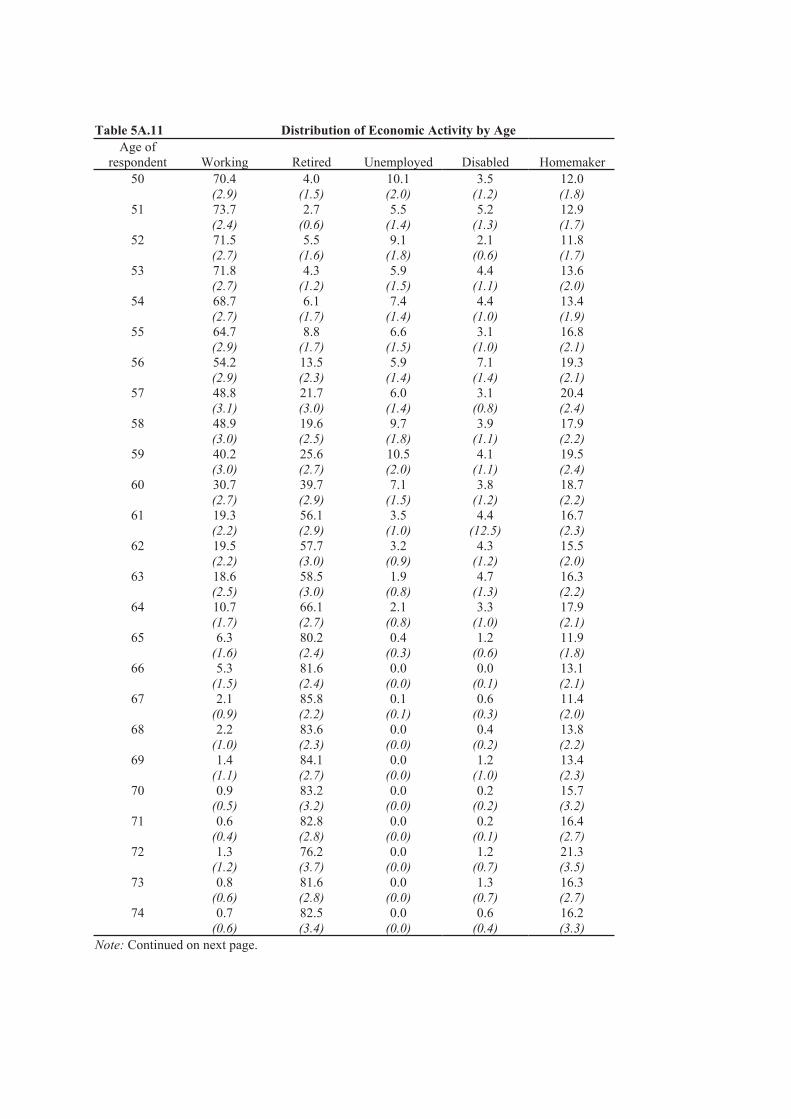
Table 5A.11 Distribution of Economic Activity by Age Age of
respondent Working Retired Unemployed Disabled Homemaker 50 70.4 4.0 10.1 3.5 12.0
(2.9) (1.5) (2.0) (1.2) (1.8) 51 73.7 2.7 5.5 5.2 12.9
(2.4) (0.6) (1.4) (1.3) (1.7) 52 71.5 5.5 9.1 2.1 11.8
(2.7) (1.6) (1.8) (0.6) (1.7)53 71.8 4.3 5.9 4.4 13.6
(2.7) (1.2) (1.5) (1.1) (2.0)54 68.7 6.1 7.4 4.4 13.4
(2.7) (1.7) (1.4) (1.0) (1.9)55 64.7 8.8 6.6 3.1 16.8
(2.9) (1.7) (1.5) (1.0) (2.1)56 54.2 13.5 5.9 7.1 19.3
(2.9) (2.3) (1.4) (1.4) (2.1)57 48.8 21.7 6.0 3.1 20.4
(3.1) (3.0) (1.4) (0.8) (2.4)58 48.9 19.6 9.7 3.9 17.9
(3.0) (2.5) (1.8) (1.1) (2.2)59 40.2 25.6 10.5 4.1 19.5
(3.0) (2.7) (2.0) (1.1) (2.4)60 30.7 39.7 7.1 3.8 18.7
(2.7) (2.9) (1.5) (1.2) (2.2)61 19.3 56.1 3.5 4.4 16.7
(2.2) (2.9) (1.0) (12.5) (2.3)62 19.5 57.7 3.2 4.3 15.5
(2.2) (3.0) (0.9) (1.2) (2.0)63 18.6 58.5 1.9 4.7 16.3
(2.5) (3.0) (0.8) (1.3) (2.2)64 10.7 66.1 2.1 3.3 17.9
(1.7) (2.7) (0.8) (1.0) (2.1)65 6.3 80.2 0.4 1.2 11.9
(1.6) (2.4) (0.3) (0.6) (1.8)66 5.3 81.6 0.0 0.0 13.1
(1.5) (2.4) (0.0) (0.1) (2.1)67 2.1 85.8 0.1 0.6 11.4
(0.9) (2.2) (0.1) (0.3) (2.0)68 2.2 83.6 0.0 0.4 13.8
(1.0) (2.3) (0.0) (0.2) (2.2)69 1.4 84.1 0.0 1.2 13.4
(1.1) (2.7) (0.0) (1.0) (2.3)70 0.9 83.2 0.0 0.2 15.7
(0.5) (3.2) (0.0) (0.2) (3.2)71 0.6 82.8 0.0 0.2 16.4
(0.4) (2.8) (0.0) (0.1) (2.7)72 1.3 76.2 0.0 1.2 21.3
(1.2) (3.7) (0.0) (0.7) (3.5)73 0.8 81.6 0.0 1.3 16.3
(0.6) (2.8) (0.0) (0.7) (2.7)74 0.7 82.5 0.0 0.6 16.2
(0.6) (3.4) (0.0) (0.4) (3.3)Note: Continued on next page.
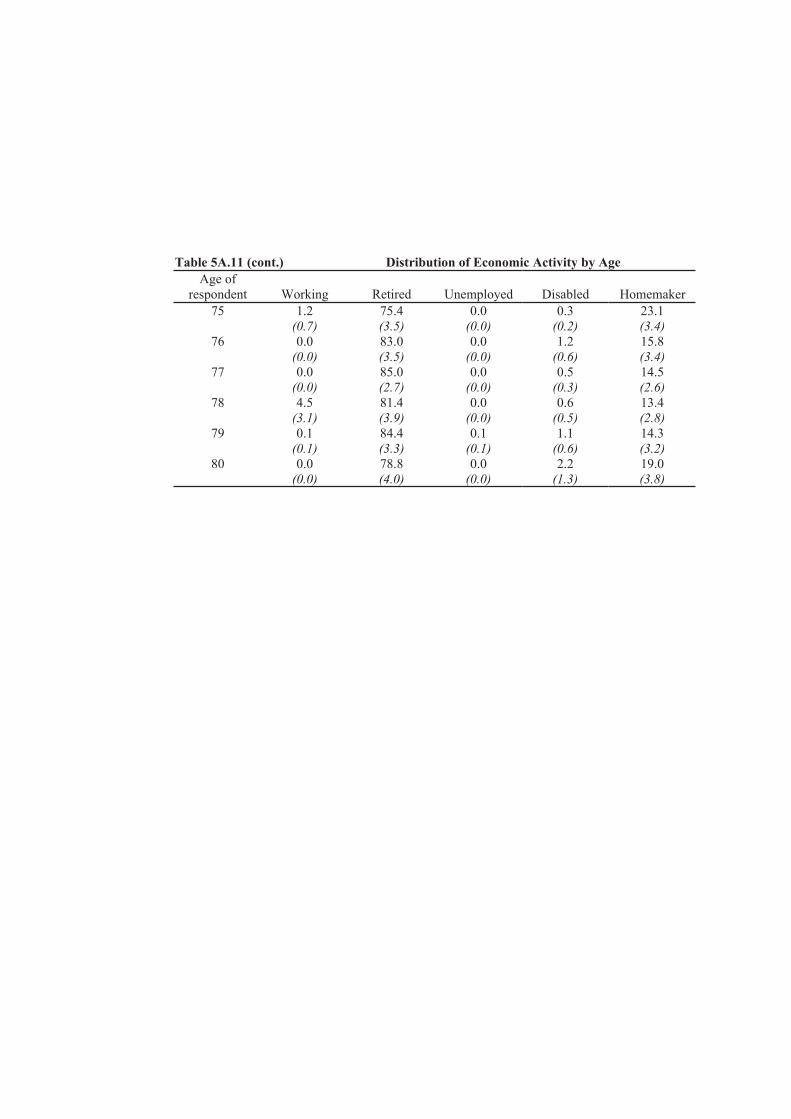
Table 5A.11 (cont.) Distribution of Economic Activity by Age Age of
respondent Working Retired Unemployed Disabled Homemaker 75 1.2 75.4 0.0 0.3 23.1
(0.7) (3.5) (0.0) (0.2) (3.4)76 0.0 83.0 0.0 1.2 15.8
(0.0) (3.5) (0.0) (0.6) (3.4)77 0.0 85.0 0.0 0.5 14.5
(0.0) (2.7) (0.0) (0.3) (2.6)78 4.5 81.4 0.0 0.6 13.4
(3.1) (3.9) (0.0) (0.5) (2.8)79 0.1 84.4 0.1 1.1 14.3
(0.1) (3.3) (0.1) (0.6) (3.2)80 0.0 78.8 0.0 2.2 19.0
(0.0) (4.0) (0.0) (1.3) (3.8)
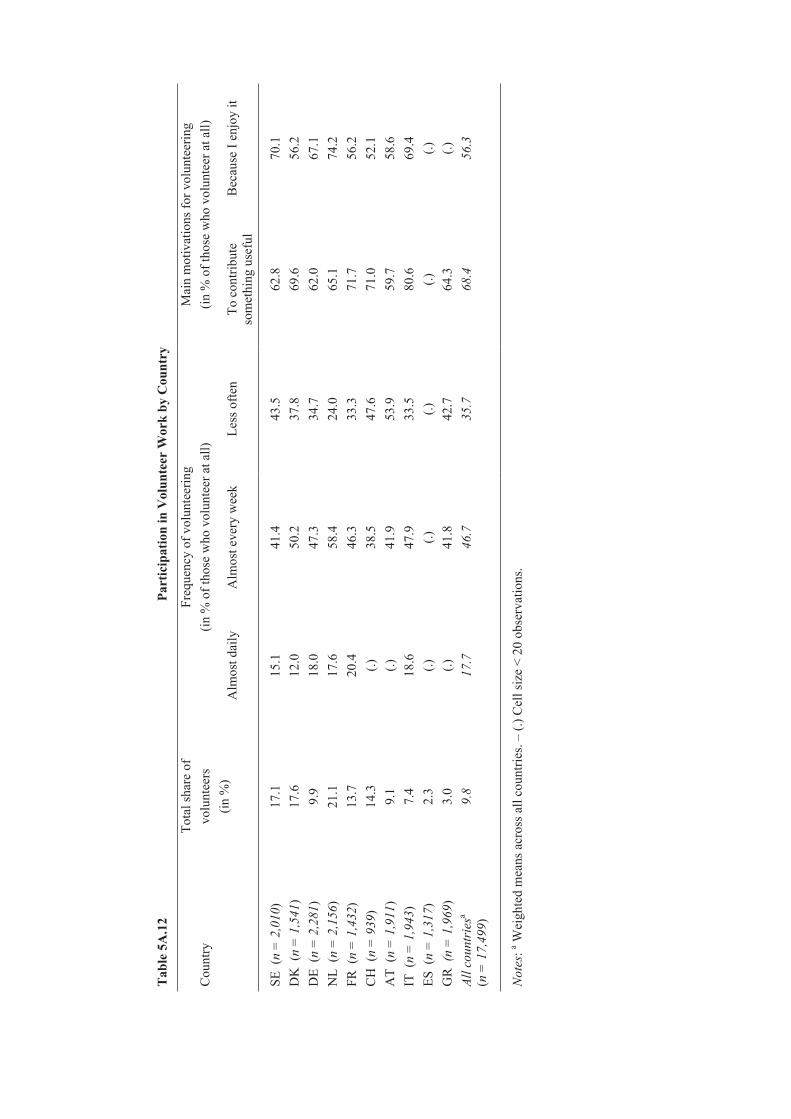
Tab
le 5
A.1
2 Pa
rtic
ipat
ion
in V
olun
teer
Wor
k by
Cou
ntry
Cou
ntry
Tota
l sha
re o
f vo
lunt
eers
Freq
uenc
y of
vol
unte
erin
g (in
% o
f tho
se w
ho v
olun
teer
at a
ll)
Mai
n m
otiv
atio
ns fo
r vol
unte
erin
g (in
% o
f tho
se w
ho v
olun
teer
at a
ll)
(in
%)
Alm
ost d
aily
A
lmos
t eve
ry w
eek
Less
ofte
n To
con
tribu
te
som
ethi
ng u
sefu
l B
ecau
se I
enjo
y it
SE (
n =
2,0
10)
17.1
15
.1
41.4
43
.5
62.8
70
.1
DK
(n
= 1
,541
) 17
.6
12.0
50
.2
37.8
69
.6
56.2
DE
(n =
2,2
81)
9.9
18.0
47
.3
34.7
62
.0
67.1
N
L (n
= 2
,156
) 21
.1
17.6
58
.4
24.0
65
.1
74.2
FR
(n
= 1
,432
) 13
.7
20.4
46
.3
33.3
71
.7
56.2
C
H (
n =
939
) 14
.3
(.)
38.5
47
.6
71.0
52
.1
AT
(n =
1,9
11)
9.1
(.)
41.9
53
.9
59.7
58
.6
IT (
n =
1,9
43)
7.4
18.6
47
.9
33.5
80
.6
69.4
ES
(n
= 1
,317
) 2.
3 (.)
(.)
(.)
(.)
(.)
G
R(n
= 1
,969
) 3.
0 (.)
41
.8
42.7
64
.3
(.)
All c
ount
ries
a
(n =
17,
499)
9.8
17.7
46
.7
35.7
68
.4
56.3
Not
es:a W
eigh
ted
mea
ns a
cros
s all
coun
tries
. – (.
) Cel
l siz
e <
20 o
bser
vatio
ns.

Tab
le 5
A.1
3 V
olun
teer
ing
and
Info
rmal
Hel
p or
Car
e an
d Pa
rtic
ipat
ion
in O
rgan
isat
ions
, All
Cou
ntri
es
Cou
ntry
Info
rmal
hel
p Pa
rtici
patio
n in
V
olun
teer
ing
(in %
) am
ong
thos
e w
ho …
H
elp
or c
are
…
Parti
cipa
tion
…
or
car
e(to
tal i
n %
) or
gani
satio
ns(to
tal i
n %
) …
hel
p or
car
e …
par
ticip
ate
… a
mon
g th
ose
who
vol
unte
er (i
n %
)
SE
40.6
34
.4
24.2
30
.9
57.7
62
.7
DK
34
.2
39.9
23
.9
27.4
47
.2
63.1
D
E 19
.4
33.1
15
.3
21.2
30
.2
71.1
N
L 32
.0
37.5
29
.1
33.9
44
.6
61.0
FR
28
.8
23.3
22
.6
30.6
50
.2
55.1
C
H
25.2
49
.1
24.9
21
.3
44.7
74
.1
AT
24.8
36
.3
16.3
17
.3
45.2
70
.6
IT
15.7
12
.4
15.4
19
.6
33.0
33
.1
ES
7.3
20.1
(.)
(.)
(.)
(.)
G
R
16.7
45
.0
8.6
4.7
48.4
71
.9Al
l cou
ntri
esa
20.6
27
.1
18.8
21
.2
40.1
59
.2
Not
es:a W
eigh
ted
mea
ns a
cros
s all
coun
tries
. – (.
) Cel
l siz
e <
20 o
bser
vatio
ns.
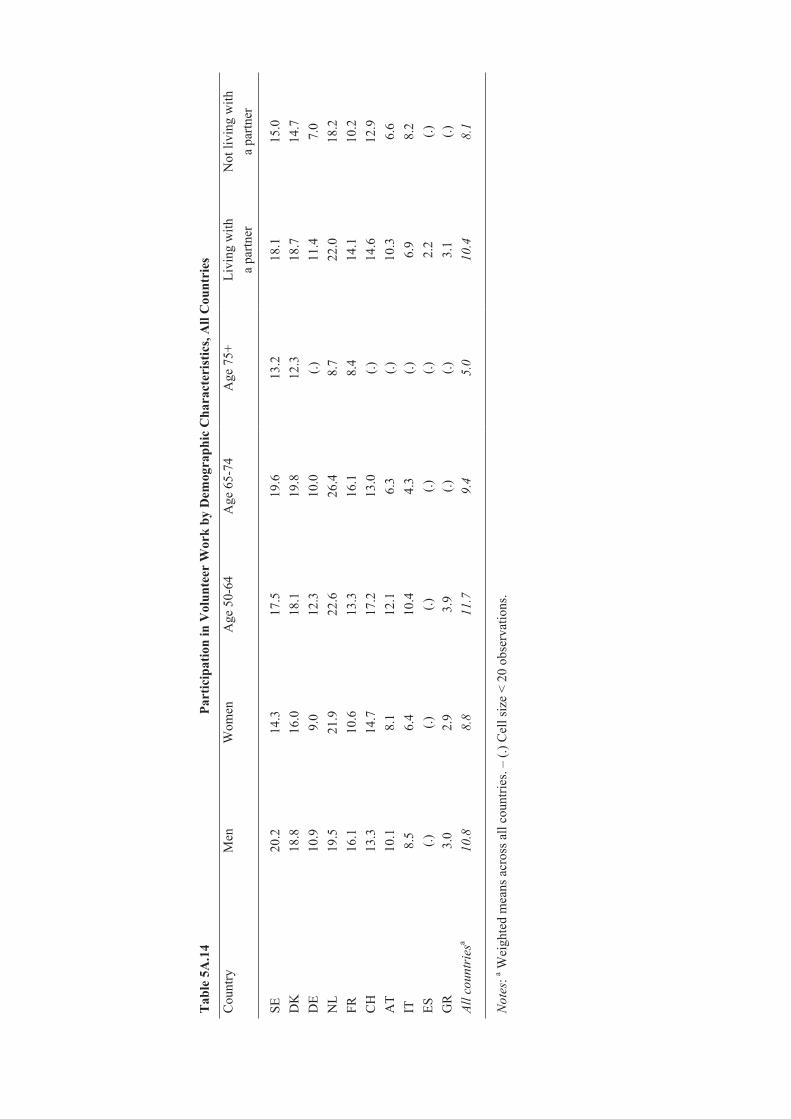
Tab
le 5
A.1
4 Pa
rtic
ipat
ion
in V
olun
teer
Wor
k by
Dem
ogra
phic
Cha
ract
eris
tics,
All
Cou
ntri
es
Cou
ntry
Men
Wom
en
Age
50-
64
Age
65-
74
Age
75+
Li
ving
with
a
partn
er
Not
livi
ng w
ith
a pa
rtner
SE
20.2
14
.3
17.5
19
.6
13.2
18
.1
15.0
D
K
18.8
16
.0
18.1
19
.8
12.3
18
.7
14.7
D
E 10
.9
9.0
12.3
10
.0
(.)
11.4
7.
0 N
L 19
.5
21.9
22
.6
26.4
8.
7 22
.0
18.2
FR
16
.1
10.6
13
.3
16.1
8.
4 14
.1
10.2
C
H
13.3
14
.7
17.2
13
.0
(.)
14.6
12
.9
AT
10.1
8.
1 12
.1
6.3
(.)
10.3
6.
6 IT
8.
5 6.
4 10
.4
4.3
(.)
6.9
8.2
ES
(.)
(.)
(.)
(.)
(.)
2.2
(.)
GR
3.
0 2.
9 3.
9 (.)
(.)
3.
1 (.)
Al
l cou
ntri
esa
10.8
8.
8 11
.7
9.4
5.0
10.4
8.
1
Not
es:a W
eigh
ted
mea
ns a
cros
s all
coun
tries
. – (.
) Cel
l siz
e <
20 o
bser
vatio
ns.
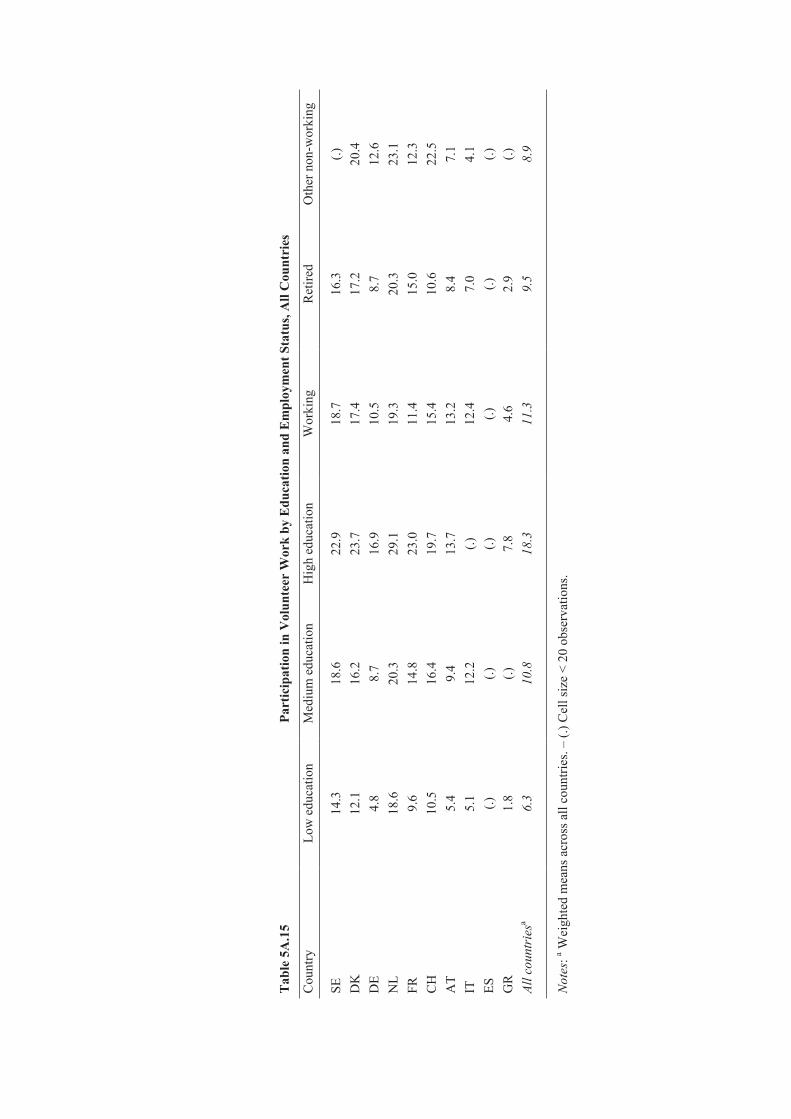
Tab
le 5
A.1
5 Pa
rtic
ipat
ion
in V
olun
teer
Wor
k by
Edu
catio
n an
d E
mpl
oym
ent S
tatu
s, A
ll C
ount
ries
Cou
ntry
Low
edu
catio
n M
ediu
m e
duca
tion
Hig
h ed
ucat
ion
Wor
king
R
etire
d O
ther
non
-wor
king
SE
14.3
18
.6
22.9
18
.7
16.3
(.)
DK
12
.1
16.2
23
.7
17.4
17
.2
20.4
D
E 4.
8 8.
7 16
.9
10.5
8.
7 12
.6
NL
18.6
20
.3
29.1
19
.3
20.3
23
.1
FR
9.6
14.8
23
.0
11.4
15
.0
12.3
C
H
10.5
16
.4
19.7
15
.4
10.6
22
.5
AT
5.4
9.4
13.7
13
.2
8.4
7.1
IT
5.1
12.2
(.)
12
.4
7.0
4.1
ES
(.)
(.)
(.)
(.)
(.)
(.)
GR
1.
8 (.)
7.
8 4.
6 2.
9 (.)
Al
l cou
ntri
esa
6.3
10.8
18
.3
11.3
9.
5 8.
9
Not
es:a W
eigh
ted
mea
ns a
cros
s all
coun
tries
. – (.
) Cel
l siz
e <
20 o
bser
vatio
ns.
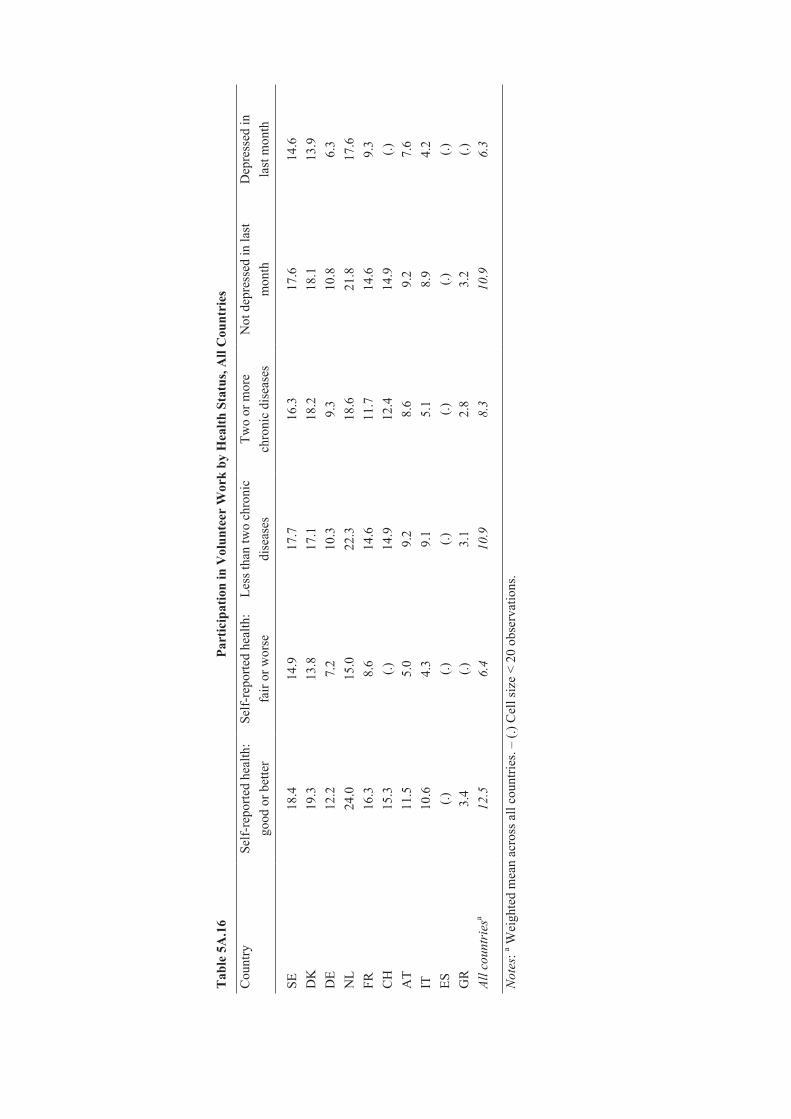
Tab
le 5
A.1
6 Pa
rtic
ipat
ion
in V
olun
teer
Wor
k by
Hea
lth S
tatu
s, A
ll C
ount
ries
Cou
ntry
Se
lf-re
porte
d he
alth
:go
od o
r bet
ter
Self-
repo
rted
heal
th:
fair
or w
orse
Le
ss th
an tw
o ch
roni
c di
seas
esTw
o or
mor
e ch
roni
c di
seas
es
Not
dep
ress
ed in
last
m
onth
Dep
ress
ed in
la
st m
onth
SE
18.4
14
.9
17.7
16
.3
17.6
14
.6
DK
19
.3
13.8
17
.1
18.2
18
.1
13.9
D
E 12
.2
7.2
10.3
9.
3 10
.8
6.3
NL
24.0
15
.0
22.3
18
.6
21.8
17
.6
FR
16.3
8.
6 14
.6
11.7
14
.6
9.3
CH
15
.3
(.)
14.9
12
.4
14.9
(.)
A
T 11
.5
5.0
9.2
8.6
9.2
7.6
IT
10.6
4.
3 9.
1 5.
1 8.
9 4.
2 ES
(.)
(.)
(.)
(.)
(.)
(.)
G
R
3.4
(.)
3.1
2.8
3.2
(.)
All c
ount
ries
a 12
.5
6.4
10.9
8.
3 10
.9
6.3
Not
es:a W
eigh
ted
mea
n ac
ross
all
coun
tries
. – (.
) Cel
l siz
e <
20 o
bser
vatio
ns.

Table 5A.17 Prevalence of Market/Non-Market Work by Gender and Country (%) SE DK DE NL FR CH AT IT ES GR
WOMEN Market work 38.7 36.1 26.1 24.8 24.3 41.2 19.0 16.3 17.8 29.9
(1.6) (1.8) (1.3) (1.3) (1.5) (2.3) (1.2) (1.6) (1.6) (1.4)Providing help 39.9 43.2 26.9 37.5 32.0 36.2 24.1 23.0 15.1 20.4
(1.6) (1.8) (1.3) (1.5) (1.7) (2.2) (1.3) (1.8) (1.4) (1.3)Caring for 34.7 39.8 24.7 34.9 35.0 21.5 26.9 25.7 27.1 25.7
Grandchildren (1.5) (1.8) (1.3) (1.5) (1.7) (1.9) (1.3) (1.9) (1.7) (1.4)MEN
Market work 48.3 48.6 40.5 41.9 29.5 61.7 29.5 34.0 35.5 51.5 (1.7) (2.0) (1.6) (1.7) (1.8) (2.3) (1.6) (2.4) (2.3) (1.7)
Providing help 42.1 50.0 37.4 44.2 31.2 33.6 26.3 24.8 12.9 18.2 (1.7) (2.0) (1.6) (1.7) (1.8) (2.3) (1.6) (2.1) (1.6) (1.3)
Caring for 24.5 31.1 20.7 32.0 28.9 17.3 24.7 18.8 20.5 18.7Grandchildren (1.4) (1.8) (1.2) (1.5) (1.8) (1.8) (1.5) (1.7) (1.7) (1.4)
TOTAL Market work 43.1 41.9 32.5 32.5 26.6 50.7 23.7 24.0 25.3 39.8
(1.2) (1.3) (1.1) (1.1) (1.2) (1.7) (1.0) (1.4) (1.4) (1.1)Providing help 40.9 46.3 31.6 40.5 31.7 35.0 25.1 23.8 14.2 19.4
(1.2) (1.3) (1.0) (1.1) (1.3) (1.6) (1.0) (1.4) (1.0) (0.9)Caring for 30.0 35.8 22.9 33.6 32.2 19.5 25.9 22.7 24.3 22.5
Grandchildren (1.1) (1.3) (0.9) (1.1) (1.3) (1.3) (1.0) (1.3) (1.2) (1.0)Notes: Sample size is N= 17,269 un-weighted observations. In Tables 5A.17-5A.24 we use the Version 0 release of SHARE data. All figures—except for sample sizes—are weighted. Figures refer to the whole population. However, the option of babysitting grandchildren is conditional on the person actually having grandchildren. Standard errors are in parentheses.
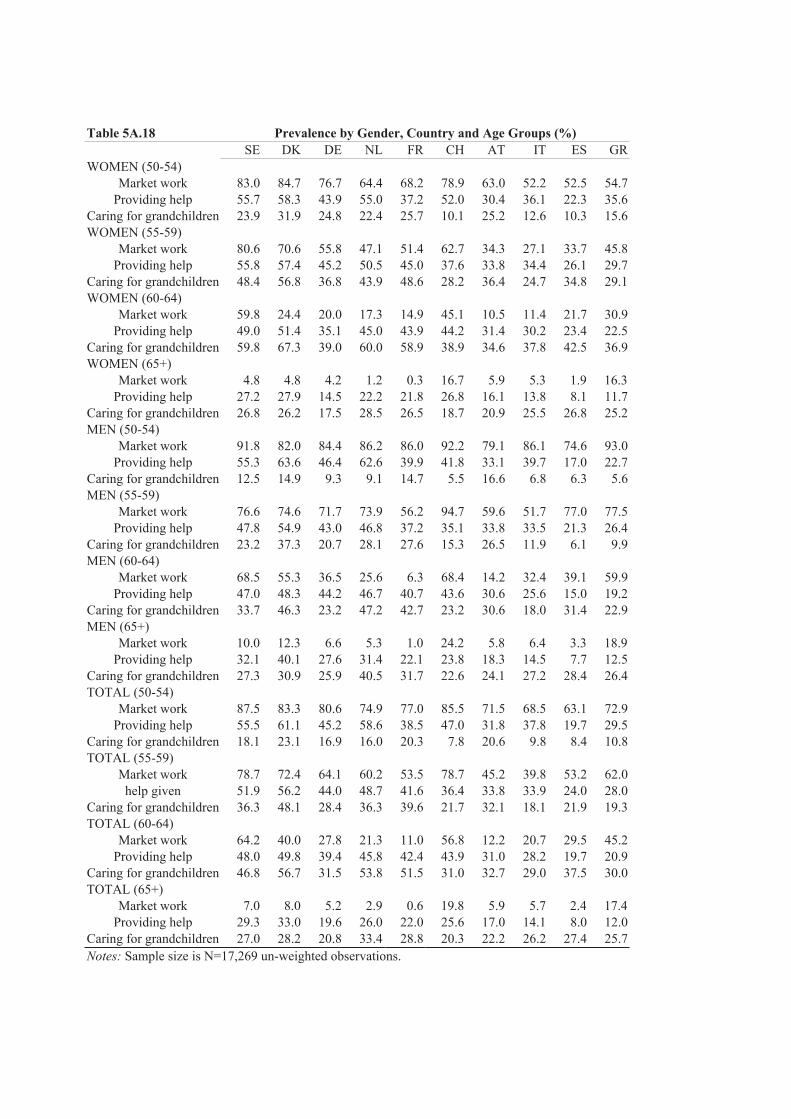
Table 5A.18 Prevalence by Gender, Country and Age Groups (%) SE DK DE NL FR CH AT IT ES GRWOMEN (50-54)
Market work 83.0 84.7 76.7 64.4 68.2 78.9 63.0 52.2 52.5 54.7Providing help 55.7 58.3 43.9 55.0 37.2 52.0 30.4 36.1 22.3 35.6
Caring for grandchildren 23.9 31.9 24.8 22.4 25.7 10.1 25.2 12.6 10.3 15.6WOMEN (55-59)
Market work 80.6 70.6 55.8 47.1 51.4 62.7 34.3 27.1 33.7 45.8Providing help 55.8 57.4 45.2 50.5 45.0 37.6 33.8 34.4 26.1 29.7
Caring for grandchildren 48.4 56.8 36.8 43.9 48.6 28.2 36.4 24.7 34.8 29.1WOMEN (60-64)
Market work 59.8 24.4 20.0 17.3 14.9 45.1 10.5 11.4 21.7 30.9Providing help 49.0 51.4 35.1 45.0 43.9 44.2 31.4 30.2 23.4 22.5
Caring for grandchildren 59.8 67.3 39.0 60.0 58.9 38.9 34.6 37.8 42.5 36.9WOMEN (65+)
Market work 4.8 4.8 4.2 1.2 0.3 16.7 5.9 5.3 1.9 16.3Providing help 27.2 27.9 14.5 22.2 21.8 26.8 16.1 13.8 8.1 11.7
Caring for grandchildren 26.8 26.2 17.5 28.5 26.5 18.7 20.9 25.5 26.8 25.2MEN (50-54)
Market work 91.8 82.0 84.4 86.2 86.0 92.2 79.1 86.1 74.6 93.0Providing help 55.3 63.6 46.4 62.6 39.9 41.8 33.1 39.7 17.0 22.7
Caring for grandchildren 12.5 14.9 9.3 9.1 14.7 5.5 16.6 6.8 6.3 5.6MEN (55-59)
Market work 76.6 74.6 71.7 73.9 56.2 94.7 59.6 51.7 77.0 77.5Providing help 47.8 54.9 43.0 46.8 37.2 35.1 33.8 33.5 21.3 26.4
Caring for grandchildren 23.2 37.3 20.7 28.1 27.6 15.3 26.5 11.9 6.1 9.9MEN (60-64)
Market work 68.5 55.3 36.5 25.6 6.3 68.4 14.2 32.4 39.1 59.9Providing help 47.0 48.3 44.2 46.7 40.7 43.6 30.6 25.6 15.0 19.2
Caring for grandchildren 33.7 46.3 23.2 47.2 42.7 23.2 30.6 18.0 31.4 22.9MEN (65+)
Market work 10.0 12.3 6.6 5.3 1.0 24.2 5.8 6.4 3.3 18.9Providing help 32.1 40.1 27.6 31.4 22.1 23.8 18.3 14.5 7.7 12.5
Caring for grandchildren 27.3 30.9 25.9 40.5 31.7 22.6 24.1 27.2 28.4 26.4TOTAL (50-54)
Market work 87.5 83.3 80.6 74.9 77.0 85.5 71.5 68.5 63.1 72.9Providing help 55.5 61.1 45.2 58.6 38.5 47.0 31.8 37.8 19.7 29.5
Caring for grandchildren 18.1 23.1 16.9 16.0 20.3 7.8 20.6 9.8 8.4 10.8TOTAL (55-59)
Market work 78.7 72.4 64.1 60.2 53.5 78.7 45.2 39.8 53.2 62.0help given 51.9 56.2 44.0 48.7 41.6 36.4 33.8 33.9 24.0 28.0
Caring for grandchildren 36.3 48.1 28.4 36.3 39.6 21.7 32.1 18.1 21.9 19.3TOTAL (60-64)
Market work 64.2 40.0 27.8 21.3 11.0 56.8 12.2 20.7 29.5 45.2Providing help 48.0 49.8 39.4 45.8 42.4 43.9 31.0 28.2 19.7 20.9
Caring for grandchildren 46.8 56.7 31.5 53.8 51.5 31.0 32.7 29.0 37.5 30.0TOTAL (65+)
Market work 7.0 8.0 5.2 2.9 0.6 19.8 5.9 5.7 2.4 17.4Providing help 29.3 33.0 19.6 26.0 22.0 25.6 17.0 14.1 8.0 12.0
Caring for grandchildren 27.0 28.2 20.8 33.4 28.8 20.3 22.2 26.2 27.4 25.7Notes: Sample size is N=17,269 un-weighted observations.
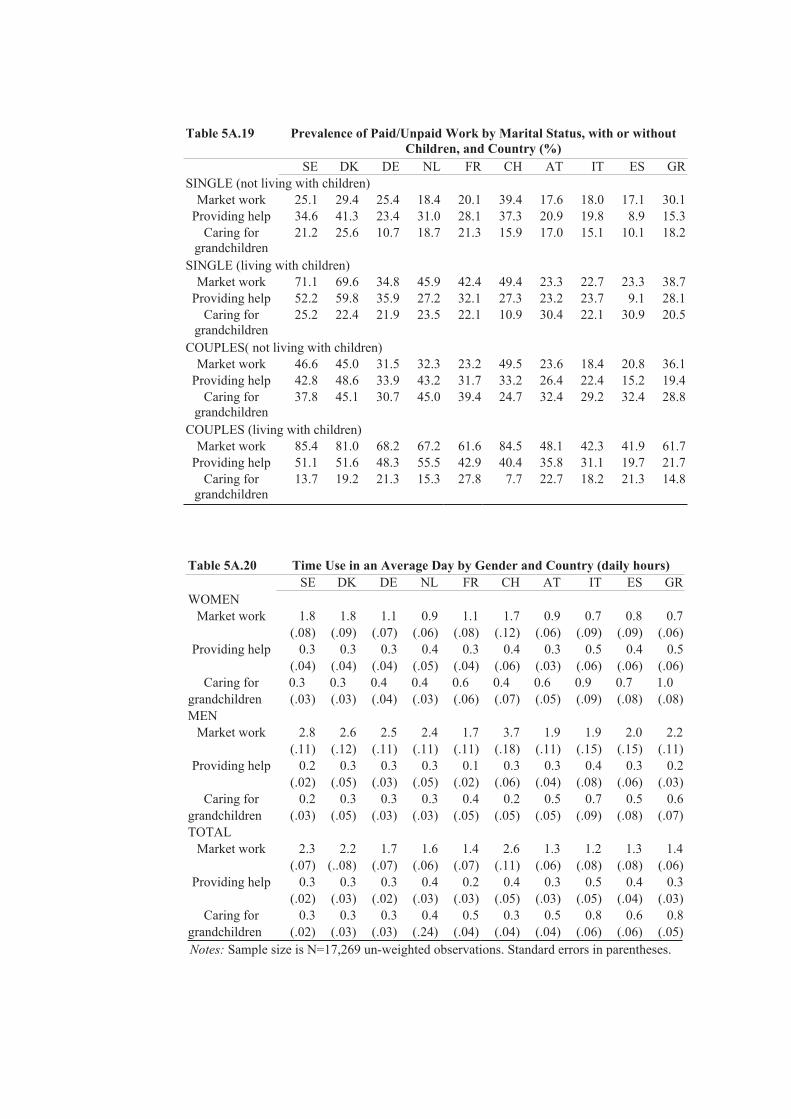
Table 5A.19 Prevalence of Paid/Unpaid Work by Marital Status, with or without Children, and Country (%)
SE DK DE NL FR CH AT IT ES GR SINGLE (not living with children)
Market work 25.1 29.4 25.4 18.4 20.1 39.4 17.6 18.0 17.1 30.1 Providing help 34.6 41.3 23.4 31.0 28.1 37.3 20.9 19.8 8.9 15.3
Caring for grandchildren
21.2 25.6 10.7 18.7 21.3 15.9 17.0 15.1 10.1 18.2
SINGLE (living with children) Market work 71.1 69.6 34.8 45.9 42.4 49.4 23.3 22.7 23.3 38.7
Providing help 52.2 59.8 35.9 27.2 32.1 27.3 23.2 23.7 9.1 28.1 Caring for
grandchildren25.2 22.4 21.9 23.5 22.1 10.9 30.4 22.1 30.9 20.5
COUPLES( not living with children) Market work 46.6 45.0 31.5 32.3 23.2 49.5 23.6 18.4 20.8 36.1
Providing help 42.8 48.6 33.9 43.2 31.7 33.2 26.4 22.4 15.2 19.4 Caring for
grandchildren37.8 45.1 30.7 45.0 39.4 24.7 32.4 29.2 32.4 28.8
COUPLES (living with children) Market work 85.4 81.0 68.2 67.2 61.6 84.5 48.1 42.3 41.9 61.7
Providing help 51.1 51.6 48.3 55.5 42.9 40.4 35.8 31.1 19.7 21.7 Caring for
grandchildren13.7 19.2 21.3 15.3 27.8 7.7 22.7 18.2 21.3 14.8
Table 5A.20 Time Use in an Average Day by Gender and Country (daily hours) SE DK DE NL FR CH AT IT ES GR WOMEN
Market work 1.8 1.8 1.1 0.9 1.1 1.7 0.9 0.7 0.8 0.7 (.08) (.09) (.07) (.06) (.08) (.12) (.06) (.09) (.09) (.06)
Providing help 0.3 0.3 0.3 0.4 0.3 0.4 0.3 0.5 0.4 0.5 (.04) (.04) (.04) (.05) (.04) (.06) (.03) (.06) (.06) (.06)
Caring for 0.3 0.3 0.4 0.4 0.6 0.4 0.6 0.9 0.7 1.0 grandchildren (.03) (.03) (.04) (.03) (.06) (.07) (.05) (.09) (.08) (.08) MEN
Market work 2.8 2.6 2.5 2.4 1.7 3.7 1.9 1.9 2.0 2.2 (.11) (.12) (.11) (.11) (.11) (.18) (.11) (.15) (.15) (.11)
Providing help 0.2 0.3 0.3 0.3 0.1 0.3 0.3 0.4 0.3 0.2 (.02) (.05) (.03) (.05) (.02) (.06) (.04) (.08) (.06) (.03)
Caring for 0.2 0.3 0.3 0.3 0.4 0.2 0.5 0.7 0.5 0.6 grandchildren (.03) (.05) (.03) (.03) (.05) (.05) (.05) (.09) (.08) (.07) TOTAL
Market work 2.3 2.2 1.7 1.6 1.4 2.6 1.3 1.2 1.3 1.4 (.07) (..08) (.07) (.06) (.07) (.11) (.06) (.08) (.08) (.06)
Providing help 0.3 0.3 0.3 0.4 0.2 0.4 0.3 0.5 0.4 0.3 (.02) (.03) (.02) (.03) (.03) (.05) (.03) (.05) (.04) (.03)
Caring for 0.3 0.3 0.3 0.4 0.5 0.3 0.5 0.8 0.6 0.8 grandchildren (.02) (.03) (.03) (.24) (.04) (.04) (.04) (.06) (.06) (.05) Notes: Sample size is N=17,269 un-weighted observations. Standard errors in parentheses.

Table 5A.21 Allocation of Time by Country and Gender - Working (daily hours) SE DK DE NL FR CH AT IT ES GR WOMEN
Market work 4.8 4.9 4.4 3.6 4.6 4.0 4.7 4.5 4.6 2.4 (0.1) (0.1) (0.1) (0.1) (0.1) (0.2) (0.2) (0.2) (0.3) (0.2)
Providing help 0.4 0.3 0.3 0.5 0.3 0.3 0.4 0.6 0.6 0.6 (0.1) (0.1) (0.1) (0.1) (0.1) (0.1) (0.1) (0.2) (0.2) (0.1)
Caring for 0.4 0.4 0.4 0.4 0.6 0.2 0.5 0.5 0.4 0.8 grandchildren (0.1) (0.1) (0.1) (0.1) (0.1) (0.1) (0.1) (0.1) (0.1) (0.1)
MEN Market work 5.8 5.4 6.1 5.7 5.8 6.0 6.3 5.5 5.6 4.3
(0.1) (0.1) (0.1) (0.1) (0.1) (0.2) (0.1) (0.2) (0.2) (0.2) Providing help 0.2 0.4 0.3 0.3 0.1 0.2 0.3 0.5 0.1 0.2
(0.0) (0.1) (0.1) (0.1) (0.0) (0.0) (0.1) (0.2) (0.0) (0.0) Caring for 0.2 0.3 0.2 0.1 0.2 0.1 0.4 0.4 0.2 0.4
grandchildren (0.0) (0.1) (0.1) (0.0) (0.1) (0.0) (0.1) (0.2) (0.1) (0.1) TOTAL
Market work 5.3 5.2 5.3 4.8 5.2 5.1 5.6 5.1 5.2 3.5 (0.1) (0.1) (0.1) (0.1) (0.1) (0.1) (0.1) (0.2) (0.2) (0.1)
Providing help 0.3 0.3 0.3 0.3 0.2 0.2 0.3 0.5 0.3 0.4 (0.0) (0.1) (0.0) (0.0) (0.0) (0.0) (0.1) (0.1) (0.1) (0.0)
Caring for 0.3 0.3 0.3 0.2 0.4 0.2 0.5 0.4 0.3 0.6 grandchildren (0.0) (0.1) (0.0) (0.0) (0.1) (0.0) (0.1) (0.1) (0.1) (0.1) Notes: Sample size is N=5,795 un-weighted observations. Standard errors in parentheses
Table 5A.22 Allocation of Time by Country and Gender - Non Working (daily hours) SE DK DE NL FR CH AT IT ES GR WOMEN
Market work 0.0 0.0 0.0 0.0 0.0 0.0 0.0 0.0 0.0 0.0 (0.0) (0.0) (0.0) (0.0) (0.0) (0.0) (0.0) (0.0) (0.0) (0.0)
Providing help 0.2 0.3 0.3 0.4 0.3 0.5 0.1 0.4 0.4 0.4 (0.0) (0.0) (0.0) (0.1) (0.1) (0.1) (0.0) (0.1) (0.1) (0.1)
Caring for 0.2 0.3 0.4 0.4 0.6 0.5 0.6 0.9 0.7 1.0 grandchildren (0.0) (0.0) (0.0) (0.0) (0.1) (0.1) (0.1) (0.1) (0.1) (0.1)
MEN Market work 0.0 0.0 0.0 0.0 0.0 0.0 0.0 0.0 0.0 0.0
(0.0) (0.0) (0.0) (0.0) (0.0) (0.0) (0.0) (0.0) (0.0) (0.0) Providing help 0.2 0.3 0.2 0.4 0.1 0.5 0.3 0.4 0.3 0.1
(0.0) (0.1) (0.0) (0.1) (0.0) (0.1) (0.0) (0.1) (0.1) (0.0) Caring for 0.2 0.3 0.3 0.4 0.4 0.4 0.5 0.8 0.7 0.8
grandchildren (0.0) (0.1) (0.0) (0.0) (0.1) (0.1) (0.1) (0.1) (0.1) (0.1) TOTAL
Market work 0.0 0.0 0.0 0.0 0.0 0.0 0.0 0.0 0.0 0.0 (0.0) (0.0) (0.0) (0.0) (0.0) (0.0) (0.0) (0.0) (0.0) (0.0)
Providing help 0.2 0.3 0.3 0.4 0.2 0.5 0.3 0.4 0.4 0.3 (0.0) (0.0) (0.0) (0.0) (0.0) (0.1) (0.0) (0.1) (0.1) (0.0)
Caring for 0.2 0.3 0.4 0.4 0.5 0.5 0.5 0.9 0.7 0.9 grandchildren (0.0) (0.0) (0.0) (0.0) (0.0) (0.1) (0.0) (0.1) (0.1) (0.1) Notes: Sample size is N=11,474 un-weighted observations. Standard errors in parentheses
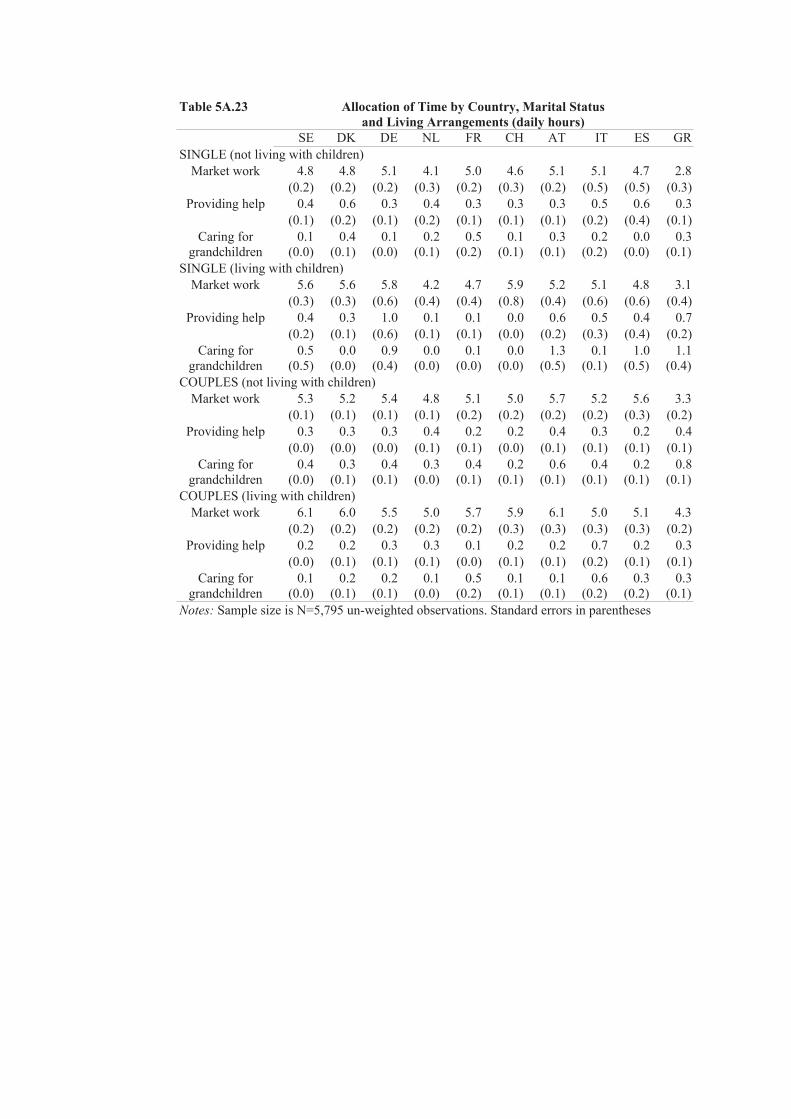
Table 5A.23 Allocation of Time by Country, Marital Status and Living Arrangements (daily hours)
SE DK DE NL FR CH AT IT ES GR SINGLE (not living with children)
Market work 4.8 4.8 5.1 4.1 5.0 4.6 5.1 5.1 4.7 2.8 (0.2) (0.2) (0.2) (0.3) (0.2) (0.3) (0.2) (0.5) (0.5) (0.3)
Providing help 0.4 0.6 0.3 0.4 0.3 0.3 0.3 0.5 0.6 0.3 (0.1) (0.2) (0.1) (0.2) (0.1) (0.1) (0.1) (0.2) (0.4) (0.1)
Caring for 0.1 0.4 0.1 0.2 0.5 0.1 0.3 0.2 0.0 0.3 grandchildren (0.0) (0.1) (0.0) (0.1) (0.2) (0.1) (0.1) (0.2) (0.0) (0.1)
SINGLE (living with children) Market work 5.6 5.6 5.8 4.2 4.7 5.9 5.2 5.1 4.8 3.1
(0.3) (0.3) (0.6) (0.4) (0.4) (0.8) (0.4) (0.6) (0.6) (0.4) Providing help 0.4 0.3 1.0 0.1 0.1 0.0 0.6 0.5 0.4 0.7
(0.2) (0.1) (0.6) (0.1) (0.1) (0.0) (0.2) (0.3) (0.4) (0.2) Caring for 0.5 0.0 0.9 0.0 0.1 0.0 1.3 0.1 1.0 1.1
grandchildren (0.5) (0.0) (0.4) (0.0) (0.0) (0.0) (0.5) (0.1) (0.5) (0.4) COUPLES (not living with children)
Market work 5.3 5.2 5.4 4.8 5.1 5.0 5.7 5.2 5.6 3.3 (0.1) (0.1) (0.1) (0.1) (0.2) (0.2) (0.2) (0.2) (0.3) (0.2)
Providing help 0.3 0.3 0.3 0.4 0.2 0.2 0.4 0.3 0.2 0.4 (0.0) (0.0) (0.0) (0.1) (0.1) (0.0) (0.1) (0.1) (0.1) (0.1)
Caring for 0.4 0.3 0.4 0.3 0.4 0.2 0.6 0.4 0.2 0.8 grandchildren (0.0) (0.1) (0.1) (0.0) (0.1) (0.1) (0.1) (0.1) (0.1) (0.1)
COUPLES (living with children) Market work 6.1 6.0 5.5 5.0 5.7 5.9 6.1 5.0 5.1 4.3
(0.2) (0.2) (0.2) (0.2) (0.2) (0.3) (0.3) (0.3) (0.3) (0.2) Providing help 0.2 0.2 0.3 0.3 0.1 0.2 0.2 0.7 0.2 0.3
(0.0) (0.1) (0.1) (0.1) (0.0) (0.1) (0.1) (0.2) (0.1) (0.1) Caring for 0.1 0.2 0.2 0.1 0.5 0.1 0.1 0.6 0.3 0.3
grandchildren (0.0) (0.1) (0.1) (0.0) (0.2) (0.1) (0.1) (0.2) (0.2) (0.1) Notes: Sample size is N=5,795 un-weighted observations. Standard errors in parentheses
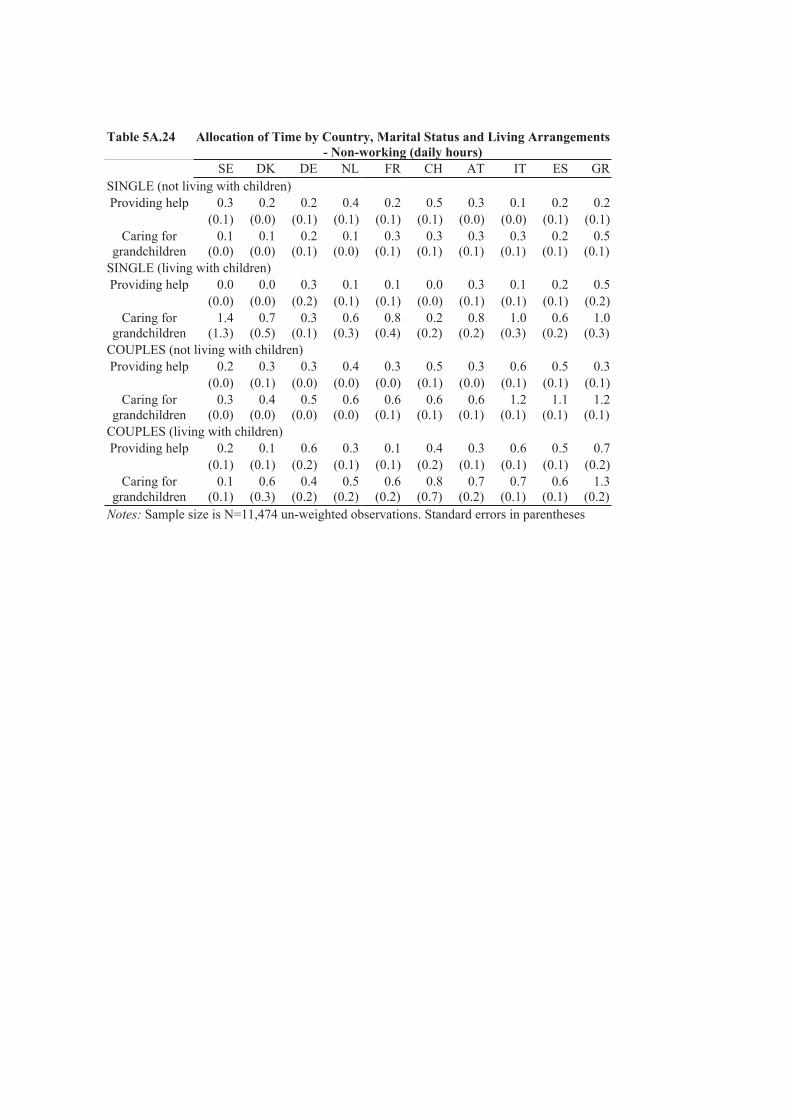
Table 5A.24 Allocation of Time by Country, Marital Status and Living Arrangements - Non-working (daily hours)
SE DK DE NL FR CH AT IT ES GR SINGLE (not living with children) Providing help 0.3 0.2 0.2 0.4 0.2 0.5 0.3 0.1 0.2 0.2
(0.1) (0.0) (0.1) (0.1) (0.1) (0.1) (0.0) (0.0) (0.1) (0.1) Caring for 0.1 0.1 0.2 0.1 0.3 0.3 0.3 0.3 0.2 0.5
grandchildren (0.0) (0.0) (0.1) (0.0) (0.1) (0.1) (0.1) (0.1) (0.1) (0.1) SINGLE (living with children) Providing help 0.0 0.0 0.3 0.1 0.1 0.0 0.3 0.1 0.2 0.5
(0.0) (0.0) (0.2) (0.1) (0.1) (0.0) (0.1) (0.1) (0.1) (0.2) Caring for 1.4 0.7 0.3 0.6 0.8 0.2 0.8 1.0 0.6 1.0
grandchildren (1.3) (0.5) (0.1) (0.3) (0.4) (0.2) (0.2) (0.3) (0.2) (0.3) COUPLES (not living with children) Providing help 0.2 0.3 0.3 0.4 0.3 0.5 0.3 0.6 0.5 0.3
(0.0) (0.1) (0.0) (0.0) (0.0) (0.1) (0.0) (0.1) (0.1) (0.1) Caring for 0.3 0.4 0.5 0.6 0.6 0.6 0.6 1.2 1.1 1.2
grandchildren (0.0) (0.0) (0.0) (0.0) (0.1) (0.1) (0.1) (0.1) (0.1) (0.1) COUPLES (living with children) Providing help 0.2 0.1 0.6 0.3 0.1 0.4 0.3 0.6 0.5 0.7
(0.1) (0.1) (0.2) (0.1) (0.1) (0.2) (0.1) (0.1) (0.1) (0.2) Caring for 0.1 0.6 0.4 0.5 0.6 0.8 0.7 0.7 0.6 1.3
grandchildren (0.1) (0.3) (0.2) (0.2) (0.2) (0.7) (0.2) (0.1) (0.1) (0.2) Notes: Sample size is N=11,474 un-weighted observations. Standard errors in parentheses