5 SOCIO- ECONOMIC STUDIES 5.1 Introductionstudentsrepo.um.edu.my/4300/10/C5.pdf · 2009; Hazra and...
46
241 5 SOCIO- ECONOMIC STUDIES 5.1 Introduction Socio-economic studies have been utilized as tools to evaluate and measure various aspects of human life. The social implications of a society are always closely related to the economic aspects that these two fields are normally merged together in studies on human behaviour. It covers issues like human diets to consumerism to commerce and the environment (Hazra and Goel, 2009; Lancaster et al., 2005; Shen, 2005; Ishikawa and Toda, 2005). The socio-economic level of a society has major implications to the environment as it influenced the utilization of earth’s resources, as well as, the generation of wastes. Natural resources have been exploited ever since human’s first existence on the planet. The exponential growth of human population is diminishing the availability of non- renewable resources at a rate higher than the level predicted (Haberl, 2006, Odum and Odum, 2006). Resource consumptions by the populations increase with the development and the socio-economic level of the population (Wada et al., 2009; Agamuthu, 2001; Scharff, 2000; Hoornweg, 2000). Report by UNEP indicated that cities which comprised 2% of the total land surface, exploited 75% of the world’s resources leaving only 25% for the less urbanized area i.e. 98% of the remaining land surface. Population, gross net production (GNP) and resource consumptions are strongly related to the trend and rate of waste generation (Agamuthu et al., 2009; Scharff, 2000).
Transcript of 5 SOCIO- ECONOMIC STUDIES 5.1 Introductionstudentsrepo.um.edu.my/4300/10/C5.pdf · 2009; Hazra and...

241
5 SOCIO- ECONOMIC STUDIES
5.1 Introduction
Socio-economic studies have been utilized as tools to evaluate and measure various
aspects of human life. The social implications of a society are always closely related to
the economic aspects that these two fields are normally merged together in studies on
human behaviour. It covers issues like human diets to consumerism to commerce and the
environment (Hazra and Goel, 2009; Lancaster et al., 2005; Shen, 2005; Ishikawa and
Toda, 2005).
The socio-economic level of a society has major implications to the environment as it
influenced the utilization of earth’s resources, as well as, the generation of wastes.
Natural resources have been exploited ever since human’s first existence on the planet.
The exponential growth of human population is diminishing the availability of non-
renewable resources at a rate higher than the level predicted (Haberl, 2006, Odum and
Odum, 2006). Resource consumptions by the populations increase with the development
and the socio-economic level of the population (Wada et al., 2009; Agamuthu, 2001;
Scharff, 2000; Hoornweg, 2000). Report by UNEP indicated that cities which comprised
2% of the total land surface, exploited 75% of the world’s resources leaving only 25% for
the less urbanized area i.e. 98% of the remaining land surface. Population, gross net
production (GNP) and resource consumptions are strongly related to the trend and rate of
waste generation (Agamuthu et al., 2009; Scharff, 2000).

242
Daily waste generation in urban areas in Asia reach more than 760 000 tonnes of
municipal solid waste (MSW) (Hoornweg, 2000; Scharff, 2000). The generation is
projected to increase to more than 1.8 million tonnes per day in 2025 due to rapid
urbanization (Scharff, 2000).
The current refuse generation in Malaysia had exceeded 500 kg/capita/year. In the state
of Selangor, the generation of waste was 3000 tonnes in 1997 and is projected to increase
6.2% to 3200 tonnes in 2017 (Agamuthu et al., 2004). Kuala Lumpur alone produced
2800 tonnes/day in 1997, 3 000 tonnes in 2001, and is predicted to generate about 3 200
tonnes in 2017 (Agamuthu et al., 2009; Agamuthu, 2001). This rate was found to be
higher than the estimated waste generation i.e. 3.2% at the national level.
An integrated waste management system would benefit waste managers economically
and improve the environmental quality (Fauziah and Agamuthu, 2006; Muller et al.,
2002.). Unfortunately a society with a conservative mentality made the improvement
almost impossible (Wada et al., 2009; Fahmi, 2005; Bulle, 1999). This is because waste
management also incorporates the roles of all relevant stakeholders including the society
(Hazra and Goel, 2009; Refsgaard and Magnussen, 2009; Fahmi, 2005; Muller et al.,
2002; Bulle, 1999; Wegelin and Borgman, 1995). Therefore, it is very crucial to change
the negative mind-set of the society in order to enhance the improvement of a waste
management system in the country (Refsgaard and Magnussen, 2009; Wegelin and
Borgman, 1995). This incorporates efforts to create positive attitudes towards

243
environmental issues and environmental consciousness (Hazra and Goel, 2009; Muller et
al., 2002.)
Some approaches were found to be effective in creating environmental awareness among
the society particularly in the urban areas (Read, 2005). Li’ao et al. (2009) and Zhang
(2000) showed that the expectation of the people in cities in China on the environmental
protection issues has been growing and more are ready to accept drastic changes to
improve the quality of the environment. In USA, it was reported that the willingness to
pay more for green goods and green service is relatively high (Winter and Davis, 2006;
Kotchen, 2005; Garcia-Gil et al., 2000). The situation was also similar regarding other
environmental issues and public involvement in many parts of the world (Graham et al.,
2009; Hazra and Goel, 2009; Robertson and McGee, 2003; Stave, 2003; Gouveia et al.,
2004; Lober, 1996) especially when public welfare is at stake (Refsgaard and Magnussen,
2009; Gutrich et al., 2005; Pavlikakis and Tsihrintzis, 2003; Myatt et al., 2003; Al-
Yaqout et al., 2002).
In Malaysia, environmental awareness was very low in the 1970s, as the issue was not
considered critical due to the very low generation of MSW. Therefore, very minimal
attention was focused on creating awareness among the public until the early 80s. Irra,
(1999) reported that approximately 60% of the respondents are moderately aware with
some basic knowledge on MSW issues. While this is relatively satisfactory, 10% of the
respondents have no knowledge and were unaware of MSW issues. The awareness
generally was lacking particularly in less urbanized areas (Aziana, 2003).

244
In 2003, a survey carried out by Irina and Chamhuri showed that 93% of Malaysians are
aware of recycling programs. However, from the number, only 28% Malaysians practiced
it through source-reduction. The survey indicated that the most preferred recycling
method among Malaysians is selling the recyclable materials to door-to-door itinerant
buyers (72%). The survey also showed that only 20% of Malaysians were aware about
waste minimization programs, which is relatively low when compared with recycling
program (93%) (Irina and Chamhuri, 2003). Though implementations of recycling
programs are costly and time-consuming, it can only be successful when more
convincing methods reached the public (Refsgaard and Magnussen, 2009; Wada et al.,
2009; Li’ao et al., 2009; Stave, 2003; Bench et al., 2005; Robinson and Read, 2005;
Zhang, 2000).
On average, 58% Malaysians practiced home-based reuse activities such as repairing old
materials, donate to others to reuse it, sell as recyclable items and reuse (e.g. usage of
glass containers to store food). It is believed that awareness in waste minimization
program will increase if more waste minimization facilities are provided to public and
more waste minimization activities are implemented ((Refsgaard and Magnussen, 2009;
Agamuthu et al., 2004; Lober, 1996). Therefore, it is essential to conduct studies to
collect information on the possibility to improve the existing waste management.
This study was aimed to determine the level of environmental awareness among the
public in the state of Selangor. It was also aimed to derive statistical correlations between
educational background, gender, age and other factors with various environmental issues,

245
and analyzing public attitude towards the improvement of current waste management
system.
5.2 Methodology of Socio-Economic Studies
5.2.1 Determination of Scope
The scope of the study involved nine (9) main areas which correspond to active landfills
in Selangor in 2002 and 2003. The areas included two urban, four sub-urban and three
rural landfills. Socio-economic lifestyle of people and its relationship with waste
characteristics and quantity will be investigated. Information on waste generations, waste
types and quantity will be correlated with the living standards of people, educational
background and other factors. Waste reduction options including recycling of the waste
generated will also be identified and the possibility and viability of recycling will also be
examined.
5.2.2 Compilation of Background Information
Background information including population data, racial composition, and the socio-
economic level was obtained from literature search and interviews with relevant
authorities including the Statistical Department of Malaysia and the local authorities.
5.2.3 Socio-Economic Survey
Socio-economic survey was conducted at each study area with the use of questionnaires
(Appendix 5.0) to gather information on public perception on the environmental issues
and state of MSW management. Survey also involved in-person interviews with

246
randomly selected individuals in the corresponding areas. Random sampling was applied
to prevent biased results (Green, 1979).
The questionnaires contained 51 close-ended questions and 3 open-ended questions. In
order to overcome predetermined bias, the closed-ended questions were constructed
based on general and current issues of waste management such as understanding of
environmental problem, satisfactory of waste management system, perceptions on
changes in future waste management and others. On the other hand, open-ended
questions were focusing on the quantitative data such as number of occupants in the
premises, size of premises and size of garbage bins. The questionnaires were distributed
among 786 respondents to cover 4.1 million population. This is to provide 96% of
confidence (minimum samples of 625 respondents) as indicated in Appendix 5.1
(Yamane, 1967). It gives a probability of less than 4 % or p< 0.04. Therefore, results of
the study can be considered significant at a level of 0.04 or lower. The racial criterion
was also given consideration since it was reported that there is a significant correlation
between race and the attitude towards environmental issues (Irina and Chamhuri, 2003;
Irra, 1999). Responses obtained were computed using Statistical Package for Social
Sciences (SPSS) to derive the statistical significance and correlations of particular socio-
economic factors to MSW management related issues, through Pearson Chi-square
Correlation test.

247
5.3 Results and Discussions
The survey addressed a wide range of environmental issues regarding the management of
MSW. The perception of the public from the corresponding study areas was discussed in
the subsequent paragraphs. Generally, the respondents were 12 to 59 years old with the
majority being males. Professionally they ranged from students to blue and white-collar
workers to business personnel. Table 5.1 summarized the background information of the
respondents in each study areas based on the majority group i.e. the largest percentage of
the relevant categories.
Table 5.1: Brief description of the majority group among respondents of the survey
Area Studied
Age Profession Income Education level
Panchang Bedena
40-49 self-employed RM 701- RM1500 SPM/STPM
Kpg Hang Tuah
30-39 white collar workers
RM1501-RM2000 secondary education
Kundang 30-39 White collar workers
RM2001-RM3000 SPM/STPM and tertiary education
Sungai Sedu
30-49 blue collar workers RM1501-RM2000 SPM/STPM
Ampar Tenang
40-49 white collar workers
RM2001-RM3000 SPM/STPM and tertiary education
Bukit Beruntung
40-49 self-employed RM2001-RM3000 SPM/STPM
Kerling 20-39 white collar workers
RM2001-RM3000 SPM/STPM
Hulu Yam Bharu
20-49 white collar workers and self-employed
RM2001-RM3000 SPM/STPM
Sungai Kembong
30-49 self-employed workers
RM2001-RM3000 SPM/STPM and tertiary education
Note: SPM – equivalent to O-Level
STPM – equivalent to A-Level
1USD = RM3.80
Subsequent sections discuss the findings of the survey in detail.

248
5.3.1 Detailed socio-economic survey.
Findings of the socio-economic survey were analysed accordingly to generate reliable
outcomes.
5.3.1.1 Reliability Test
In order to determine the consistency of the responses obtained, reliability test was
applied. Analysis with Cronbach’s alpha (α) was conducted to establish the reliability
scale and the internal consistency of the survey. The Cronbach’s α obtained ranged from
0.618 to 0.648. It indicates that results from the survey can be accepted with 96%
confidence. Therefore, the results are reliable and would generate similar findings if it is
to be repeated in the future (Aron and Aron, 1997).
5.3.1.2 Frequencies and Significant Test
In general, surveys conducted in urban, sub-urban and rural areas produced almost
similar trends. Approximately 90% of the respondents indicated that the waste collection
frequencies in their area were daily, once every two days or once every three days. In the
sub-urban and rural areas, waste collection was mainly on a daily basis while in the urban
areas it is on alternate days. Since most the sub-urban and rural communities are using
communal bins, the collections are more frequent due to the fast accumulation of waste.
These communal bins need to be attended everyday to prevent overflow of waste as
compared to individual residents in urban areas. Wastes in urban areas generally were
collected directly from their residence that the authorized waste collector has to cover a
larger area in a day in addition to the larger number of premises to serve. As a result,

249
collections were done on alternate days since storing time is less than 48 hours. Hazra
and Goel (2009) reported that waste collection frequencies will determine the satisfactory
of the public on certain waste management services.
Plastic Garbage Bags
Approximately 50% of the respondents used plastic bags to dispose their MSW while
others used rattan basket or plastic bins. Among the three areas, the lowest usage of
plastic bags as waste storage was in rural areas. Less access to plastic bags among the
rural inhabitants as compared to people living in the urban and sub-urban areas probably
has slightly reduced its usage for waste storage. On the other hand, the concept of
shopping for groceries in bulk among urbanites and the sub-urbanites provides large size
plastic bags which become very handy to be used as garbage bags. While limited supply
of plastic bags among the rural inhabitant reduce the quantity of its usage, the abundant
plastic bags in sub-urban and urban area made it convenient as a method to amass waste
prior to its disposal from a household. The high usage of plastic corresponds to the MSW
composition in Malaysia which consists of 11% plastic (Fauziah and Agamuthu, 2009;
Agamuthu et al., 2004). It was reported that disposal of plastic into landfill and lack of
plastic recycling will result with detrimental effects to the environment (Wada et al.,
2009).
Waste Separation Practice
For waste separation practice, the highest frequency (68%) was among the rural
respondents followed by the sub-urbanites (42%) and urban dwellers (26%) as illustrated

250
in Figure 5.1. Living in the rural area probably made it reasonably convenient to conduct
waste separation as compared to the hectic urban life. In addition, rural community tend
to dispose their MSW on their own land because of the availability of space for burning
or burying. The survey indicated a significant correlation between gender and waste
separation practice where more female respondents in sub-urban (0.191) and rural (0.127)
areas practiced waste separation than the male respondents. This is possibly because
females generally are more involved in household chores than the males that waste
separation has become a routine task for them.
0%
10%
20%
30%
40%
50%
60%
70%
80%
90%
100%
urban sub-urban rural
areas
perc
enta
ge (%
)
no
yes
Figure 5.1: Percentage of respondents who separate their waste versus different level of
urbanization
The study also indicated a significant correlation between waste separation and race of
the sub-urban respondents (0.231) indicating that non-Malays are more susceptive in
waste separation than the Malays. This is agreeable with the findings of a survey in Kuala

251
Lumpur by Irra (1999) where the non-Malays were more involved in source separation
than the Malays. Based on the percentage of urban respondents with different income
level, a significant correlation was derived (0.224) with waste separation practice. In
urban area, respondents with high income tend to be involved in waste separation more
than the low-income group. This probably contributed to the fact that high income group
can afford to utilize goods which are easily separated for recycling purposes. In addition,
high-income household normally hires maid that waste separation is taken care by the
maid (Fauziah and Agamuthu, 2005a). Among the urbanites, significant correlation
(0.195) was derived indicating that more of the older generation involved in waste
separation as compared to the younger generation. This probably is due to the awareness
among the adults to separate their waste for the convenience of the waste collector.
Kitchen wastes were the most frequently generated waste. The majority of the
respondents (85%-92%) produced kitchen waste on a daily basis. This corresponds with
the findings on the high percentage of food waste (approximately 60%) observed in
previous findings (Fauziah et al., 2004; Agamuthu et al., 2004). Cardboard, plastic
bottles, glass wastes, aluminium cans, textile waste and rubber based wastes were
occasionally discarded by 82%, 49%, 85%, 52%, 81% and 97% of the respondents,
respectively. The generation of these recyclables is agreeable with studies that found that
recyclables are present in high percentage in the rural MSW (Choy et al., 2002;
Agamuthu and Fauziah, 2005). The high generation of various recyclables would be
beneficial if the waste were separated accordingly.

252
Knowledge on Waste Disposal
The knowledge on waste disposal option was highest among the sub-urban respondents
(82%) followed by rural and urban respondents (77%). Figure 5.2 illustrated that only a
small group (18 - 23%) did not know anything about the disposal of their waste and think
that their responsibility ended when the appropriate authorities collect the wastes.
0%
10%
20%
30%
40%
50%
60%
70%
80%
90%
100%
urban sub-urban ruralareas
perc
enta
ge (%
)
no yes
Figure 5.2: Respondents knowledge on waste disposal option.
Even though a minority of the respondents lacked knowledge on waste disposal, all
respondents knew that the waste collector was responsible to manage and collect the
waste from their areas. This probably contributed to the fact that people will only get
themselves involved if their welfare is at stake (Refsgaard and Magnussen, 2009; Liu and
Kondo, 2008; Myatt et al., 2003; Gouveia et al., 2004; Al-Yaqout et al., 2002). Highest
percentage of knowledge on waste disposal activities was among the sub-urbanites

253
(82.8%), probably due to the presence of disposal site within the area. With distance,
location, land value and other factors to be taken into consideration, sub-urban site
generally is the most cost-effective area to locate a landfill (Kontos et al., 2005;
Agamuthu, 2001; Westlake, 1997; Zeiss and Lefsrud, 1995). As a result, sub-urban
dwellers will be more aware of the waste disposal activities.
Correlation (correlation coefficient= 0.259) between knowledge and income level was
significant among the rural respondents indicating that lower income groups have better
knowledge on waste management systems than those of higher income. This probably
was due to the fact that lower income groups are more involved in waste management
activities including recycling that they are more aware of the issues. This knowledge was
also found to be significantly correlated to race among the urbanites with Pearson’s Chi
Test (0.225).
Findings also indicated that approximately 74-87% of the total respondents were serviced
by Alam Flora (P) Ltd. (AFSB), a private consortium responsible for managing waste in
the areas. 13- 22% were managed by private contractors appointed by AFSB or the local
authorities. AFSB was appointed by the Ministry of Housing and Local Government of
Malaysia (MHLG) for the central region where this study took place (Mohamed Siraj,
2000).
In terms of waste management efficiency, majority of the respondents (88%) found that
the waste collection system was satisfactorily efficient. Among the sub-urbanites, 89%

254
found the system efficient while among the urbanites, only 88% agreed. This probably
was due to the frequent collection service provided by the waste collectors. As a result,
MSW was left unattended for a very short time, which is highly convenient for the waste
generators’ comfort. Only 12% claimed that the service was not satisfactory. The
satisfactory level was found to correlate significantly (0.137) with race where more
Malay respondents were satisfied with the existing collection efficiency than the non-
Malays. However reverse correlation was derived among the urban respondents. In urban
area, more non-Malays find the service satisfactory than the Malays. This was probably
due to the fact that Malay residences’ are located in areas with lower service frequency.
Also obtained was a significant correlation between satisfaction in waste collection and
gender. Sub-urban (0.220) and urban (0.184) females were more satisfied than their male
counterparts. This might be contributed by the higher expectation of the male group that
the current service was not satisfactory. Previous study indicated that among Malaysians,
females tend to be content with the available services if it is appropriately provided (Irra,
1999).
Pay As You Throw (PAYT) System
With regards to Pay As You Throw (PAYT) system, 52 to 59% of the respondents think
that PAYT system is fair. Approximately 46 to 57% agreed with its implementation
while 24% to 43% disagreed as indicated in Figure 5.3. The highest disagreement (43%)
was among the rural respondents probably due to the fact that they generate larger
quantity of waste which comprised of garden or yard waste. With the implementation,
they would pay extra fees for the bulk of the wastes. It is agreeable to the findings in

255
many studies that people would strongly object proposals that would affect their
livelihood particularly in the economical aspects (Li’ao et al., 2009; Wada et al., 2009;
Gutrich et al., 2005; Pavlikakis and Tsihrintzis, 2003; Myatt et al., 2003; Al-Yaqout et
al., 2002). The slightly high percentage of positive responses among the sub-urbanites
was probably due to the fact that their generation of waste is reasonably low. This was
proven with the lower generation of MSW daily by the sub-urbanites (Fauziah and
Agamuthu, 2004).
0%
10%
20%
30%
40%
50%
60%
70%
80%
90%
100%
urban sub-urban ruralareas
perc
enta
ge (%
)
maybedisagreeagree
Figure 5.3: Response to the implementation of PAYT system
Among the rural respondents, the high-income groups were more supportive toward the
PAYT system as compared to the low-income group. The correlation between the total
income of respondents and the acceptance of PAYT system was significant (0.112). This
was generally contributed by the affordability of the respondents to the system. Studies
256
found that individuals with better economical state would perceive new changes better
than individuals with unstable financial position (Refsgaard and Magnussen, 2009; Wada
et al., 2009; Lober, 1996; Gutrich et al., 2005). As for age, adult respondents were more
positive towards PAYT system as compared to the younger group. This probably
contributed by the fact that these groups feel the PAYT system is inappropriate in the
country.
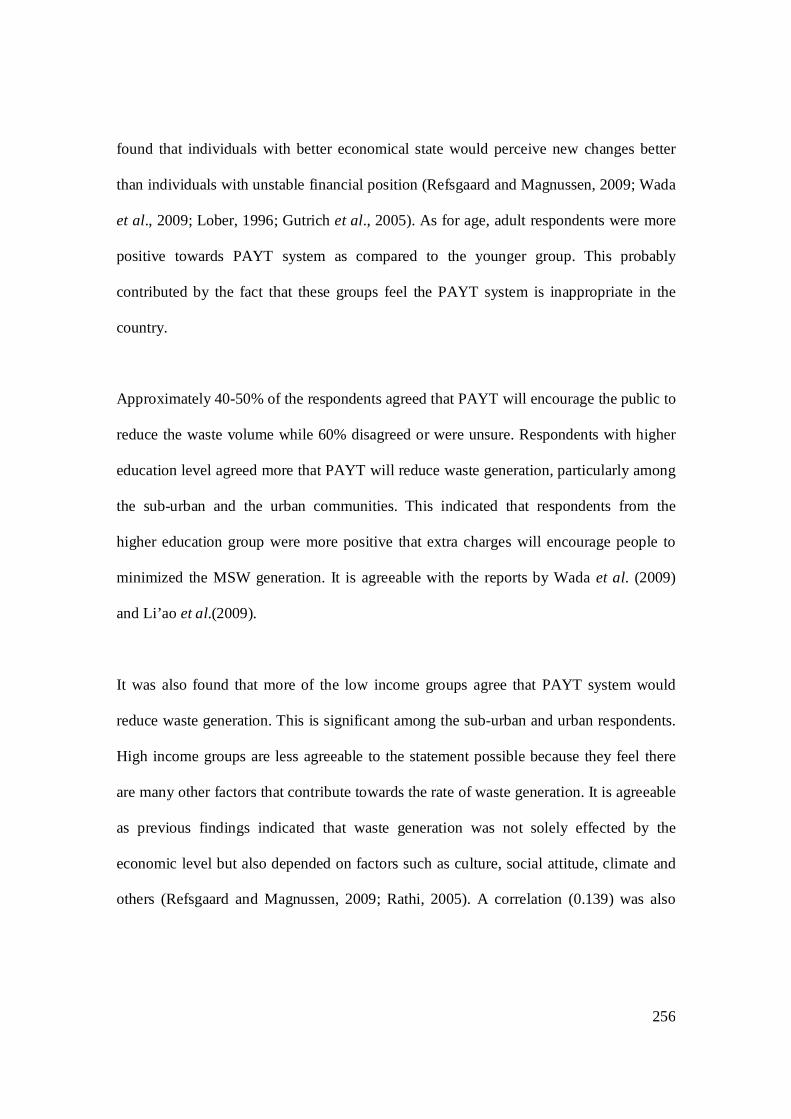
Approximately 40-50% of the respondents agreed that PAYT will encourage the public to
reduce the waste volume while 60% disagreed or were unsure. Respondents with higher
education level agreed more that PAYT will reduce waste generation, particularly among
the sub-urban and the urban communities. This indicated that respondents from the
higher education group were more positive that extra charges will encourage people to
minimized the MSW generation. It is agreeable with the reports by Wada et al. (2009)
and Li’ao et al.(2009).
It was also found that more of the low income groups agree that PAYT system would
reduce waste generation. This is significant among the sub-urban and urban respondents.
High income groups are less agreeable to the statement possible because they feel there
are many other factors that contribute towards the rate of waste generation. It is agreeable
as previous findings indicated that waste generation was not solely effected by the
economic level but also depended on factors such as culture, social attitude, climate and
others (Refsgaard and Magnussen, 2009; Rathi, 2005). A correlation (0.139) was also

257
significant between age and the agreement that PAYT system would reduce waste
generation indicating more of the older generation agreed to the statement.
Approximately 43- 52% of the respondents think that it would be unfair to pay according
to the weight of the waste they generate. This was probably because they generate large
volume of waste that if the system is implemented, the charges they have to cover would
be extremely high and inconvenient for them. These groups who were not in favour of
PAYT system generally are from the business and commercial sectors. On the other
hand, 48 - 57% felt that the system is fair as the waste generator should be responsible for
the mass of waste generated. More of the older generation think that PAYT is not fair to
waste generators probably due to the fact that their waste generation was higher and their
exposure to alternative waste management activities were only limited to direct disposal
to landfill. The younger generation generally would have better understanding on other
options in waste management including reuse, reduce and recycling that they feel it is
appropriate and fair to charge a waste generator according to PAYT system as there are
various methods to reduce waste generation and waste disposal. Similarly, more of the
educated respondents think that PAYT system is fair (correlation coefficient = 0.180).
Knowledge is evidently crucial as to improve current waste management so that the
implementation such as PAYT system is workable. The correlations were agreeable with
findings of previous studies (Graham et al, 2009; Rathi, 2005; Siebenhand and Winkler,
2000; Wang, 2000; Irra, 1999; Lake et al., 1996).

258
With numerous recycling campaigns in the country, only 82-88% of the total respondents
knew the meaning of recycling with urban people being the highest (Figure 5.4).
0%
10%
20%
30%
40%
50%
60%
70%
80%
90%
100%
urban sub-urban ruralareas
perc
enta
ge (%
)
no yes
Figure 5.4: Respondents who knew the meaning of recycling.
As much as 12-18% of the respondents did not know the meaning of recycling, which
indicates the need for more serious and intensive campaign on recycling and other related
issues. This was similarly observed in studies by Irina and Chamhuri (2003) that the
majority of public knew the meaning of recycling while a small percentage has no
understanding of the issue. Significant correlations were derived between age of rural
(0.151) and sub-urban (0.333) respondents, and their knowledge in recycling. This
indicates that younger respondents have better knowledge in recycling. This was
probably contributed by campaigns and teachings in schools and learning institutions.
This is agreeable to findings obtained from previous survey conducted in Klang Valley
and other parts of the world (Graham et al., 2009; Wada et al., 2009; Irra, 1999).

259
Among the sub-urbanites, females have better understanding in recycling than the male
respondents. This is also agreeable with previous findings by Irra (1999). Women were
more aware of environmental issues including recycling as compared to their male
counterpart (Irina and Chamuri, 2003; Irra, 1999). More of lowly educated respondents
knew the meaning of recycling compared to those with higher education (correlation
coefficient = 0.209). This is somewhat contradicting with the findings by Irra (1999).
This was probably attributed to that fact that highly educated people normally are well
paid that they are less involved with recycling activities (Graham et al., 2009). On the
other hand, the lower education group with insufficient income tends to recycle more as
to generate some side-income by selling certain materials. Their direct involvement in
recycling activities generates more understanding in the concept of recycling as
compared to those without (Li’ao et al., 2009). This corresponds with the correlation of
total income of respondents and the understanding of recycling concept (correlation
coefficient = 0.168) indicating that low-income groups have better understanding in
concept of recycling as compared to the high-income group. This is particularly true since
in the hectic urban environment, low-income group sell recyclable materials to generate
extra side-income to sustain life in cities (Hazra and Goel, 2009).
Recycling Practices
Even though 88% of the respondents from the urban zone knew the meaning of recycling,
only 60% practiced it, while 40% are not involved in recycling activities (Figure 5.5).
This was most probably due to the “not bothered” attitude among the public. Similar

260
findings were also obtained from survey conducted among the public in Klang Valley
and Malacca (Aziana, 2003; Irra, 1999).
0%
10%
20%
30%
40%
50%
60%
70%
80%
90%
100%
urban sub-urban ruralareas
perc
enta
ge (%
)
no yes
Figure 5.5: Respondents practicing recycling.
The percentage of respondents practicing recycling was obviously much lower as
compared to the knowledge on recycling. This probably contributed by the fact that
knowledge does not necessarily create awareness and motivation to pursue recycling
activity (Refsgaard and Magnussen, 2009). Particularly, when facilities provided were
insufficient (Graham et al., 2009; Lober, 1996). Respondents who practiced recycling
were highest among the urbanites which accounted up to 60%. This could be due to the
availability of more recycling centres in urban areas as compared to other places. Even
though recycling was highest among the urbanites, the percentage of respondents that
practice waste separation was the lowest.

261
The correlation between level of education and the practice of recycling among the sub-
urbanites was significant (0.205). It indicated that respondents with lower education level
practiced more recycling than those of higher education level. This was found to be
contradicting with previous study by Irra (1999). The low recycling activity among the
higher educational level probably discouraged by time constrain where more time is
spend to work and recycling is not convenient (Li’ao et al., 2009).
Significant correlations were derived between age and recycling practices among rural
(0.180) and sub-urban (0.199) respondents. It indicated that more of the younger
generation practiced recycling as compared to the older generation. This could be
influenced by the campaigns and environmental talks launched at schools and other
learning institutions. Again, knowledge and awareness were found to promote
improvement in a waste management system, aligned with findings from most studies
(Refsgaard and Magnussen, 2009; Rathi, 2005; Siebenhand and Winkler, 2000; Wang,
2000; Irra, 1999; Lake et al., 1996). Also obtained from this study was a significant
correlation (0.130) between race and recycling practices among sub-urban respondents.
More Malays practiced recycling as compared to the non-Malays. This was probably to
generate extra income for the household.
The correlation between gender of the rural respondents and the recycling of aluminum
is significant (0.137) indicating that female respondents recycled more cans than the male
respondents. A similar observation was obtained from the survey among the sub-urban
respondents. This perhaps was contributed by the factor where household cleaning

262
normally is conducted by females that the responsibility to recycle is taken by them. In
addition to that, a significant correlation (0.168) was also derived between race and
recycling of aluminum cans among the urbanites where more of the non-Malays are
involved than the Malays. Due to the lifestyle of the non-Malays to serve and have
canned drinks at home resulted with them generating more aluminum cans which can be
translated to higher recycling of aluminum cans among this group as compared to the
Malays. Also indicating significant correlation is the level of education and the recycling
of aluminum cans (0.153) where more of the less educated urbanites recycle aluminum
cans than the educated respondents. Factors which might be preventing this practice
among the highly educated people are the lack of recycling facilities and lack of
appropriate motivation to do so (Refsgaard and Magnussen, 2009). The trend is similar to
that observed among the sub-urban respondents (0.299). This was probably due to the
good demand for aluminum cans (Agamuthu et al., 2004).
Recycling of newspaper was significant (coefficient = 0.139) for gender and level of
education among sub-urban and urban respondents, respectively. More females recycled
newspaper than their male counterparts possibly because they are the ones responsible for
housekeeping that it would be convenient for them to collect and recycle it. Among the
urbanites, the educated groups recycle less newspaper. As observed for the aluminum
cans recycling trend, inconvenience becomes the main set-back. Also, the unattractive
returns for selling newspaper may discourage this activity among those of higher
education since time is also a major constrain.

263
The correlations between glass bottles recycling and income level are significant among
rural (0.196) and urban (0.266) respondents indicating that more of the low income
respondents recycled more glass bottles than the high income respondents. This could be
caused by the necessity to generate extra income among the low-income group that the
practice was somewhat encouraged (Agamuthu et al., 2009a) However, due to the
unsatisfactory monetary returns from recycling of glass bottles, it is not favoured by the
high income groups. Correlation between races and recycling of glass bottles was
significant (0.128) signifying that more of the Malays recycled the items as compared to
the non-Malays. Significant correlations were derived between age and recycling of glass
bottles among the rural (0.117) and urban (0.260) respondents. The correlations indicate
that more of the older generations recycled glass bottles compared to the younger
generation. This was possibly caused by the previous trends in the 70s where glass bottles
were returned back to manufacturers to be reused that the habit comes more naturally for
the older generation to recycle glass bottles. Reused of glass bottles were widely
practiced throughout the globe in the 70s and early 80s (Waite, 1996).
Similar to the recycling of glass bottles, significant correlations (0.240) were derived for
plastic bottles indicating that low income groups recycled more plastic bottles than the
high income group in sub-urban areas. In addition to that, the less-educated groups were
found to recycle more plastic bottles than the more educated groups. This was probably
due to time constrain where the highly educated were more immersed in work that less
time is available to actually participate in sorting and sending off recyclables to recycling
centers (Li’ao et al., 2009). Among the urbanites, significant correlations (coefficient =

264
0.181) were derived between the recycling of plastic bottles and races. It implied that
more of the non-Malays were involved in recycling of plastic bottles compared to the
Malays. This was probably encouraged by the increase in price for plastic with the
increase in petroleum. The good price of plastic in the market profited those who
recycled plastic materials such as plastic bottles.
Significant correlation was also derived from recycling of plastic bags and total income.
Among the urbanites, the correlation (0.206) implies that recycling of plastic bags
increase with the income level. Generally this is possible since the higher is the income
the higher is the purchasing power of an individual. Therefore, since Malaysian
commercial facilities still provide plastic bags to their customer it will result with more
abundant plastic bags to be recycled. It is also significantly correlated with the age of
respondents where this practice increased with the increase in age (0.162). Among the
sub-urbanites, recycling of plastic bags was correlated to the races (0.171) of the
respondents. More of the non-Malays were found to be involved in the recycling of
plastic bags than the Malays. The correlation between plastic bag recycling and education
level was also significant (0.154) among the sub-urbanites implying that more of the less
educated people recycle plastic bags as compared to the more educated people. This
could be resulted from the fact that less-educated people were more involved in recycling
activities as to generate extra income that they are more involved in recycling of plastic
bags. Besides that more of the educated groups tend to refuse plastic bags when shopping
as to prevent and reduce plastic usage in the country as the awareness and environmental
consciousness has increase among this group (Liu and Kondo, 2008). It is agreeable to

265
findings of Irina and Chamuri (2003) and Aziana (2003) that reported the increase in
environmental awareness among the educated group resulted with reduction in plastic
bag usage.
Establishing more recycling centers
Approximately 65% of the respondents agreed that more recycling centers should be
established in order to promote recycling activities while approximately 27% strongly
agreed. Establishing more recycling stations would create convenience for the public to
participate (Refsgaard and Magnussen, 2009). Respondents of higher education were
more agreeable with the establishment of more recycling centers than respondents of
lower education level. The correlation is 99% significant (0.317) probably contributed by
the fact that the higher their education level, the more they understand the importance of
having more recycling facilities. This is agreeable with results obtained by previous
studies (Fauziah and Agamuthu, 2005; Irina and Chamhuri, 2003; Irra, 1999). The
increase in facilities to manage and collect recyclables not only promotes recycling
activities but would also help to improve the economy of the participating individuals. It
was proven by previous studies that recycling can be promoted with appropriate facilities
in order to create an environment whereby the public find it convenient and comfortable
to participate (Refsgaard and Magnussen, 2009; Read, 2005; Fahmi, 2005; Muller et al.,
2002; Bulle, 1999; Wegelin and Borgman, 1995). Convenient environment encouraged
recycling activities that it is no longer a hassle to an individual to willingly participate for
an unlimited time.

266
Willingness to separate waste for recycling purpose
The willingness to separate waste for recycling was 44 to 60 %, illustrated in Figure 5.6.
0%
10%
20%
30%
40%
50%
60%
70%
80%
90%
100%
urban sub-urban rural
areas
perc
enta
ge (%
)
yesmaybeno
Figure 5.6: Respondents who agree to separate their waste for recycling purpose.
Approximately 21% was not sure while 29% clearly stated that they are not willing to
separate their waste as separation activities would be tedious and time consuming. Again
the issue of attitude was involved when it comes to extra effort required for a good
purpose. This was probably due to the fact that the wastes produced by some of the
respondents were separated by others like their parents, spouse, or housemates. Among
the sub-urbanites, willingness to separate waste for recycling purpose is significantly
correlated to gender (0.177). The correlation shows that more females are willing to
separate their waste than the male group. Factors which influenced this finding could be

267
time availability and convenience among the females particularly those who spend most
of their time at home.
Willingness to change to environmental friendly products
In order to ensure the sustainability of the environment, there is the need to utilize
environmental friendly product so that the quality of the environment will not be
degraded with unfriendly or toxic products. Environmental friendly products generally
are more costly than the common merchandises (Winter and Davis, 2006; Kotchen, 2005;
Garcia-Gil et al., 2000). Therefore, questionnaires were also given to determine the level
of willingness of the respondents to pay extra for environmental friendly products.
Approximately 27 - 43% of the respondent in the three areas are willing to pay more for
environmental friendly products. Slightly smaller percentage (25- 43%) refused to
allocate more money on these products while approximately 30% was not sure about
their decision and refused to pay extra for such products as that would somehow affect
their budget. It was proven that acceptance of changes will decrease with the involvement
of financial factor (Graham et al., 2009; Lober, 1996; Gutrich et al., 2005).
Results indicated significant correlations between income level and the willingness to use
environmental friendly products among the rural (0.108), sub-urban (0.133) and urban
(0.164) respondents. It indicated that the higher the income of the respondents, the higher
is the willingness to buy environmental friendly products. This is possible with the
affordability of this group as compared to low income respondents in purchasing
environmental friendly products such as organic food and others. Besides being

268
environmental friendly, these products normally are more expensive and healthier since it
lacked unnatural and toxic material (Winter and Davis, 2006; Kotchen, 2005; Garcia- Gil
et al., 2000). It is affordable for high income people with high health consciousness that
indirectly promote the usage of environmental friendly products. Among the sub-urban
and rural respondents, age was also found to be correlated to the willingness to buy
environmental friendly products. This generally could be attributed to the fact that as age
increased the capability to earn higher salary also increased that purchasing more
expensive goods is possible. It is a fact that people of higher income are willing to pay
more if it means that their life could be of higher quality (Otoniel et al., 2008; Zhang,
2005; Lancaster et al, 2005, Lober, 1996; Al-Yaqout et al, 2002).
Extra charges for plastic bags
Since plastic bags were one of the non environmental friendly products, respondents were
asked if they are willing to pay extra on plastic bags as a way to reduce its wide usage in
the country. The willingness to pay extra on plastic bags was found to be quite low
indicating respondents’ attitude towards issues related to allocating more money.
Approximately 35- 42% disagreed with the proposition as indicated in Figure 5.7. This
again shows the “not bothered” attitude among the public especially when it involved
some extra ‘charges’ (Lober, 1996).

269
0%
10%
20%
30%
40%
50%
60%
70%
80%
90%
100%
urban sub-urban rural
areas
perc
enta
ge (%
)
yesmaybeno
Figure 5.7: Response to impose extra charges on plastic bags.
A small percentage (35%) agreed and was willing to pay extra on plastics bags as they
feel it would reduce the excessive and uncontrolled usage of plastic bags in the country.
The correlation between total income of respondents and the support to pay extra charges
on plastic bags is significant (0.130) among the rural respondents. The correlation
indicates that the higher the total income of the respondents, the higher the support on
extra charges of plastic bags. This is so because this group can afford to spend more
money so that they are able to enjoy a healthier environment. Results also indicate
significant correlation between age and the support on extra charges of plastic bags
(0.192) among the rural respondents. The factor could be the fact that being young, the
teenagers are unable to spend more money for the extra charges (Wada et al., 2009).

270
While this is not affordable among the youngster, the adults find it reasonable to take in
the charges as to improve the quality of the environment.
Race is also found to be correlated to the support on extra charges of plastic bags where
among the rural respondents (0.111). It signifies that more of the non-Malays are
supportive of the proposal as compared to the Malays. Since more of the non-Malays are
involved in the commercial sector, they probably deal with the usage of plastic that they
feel unnecessary in their trades. Females were found to be more supportive of this
proposal as compared to their male counterpart. This probably is because women are
more involved in buying goods for the household that they may realize the abundant use
of plastic bags sometimes are unnecessary (Bakewell and Mitchell, 2006). Therefore, as a
method to avoid the over-usage and uncontrolled plastic bags accumulation, it should be
charged. In addition, the implementation of appropriate policies is necessary to control
the presence of plastic in MSW disposal (Slack et al., 2009, Otoniel et al., 2009).
The majority of the respondents knew that plastics were non-degradable and it will stay
intact even after a very long time after disposal into landfills. Only a small percentage
(7%) (Figure 5.8) were not aware of the situation.

271
0%
10%
20%
30%
40%
50%
60%
70%
80%
90%
100%
urban sub-urban rural
areas
perc
enta
ge (%
)
yesmaybeno
Figure 5.8: Knowledge that plastics are non-degradable.
The correlation between total income and the knowledge that plastic is non-degradable
was significant among the sub-urbanites (0.197). It indicated that more of the high
income respondents knew that plastic bags are not degradable in landfill. High income
respondent possibly can obtain more knowledge from various sources that they are aware
of more environmental issue including plastic unchanged characteristic in landfill
environment.
Implementation of degradable plastic bags usage
As plastics are non-degradable, suggestions to implement the use of biodegradable plastic
bags were included in the questionnaires. The suggestion to implement the use of
degradable plastic bags was supported by approximately half of the total respondents

272
participated in the survey as shown in Figure 5.9. The majority 45-63% agreed with the
idea of replacing non-degradable plastic bags with the degradable plastic bags.
0%
10%
20%
30%
40%
50%
60%
70%
80%
90%
100%
urban sub-urban rural
areas
perc
enta
ge (%
)
yesmaybeno
Figure 5.9: Support on the implementation of degradable plastic usage.
Only 16 – 26% disagreed with the idea of the using degradable plastic bags while the
remaining 20% was not sure. This probably is because certain groups of people are slow
to accept changes which contradicts their normal habits (Graham et al., 2009). Among
the sub-urbanites, younger respondents were found to be more supportive in the usage of
degradable plastic bags than the older respondents (0.177). This was probably contributed
by their exposure to campaign and knowledge on the disadvantages of plastic bag usage.
The correlation between gender and the respondents’ support on the implementation of
degradable plastic bags was significant (0.198). Female respondents were more
supportive of the implementation of degradable plastic bags than the male respondents.
This was probably because females tend to be involved in buying groceries that they
realized the huge quantity of plastic waste generated. In terms of level of education, the

273
educated respondents were more supportive towards the use of degradable plastic than
the less educated respondents. This generally would be due to the fact that people with
higher education tend to be more aware of the environmental issues. It corresponds with
previous findings by Irra (1999), Refsgaard and Magnussen, (2009), and Aziana (2003).
Race and income level were also found to be significantly correlated to the support of
implementing degradable plastic bags. Between the races, Malays were found to be less
supportive than the non-Malays while the high income groups were supportive of the
proposal. Based on income level, people of higher income would find the usage of
degradable bags affordable that they are more supportive.
The responses distinctively changed when the proposal of degradable plastic bag usage
involved government intervention. The statement “if government implemented the use of
degradable plastic bags as mandatory” was found to be agreeable by the respondents.
Approximately 70% of the respondents agreed to buy and use the degradable plastics
bags if the government is making it mandatory, while 30% were unsure as shown in
Figure 5.10. It indicates that government intervention is necessary as to obtain positive
change among the public (Slack et al., 2009).

274
0%
10%
20%
30%
40%
50%
60%
70%
80%
90%
100%
urban sub-urban rural
areas
perc
enta
ge (%
)
yesmaybeno
Figure 5.10: Support to buy and use degradable plastic.
Less than 30% of the respondents were unsure or disagreed to support if it is required by
law. This negative respond probably contributed by the fact that it is considered as an
economic burden. Among the urbanites, a 99% significant correlation was derived
between the level of education with willingness to support government’s implementation
of degradable plastic bag usage. The correlation is significant (0.232) the educated
respondents were more supportive of the motion than those less educated. This is
agreeable to previous findings that respondents with education showed better
participation in environmental issues (Refsgaard and Magnussen, 2009; Irra, 1999;
Myatt, 2003). The correlation between total income of the respondents and the support of
government’s implementation to make use of degradable plastic bags mandatory was also
significant among the urbanites (0.144) signifying that respondents with higher income

275
are more supportive. Among the sub-urbanites, increase in age was significantly
correlated with the proposal (0.169) while gender was found to be correlated with rural
respondents. More of the female respondents were more supportive that their male
counterpart to use degradable plastic bags if it is compulsory. This indicated the necessity
of government intervention in order to improve the current waste management system
(Slack et al., 2009). The lack of policy on solid waste management is a major set-back
that delayed the improvement of waste management in most country (Agamuthu et al.,
2009a). Many studies had proven that policy and regulations is one of the most effective
method to ensure the participation of the public and promote moral acceptance (Refsgaar
and Magnussen, 2009; Gutrich et al., 2005; Gouveia et al., 2004; Myatt et al., 2003;
Robertson and McGee, 2003; Al-Yaqout et al., 2002).
5.4. An Overview of the whole study state of Selangor
In general, majority of the public preferred to dispose their waste using plastics bags.
This is contributed by the fact that plastics bags are widely available in Malaysia at a very
minimal cost (Mohamad Isa, 1997). Issues regarding presence of high percentage of
plastic bags are being seriously discussed by many developing countries (Liu and Kondo,
2008; Tinmaz and Demir, 2006; Fourie, 2004; Mgaya and Nondek, 2004) including
Malaysia (Agamuthu et al., 2004; Fauziah et al., 2004).
As observed in MSW composition of other developing countries, kitchen waste
generation was quite high at a more frequent rate (Swati et al., 2008; Fauziah and

276
Agamuthu, 2009; Fauziah et al., 2004). Similar to some developed countries like UK and
Denmark, kitchen waste contributes 17-22% of the total MSW (Riber et al., 2009; Bench
et al., 2005). This biodegradable portion of the MSW was sent directly to landfills for
disposal without any conversion into compost or biogass. The disposal of kitchen waste
into landfill without alternative routes caused loss of resources (Odum and Odum, 2006;
Haberl, 2006; Tinmaz and Demir, 2006; Fauziah et al., 2004, Hoonweg, 2000). Other
materials including rubber, textile, and glass were occasionally generated by most
respondents from all areas caused more loss of recyclable component to the ultimate
disposal.
The survey indicated that very low percentage of respondents practiced waste separation.
This was probably due to waste separation activities not being practical in urban and sub-
urban areas which were considered more ‘hectic and restless’ areas compared to the rural
(Li’ao et al., 2009). This is agreeable with studies conducted in the UK (Read, 2005).
Also, previous studies indicated that changing the attitude of the public towards better
environmental practice were costly and challenging, particularly among urbanized society
(Graham et al., 2009; Zhang and Wang, 2005; Bench et al., 2005; Zhang, 2000; Scharff,
2000; Hoonweg, 2000).
Overall, survey indicated that 72% of Chinese practiced waste separation which
encouraged the recycling activities, while among Malays and Indians, only 67% and 64%
conducted waste separation, respectively. However, Malays are still the highest group

277
among all races that separate their waste at approximately 53%. The responses of waste
separation practices within the different races are illustrated in Table 5.2.
Table 5.2: Cross-tabulation of waste separation activities among respondents (%
responses)
Races (Within races)
Yes No
Malays 66.9 33.1
Chinese 72.0 28.0
Indian 63.9 36.1
Others 31.3 68.8
The correlation analysis was found to be insignificant that it could be stated that waste
separation practices does not correlate with race as observed in previous survey (Irina and
Chamhuri, 2003; Aziana, 2003; Irra, 1999). A significance correlation derived indicated
that more females conduct waste separation as compared to their male counterparts. It is
agreeable with the findings by Irra (1999) among the Klang Valley respondents. Total
income was significantly correlated to waste separation (coefficient = 0.136) which
indicated the higher the income the more positive is the waste separation practiced among
the respondents. This is generally true since the high income group normally have maid
and assistant to help them with the house chores.
Generally, most respondents (76%) possessed some knowledge on waste disposal system.
Race and knowledge on waste disposal is significantly (0.111) indicating that more of the
non-Malays have higher knowledge as compared to the Malays. It was probably due to
the focus given in schools where Malay schools expose less environmental issues to the

278
students as compared to the non-Malay schools. Chinese and Tamil schools in Petaling
Jaya for example have established environmental clubs which educate and expose the
students to various environmental concepts. Also, additional environmental issues were
broadcasted in Tamil and Chinese such as “Edisi Siasat Mandarin” that will not reach the
Malay audiences.
The public perception of the current waste management system among urbanization level
is shown in Table 5.3. Respondents from sub-urban and rural areas are more content with
the waste collection efficiency than those from urban areas. This is probably due to lower
frequency of waste collection as reported by Irra (1999). In addition, the fact that
urbanites normally demand for a flawless waste management system makes it more
difficult to achieve their satisfaction.
Table 5.3: Perception of current waste management system (% of responses) Efficiency of
waste collection
system
Likert scale
Very efficient Efficient Inefficient Mean score
(1) (2) (3) (1-3)
Urban area 28.3 60.0 11.7 1.8
Sub-urban area 38.8 48.8 12.4 1.7
Rural area 41.4 46.6 12.0 1.7
Significant correlations were derived between gender and age of respondents with the
satisfaction of waste management system. It was found that more of the females are
satisfied with the current waste management system as compared to their males
counterparts (0.152). This could be due to the high participation of females, particularly

279
housewives, in managing and disposing waste generated from a household that current
system practiced by the waste manager was reckoned to be efficient. Increase in age was
significantly correlated to the increase in satisfaction of waste management (0.110). It
indicated that the older generation found the current waste management system satisfying
while the younger ones think it is otherwise. Generally, with more exposure from
campaigns and educational talks conducted in schools, the younger generation is more
aware on environmental issues that they expect better service from the waste managers.
Pay as you throw (PAYT) system, a new concept for most Malaysians was surprisingly
agreeable to most respondents from all areas. More than half of the total respondents
supported the implementation of PAYT system in order to improve the existing waste
management. A similar observation was also obtained from survey conducted among
public in China (Zhang, 2000). This again proved that the public are getting more and
more willing to face changes in their life including in their normal consumption pattern to
improve the environmental quality (Graham et al., 2009; Refsgaard and Magnussen,
2009; Zhang, 2000; Lancaster et al., 2005, Lober, 1996; Al-Yaqout et al., 2002). PAYT
was found to be more agreeable to the low income groups as compared to the high
income group (0.097), probably due to the fact that the low income group feels that they
generate lesser amount of waste and PAYT system will not be an issue.
On the other hand, not as many agreed that the PAYT system would reduce waste
generation. Only less than half of the total respondents felt that the system would reduce
waste accordingly as waste generators are charged in proportion to the quantity of waste

280
they produced. Again a significant correlation was derived (coefficient = 0.092) where
more of the low income groups felt that PAYT system would help reduce waste
generation. This could be attributed to the fact that the low income earned they would
practically be more cautious in generating waste so that the fees paid could be minimized.
This indicated the effect of ‘carrot and stick’ concept which might be effective in
improving the current waste management system (Wada et al., 2009; Lancaster et al.,
2005; Lober, 1996).
More than half of the total respondents felt that the PAYT system would be fair to all
‘users’. The perception of PAYT system is shown in Table 5.4.
Table 5.4: Public consent on the PAYT system (% of responses)
Likert scale
Totally agree
(1)
agree
(2)
disagree
(3)
Mean score
(1-3)
Implementation of PAYT
system
53.7 13.7 32.1 1.6
PAYT system reduce waste
generation
46.7 21.9 31.4 1.8
From the Likert scale, most of the respondents agreed with the implementation of PAYT
system. A significant correlation (0.158) indicated that the younger generation was more
positive towards the fairness of PAYT system. It is due to the high awareness among
younger generation that they understood that PAYT system better than the older
generation. The environmental campaigns launched by the government and NGOs at
schools was found to be effective in increasing awareness among the younger generations

281
(Aziana, 2003; Irra, 1999). The majority of the respondents also agreed (Likert scale =
1.8) that PAYT system would reduce the generation of waste.
The survey indicates that more than 86% of the respondents understood the meaning of
recycling with 46% agreed that waste separation can promote recycling activities (Table
5.5).
Table 5.5: Public perception on recycling issues in all areas (% of responses)
Likert Scale
No (1) Yes (2) Mean score
(1-2)
Understand the meaning of recycling 13.7 86.3 1.8
Waste separation promotes recycling 54.0 46.0 1.5
This is so as over the years, appropriate ministries in Malaysia had launched campaigns
to promote awareness especially in recycling program (Saeed et al., 2009). As a result
significant correlation was derived where younger generation was found to be more
aware on recycling as compared to the older generation. The high awareness among the
respondents from this study corresponds with previous studies (Irra, 1999; Agamuthu et
al., 2004a). Unfortunately, the practice on recycling activities were quite low (Agamuthu
et al., 2009a; Irra, 1999; Irina and Chamuri, 2003; Agamuthu et al., 2004). The public
from sub-urban areas were less responsive than those of the urban and rural areas. It
indicates that changes in the perception of recycling activities are generally slower among
the sub-urbanite and more convincing efforts should be implemented. This observation
was found to be similar to other studies that high awareness level among public will not

282
necessarily show a high rate of recycling activities (Refsgaard and Magnussen, 2009;
Robinson and Read, 2005; Read, 2005). A significant correlation (0.124) was obtained
from the survey indicating that more of the younger generation involved in recycling
activity as compared to the older generation. This was generally due to the high
awareness among the youngster on the recycling concept indicated earlier.
High percentages of positive responses were obtained from the proposal to improve the
recycling facilities, indicating that the majority of the public are willing to face changes.
With the recycling facilities stationed at proper locations, more public would find it
convenient for them to participate in the recycling activities (Li’ao et al., 2009).
Significant correlations were derived between total income and education level of the
respondents, and support for more recycling facilities. It indicated that the positive
increase in income and educational level resulted with increase in the support to establish
more recycling facilities. It indicates that more are willing to face changes in order to
improve their living standard and to reduce impacts on the environment. Similar trends
were observed among the public in Hong Kong and China (Li’ao et al., 2009; Zhang,
2005). More facilities for recycling will promote and encourage the recycling activities
among the society (Refsgaard and Magnussen, 2009; Hazra and Goel, 2009; Lancaster et
al., 2005; Agamuthu et al., 2004a; Fauziah et al., 2004; Zhang, 2000).
In general, more than 50% of the respondents from all areas are willing to pay more for
environmental friendly products. This is so, as many felt that the step would promote
better environment and in time curb the environmental degradation (Wada et al., 2009;

283
Bench et al., 2005; Zhang, 2000). A significant correlation (0.134) was obtained between
age of the respondents and the willingness to pay more for environmental friendly
products signify the increase in the willingness to pay more with the increase in age.
However, from the Likert scale, the willingness to spend more money on environmental
friendly products was very strong as it ranged between totally agreed and agreed. It could
be contributed by the enthusiasm among the respondents to change and adopt a more
environmental friendly way of living (Graham et al., 2009). The perception among the
public concerning the improvement of the environmental quality, is shown in Table 5.6.
Table 5.6: Issues of the improvement of environmental quality (% of responses)
Likert scale
totally agree
(1)
agree
(2)
disagree
(3)
mean score
(1-3)
Willingness to spend more for
environmental friendly products
35.9 31.1 33 1.9
Plastic is non-degradable in
landfills
74.9 11.4 13.7 1.3
Impose extra charges on plastic
bags
31.5 28.3 40.1 2.1
Replace the use of non-degradable
with degradable plastic bags
56.8 24.1 19.0 1.6
Implementation by government to
make the use of degradable of
plastic bags a mandatory
67.3 30.8 1.9 1.3
Most respondents knew that plastic is non-degradable in the landfills. A significant
correlation (0.126) was obtained indicating that respondent knowledge on the non-
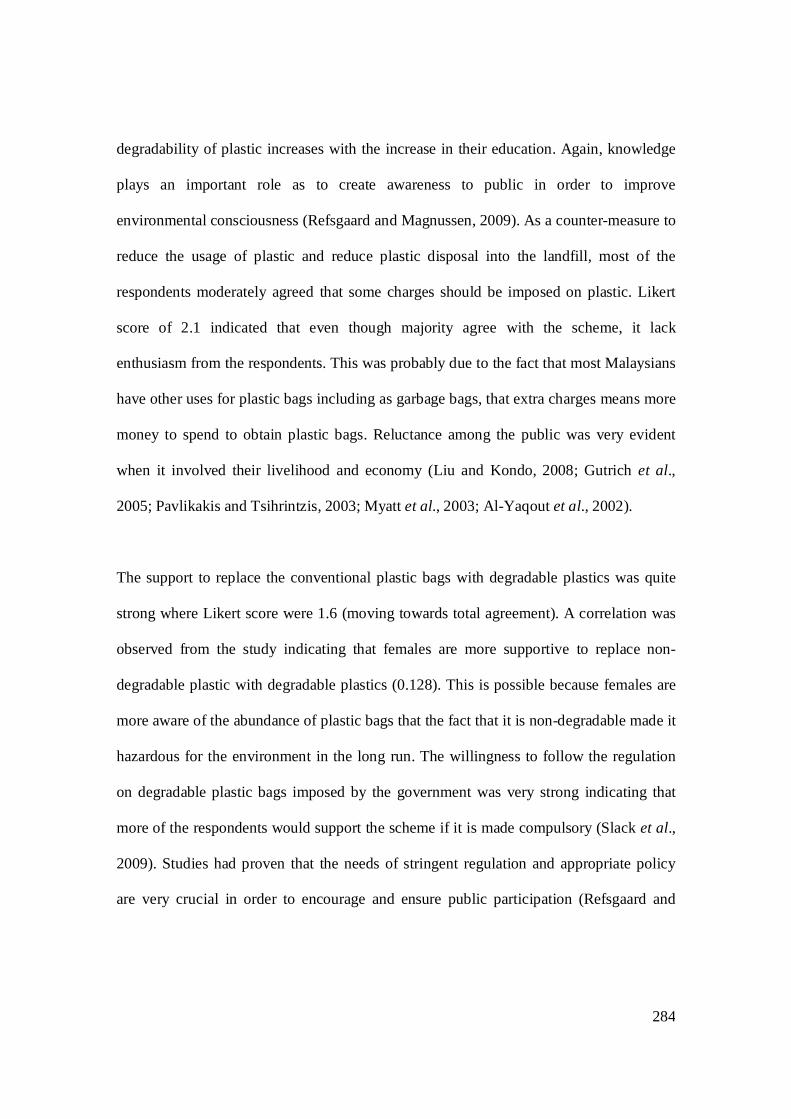
284
degradability of plastic increases with the increase in their education. Again, knowledge
plays an important role as to create awareness to public in order to improve
environmental consciousness (Refsgaard and Magnussen, 2009). As a counter-measure to
reduce the usage of plastic and reduce plastic disposal into the landfill, most of the
respondents moderately agreed that some charges should be imposed on plastic. Likert
score of 2.1 indicated that even though majority agree with the scheme, it lack
enthusiasm from the respondents. This was probably due to the fact that most Malaysians
have other uses for plastic bags including as garbage bags, that extra charges means more
money to spend to obtain plastic bags. Reluctance among the public was very evident
when it involved their livelihood and economy (Liu and Kondo, 2008; Gutrich et al.,
2005; Pavlikakis and Tsihrintzis, 2003; Myatt et al., 2003; Al-Yaqout et al., 2002).
The support to replace the conventional plastic bags with degradable plastics was quite
strong where Likert score were 1.6 (moving towards total agreement). A correlation was
observed from the study indicating that females are more supportive to replace non-
degradable plastic with degradable plastics (0.128). This is possible because females are
more aware of the abundance of plastic bags that the fact that it is non-degradable made it
hazardous for the environment in the long run. The willingness to follow the regulation
on degradable plastic bags imposed by the government was very strong indicating that
more of the respondents would support the scheme if it is made compulsory (Slack et al.,
2009). Studies had proven that the needs of stringent regulation and appropriate policy
are very crucial in order to encourage and ensure public participation (Refsgaard and

285
Magnussen, 2009; Slack et al., 2009; Malkow, 2004; Agamuthu et al., 2004; Grodzińska-
Jurczak, 2001; Subramanian, 2000; Rao et al., 2000; Irra, 1999).
5.5. General Discussions
The survey has succeeded in investigating the level of environmental awareness among
the public in Selangor, Malaysia. The awareness existed but more steps should be taken
to increase it particularly on MSW related issues. The correlations of the socio-economic
aspects of the population with the issues like waste separation and practice of recycling
are significant indicating the public’s positive perceptions on the matters.
From the survey, it is quite clear that most people are aware of related environmental
issues. However, the roles they played were very limited. Most were found to be
interested to participate in activities such as recycling if recycling facilities are available
in their area. Nevertheless some were very adamant and prefer not to agree on certain
obvious issues such as the disadvantage of plastic bag usage. This is to the extent of
being un-corporative especially when it requires them to spend more money, indicating
the presence of “not bothered” attitude.
The possibility of implementing waste separation for recycling purposes as a waste
reduction strategy is available with good responses obtained from the survey. The current
public participation in certain environmental activities such as recycling and waste
separation normally is based on personal benefits rather than environmental concern.

286
5.6 Conclusion
In general, the public in Selangor has some knowledge of the environmental issues
particularly on waste management. However, the involvement in waste separation,
recycling and utilization of environmental friendly products were very low, (less than
50%). Basically economy influenced the involvement of the public in recycling.
Participation in recycling activities was mainly to generate extra income for the
household that the market price of recyclables determined the recycling rate. On the
contrary, recycling can be promoted with the implementation of appropriate regulations.
Survey indicated that the public are more willing to participate if recycling and others are
made mandatory.