5$ - isprambiente.gov.it · Reporting Format (NRF), and the informative inventory report (IIR) to...
169
Transcript of 5$ - isprambiente.gov.it · Reporting Format (NRF), and the informative inventory report (IIR) to...

Informative Inventory Report 2017
Italian EmissionInventory 1990 - 2015
RAPPORTI
262/2017

Rapporti 262/2017
Informative Inventory Report 2017
Italian Emission Inventory 1990 - 2015

2
Legal Disclaimer
The Institute for Environmental Protection and Research, or persons acting on its behalf, are not responsible
for the use that may be made of the information contained in this report.
ISPRA - Istituto Superiore per la Protezione e la Ricerca Ambientale
Via Vitaliano Brancati, 48 – 00144 Roma
www.isprambiente.it
ISPRA, Rapporti 262/2017
ISBN 978-88-448-0823-5
Extracts from this document may be reproduced on the condition that the source is acknowledged
Graphic design:
ISPRA
Cover design: Alessia Marinelli
Cover drawing: Chiara Arcarese
Typographic coordination:
Daria Mazzella
ISPRA – Communications Area
Text available on ISPRA website at http://www.isprambiente.gov.it
3
Annual Report for submission under the UNECE Convention on Long-range Transboundary Air Pollution
Authors
Ernesto Taurino, Antonella Bernetti, Riccardo De Lauretis, Ilaria D’Elia (ENEA), Eleonora Di Cristofaro,
Andrea Gagna, Barbara Gonella, Francesca Lena, Monica Pantaleoni, Emanuele Peschi, Daniela Romano,
Marina Vitullo
Contact: Riccardo De Lauretis
telephone +39 0650072543
e-mail [email protected]
ISPRA- Institute for Environmental Protection and Research
Environmental Assessment, Control and Sustainability Department
Emissions, Prevention of Atmospheric Impacts and Climate Change Area
Air Emission Inventory Unit
Via V. Brancati, 48 00144 Rome ITALY
4
CONTENTS
EXECUTIVE SUMMARY 7
1 INTRODUCTION 8
1.1 BACKGROUND INFORMATION ON THE CONVENTION ON LONG-RANGE TRANSBOUNDARY AIR POLLUTION .......... 8
1.2 NATIONAL INVENTORY ......................................................................................................................................... 9
1.3 INSTITUTIONAL ARRANGEMENTS ......................................................................................................................... 11
1.4 INVENTORY PREPARATION PROCESS .................................................................................................................... 12
1.5 METHODS AND DATA SOURCES ............................................................................................................................ 13
1.6 KEY CATEGORIES ................................................................................................................................................ 15
1.7 QA/QC AND VERIFICATION METHODS ................................................................................................................ 19
1.8 GENERAL UNCERTAINTY EVALUATION ................................................................................................................ 21
1.9 GENERAL ASSESSMENT OF COMPLETENESS ........................................................................................................ 21
2 ANALYSIS OF KEY TRENDS BY POLLUTANT 22
2.1 MAIN POLLUTANTS.............................................................................................................................................. 22
2.1.1 Sulphur dioxide (SOX) ............................................................................................................................... 22
2.1.2 Nitrogen oxides (NOX) .............................................................................................................................. 25
2.1.3 Ammonia (NH3) ......................................................................................................................................... 28
2.1.4 Non methane volatile organic compounds (NMVOC) .............................................................................. 30
2.1.5 Carbon monoxide (CO)............................................................................................................................. 33
2.2 PARTICULATE MATTER ........................................................................................................................................ 35
2.2.1 PM10......................................................................................................................................................... 35
2.2.2 PM2.5........................................................................................................................................................ 37
2.2.3 Black Carbon (BC) ................................................................................................................................... 39
2.3 HEAVY METALS (PB, CD, HG) ............................................................................................................................. 41
2.3.1 Lead (Pb) .................................................................................................................................................. 41
2.3.2 Cadmium (Cd)........................................................................................................................................... 43
2.3.3 Mercury (Hg) ............................................................................................................................................ 45
2.4 PERSISTENT ORGANIC POLLUTANTS (POPS) ........................................................................................................ 47
2.4.1 Polycyclic aromatic hydrocarbons (PAH) ................................................................................................ 47
2.4.2 Dioxins ...................................................................................................................................................... 49
2.4.3 Hexachlorobenzene (HCB) ....................................................................................................................... 51
2.4.4 Polychlorinated biphenyl (PCB) ............................................................................................................... 53
3 ENERGY (NFR SECTOR 1) 55
3.1 OVERVIEW OF THE SECTOR .................................................................................................................................. 55
3.2 METHODOLOGICAL ISSUES .................................................................................................................................. 56
3.3 TIME SERIES AND KEY CATEGORIES ..................................................................................................................... 57
3.4 QA/QC AND VERIFICATION ................................................................................................................................. 60
3.5 RECALCULATIONS ............................................................................................................................................... 62
3.6 PLANNED IMPROVEMENTS ................................................................................................................................... 63
3.7 AVIATION (NFR SUBSECTOR 1.A.3.A) ............................................................................................................ 64
3.7.1 Overview ................................................................................................................................................... 64
3.7.2 Methodological issues ............................................................................................................................... 64
3.7.3 Time series and key categories ................................................................................................................. 66

5
3.7.4 QA/QC and Uncertainty ........................................................................................................................... 68
3.7.5 Recalculations ........................................................................................................................................... 68
3.7.6 Planned improvements .............................................................................................................................. 68
3.8 ROAD TRANSPORT (NFR SUBSECTOR 1.A.3.B)................................................................................................ 69
3.8.1 Overview ................................................................................................................................................... 69
3.8.2 Methodological issues ............................................................................................................................... 69
3.8.2.1 Exhaust emissions ................................................................................................................................ 70
3.8.2.2 Evaporative emissions .......................................................................................................................... 71
3.8.2.3 Emissions from tyre and brake wear .................................................................................................... 71
3.8.3 Activity data .............................................................................................................................................. 71
3.8.4 Time series and key categories ................................................................................................................. 77
3.8.5 QA/QC and Uncertainty ........................................................................................................................... 80
3.8.6 Recalculation ............................................................................................................................................ 81
3.8.7 Planned improvements .............................................................................................................................. 81
3.9 RAILWAYS (NFR SUBSECTOR 1.A.3.C) ........................................................................................................... 82
3.10 NAVIGATION (NFR SUBSECTOR 1.A.3.D)........................................................................................................ 83
3.10.1 Overview ................................................................................................................................................... 83
3.10.2 Methodological issues ............................................................................................................................... 83
3.10.3 Time series and key categories ................................................................................................................. 84
3.10.4 QA/QC and Uncertainty ........................................................................................................................... 85
3.10.5 Recalculations ........................................................................................................................................... 85
3.10.6 Planned improvements .............................................................................................................................. 86
3.11 PIPELINE COMPRESSORS (NFR SUBSECTOR 1.A.3.E) ....................................................................................... 86
3.12 CIVIL SECTOR: SMALL COMBUSTION AND OFF-ROAD VEHICLES (NFR SUBSECTOR 1.A.4 - 1.A.5) ................... 87
3.12.1 Overview ................................................................................................................................................... 87
3.12.2 Activity data .............................................................................................................................................. 87
3.12.3 Methodological issues ............................................................................................................................... 88
3.12.3.1 NOX emissions from gas powered plants in the civil sector ................................................................. 88
3.12.3.2 Emissions from wood combustion in the civil sector ............................................................................ 89
3.12.4 Time series and key categories ................................................................................................................. 91
3.12.5 QA/QC and Uncertainty ........................................................................................................................... 92
3.12.6 Recalculation ............................................................................................................................................ 92
3.12.7 Planned improvements .............................................................................................................................. 93
3.13 FUGITIVE EMISSIONS FROM NATURAL GAS DISTRIBUTION (NFR SUBSECTOR 1.B.2B) ..................................... 93
4 IPPU - INDUSTRIAL PROCESSES (NFR SECTOR 2) 95
4.1 OVERVIEW OF THE SECTOR .................................................................................................................................. 95
4.2 METHODOLOGICAL ISSUES .................................................................................................................................. 95
4.3 TIME SERIES AND KEY CATEGORIES ..................................................................................................................... 99
4.4 QA/QC AND VERIFICATION ............................................................................................................................... 102
4.5 RECALCULATIONS ............................................................................................................................................. 104
4.6 PLANNED IMPROVEMENTS ................................................................................................................................. 104
5 IPPU - SOLVENT AND OTHER PRODUCT USE (NFR SECTOR 2) 105
5.1 OVERVIEW OF THE SECTOR ................................................................................................................................ 105
5.2 METHODOLOGICAL ISSUES ................................................................................................................................ 106
5.3 TIME SERIES AND KEY CATEGORIES ................................................................................................................... 110
5.4 QA/QC AND VERIFICATION ............................................................................................................................... 114

6
5.5 RECALCULATIONS ............................................................................................................................................. 115
5.6 PLANNED IMPROVEMENTS ................................................................................................................................. 115
6 AGRICULTURE (NFR SECTOR 3) 116
6.1 OVERVIEW OF THE SECTOR ................................................................................................................................ 116
6.2 METHODOLOGICAL ISSUES ................................................................................................................................ 117
6.3 TIME SERIES AND KEY CATEGORIES ................................................................................................................... 124
6.4 QA/QC AND VERIFICATION ............................................................................................................................... 127
6.5 RECALCULATIONS ............................................................................................................................................. 128
6.6 PLANNED IMPROVEMENTS ................................................................................................................................. 128
7 WASTE (NFR SECTOR 5) 130
7.1 OVERVIEW OF THE SECTOR ................................................................................................................................ 130
7.2 METHODOLOGICAL ISSUES ................................................................................................................................ 131
7.3 TIME SERIES AND KEY CATEGORIES ................................................................................................................... 138
7.4 RECALCULATIONS ............................................................................................................................................. 144
7.5 PLANNED IMPROVEMENTS ................................................................................................................................. 145
8 RECALCULATIONS AND IMPROVEMENTS 146
8.1 RECALCULATIONS ............................................................................................................................................. 146
8.2 PLANNED IMPROVEMENTS ................................................................................................................................. 148
9 PROJECTIONS 149
9.1 THE NATIONAL FRAMEWORK ............................................................................................................................. 149
9.2 INPUT SCENARIOS .............................................................................................................................................. 150
9.3 THE HARMONIZATION PROCESS ......................................................................................................................... 151
9.4 THE EMISSION SCENARIO ................................................................................................................................... 154
10 REFERENCES 158
10.1 INTRODUCTION .................................................................................................................................................. 158
10.2 ANALYSIS OF KEY TRENDS BY POLLUTANT ........................................................................................................ 158
10.3 ENERGY (NRF SECTOR 1) .................................................................................................................................. 159
10.4 IPPU - INDUSTRIAL PROCESSES (NRF SECTOR 2) .............................................................................................. 162
10.5 IPPU - SOLVENT AND OTHER PRODUCT USE (NRF SECTOR 2) ........................................................................... 163
10.6 AGRICULTURE (NRF SECTOR 3) ........................................................................................................................ 164
10.7 WASTE (NRF SECTOR 5) ................................................................................................................................... 165
10.8 RECALCULATIONS AND IMPROVEMENTS............................................................................................................ 167
10.9 PROJECTIONS ..................................................................................................................................................... 167

7
EXECUTIVE SUMMARY
The Italian Informative Inventory Report (IIR) is edited in the framework of the United Nations
Economic Commission for Europe (UNECE) Convention on Long Range Transboundary Air Pollution
(CLRTAP). It contains information on the Italian inventory up to the year 2015, including an explanation of
methodologies, data sources, QA/QC activities and verification processes carried out during the inventory
compilation, with an analysis of emission trends and a description of key categories.
The aim of the document is to facilitate understanding of the calculation of the Italian air pollutant
emission data, hence providing a common mean for comparing the relative contribution of different emission
sources and supporting the identification of reduction policies.
The Institute for Environmental Protection and Research (ISPRA) has the overall responsibility for the
emission inventory submission to CLRTAP, as well as to the United Nations Framework Convention on
Climate Change (UNFCCC), and is in charge of all the work related to inventory compilation.
In particular, in compliance with the LRTAP Convention, Italy has to submit annually data on national
emissions of SOX, NOX, NMVOC, CO and NH3, and various heavy metals and POPs. The submission
consists of the national emission inventory, communicated through compilation of the Nomenclature
Reporting Format (NRF), and the informative inventory report (IIR) to ensure the properties of transparency,
consistency, comparability, completeness and accuracy.
In the period 1990-2015, emissions from almost all the pollutants described in this report show a
downward trend. Reductions are especially relevant for the main pollutants (SOX -93%; NOX -62%; CO -
67%; NMVOC -56%) and lead (-94%). The major drivers for the trend are reductions in the industrial and
road transport sectors, due to the implementation of various European Directives which introduced new
technologies, plant emission limits, the limitation of sulphur content in liquid fuels and the shift to cleaner
fuels. Emissions have also decreased for the improvement of energy efficiency as well as the promotion of
renewable energy.
The energy sector is the main source of emissions in Italy with a share of more than 80%, including
fugitive emissions, for many pollutants (SOX 90%; NOX 96%; CO 95%; PM2.5 91%; PM10 85%; BC 95%;
Cd 83%, PAH 82%). The industrial processes sector is an important source of emissions specifically related
to the iron and steel production, at least for particulate matter, heavy metals and POPs, whereas significant
emissions of SOX derive from cement production; on the other hand, the solvent and other product use sector
is characterized by NMVOC emissions. The agriculture sector is the main source of NH3 emissions in Italy
with a share of 96% in national total. Finally, the waste sector, specifically waste incineration, is a relevant
source for HCB and PAH emissions (68% and 8%, respectively).
Emission figures of the Italian emission inventory and other related documents are publicly available at
http://www.sinanet.isprambiente.it/it/sia-ispra/serie-storiche-emissioni.

8
1 INTRODUCTION
1.1 Background information on the Convention on Long-range Transboundary
Air Pollution
The 1979 Geneva Convention on Long-range Transboundary Air Pollution, contributing to the
development of international environmental law, is one of the fundamental international means for the
protection of the human health and the environment through the intergovernmental cooperation.
The fact that air pollutants could travel several thousands of kilometres before deposition and damage
occurred outlined the need for international cooperation.
In November 1979, in Geneva, 34 Governments and the European Community (EC) signed the
Convention. The Convention on Long-range Transboundary Air Pollution was ratified by Italy in the year
1982 and entered into force in 1983. It has been extended by the following eight specific protocols:
The 1984 Protocol on Long-term Financing of the Cooperative Programme for Monitoring and
Evaluation of the Long-range Transmission of Air Pollutants in Europe (EMEP); 42 Parties. Entered
into force on 28th January 1988.
The 1985 Protocol on the Reduction of Sulphur Emissions or their Transboundary Fluxes by at least
30 per cent; 23 Parties. Entered into force on 2nd September 1987.
The 1988 Protocol concerning the Control of Nitrogen Oxides or their Transboundary Fluxes; 31
Parties. Entered into force on 14th February 1991.
The 1991 Protocol concerning the Control of Emissions of Volatile Organic Compounds or their
Transboundary Fluxes; 22 Parties. Entered into force on 29th September 1997.
The 1994 Protocol on Further Reduction of Sulphur Emissions; 27 Parties. Entered into force on 5th
August 1998.
The 1998 Protocol on Heavy Metals; 28 Parties. Entered into force on 29 December 2003.
The 1998 Protocol on Persistent Organic Pollutants (POPs); 28 Parties. Entered into force on 23rd
October 2003.
The 1999 Protocol to Abate Acidification, Eutrophication and Ground-level Ozone; 23 Parties.
Entered into force on 17th May 2005. (Guidance documents to Protocol adopted by decision 1999/1).
The following table shows the dates of signature and ratification of Convention and Protocols for Italy.
Table 1.1 Dates of signature and ratification of the UNECE Convention and Protocols
SIGNATURE RATIFICATION
1979 Convention 14/11/1979 15/07/1982
1984 EMEP Protocol 28/09/1984 12/01/1989
1985 Sulphur Protocol 09/07/1985 05/02/1990
1988 NOX Protocol 01/11/1988 19/05/1992
1991 VOC Protocol 19/11/1991 30/06/1995
1994 Sulphur Protocol 14/06/1994 14/09/1998
1998 Heavy Metals Protocol 24/06/1998
1998 POPs Protocol 24/06/1998 20/06/2006
1999 Multi-effect Protocol (reviewed in
2012) 01/12/1999
The following classes of pollutants should be included in the emission inventory:

9
Main Pollutants
Sulphur oxides (SOX), in mass of SO2;
Nitrous oxides (NOX), in mass of NO2;
Non-methane volatile organic compounds (NMVOC);
Ammonia (NH3);
Carbon monoxide (CO).
Particulate matter
TSP, total suspended particulate;
PM10, particulate matter less than 10 microns in diameter;
PM2.5, particulate matter less than 2.5 microns in diameter;
Black carbon.
Heavy Metals
Priority Metals: Lead (Pb), Cadmium (Cd) and Mercury (Hg);
Other metals: Arsenic (As), Chrome (Cr), Copper (Cu), Nickel (Ni), Selenium (Se) and Zinc (Zn).
Persistent organic pollutants (POPs)
As specified in Annex II of the POPs Protocol, including Polychlorinated Biphenyls (PCBs);
As specified in Annex III of the POPs Protocol: Dioxins (Diox), Polycyclic Aromatic Hydrocarbons
(PAHs), Hexachlorobenzene (HCB).
1.2 National Inventory
As a Party to the United Nations Economic Commission for Europe (UNECE) Convention on Long
Range Transboundary Air Pollution (CLRTAP), Italy has to submit annually data on emissions of air
pollutants in order to fulfil obligations, in compliance with the implementation of Protocols under the
Convention. Parties are required to report on annual national emissions of SOX, NOX, NMVOC, CO and
NH3, and various heavy metals and POPs according to the Guidelines for Reporting Emission Data under the
Convention on Long-range Transboundary Air Pollution (UNECE, 2008).
Specifically, the submission consists of the national LRTAP emission inventory, communicated through
compilation of the Nomenclature Reporting Format (NRF), and the Informative Inventory Report (IIR).
The Italian informative inventory report contains information on the national inventory for the year 2015,
including descriptions of methods, data sources, QA/QC activities carried out and a trend analysis. The
inventory accounts for anthropogenic emissions of the following substances: sulphur oxides (SOX), nitrogen
oxides (NOX), ammonia (NH3), non-methane volatile organic compounds (NMVOC), carbon monoxide
(CO), total suspended particulate (TSP), particulate matter, particles of size <10 μm, (PM10), particulate
matter, particles of size < 2.5μm, (PM2.5), black carbon (BC), lead (Pb), cadmium (Cd), mercury (Hg),
arsenic (As), chromium (Cr), copper (Cu), nickel (Ni), selenium (Se), zinc (Zn), polychlorinated biphenyls
(PCBs), polycyclic aromatic hydrocarbons (PAH), dioxins (Diox), hexachlorobenzene (HCB). Other
pollutants are reported as not estimated; more in details polycyclic aromatic hydrocarbons have not been
estimates for each compound and further investigation is planned to verify these emissions.

10
Detailed information on emission figures of primary pollutants, particulate matter, heavy metals and
persistent organic pollutants as well as estimation procedures are provided in order to improve the
transparency, consistency, comparability, accuracy and completeness of the inventory provided.
The national inventory is updated annually in order to reflect revisions and improvements in the
methodology and the availability of new information. Changes are applied retrospectively to earlier years,
which accounts for any difference in previously published data.
Total emissions by pollutant from 1990 to 2015 are reported in Table 1.2.
Table 1.2 Emission time series by pollutant
1990 1995 2000 2005 2010 2011 2012 2013 2014 2015
SOX Gg 1,783 1,322 755 408 217 195 177 145 131 123
NOX Gg 2,032 1,907 1,451 1,233 948 915 852 799 787 763
NMVOC Gg 1,936 1,967 1,516 1,232 1,001 911 907 877 821 842
NH3 Gg 471 451 453 422 389 402 416 403 394 393
CO Gg 7,246 7,297 4,919 3,430 3,059 2,416 2,660 2,489 2,258 2,356
As Mg 36 27 45 40 45 46 45 44 44 45
Cd Mg 10 9 9 8 7 7 7 7 7 6
Cr Mg 91 74 52 59 52 52 50 46 44 45
Cu Mg 136 148 145 149 131 133 128 120 124 120
Hg Mg 12 10 9 10 9 9 8 8 8 8
Ni Mg 113 108 103 108 38 36 34 30 29 30
Pb Mg 4,344 2,037 957 284 266 263 266 257 260 255
Se Mg 9 10 11 12 11 11 11 10 10 10
Zn Mg 966 953 916 987 915 973 941 882 876 860
TSP Gg 323 317 273 244 260 205 236 229 209 221
PM10 Gg 271 265 225 198 213 165 192 186 169 179
PM2.5 Gg 221 218 189 166 190 143 171 166 150 160
BC Gg 47 46 42 38 32 27 28 26 24 24
PAH Mg 99 101 68 73 96 74 91 86 76 82
Dioxin g ITeq 503 484 404 327 309 268 287 282 269 280
HCB kg 43 38 25 21 14 17 22 21 20 20
PCB kg 289 301 266 278 211 218 225 204 198 195
The NRF files and other related documents can be found on website at the following address:
http://www.sinanet.isprambiente.it/it/sia-ispra/serie-storiche-emissioni.

11
1.3 Institutional arrangements
The Institute for Environmental Protection and Research (ISPRA) has the overall responsibility for the
compilation of the national emission inventory and submissions to CLRTAP. The institute is also responsible
for the communication of pollutants under the NEC directive as well as, jointly with the Agency for New
Technologies, Energy and Sustainable Economic Development (ENEA), the development of emission
scenarios, as established by the Legislative Decree n. 171 of 21st May 2004. Every five years, from 2012
with reference to 2010 emissions, ISPRA shall provide the disaggregation of the national inventory at
provincial level as instituted by the Legislative Decree n. 155 of 13th August 2010. Moreover, ISPRA is the
single entity in charge of the development and compilation of the national greenhouse gas emission
inventory as indicated by the Legislative Decree n. 51 of 7th March 2008. The Ministry for the Environment,
Land and Sea is responsible for the endorsement and for the communication of the inventory to the
Secretariat of the different conventions.
The Italian National System currently in place is fully described in the document ‘National Greenhouse
Gas Inventory System in Italy’ (ISPRA, 2016).
A specific unit of the Institute is responsible for the compilation of the Italian Atmospheric Emission
Inventory and the Italian Greenhouse Gas Inventory in the framework of both the Convention on Climate
Change and the Convention on Long Range Transboundary Air Pollution. The whole inventory is compiled
by the institute; scientific and technical institutions and consultants may help in improving information both
on activity data and emission factors of specific activities. All the measures to guarantee and improve the
transparency, consistency, comparability, accuracy and completeness of the inventory are undertaken.
ISPRA bears the responsibility for the general administration of the inventory, co-ordinates participation
in review processes, publishes and archives the inventory results.
Specifically, ISPRA is responsible for all aspects of national inventory preparation, reporting and quality
management. Activities include the collection and processing of data from different data sources, the
selection of appropriate emissions factors and estimation methods consistent with the EMEP/EEA
guidebook, the IPCC 1996 Revised Guidelines, the IPCC Good Practice Guidance and Uncertainty
management and the IPCC Good Practice Guidance for land use, land-use change and forestry, and the
IPCC 2006 Guidelines, the compilation of the inventory following the QA/QC procedures, the preparation of
the Informative Inventory Report and the reporting through the Nomenclature Reporting Format, the
response to review checks, the updating and data storage.
Different institutions are responsible for statistical basic data and data publication, which are primary to
ISPRA for carrying out estimates. These institutions are part of the National Statistical System (Sistan),
which provides national official statistics, and therefore are asked periodically to update statistics; moreover,
the National Statistical System ensures the homogeneity of the methods used for official statistics data
through a coordination plan, involving the entire public administration at central, regional and local levels.
The main Sistan products, which are primarily necessary for the inventory compilation, are:
National Statistical Yearbooks, Monthly Statistical Bulletins, by ISTAT (National Institute of
Statistics);
Annual Report on the Energy and Environment, by ENEA (Agency for New Technologies, Energy
and the Environment);
National Energy Balance (annual), Petrochemical Bulletin (quarterly publication), by MSE (Ministry
of Economic Development);
Transport Statistics Yearbooks, by MIT (Ministry of Transportation);
Annual Statistics on Electrical Energy in Italy, by TERNA (National Independent System Operator);
Annual Report on Waste, by ISPRA;
National Forestry Inventory, by MIPAAF (Ministry of Agriculture, Food and Forest Policies).
The national emission inventory itself is a Sistan product (ISPRA).

12
Other information and data sources are used to carry out emission estimates, which are generally referred
to in Table 1.3 in the following section 1.5.
1.4 Inventory preparation process
ISPRA has established fruitful cooperation with a number of governmental and research institutions as
well as industrial associations, which helps improving information about some leading categories of the
inventory. Specifically, these activities aim at the improvement of provision and collection of basic data and
emission factors, through plant-specific data, and exchange of information on scientific researches and new
sources. Moreover, when in depth investigation is needed and estimates are affected by a high uncertainty,
sectoral studies are committed to ad hoc research teams or consultants.
ISPRA also coordinates with different national and regional authorities and private institutions for the
cross-checking of parameters and estimates, as well as with ad hoc expert panels, in order to improve the
completeness and transparency of the inventory.
The main basic data needed for the preparation of the national emission inventory are energy statistics,
published by the Ministry of Economic Development (MSE) in the National Energy Balance (BEN),
statistics on industrial and agricultural production, published by the National Institute of Statistics (ISTAT),
statistics on transportation, provided by the Ministry of Transportation (MIT), and data supplied directly by
the relevant professional associations.
Emission factors and methodologies used in the estimation process are consistent with the EMEP/EEA
Guidebook, the IPCC Guidelines and Good Practice Guidance as well as supported by national experiences
and circumstances.
For the industrial sector, emission data collected through the National Pollutant Release and Transfer
Register (PRTR), the Large Combustion Plant (LCP) Directive and in the framework of the European
Emissions Trading Scheme have yielded considerable developments in the inventory of the relevant sectors.
In fact, these data, even if not always directly used, are taken into account as a verification of emission
estimates and improve national emissions factors as well as activity data figures.
In addition, final estimates are checked and verified also in view of annual environmental reports by
industries.
For large industrial point sources, emissions are registered individually, when communicated, based upon
detailed information such as fuel consumption.
Other small plants communicate their emissions which are also considered individually.
Emission estimates are drawn up for each sector. Final data are communicated to the UNECE Secretariat
filling in the NRF files.
The process of the inventory preparation is carried out annually. In addition to a new year, the entire time
series is checked and revised during the annual compilation of the inventory. In particular, recalculations are
elaborated on account of changes in the methodologies used to carry out emission estimates, changes due to
different allocation of emissions as compared to previous submissions and changes due to error corrections.
The inventory may also be expanded by including categories not previously estimated if sufficient
information on activity data and suitable emission factors have been identified and collected. Information on
the major recalculations is provided in the sectoral chapter of the report.
All the reference material, estimates and calculation sheets, as well as the documentation on scientific
papers and the basic data needed for the inventory compilation, are stored and archived at the Institute. After
each reporting cycle, all database files, spreadsheets and electronic documents are archived as ‘read-only-
files’ so that the documentation and estimates could be traced back during the new year inventory
compilation or a review process.
Technical reports and emission figures are publicly accessible on the web at the address
http://www.sinanet.isprambiente.it/it/sia-ispra/serie-storiche-emissioni.

13
1.5 Methods and data sources
An outline of methodologies and data sources used in the preparation of the emission inventory for each
sector is provided in the following. In Table 1.3 a summary of the activity data and sources used in the
inventory compilation is reported.
Table 1.3 Main activity data and sources for the Italian Emission Inventory
Methodologies are consistent with the EMEP/EEA Emission Inventory Guidebook, Revised 1996 and
2006 IPCC Guidelines, and IPCC Good Practice Guidance (EMEP/CORINAIR, 2007; EMEP/EEA, 2009;
EMEP/EEA, 2013; EMEP/EEA, 2016; IPCC, 1997; IPCC, 2000; IPCC, 2006); national emission factors are
used as well as default emission factors from international guidebooks, when national data are not available.
The development of national methodologies is supported by background documents.
The most complete document describing national methodologies used in the emission inventory
1 Energy 1A1 Energy Industries Fuel use Energy Balance - Ministry of Economic Development
Major national electricity producers European Emissions Trading Scheme
1A2 Manufacturing Industries Fuel use Energy Balance - Ministry of Economic Development and Construction Major National Industry Corporation
European Emissions Trading Scheme
1A3 Transport Fuel use Energy Balance - Ministry of Economic Development Number of vehicles Statistical Yearbooks - National Statistical System Aircraft landing and take-off Statistical Yearbooks - Ministry of Transportation cycles and maritime activities Statistical Yearbooks - Italian Civil Aviation Authority (ENAC)
Maritime and Airport local authorities
1A4 Residential-public-commercial sector Fuel use Energy Balance - Ministry of Economic Development
1B Fugitive Emissions from Fuel Amount of fuel treated, Energy Balance - Ministry of Economic Development stored, distributed Statistical Yearbooks - Ministry of Transportation
Major National Industry Corporation
2 Industrial Processes Production data National Statistical Yearbooks- National Institute of Statistics International Statistical Yearbooks-UN European Emissions Trading Scheme European Pollutant Release and Transfer Register Sectoral Industrial Associations
3 Solvent and Other Product Use Amount of solvent use National Environmental Publications - Sectoral Industrial Associations International Statistical Yearbooks - UN
4 Agriculture Agricultural surfaces Agriculture Statistical Yearbooks - National Institute of Statistics Production data Sectoral Agriculture Associations Number of animals Fertilizer consumption
5 Land Use, Land Use Change Forest and soil surfaces Statistical Yearbooks - National Institute of Statistics and Forestry Amount of biomass State Forestry Corps
Biomass burnt National and Regional Forestry Inventory Biomass growth Universities and Research Institutes
6 Waste Amount of waste National Waste Cadastre - Institute for Environmental Protection and Research , National Waste Observatory
ACTIVITY DATA SOURCE SECTOR
14
compilation is the National Inventory Report, submitted in the framework of the UN Convention on Climate
Change and the Kyoto Protocol (ISPRA, 2017 [a]).
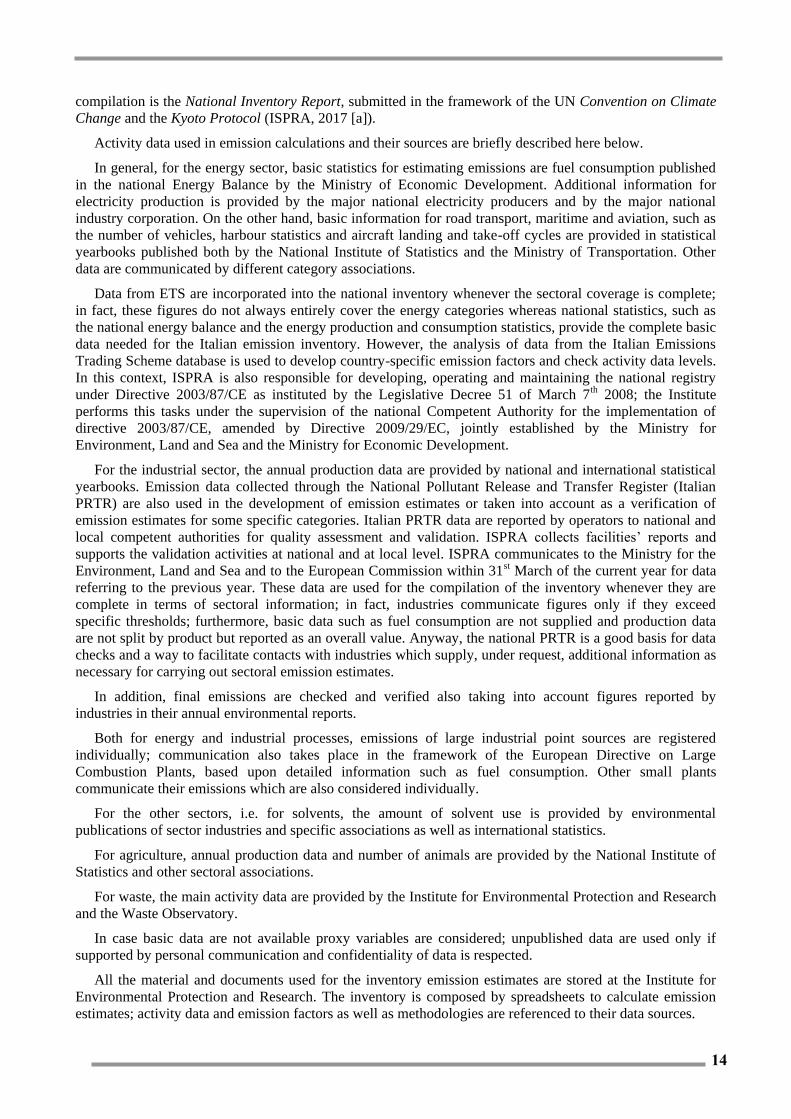
Activity data used in emission calculations and their sources are briefly described here below.
In general, for the energy sector, basic statistics for estimating emissions are fuel consumption published
in the national Energy Balance by the Ministry of Economic Development. Additional information for
electricity production is provided by the major national electricity producers and by the major national
industry corporation. On the other hand, basic information for road transport, maritime and aviation, such as
the number of vehicles, harbour statistics and aircraft landing and take-off cycles are provided in statistical
yearbooks published both by the National Institute of Statistics and the Ministry of Transportation. Other
data are communicated by different category associations.
Data from ETS are incorporated into the national inventory whenever the sectoral coverage is complete;
in fact, these figures do not always entirely cover the energy categories whereas national statistics, such as
the national energy balance and the energy production and consumption statistics, provide the complete basic
data needed for the Italian emission inventory. However, the analysis of data from the Italian Emissions
Trading Scheme database is used to develop country-specific emission factors and check activity data levels.
In this context, ISPRA is also responsible for developing, operating and maintaining the national registry
under Directive 2003/87/CE as instituted by the Legislative Decree 51 of March 7th 2008; the Institute
performs this tasks under the supervision of the national Competent Authority for the implementation of
directive 2003/87/CE, amended by Directive 2009/29/EC, jointly established by the Ministry for
Environment, Land and Sea and the Ministry for Economic Development.
For the industrial sector, the annual production data are provided by national and international statistical
yearbooks. Emission data collected through the National Pollutant Release and Transfer Register (Italian
PRTR) are also used in the development of emission estimates or taken into account as a verification of
emission estimates for some specific categories. Italian PRTR data are reported by operators to national and
local competent authorities for quality assessment and validation. ISPRA collects facilities’ reports and
supports the validation activities at national and at local level. ISPRA communicates to the Ministry for the
Environment, Land and Sea and to the European Commission within 31st March of the current year for data
referring to the previous year. These data are used for the compilation of the inventory whenever they are
complete in terms of sectoral information; in fact, industries communicate figures only if they exceed
specific thresholds; furthermore, basic data such as fuel consumption are not supplied and production data
are not split by product but reported as an overall value. Anyway, the national PRTR is a good basis for data
checks and a way to facilitate contacts with industries which supply, under request, additional information as
necessary for carrying out sectoral emission estimates.
In addition, final emissions are checked and verified also taking into account figures reported by
industries in their annual environmental reports.
Both for energy and industrial processes, emissions of large industrial point sources are registered
individually; communication also takes place in the framework of the European Directive on Large
Combustion Plants, based upon detailed information such as fuel consumption. Other small plants
communicate their emissions which are also considered individually.
For the other sectors, i.e. for solvents, the amount of solvent use is provided by environmental
publications of sector industries and specific associations as well as international statistics.
For agriculture, annual production data and number of animals are provided by the National Institute of
Statistics and other sectoral associations.
For waste, the main activity data are provided by the Institute for Environmental Protection and Research
and the Waste Observatory.
In case basic data are not available proxy variables are considered; unpublished data are used only if
supported by personal communication and confidentiality of data is respected.
All the material and documents used for the inventory emission estimates are stored at the Institute for
Environmental Protection and Research. The inventory is composed by spreadsheets to calculate emission
estimates; activity data and emission factors as well as methodologies are referenced to their data sources.

15
A ‘reference’ database has also been developed to increase the transparency of the inventory; at the
moment, it is complete as far as references to greenhouse gas emissions are concerned.
1.6 Key categories
A key category analysis of the Italian inventory is carried out according to the Tier 1 method described in
the EMEP/EEA Guidebook (EMEP/EEA, 2016). According to these guidelines, a key category is defined as
an emission category that has a significant influence on a country’s inventory in terms of the absolute level
in emissions. Key categories are those which, when summed together in descending order of magnitude, add
up to over 80% of the total emissions.
National emissions have been disaggregated into the categories reported in the National Format Report;
details vary according to different pollutants in order to reflect specific national circumstances. Results are
reported in the following tables for the year 1990 (Table 1.4) and 2015 (Table 1.5) by pollutant.
The trend analysis has also been applied considering 1990 and 2015. The results are reported in Table 1.6.

16
Table 1.4 Key categories for the Italian Emission Inventory in 1990
Key categories in 1990 Total (%)
SOx 1A1a
(43.1%)
1A2f
(17.0%)
1A1b
(10.8%)
1A3d ii
(4.4%)
1A4b i
(4.1%)
1B2a iv
(3.8%) 83.1
NOx 1A3b i
(26.1%)
1A1a
(20.1%)
1A3b iii
(16.8%)
1A2f
(12.2%)
1A4c ii
(5.0%) 80.3
NH3 3Da2a
(21.6%)
3B1a
(20.9%)
3B1b
(18.0%)
3Da1
(15.6%)
3B3
(7.7%) 83.8
NMVOC 1A3b i
(24.7%)
2D3d
(14.0%)
1A3b v
(9.6%)
1A3b iv
(7.9%)
2D3a
(6.0%)
1A4b i
(5.1%)
2D3g
(4.0%)
1A4c ii
(3.6%)
2D3i
(3.4%)
1B2a v
(3.1%) 81.3
CO 1A3b i
(62.7%)
1A4b i
(10.9%)
1A3b iv
(7.0%) 80.5
PM10 1A4b i
(24.8%)
1A1a
(13.9%)
1A2f
(10.6%)
1A3b i
(6.9%)
1A4c ii
(5.9%)
1A3b iii
(5.1%)
1A3b ii
(3.7%)
1A3d ii
(3.4%)
3B4g ii
(3.0%)
1A3b vi
(2.9%) 80.1
PM2.5 1A4b i
(30.1%)
1A1a
(11.3%)
1A2f
(8.8%)
1A3b i
(8.4%)
1A4c ii
(7.2%)
1A3b iii
(6.2%)
1A3b ii
(4.5%)
1A3d ii
(4.2%) 80.9
BC 1A3b i
(21.6%)
1A4c ii
(19.4%)
1A3b iii
(14.8%)
1A3b ii
(11.8%)
1A4b i
(11.2%)
1A2g vii
(5.0%) 83.8
Pb 1A3b i
(77.2%)
1A2f
(6.1%) 83.3
Cd 1A2f
(56.2%)
2C1
(13.2%)
1A4b i
(10.1%)
1A4a i
(3.8%) 83.4
Hg 1A2f
(36.0%)
2B10a
(24.2%)
2C1
(19.8%) 80.0
PAH 2C1
(45.5%)
1A4b i
(32.1%)
1A1c
(8.4%) 86.0
Dioxin 1A2f
(23.3%)
1A4a i
(20.6%)
1A4b i
(13.9%)
2C1
(13.4%)
5C1a
(8.5%)
5C1b i
(6.2%) 85.9
HCB 3Df
(54.2)
5C1b iv
(23.9%)
1A2f
(11.2%) 89.4
PCB 1A1a
(39.0%)
2C1
(31.7%)
1A2f
(19.4%) 90.1
1 Energy 2 IPPU - Solvent and product use 5 Waste
2 IPPU - Industry 3 Agriculture

17
Table 1.5 Key categories for the Italian Emission Inventory in 2015
Key categories in 2015 Total (%)
SOx 1A2f
(21.8%)
1A3d ii
(17.1%)
1B2a iv
(14.6%)
1A1a
(14.2%)
1A1b
(8.3%)
2A1
(5.1%) 81.1
NOx 1A3b iii
(23.8%)
1A3b i
(20.5%)
1A3d ii
(9.2%)
1A2f
(8.5%)
1A3b ii
(6.7%)
1A4b i
(5.6%)
1A1a
(4.8%)
1A4c ii
(4.6%) 83.5
NH3 3Da2a
(19.1%)
3B1a
(16.6%)
3B1b
(16.4%)
3Da1
(15.1%)
3B3
(9.2%)
3B4g ii
(3.9%) 80.3
NMVOC 1A4b i
(20.5%)
2D3d
(18.8%)
2D3a
(9.4%)
1A3b v
(6.8%)
2D3g
(6.2%)
1A3b iv
(6.1%)
1A4a i
(3.0%)
1A3b i
(2.9%)
2D3 i
(2.8%)
2H2
(2.6%) 80.1
CO 1A4b i
(60.8%)
1A3b i
(11.6%)
1A3b iv
(6.4%)
1A2f
(3.8%) 82.5
PM10 1A4b i
(61.1%)
1A3b vi
(4.8%)
1A2f
(3.8%)
1A3b i
(3.1%)
1A3d ii
(3.1%)
2C1
(2.6%)
1A3b iii
(2.2%) 80.7
PM2.5 1A4b i
(67.7%)
1A2f
(3.5%)
1A3b i
(3.5%)
1A3d ii
(3.4%)
1A3b vi
(2.9%) 81.1
BC 1A4b i
(38.7%)
1A3b i
(18.7%)
1A3b iii
(10.7%)
1A3b ii
(9.3%)
1A4c ii
(6.6%) 84.0
Pb 1A2f
(37.5%)
1A4a i
(26.5%)
2C1
(25.0%) 88.9
Cd 1A4a i
(34.0%)
1A2f
(32.0%)
2C1
(15.5%) 81.5
Hg 2C1
(31.7%)
1A4a i
(28.1%)
1A2f
(26.7%) 86.5
PAH 1A4b i
(71.7%)
2C1
(10.0%) 81.7
Dioxin 1A4b i
(41.2%)
2C1
(27.4%)
1A2f
(20.0%) 88.6
HCB 5C1b iv
(62.5%)
1A2f
(12.8%)
1A4b i
(7.9%) 83.3
PCB 2C1
(40.6%)
1A1a
(33.6%)
1A2f
(9.1%) 83.3
1 Energy 2 IPPU - Solvent and product use 5 Waste
2 IPPU - Industry 3 Agriculture

18
Table 1.6 Key categories for the Italian Emission Inventory in trend 1990-2015
Key categories in trend Total (%)
SOX 1A1a
(35.6%)
1A3d ii
(15.7%)
1B2a iv
(13.3%)
1A2f
(6.0%)
2A1
(4.8%)
1A3b i
(4.0%)
1A4a i
(3.6%) 82.8
NOX 1A1a
(27.9%)
1A3b iii
(12.7%)
1A3b i
(10.1%)
1A3d ii
(8.1%)
1A4a i
(7.1%)
1A2f
(6.9%)
1A3b ii
(6.2%)
1A4b i
(5.5%) 84.5
NH3 3B1a
(19.5%)
3Da2a
(11.9%)
3Da2c
(10.9%)
3B4a
(9.8%)
3B1b
(7.5%)
3B4g i
(7.1%)
3B3
(6.9%)
1A3b i
(6.3%)
3B4g ii
(6.0%) 85.8
NMVOC 1A3b i
(31.0%)
1A4b i
(21.9%)
2D3d
(8.3%)
2D3a
(4.8%)
1A4a i
(4.1%)
1A3b v
(3.9%)
1A4c ii
(3.6%)
2D3g
(3.1%) 80.7
CO 1A3b i
(44.8%)
1A4b i
(43.7%) 87.4
PM10 1A4b i
(43.7%)
1A1a
(16.2%)
1A2f
(8.2%)
1A4c ii
(5.2%)
1A3b i
(4.5%)
1A3b iii
(3.4%) 81.3
PM2.5 1A4b i
(45.8%)
1A1a
(13.4%)
1A4c ii
(6.7%)
1A2f
(6.5%)
1A3b i
(6.1%)
1A3b iii
(4.6%) 82.9
BC 1A4b i
(42.8%)
1A4c ii
(19.9%)
1A3b iii
(6.4%)
1A2g vii
(5.9%)
1A3b i
(4.4%)
1A3b ii
(3.9%) 83.3
Pb 1A3b i
(42.2%)
1A2f
(17.1%)
1A4a i
(14.4%)
2C1
(12.9%) 86.6
Cd 1A4a i
(43.0%)
1A2f
(34.5%)
1A4b i
(4.1%) 81.6
Hg 1A4a i
(32.6%)
2B10a
(30.8%)
2C1
(15.5%)
1A2f
(12.1%) 91.1
PAH 1A4b i
(43.6%)
2C1
(39.1%) 82.8
Dioxin 1A4b i
(30.1%)
1A4a i
(21.7%)
2C1
(15.5%)
5C1a
(9.4%)
5C1b i
(6.8%) 83.5
HCB 3Df
(49.1%)
5C1b iv
(36.2%) 85.3
PCB 1A2
(26.3%)
2C1
(22.9%)
1A4a i
(14.4%)
1A1a
(14.1%)
1A4b i
(12.6%) 90.3
1 Energy 2 IPPU - Solvent and product use 5 Waste
2 IPPU - Industry 3 Agriculture
19
1.7 QA/QC and Verification methods
ISPRA has elaborated an inventory QA/QC procedures manual which describes specific QC procedures
to be implemented during the inventory development process, facilitates the overall QA procedures to be
conducted, as far as possible, on the entire inventory and establishes quality objectives (ISPRA, 2014).
Specific QA/QC procedures and different verification activities implemented thoroughly in the current
inventory compilation are figured out in the annual QA/QC plans (ISPRA, 2017 [b]).
Quality control checks and quality assurance procedures together with some verification activities are
applied both to the national inventory as a whole and at sectoral level. Future planned improvements are
prepared for each sector by the relevant inventory compiler; each expert identifies areas for sectoral
improvement based on his own knowledge and in response to different inventory review processes.
In addition to routine general checks, source specific quality control procedures are applied on a case by
case basis, focusing on key categories and on categories where significant methodological and data revision
have taken place or new sources.
Checklists are compiled annually by the inventory experts and collected by the QA/QC coordinator.
These lists are also registered in the ‘reference’ database.
General QC procedures also include data and documentation gathering. Specifically, the inventory analyst
for a source category maintains a complete and separate project archive for that source category; the archive
includes all the materials needed to develop the inventory for that year and is kept in a transparent manner.
Quality assurance procedures regard different verification activities of the inventory.
Feedbacks for the Italian inventory derive from communication of data to different institutions and/or at
local level. Emission figures are also subjected to a process of re-examination once the inventory, the
inventory related publications and the national inventory reports are posted on website, specifically
www.isprambiente.gov.it.
The preparation of environmental reports where data are needed at different aggregation levels or refer to
different contexts, such as environmental and economic accountings, is also a check for emission trends. At
national level, for instance, emission time series are reported in the Environmental Data Yearbooks
published by the Institute, in the Reports on the State of the Environment by the Ministry for the
Environment, Land and Sea and, moreover, figures are communicated to the National Institute of Statistics to
be published in the relevant Environmental Statistics Yearbooks as well as used in the framework of the
EUROSTAT NAMEA Project.
Technical reviews of emission data submitted under the CLRTAP convention are undertaken periodically
for each Party. Specifically, an in depth review of the Italian inventory was carried out in 2010 and 2013
(UNECE, 2010; UNECE, 2013). A summary of the main findings of the last review can be found in the
relevant technical report at the address
http://www.ceip.at/fileadmin/inhalte/emep/pdf/2013_s3/ITALY-Stage3ReviewReport-2013.pdf.
A bilateral independent review between Italy and Spain was undertaken in the year 2012, with a focus on
the revision of emission inventories and projections of both the Parties. With regard to the emission
inventory the Italian team revised part of the energy sector of Spain, specifically the public power plants,
petroleum refining plants, road transport and off-road categories, whereas the Spanish team revised the
Industrial processes and solvent and other product use, and the LULUCF sectors of Italy. Results of these
analyses are reported in a technical report. Aim of the review was to carry out a general quality assurance
analysis of the inventories in terms of methodologies, EFs and references used, as well as analysing critical
cross cutting issues such as the details of the national energy balances and comparison with international data
(EUROSTAT and IEA) and use of plant specific information.
In addition, an official independent review of the entire Italian inventory was undertaken by the Aether
consultants in 2013. Main findings and recommendations are reported in a final document, and regard mostly
the transparency in the NIR, the improvement of QA/QC documentation and some pending issues in the
LULUCF sector. These suggestions were considered in the implementation of the following inventories.
Comparisons between national activity data and data from international databases are usually carried out
in order to find out the main differences and an explanation to them. Emission intensity indicators among

20
countries (e.g. emissions per capita, industrial emissions per unit of added value, road transport emissions per
passenger car, emissions from power generation per kWh of electricity produced, emissions from dairy cows
per tonne of milk produced) can also be useful to provide a preliminary check and verification of the order of
magnitude of the emissions. Additional comparisons between emission estimates from industrial sectors and
those published by the industry itself in the Environmental reports are carried out annually in order to assess
the quality and the uncertainty of the estimates.
The quality of the inventory has also improved by the organization and participation in sector specific
workshops.
A specific procedure undertaken for improving the inventory regards the establishment of national expert
panels (in particular, in road transport, land use change and forestry and energy sectors) which involve, on a
voluntary basis, different institutions, local agencies and industrial associations cooperating for improving
activity data and emission factors accuracy.
Furthermore, activities in the framework of the improvement of local inventories are carried out together
with local authorities concentrating on the comparison between top down and bottom up approaches and
identifying the main critical issues. In the past years, ISPRA has finalised the provincial inventory at local
scale for the years 1990, 1995, 2000, 2005 and 2010 applying a top down approach. Methodologies and
results were checked out by regional and local environmental agencies and authorities, and figures are
available at ISPRA web address http://www.sinanet.isprambiente.it/it/sia-ispra/inventaria. Methodologies
used for the previous reporting cycle are described in a related publication (ISPRA, 2009).
This work is also relevant to carry out regional scenarios, for the main pollutants, within the Gains Italy
project implemented by ENEA and supported by ISPRA and the regional authorities.
In addition to these expert panels, ISPRA participates in technical working groups within the National
Statistical System. These groups, named Circoli di qualità (“Quality Panels”), coordinated by the National
Institute of Statistics, are constituted by both producers and users of statistical information with the aim of
improving and monitoring statistical information in specific sectors such as transport, industry, agriculture,
forest and fishing. These activities should improve the quality and details of basic data, as well as enable a
more organized and timely communication.
Other specific activities relating to improvements of the inventory and QA/QC practices regard the
progress on management of information collected in the framework of different European obligations, Large
Combustion Plant, E-PRTR and Emissions Trading, which is gathered together in an informative system thus
highlighting the main discrepancies among data, detecting potential errors and improving the time series
consistency. ISPRA collects these data from the industrial facilities and the inventory team manages the
information and makes use of it in the preparation of the national inventory. The informative system is based
on identification codes to trace back individual point sources in different databases and all the figures are
considered in an overall approach and used in the compilation of the inventory.
A proper archiving and reporting of the documentation related to the inventory compilation process is
also part of the national QA/QC programme.
All the material and documents used for the inventory preparation are stored at the Institute for
Environmental Protection and Research.
Information relating to the planning, preparation, and management of inventory activities are documented
and archived. The archive is organised so that any skilled analyst could obtain relevant data sources and
spreadsheets, reproduce the inventory and review all decisions about assumptions and methodologies
undertaken. A master documentation catalogue is generated for each inventory year and it is possible to track
changes in data and methodologies over time. Specifically, the documentation includes:
electronic copies of each of the draft and final inventory report, electronic copies of the draft and final
NFR tables;
electronic copies of all the final, linked source category spreadsheets for the inventory estimates
(including all spreadsheets that feed the emission spreadsheets);
results of the reviews and, in general, all documentation related to the corresponding inventory year
submission.
After each reporting cycle, all database files, spreadsheets and electronic documents are archived as

21
‘read-only’ mode.
A ‘reference’ database is also compiled every year to increase the transparency of the inventory. This
database consists of a number of records that references all documentation used during the inventory
compilation, for each sector and submission year, the link to the electronically available documents and the
place where they are stored as well as internal documentation on QA/QC procedures.
1.8 General uncertainty evaluation
An overall uncertainty analysis for the Italian inventory related to the pollutants described in this report
has not been assessed yet. Nevertheless, different studies on uncertainty have been carried out (Romano et
al., 2004) and a quantitative assessment of the Italian GHG inventory is performed by the Tier 1 method
defined in the 2006 IPCC Guidelines (IPCC, 2006) which provides a calculation based on the error
propagation equations. Details on the results of the GHG inventory uncertainty figures can be found in the
National Inventory Report 2017 (ISPRA, 2017 [a]).
It should be noted that different levels of uncertainty pertain to different pollutants. Estimates of the main
pollutants are generally of high level, but PM emissions, especially those of small particle sizes, heavy metal
and POP estimates are more uncertain. For this reason, even though not quantified in terms of uncertainty,
improvements are planned especially for the specified pollutants.
Nevertheless, since quantitative uncertainty assessments constitute a mean to either provide the inventory
users with a quantitative assessment of the inventory quality or to direct the inventory preparation team to
priority areas, a planned improvement for next submissions is the completion of such analysis.
1.9 General Assessment of Completeness
The inventory covers all major sources, as well as all main pollutants, included in the UNECE reporting
guidelines (UNECE, 2014). NFR sheets are complete as far as the details of basic information are available.
Allocation of emissions is not consistent with the guidelines only where there are no sufficient data
available to split the information. For instance, emissions from stationary combustion in manufacturing
industries and construction are not split among the relevant production sectors but included in category
1.A.2.f as a total; emissions from category 1.A.5.a other stationary are reported and included under category
1.A.4.a i commercial and institutional emission estimates. Emissions from 3.B.4.g iii turkeys are included in
3.B.4.g iv other poultry.
There are a few emission sources not assessed yet: PM, Pb and Cd non exhaust emissions from 1.A.3.b
vii, road abrasion, NOX and NH3 from 3.D.a iv, crop residues applied to soils, and 3.D.b, indirect emissions
from managed soils. Emission factors for these categories, when available in the Guidebook (EMEP/EEA,
2016), need further assessment for the applicability to the national circumstances. PAH emissions are not
detailed in the four indicator compounds but accounted for as a total because for many categories emission
factors are not available by compound. Black carbon emissions from 1.A.3.b vi automobile tyre and brake
wear, have not been estimated and will be included in the next submission.
Emissions from the categories reported in the NFR under 2.A.5, quarrying and mining of minerals other
than coal, construction and demolition and storage, handling and transport of mineral products, are not
estimated because no information on activity data is still available.
NH3, SO2, HMs and POPs emissions from field burning of agriculture waste (4F category) seem not to
occur: further assessment will be carried out analysing in depth the studies providing emission factors in the
EMEP/EEA Guidebook.
Further investigation will be carried out about these source categories and pollutants in order to calculate
and improve figures.
22
2 ANALYSIS OF KEY TRENDS BY POLLUTANT
2.1 Main pollutants
In the following sections, Italian emission series of sulphur oxides, nitrogen oxides, non-methane volatile
organic compounds, carbon monoxide and ammonia are presented.
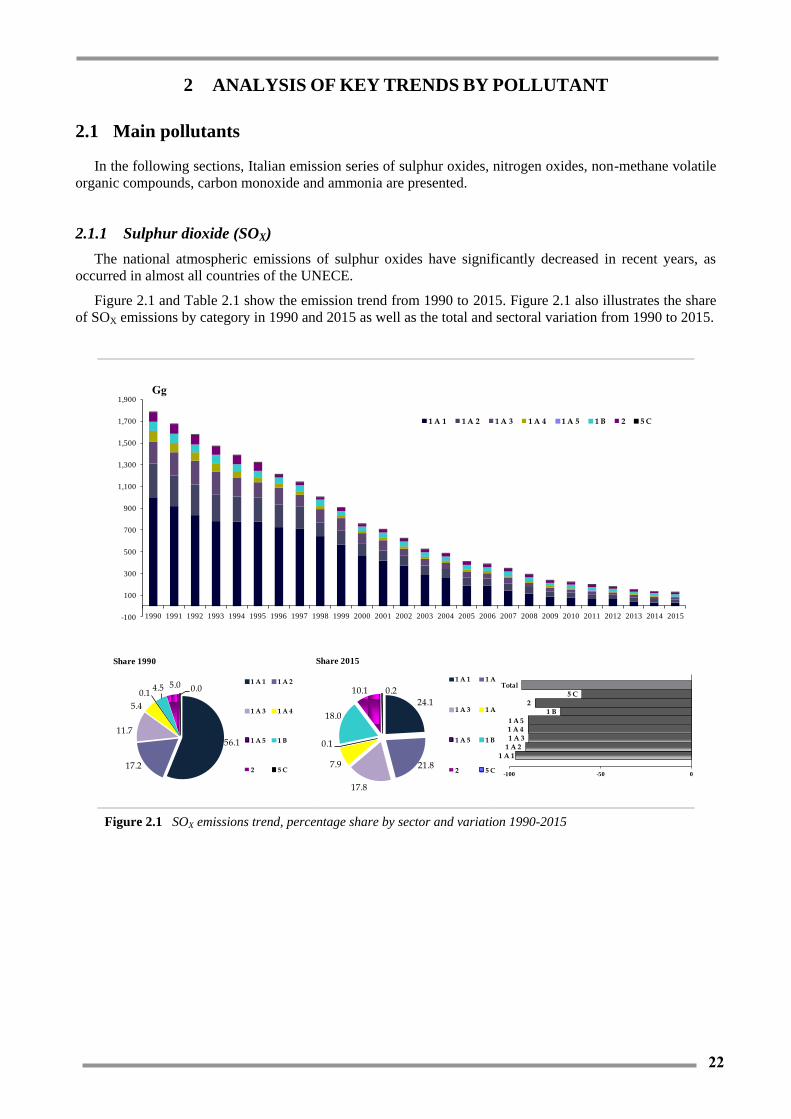
2.1.1 Sulphur dioxide (SOX)
The national atmospheric emissions of sulphur oxides have significantly decreased in recent years, as
occurred in almost all countries of the UNECE.
Figure 2.1 and Table 2.1 show the emission trend from 1990 to 2015. Figure 2.1 also illustrates the share
of SOX emissions by category in 1990 and 2015 as well as the total and sectoral variation from 1990 to 2015.
Figure 2.1 SOX emissions trend, percentage share by sector and variation 1990-2015
-100
100
300
500
700
900
1,100
1,300
1,500
1,700
1,900
1990 1991 1992 1993 1994 1995 1996 1997 1998 1999 2000 2001 2002 2003 2004 2005 2006 2007 2008 2009 2010 2011 2012 2013 2014 2015
1 A 1 1 A 2 1 A 3 1 A 4 1 A 5 1 B 2 5 C
56.1
17.2
11.7
5.4
0.14.5 5.0 0.0
Share 1990
1 A 1 1 A 2
1 A 3 1 A 4
1 A 5 1 B
2 5 C
24.1
21.8
17.8
7.9
0.1
18.0
10.1 0.2
Share 2015
1 A 1 1 A 2
1 A 3 1 A 4
1 A 5 1 B
2 5 C
1 A 1
1 A 2
1 A 3
1 A 41 A 5
1 B
2
5 C
Total
-100 -50 0

23
Table 2.1 SOX emission trend from 1990 to 2015 (Gg)
1990 1995 2000 2005 2010 2011 2012 2013 2014 2015
Gg
Combustion in
energy and
transformation
industries 1,001 776 467 187 77 66 65 45 31 30
Non industrial
combustion plants 82 32 25 22 12 9 10 10 9 10
Combustion -
Industry 303 220 107 75 46 42 37 33 32 27
Production processes 157 126 51 60 46 46 36 32 32 30
Road transport 130 72 12 2 0 0 0 0 0 0
Other mobile sources
and machinery 98 84 84 51 29 27 24 23 23 22
Waste treatment and
disposal 13 11 10 11 7 5 5 2 3 4
Total 1,783 1,322 755 408 217 195 177 145 131 123
Figures show a general decline of SOX emissions during the period, from about 1,800 Gg in 1990 to 123
Gg in 2015. The national target of SOX emissions, set by the National Emission Ceilings Directive at 475 Gg
for 2010 (EC, 2001) was reached as reported in the previous year submissions and continues to be respected
after this year revision of the time series. The new target established for 2020 in the framework of the
UNECE/CLRTAP Convention, equal for Italy to 65% of 2005 emissions, has been already reached.
The decreasing trend is determined mainly by the reduction in emissions from combustion in energy (-
97%) and in industry (-91%), representing in 2015 about 24%, and 22% of the total, respectively. Emissions
deriving from non industrial combustion plants and road transport show a strong decrease too (-88% and -
99.7%, respectively), but these emissions represent only about 8% and 0.3% of the total in 2015. Production
processes and other mobile sources and machinery also present a significant decreasing trend, showing an
influence on the total of 25% and 18% and dropping by about -81% and -78%, respectively.
An explanation of the sectoral decreasing trend is outlined more in details in the following.
Combustion in energy and transformation industries
The trend of emissions of this sector shows a reduction in the early eighties mainly due to the use of
natural gas in place of coal in the energy production and to the implementation of the Directive EEC 75/716
(EC, 1975) which introduces more restrictive constraints in the sulphur content of liquid fuels.
During the years 1985-1990, there was an increase of energy consumption that, not sufficiently hampered
by additional measures, led to an increase in the emissions of the sector and consequently of total SOX levels.
However in the nineties, there was an inverse trend due to the introduction of two regulatory instruments:
the DPR 203/88 (Decree of President of the Republic of 24th May 1988), laying down rules concerning the
authorisation of plants, and the Ministerial Decree of 12th July 1990, which introduced plant emission limits.
Also the European Directive 88/609/EEC (EC, 1988) concerning the limitation of specific pollutants
originated from large combustion plants, transposed in Italy by the DM 8th May 1989 (Ministerial Decree of
8th May 1989) gave a contribution to the reduction of emissions in the sector.

24
Finally, in recent years, a further shift to natural gas in place of fuel oil has contributed to a decrease in
emissions.
Non industrial combustion plants
The declining of the emissions occurred mainly as a result of the increase in natural gas and LPG as
alternative fuel to coal, diesel and fuel oil for heating; furthermore, a number of European Directives on the
sulphur content in fuels were adopted. In accordance with national legislation, the sulphur content allowed in
diesel fuel has decreased from 0.8% in 1980 to 0.2% in 1995 and 0.1% in 2008, while in fuel oil for heating
from 3% in 1980 to 0.3% in 1998.
Combustion in industry
Emissions from this sector show the same trend of reduction as the category previously analyzed, as both
in the scope of the same rules.
Production processes
Emissions from refineries have been reduced as a result of compliance with the DM 12th July 1990
(Ministerial Decree of 12th July 1990), which introduces limit values. The reduction of emissions from
chemical industry is due to the drop off of the sulphuric acid production and to the decrease of emissions in
the production of carbon black. Furthermore, there was a reduction in emissions in the production of cement
with regard to the type of fuel used in the process and the respective sulphur content.
Road transport
The reduction of emissions is mainly due to the introduction of Directives regulating the sulphur content
in liquid fuels.
Other mobile sources and machinery
As regards off roads, emissions mainly derive from maritime transport, which show a decrease due the
introduction of Directives regulating the sulphur content in fuels.
25
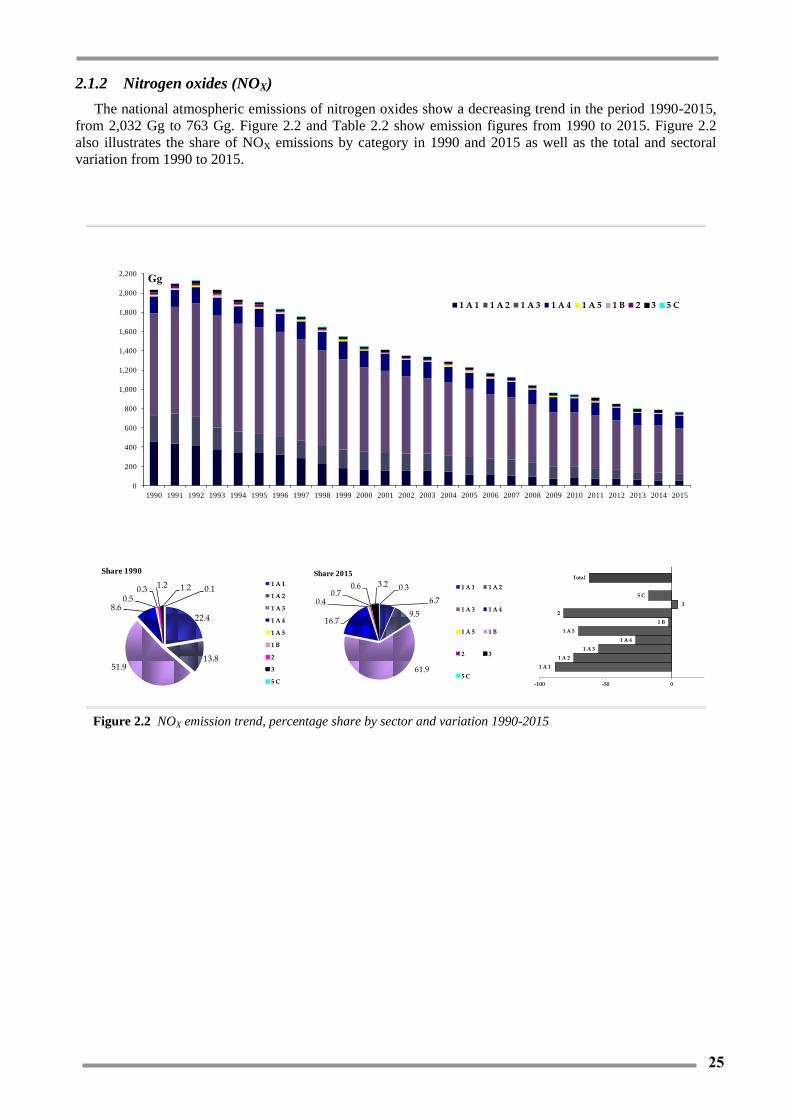
2.1.2 Nitrogen oxides (NOX)
The national atmospheric emissions of nitrogen oxides show a decreasing trend in the period 1990-2015,
from 2,032 Gg to 763 Gg. Figure 2.2 and Table 2.2 show emission figures from 1990 to 2015. Figure 2.2
also illustrates the share of NOX emissions by category in 1990 and 2015 as well as the total and sectoral
variation from 1990 to 2015.
Figure 2.2 NOX emission trend, percentage share by sector and variation 1990-2015
0
200
400
600
800
1,000
1,200
1,400
1,600
1,800
2,000
2,200
1990 1991 1992 1993 1994 1995 1996 1997 1998 1999 2000 2001 2002 2003 2004 2005 2006 2007 2008 2009 2010 2011 2012 2013 2014 2015
1 A 1 1 A 2 1 A 3 1 A 4 1 A 5 1 B 2 3 5 C
22.4
13.851.9
8.60.5
0.31.2 1.2 0.1
Share 1990
1 A 1
1 A 2
1 A 3
1 A 4
1 A 5
1 B
2
3
5 C
6.7
9.5
61.9
16.7
0.40.7
0.6 3.2 0.3
Share 2015
1 A 1 1 A 2
1 A 3 1 A 4
1 A 5 1 B
2 3
5 C
1 A 1
1 A 2
1 A 3
1 A 4
1 A 5
1 B
2
3
5 C
Total
-100 -50 0

26
Table 2.2 NOX emission trend from 1990 to 2015 (Gg)
1990 1995 2000 2005 2010 2011 2012 2013 2014 2015
Gg
Combustion
in energy and
transformation
industries
457 344 173 118 81 75 73 61 52 52
Non industrial
combustion
plants
65 66 70 80 89 80 84 89 81 87
Combustion -
Industry 249 180 152 153 100 98 82 73 70 65
Production
processes 30 31 9 16 10 11 10 9 10 9
Road
transport 943 999 758 605 461 453 423 398 407 394
Other mobile
sources and
machinery
261 258 260 233 183 166 149 141 137 129
Waste
treatment and
disposal
3 3 3 3 3 3 3 3 2 2
Agriculture 24 25 26 26 22 30 27 25 26 25
Total 2,032 1,907 1,451 1,233 948 915 852 799 787 763
Total emissions show a reduction of about 62% from 1990 to 2015, with a marked decrease between 1995
and 2000, especially in the road transport and energy combustion sectors. The target value of emissions,
fixed for 2010 by the National Emission Ceilings Directive (EC, 2001) at 990 Gg has been reached and
continues to be respected. In 2015, in the framework of the UNECE/CLRTAP Convention, and in particular
the Multieffects Protocol, a new target has been established for Italy equal to 60% of 2005 emissions in
2020.
The main source of emissions is road transport (about 52% in 2015), which shows a reduction of 58%
between 1990 and 2015; other mobile sources and machinery in 2015 contributes to the total emissions for
17% and have reduced by 51% from 1990. Combustion in energy and in industry shows a decrease of about
89% and 74%, respectively, having a share on the total of about 7% and 8% in 2015, respectively. Among
the sectors concerned, the only one which highlights an increase in emissions is non industrial combustion
plants showing an increase by 35%, accounting for 11% of the total.
Details on the sectoral emission trend and respective variation are outlined in the following sections,
starting from the early eighties.
Combustion in energy and transformation industries
Emissions from this sector show an upward trend until 1988 due to an increase in energy consumption,
not prevented by reduction measures. From 1988 onwards, emissions present a gradual reduction due,
mainly, to the introduction of the two regulatory instruments already mentioned for sulphur dioxide: the DPR
203/88 (Decree of President of the Republic of 24th May 1988), laying down rules for the authorization of
facilities and the Ministerial Decree of 12th July 1990, which introduces plant emission limits. The adoption
of these regulations, as the Ministerial Decree of 8th May 1989 on large combustion plants, has led to a shift
in energy consumption from oil with high sulphur content to oil with lower sulphur content and to natural
gas.

27
In recent years, the conversion to the use of natural gas to replace fuel oil has intensified, thanks to
incentives granted for the improvement of energy efficiency. These measures, together with those of
promoting renewable energy and energy saving, have led to a further reduction of emissions in the sector.
In addition, in the last years, more stringent emission limits to the new plants have been established
during the authorisation process with the aim to prevent air quality issues at local level.
Non industrial combustion plants
The increase in emissions is explained by the growing trend of energy consumption during the period
considered. This is due to the fact that in the last twenty years all the new buildings are equipped with
heating system and old buildings have been modernized.
A national survey on energy consumption of households, conducted by the National Institute of Statistics
(ISTAT, 2014), has supplied the amount of biomass burned to heating. Estimated values of biomass burnt are
about 80% higher than previous estimates reported in the National Energy Balance (MSE, several years) and
derived from regional or incomplete surveys. From 2013 this new biomass figures are reported in the
National Energy Balance. In 2015 the reconstruction backwards of the time series has been finalised, with
the collaboration of ISTAT and GSE (Energy Services Manager), and official data have been communicated
to Eurostat.
Combustion in industry
Emissions from this sector show a decreasing trend, motivated by the same reasons as the energy
industry, having undergone the same legislation.
Road transport
The decrease is the result of two opposing trends: an increase in emissions in the early years of the
historical series, with a peak in 1992, due to the increase in the fleet and in the total mileage of both
passengers and goods transported by road, and a subsequent reduction in emissions. This decrease is, once
more, the result of two opposing trends: on one hand, the growth of both the fleet and the mileage, on the
other hand the introduction of technologies to reduce vehicle emissions, as the catalytic converter, provided
by European Directives, in particular the Directives 91/441/EC (EC, 1991), 94/12/EC (EC, 1994) and
98/69/EC (EC, 1998) on light vehicles.
To encourage the reduction of emissions, different policies have also been implemented, including
incentives to renew the public and private fleet and for the purchase of electric vehicles, promotion for the
integrated expansion of rail, maritime and urban transport system, and programmes of sustainable mobility.
Other mobile sources and machinery
From 1980 emissions have a slightly rising trend until 1998 and then decrease slightly until arriving in
2015 at lower levels. Emissions in the sector are characterized predominantly by maritime transport, by
machinery used in agriculture and industry.
Regarding mobile machinery used in agriculture and industry, these sectors were not governed by any
legislation until the Directive 97/68/EC (EC, 1997 [a]), which provides for a reduction in NOX limits from 1st
January 1999, and Directive 2004/26/EC (EC, 2004) which provide further reduction stages with substantial
effects from 2011, with a following decreasing trend particularly in recent years.
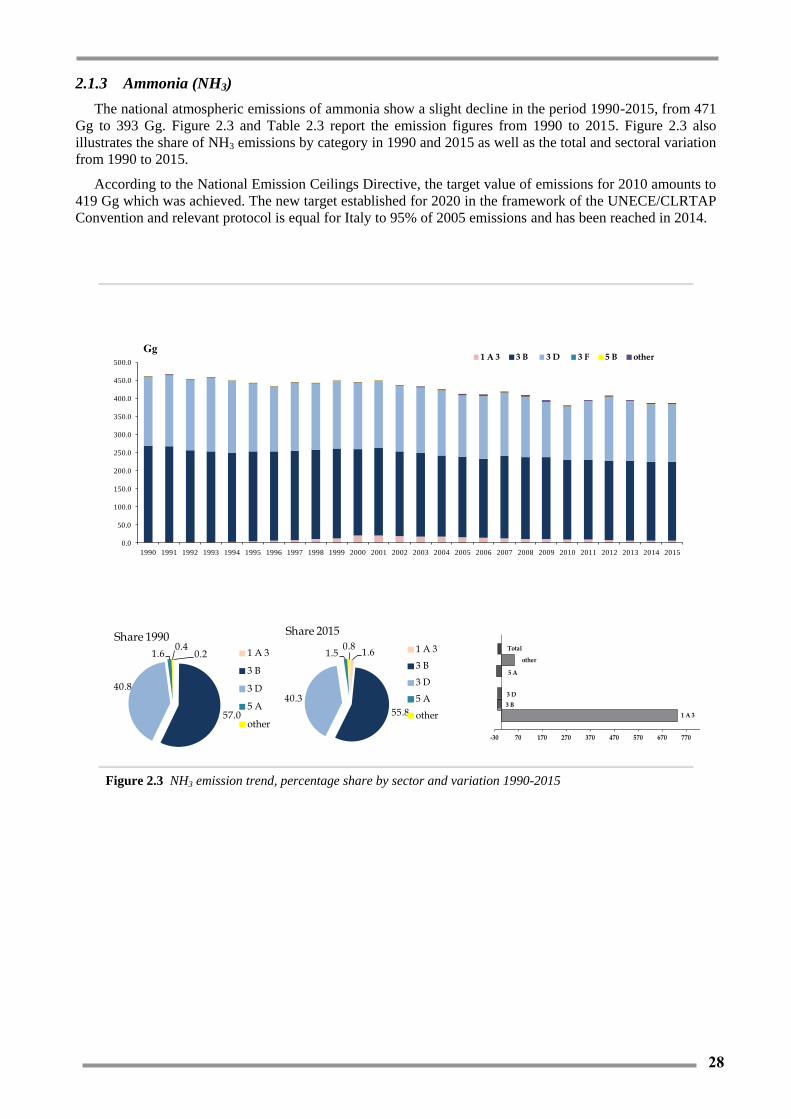
28
2.1.3 Ammonia (NH3)
The national atmospheric emissions of ammonia show a slight decline in the period 1990-2015, from 471
Gg to 393 Gg. Figure 2.3 and Table 2.3 report the emission figures from 1990 to 2015. Figure 2.3 also
illustrates the share of NH3 emissions by category in 1990 and 2015 as well as the total and sectoral variation
from 1990 to 2015.
According to the National Emission Ceilings Directive, the target value of emissions for 2010 amounts to
419 Gg which was achieved. The new target established for 2020 in the framework of the UNECE/CLRTAP
Convention and relevant protocol is equal for Italy to 95% of 2005 emissions and has been reached in 2014.
Figure 2.3 NH3 emission trend, percentage share by sector and variation 1990-2015
0.0
50.0
100.0
150.0
200.0
250.0
300.0
350.0
400.0
450.0
500.0
1990 1991 1992 1993 1994 1995 1996 1997 1998 1999 2000 2001 2002 2003 2004 2005 2006 2007 2008 2009 2010 2011 2012 2013 2014 2015
1 A 3 3 B 3 D 3 F 5 B other
0.2
57.0
40.8
1.60.4
Share 1990
1 A 3
3 B
3 D
5 A
other
1.6
55.8
40.3
1.50.8
Share 2015
1 A 3
3 B
3 D
5 A
other 1 A 3
3 B
3 D
5 A
other
Total
-30 70 170 270 370 470 570 670 770 870

29
Table 2.3 NH3 emission trend from 1990 to 2015 (Gg)
1990 1995 2000 2005 2010 2011 2012 2013 2014 2015
Gg
Combustion in energy
and transformation
industries 0.1 0.1 0.1 0.2 0.2 0.2 0.2 0.2 0.2 0.2
Non industrial
combustion plants 1.1 1.1 1.0 1.0 1.8 1.1 1.7 1.7 1.5 1.7
Combustion - Industry 0.1 0.1 0.1 3.5 1.2 1.3 1.0 1.0 0.9 0.7
Production processes 0.8 0.4 0.3 0.5 0.5 0.4 0.5 0.4 0.4 0.5
Road transport 0.7 5.1 20.2 14.9 9.2 8.5 7.1 6.8 6.4 6.2
Other mobile sources
and machinery 0.0 0.0 0.0 0.0 0.0 0.0 0.0 0.0 0.0 0.0
Waste treatment and
disposal 7.8 7.2 8.4 8.5 7.7 7.4 7.4 6.7 6.6 6.2
Agriculture 460 437 423 393 369 383 398 386 378 378
Total 471 451 453 422 389 402 416 403 394 393
In 2015 agriculture is the main source of emissions, with a 96% contribution out of the total NH3
emissions; from 1990 to 2015 emissions from this sector show a decrease of about 16%. Emissions from
road transport show a strong increase, but the share on the total is less than 2%. Emissions from waste
treatment and disposal, accounting also only for 2% of the total, show a decrease of about 20%. Emissions
from non industrial combustion plants show a relevant increase, but in 2015 the contribution to total
emissions is 0.4%. Emissions from combustion in energy and transformation industries as emissions from
combustion in industry show a significant increase, but their contribution to total emissions is not relevant.
Emissions from production processes show a reduction of about 40%, but also this contribution is irrelevant.
Specifically, emissions from agriculture have decreased because of the reduction in the number of
animals and the trend in agricultural production, and the introduction of abatement technologies due to the
implementation of the EU IPPC Directive (EC, 1996). Emission trend of the waste sector is driven by the
amount of waste disposal in landfills. Emissions from road transport have increased as a result of the
introduction of catalytic converter but during the last years a decrease is observed due to the introduction of
more stringent limits in the new vehicles.

30
2.1.4 Non methane volatile organic compounds (NMVOC)
The national atmospheric emissions of NMVOC show a decreasing trend in the period 1990-2015. Figure
2.4 and Table 2.4 illustrate the emissions values from 1990 to 2015. Figure 2.4 also illustrates the share of
NMVOC emissions by category in 1990 and 2015 as well as the total and sectoral variation from 1990 to
2015.
Figure 2.4 NMVOC emission trend, percentage share by sector and variation 1990-2015
The global emission trend shows a reduction of about 56% between 1990 and 2015, from 1,936 Gg to 842
Gg.
In the framework of the National Emission Ceilings Directive (EC, 2001), the target value of NMVOC
for 2010 fixed at 1,159 Gg was reached. The new target established in the framework of the
UNECE/CLRTAP Convention for 2020 is equal to 65% of 2005 emission level.
Solvent and other product use is the main source of emissions, contributing to the total with 42% and
showing a decrease of about 42%. The main reductions relate to the road transport sector (-83%),
accounting for 17% of the total and to the sector of extraction and distribution of fossil fuels/geothermal
energy (-59%), accounting only for 4%. Emissions from other mobile sources and machinery, accounting for
4% of the total, decrease of about 77%. Emissions from non industrial combustion plants show the largest
increase (94%), accounting for 24%. Emissions from waste treatment and disposal and combustion in
industry show a decrease of about 23% and 9%, respectively, but both these sources account only for about
1%. Emissions from agriculture decrease of about 6%, but their contribution is irrelevant.
Details on the sectoral emission trend and respective variation are outlined in the following sections.
0
400
800
1,200
1,600
2,000
2,400
19901991199219931994199519961997199819992000200120022003200420052006200720082009201020112012201320142015
1 A 3 1 A 4 1 B 2 2 D other
46.9
9.46.3
3.8
31.7
2.0
Share 19901 A 3
1 A 4
1 B
2
2 D
other
19.3
25.0
5.54.8
42.6
2.9
Share 20151 A 3
1 A 4
1 B
2
2 D
other 1 A 3
1 A 4
1 B
2
2 D
other
Total
-100 -50 0 50
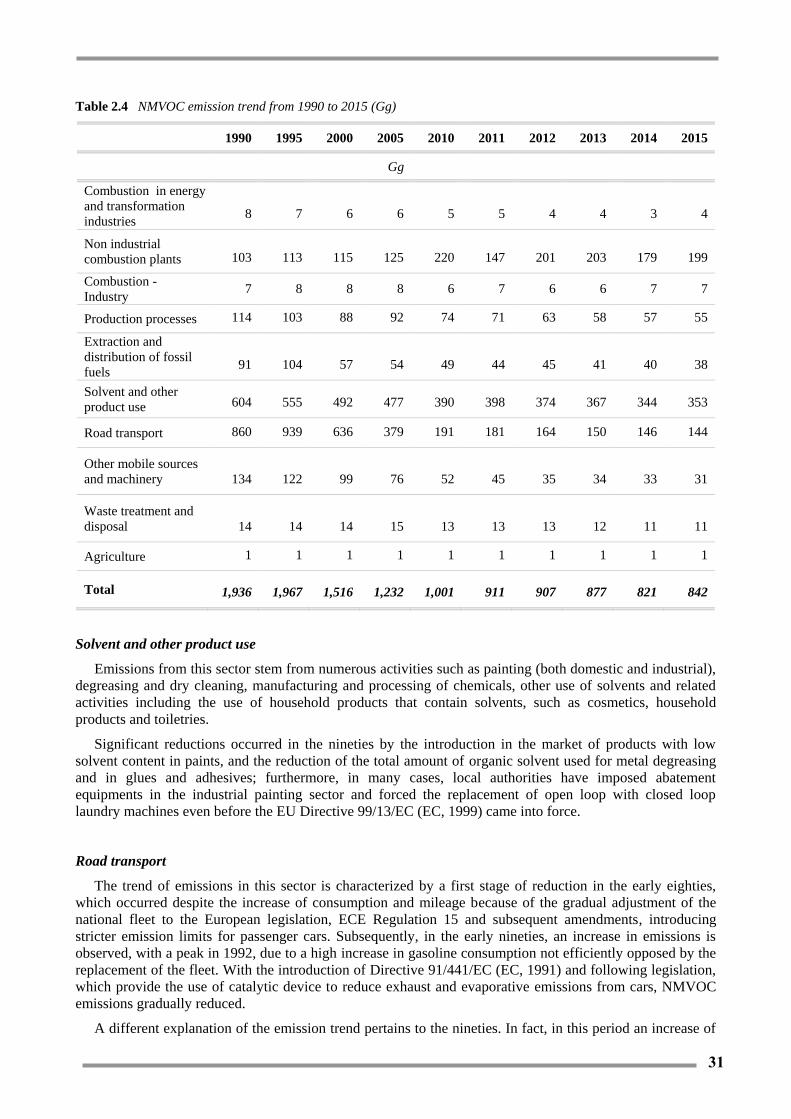
31
Table 2.4 NMVOC emission trend from 1990 to 2015 (Gg)
1990 1995 2000 2005 2010 2011 2012 2013 2014 2015
Gg
Combustion in energy
and transformation
industries 8 7 6 6 5 5 4 4 3 4
Non industrial
combustion plants 103 113 115 125 220 147 201 203 179 199
Combustion -
Industry 7 8 8 8 6 7 6 6 7 7
Production processes 114 103 88 92 74 71 63 58 57 55
Extraction and
distribution of fossil
fuels 91 104 57 54 49 44 45 41 40 38
Solvent and other
product use 604 555 492 477 390 398 374 367 344 353
Road transport 860 939 636 379 191 181 164 150 146 144
Other mobile sources
and machinery 134 122 99 76 52 45 35 34 33 31
Waste treatment and
disposal 14 14 14 15 13 13 13 12 11 11
Agriculture 1 1 1 1 1 1 1 1 1 1
Total 1,936 1,967 1,516 1,232 1,001 911 907 877 821 842
Solvent and other product use
Emissions from this sector stem from numerous activities such as painting (both domestic and industrial),
degreasing and dry cleaning, manufacturing and processing of chemicals, other use of solvents and related
activities including the use of household products that contain solvents, such as cosmetics, household
products and toiletries.
Significant reductions occurred in the nineties by the introduction in the market of products with low
solvent content in paints, and the reduction of the total amount of organic solvent used for metal degreasing
and in glues and adhesives; furthermore, in many cases, local authorities have imposed abatement
equipments in the industrial painting sector and forced the replacement of open loop with closed loop
laundry machines even before the EU Directive 99/13/EC (EC, 1999) came into force.
Road transport
The trend of emissions in this sector is characterized by a first stage of reduction in the early eighties,
which occurred despite the increase of consumption and mileage because of the gradual adjustment of the
national fleet to the European legislation, ECE Regulation 15 and subsequent amendments, introducing
stricter emission limits for passenger cars. Subsequently, in the early nineties, an increase in emissions is
observed, with a peak in 1992, due to a high increase in gasoline consumption not efficiently opposed by the
replacement of the fleet. With the introduction of Directive 91/441/EC (EC, 1991) and following legislation,
which provide the use of catalytic device to reduce exhaust and evaporative emissions from cars, NMVOC
emissions gradually reduced.
A different explanation of the emission trend pertains to the nineties. In fact, in this period an increase of

32
the fleet and the mileage is observed in Italy, especially for the emergent use of mopeds for urban mobility,
which, until 1999, were not subject to any national emission regulation. Thereafter, various measures were
introduced in order to facilitate the reduction of NMVOC emissions, including incentives for replacement of
both the fleet of passenger cars and of mopeds and motorcycles with low-emission vehicles; incentives were
also provided for the use of fuels different from gasoline, such as LPG and natural gas. In addition, funds
were allocated for the implementation of urban traffic plans, for the establishment of restricted traffic areas
and car-free days, for checks on exhaust pipes of cars, for the implementation of voluntary agreements with
manufacturers of mopeds and motorcycles in order to anticipate the timing provided by the European
Directive 97/24/EC (EC, 1997 [b]) as regards the placing on the market of mopeds with low emissions.
Non industrial combustion plants
The increasing emission trend is driven by the increase of wood biomass fuel consumption for residential
heating. The 2013 consumption value reported in the national energy balance results from a detailed survey
conducted by the national institute of statistics in 2014 (ISTAT, 2014) and is much higher than the previous
estimates. In 2015 the reconstruction backwards of the time series of wood combustion has been finalised,
with the collaboration of ISTAT and GSE (Energy Services Manager), and official data have been
communicated to Eurostat.
Other mobile sources and machinery
The reduction in emissions is explained by the reduction of gasoline consumption in the sector, largely for
two-stroke engines used in agriculture and in maritime activities.
As regards the other sectors, a decrease in emissions from production processes is observed, mainly in the
food industries, in the chemical sector and in the processes in the refineries. The emissions concerning the
extraction and distribution of fuels, even in the presence of an increase in quantity treated, have been reduced
as a result of the application of the DM 16th May 1996 (Ministerial Decree 16 May 1996), concerning the
adoption of devices for the recovery of vapours and of the applications of measures on deposits of gasoline
provided by the DM 21st January 2000 (Ministerial Decree 21 January 2000).
Emissions from the other sectors are not subject to specific regulations.
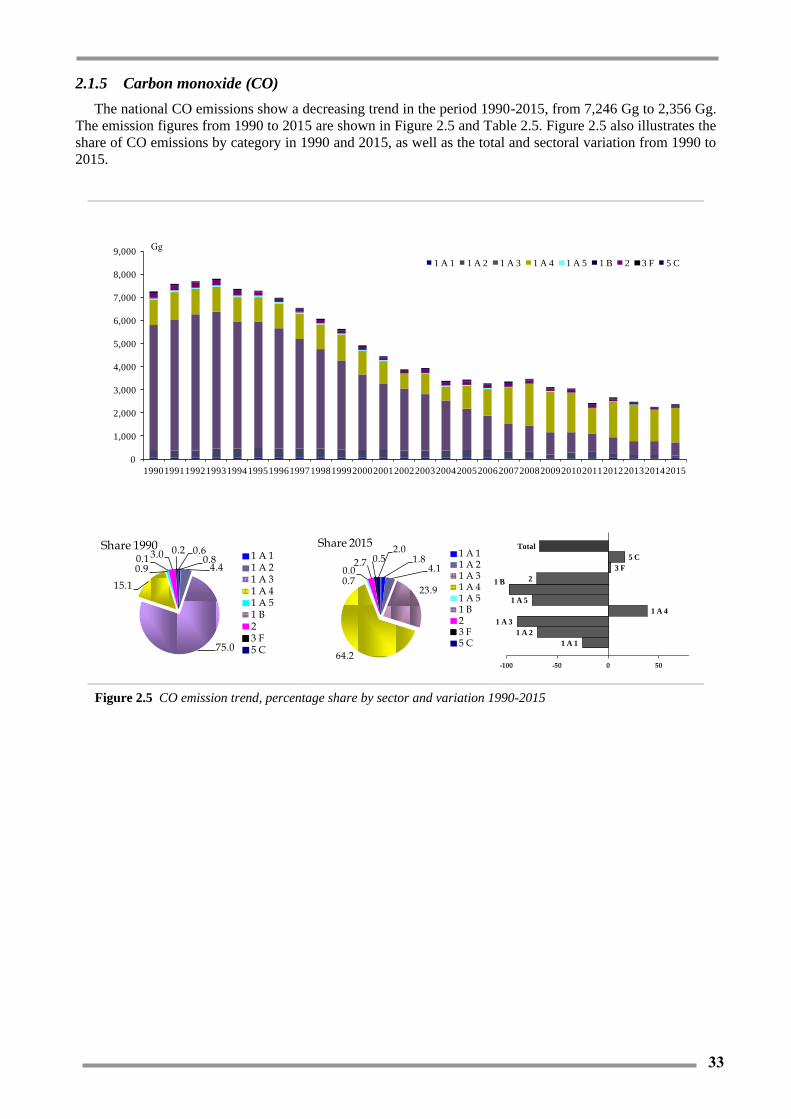
33
2.1.5 Carbon monoxide (CO)
The national CO emissions show a decreasing trend in the period 1990-2015, from 7,246 Gg to 2,356 Gg.
The emission figures from 1990 to 2015 are shown in Figure 2.5 and Table 2.5. Figure 2.5 also illustrates the
share of CO emissions by category in 1990 and 2015, as well as the total and sectoral variation from 1990 to
2015.
Figure 2.5 CO emission trend, percentage share by sector and variation 1990-2015
0
1,000
2,000
3,000
4,000
5,000
6,000
7,000
8,000
9,000
19901991199219931994199519961997199819992000200120022003200420052006200720082009201020112012201320142015
1 A 1 1 A 2 1 A 3 1 A 4 1 A 5 1 B 2 3 F 5 C
0.84.4
75.0
15.1
0.90.1 3.0 0.2 0.6Share 1990
1 A 11 A 21 A 31 A 41 A 51 B23 F5 C
1.84.1
23.9
64.2
0.70.0
2.7 0.52.0
Share 20151 A 11 A 21 A 31 A 41 A 51 B23 F5 C 1 A 1
1 A 2
1 A 3
1 A 4
1 A 5
1 B 2
3 F
5 C
Total
-100 -50 0 50 100 150
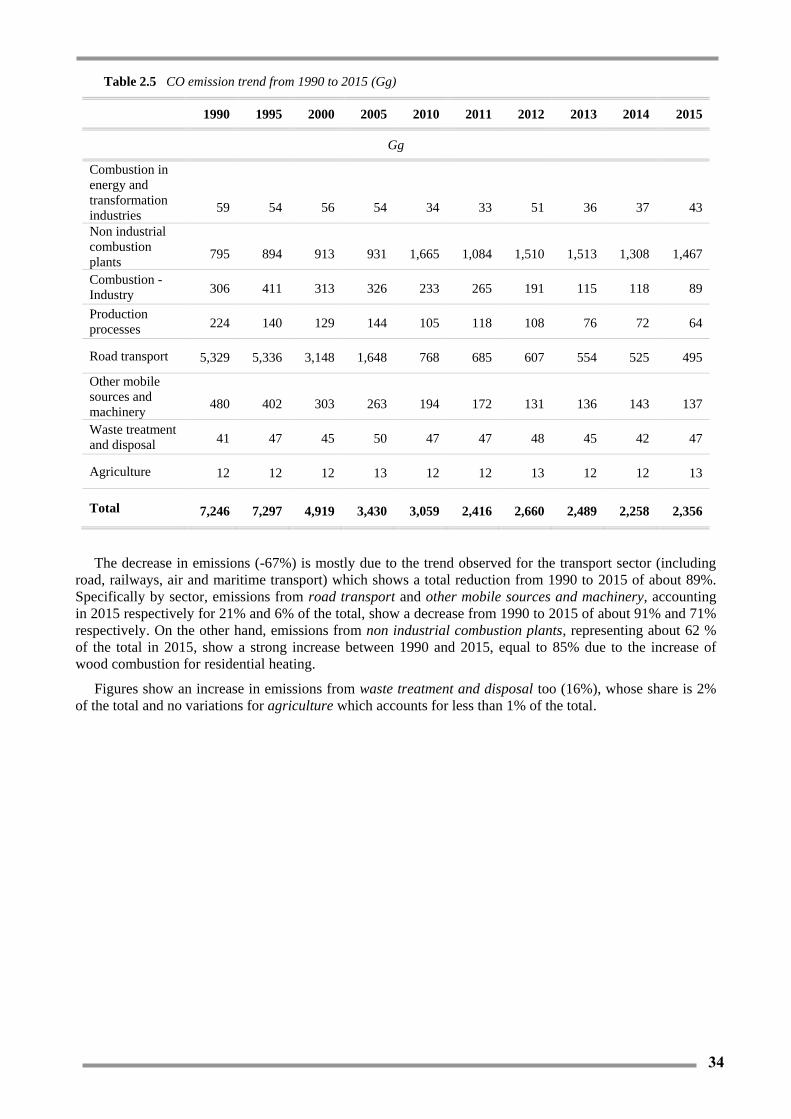
34
Table 2.5 CO emission trend from 1990 to 2015 (Gg)
1990 1995 2000 2005 2010 2011 2012 2013 2014 2015
Gg
Combustion in
energy and
transformation
industries 59 54 56 54 34 33 51 36 37 43
Non industrial
combustion
plants 795 894 913 931 1,665 1,084 1,510 1,513 1,308 1,467
Combustion -
Industry 306 411 313 326 233 265 191 115 118 89
Production
processes 224 140 129 144 105 118 108 76 72 64
Road transport 5,329 5,336 3,148 1,648 768 685 607 554 525 495
Other mobile
sources and
machinery 480 402 303 263 194 172 131 136 143 137
Waste treatment
and disposal 41 47 45 50 47 47 48 45 42 47
Agriculture 12 12 12 13 12 12 13 12 12 13
Total 7,246 7,297 4,919 3,430 3,059 2,416 2,660 2,489 2,258 2,356
The decrease in emissions (-67%) is mostly due to the trend observed for the transport sector (including
road, railways, air and maritime transport) which shows a total reduction from 1990 to 2015 of about 89%.
Specifically by sector, emissions from road transport and other mobile sources and machinery, accounting
in 2015 respectively for 21% and 6% of the total, show a decrease from 1990 to 2015 of about 91% and 71%
respectively. On the other hand, emissions from non industrial combustion plants, representing about 62 %
of the total in 2015, show a strong increase between 1990 and 2015, equal to 85% due to the increase of
wood combustion for residential heating.
Figures show an increase in emissions from waste treatment and disposal too (16%), whose share is 2%
of the total and no variations for agriculture which accounts for less than 1% of the total.

35
2.2 Particulate matter
2.2.1 PM10
The national atmospheric emissions of PM10 show a decreasing trend in the period 1990-2015, from 271
Gg to 179 Gg. Figure 2.6 and Table 2.6 illustrate the emission trend from 1990 to 2015. Figure 2.6 also
illustrates the share of PM10 emissions by category in 1990 and 2015 as well as the total and sectoral
variation from 1990 to 2015.
Figure 2.6 PM10 emission trend, percentage share by sector and variation 1990-2015
0
50
100
150
200
250
300
1990 1991 1992 1993 1994 1995 1996 1997 1998 1999 2000 2001 2002 2003 2004 2005 2006 2007 2008 2009 2010 2011 2012 2013 2014 2015
1 A 1 1 A 2 1 A 3 1 A 4 2 3 B other
16.5
12.0
23.231.2
7.46.6
3.0
Share 19901 A 1
1 A 2
1 A 3
1 A 4
2
3 B
other
0.8 4.0
15.4
64.3
6.15.93.5
Share 20151 A 1
1 A 2
1 A 3
1 A 4
2
3 B
other
1 A 1
1 A 2
1 A 3 1 A 4
2
3 B
other
Total
-100 -50 0 50 100

36
Table 2.6 PM10 emission trend from 1990 to 2015(Gg)
1990 1995 2000 2005 2010 2011 2012 2013 2014 2015
Gg
Combustion in energy and
transformation industries 45 40 18 6 3 2 2 1 1 1
Non industrial combustion
plants 68 71 70 69 124 80 115 115 99 112
Combustion - Industry 29 26 17 14 8 8 7 6 6 7
Production processes 22 20 19 20 16 16 14 13 12 11
Extraction and distribution
of fossil fuels 1 1 1 1 1 1 1 1 1 1
Solvent and other product
use 0.04 0.04 0.02 0.02 0.01 0.01 0.01 0.01 0.01 0.01
Road transport 53 52 48 41 30 29 25 23 24 22
Other mobile sources and
machinery 32 32 30 25 16 14 12 11 11 10
Waste treatment and
disposal 2 3 2 3 3 3 3 2 2 3
Agriculture 20 20 20 19 13 13 13 13 13 13
Total 271 265 225 198 213 165 192 186 169 179
From 1990 to 2015 the trend shows a reduction of about 34%. A considerable amount of emissions is
mostly to be attributed to non industrial combustion plant (62% in 2015) which is the only sector increasing
its emissions, about 65%, due to the increase of wood combustion for residential heating.
Road transport accounts for 12% of total emissions in 2015 and decrease by 59% due to the introduction
of the relevant European Directives controlling and limiting PM emissions at the car exhaust pipe.
In 2015 other mobile sources and machinery, accounting for 6% of the total, shows a reduction of about
69% in consideration of the implementation of the relevant European Directives on machinery. Emissions
from combustion in industry account for about 4% of the total and decrease by about 77%. Emissions from
production processes accounting for 6% of the total in 2015 decrease of about 49% between 1990 and 2015.
The largest decrease (-97%) is observed in emissions deriving from combustion in energy and
transformation industries, whose contribution to total emissions is almost irrelevant in 2015 and equal to 1%.
The reduction in the energy and industrial sectors is mainly due to the introduction of two regulatory
instruments, already mentioned for other pollutants, the DPR 203/88 (Decree of President of the Republic of
24th May 1988), laying down rules for the authorization of facilities and the Ministerial Decree of 12th July
1990, which introduces plant emission limits.

37
2.2.2 PM2.5
The trend of the national atmospheric emissions of PM2.5 is decreasing between 1990 and 2015, with a
variation from 221 Gg to 160 Gg. Figure 2.7 and Table 2.7 illustrate the emission trend from 1990 to 2015.
Figure 2.7 also illustrates the share of PM2.5 emissions by category in 1990 and 2015 as well as the total and
sectoral variation from 1990 to 2015.
Figure 2.7 PM2.5 emission trend, percentage share by sector and variation 1990-2015
-
50
100
150
200
250
1990 1991 1992 1993 1994 1995 1996 1997 1998 1999 2000 2001 2002 2003 2004 2005 2006 2007 2008 2009 2010 2011 2012 2013 2014 2015
1 A 1 1 A 2 1 A 3 1 A 4 2 3 B other
13.6
10.5
26.9
37.9
6.32.0 2.8
Share 1990
1 A 1
1 A 2
1 A 3
1 A 4
2
3 B
other
0.73.8
14.8
71.2
4.5 1.7
3.3
Share 20151 A 1
1 A 2
1 A 3
1 A 4
2
3 B
other
1 A 1
1 A 2
1 A 3 1 A 4
2
3 B
other
Total
-150 -100 -50 0 50 100 150

38
Table 2.7 PM2.5 emission trend from 1990 to 2015 (Gg)
1990 1995 2000 2005 2010 2011 2012 2013 2014 2015
Gg
Combustion in energy and
transformation industries 30 28 13 4 2 1 1 1 1 1
Non industrial combustion
plants 67 71 69 68 122 79 114 114 98 110
Combustion - Industry 20 18 12 10 6 6 5 5 5 6
Production processes 15 13 12 13 11 11 10 8 8 8
Extraction and distribution of
fossil fuels 0.07 0.06 0.06 0.08 0.07 0.08 0.08 0.07 0.06 0.06
Solvent and other product use 0.04 0.04 0.02 0.02 0.01 0.01 0.01 0.01 0.01 0.01
Road transport 50 48 44 37 26 25 22 19 20 18
Other mobile sources and
machinery 32 32 30 25 16 14 12 11 11 10
Waste treatment and disposal 2 2 2 2 2 2 2 2 2 2
Agriculture 6 6 6 6 5 5 5 5 5 5
Total 221 218 189 166 190 143 171 166 150 160
In 2015, in the framework of the revision of the Multieffect protocol of the UNECE/CLRTAP
Convention, a target has been established for this pollutant. Italy should reduce in 2020 their PM2.5
emissions by 10% with respect the 2005 emission level.
Total emissions show a global reduction from 1990 to 2015 of about 28%. Specifically, emissions from
road transport, accounting for 11% of total emissions, decrease of about 64%. Emissions from other mobile
sources and machinery show a reduction of 69%, accounting in 2015 for 6% of total emissions. Emissions
from non industrial combustion plants and from combustion in industry account for 69% and 4% of the total
respectively, but while the former shows an increase of about 65%, the latter decreases by about 71%.
Emissions from waste treatment and disposal, accounting for 1% of the total in 2015, show an increase of
about 10%. The largest decrease is observed for combustion in energy and transformation industries (-96%),
being the influence on the total in 2015 equal to 1%.
For the explanation of the trends see what already reported for PM10.

39
2.2.3 Black Carbon (BC)
Black Carbon emissions have been estimated as a fraction of PM2.5. National BC atmospheric emissions
are decreasing between 1990 and 2015, with a variation from 47 Gg to 24 Gg. Figure 2.7 and Table 2.7
illustrate the emission trend from 1990 to 2015. Figure 2.7 also illustrates the share of BC emissions by
category in 1990 and 2015 as well as the total and sectoral variation from 1990 to 2015.
Figure 2.8 BC emission trend, percentage share by sector and variation 1990-2015
0
5
10
15
20
25
30
35
40
45
50
1 A 1 1 A 2 1 A 3 1 A 4 2 5 C other
3.66.7
52.8
32.0
0.8
1.7 2.5Share 1990
1 A 1
1 A 2
1 A 3
1 A 4
2
5 C
other
0.22.2
43.647.6
0.53.9 2.0
Share 20151 A 1
1 A 2
1 A 3
1 A 4
2
5 C
other1 A 1
1 A 2
1 A 3
1 A 4
2
5 C
other
Total
-100 -50 0 50

40
Table 2.8 BC emission trend from 1990 to 2015 (Gg)
1990 1995 2000 2005 2010 2011 2012 2013 2014 2015
Gg
Combustion in energy and
transformation industries 2 2 1 0.3 0.3 2 2 2 0.04 0.05
Non industrial combustion
plants 5 6 6 6 10 7 10 10 8 9
Combustion - Industry 1 1 0.4 0.4 0.2 0.2 0.2 0.2 0.2 0.2
Production processes 1 1 0.4 0.3 0.3 0.3 0.2 0.2 0.2 0.2
Extraction and distribution
of fossil fuels 0.1 0.1 0.0 0.1 0.1 0.1 0.1 0.1 0.1 0.1
Road transport 23 22 21 19 15 14 12 10 10 9
Other mobile sources and
machinery 14 14 13 11 6 5 5 4 4 3
Waste treatment and disposal 1 1 1 1 1 1 1 1 1 1
Agriculture 0.1 0.1 0.1 0.1 0.1 0.1 0.1 0.1 0.1 0.1
Total 47 46 42 38 32 27 28 26 24 24
Total emissions show a global reduction from 1990 to 2015 of about 49%. Specifically, emissions from
road transport, accounting for 39% of total emissions, decrease of about 60%. Emissions from other mobile
sources and machinery show a reduction of 76%, accounting in 2015 for 14% of total emissions. Emissions
from non industrial combustion plants and from combustion in industry account for 40% and 1% of the total
respectively, but while the former shows an increase of about 73%, the latter decreases by about 70% as well
as industrial processes. Emissions from waste treatment and disposal, accounting for 4% of the total in
2015, show an increase of about 14%. The largest decrease is observed for combustion in energy and
transformation industries (-97%), being the influence on the total in 2015 less than 1%.
For the explanation of the trends refer to previous paragraph.
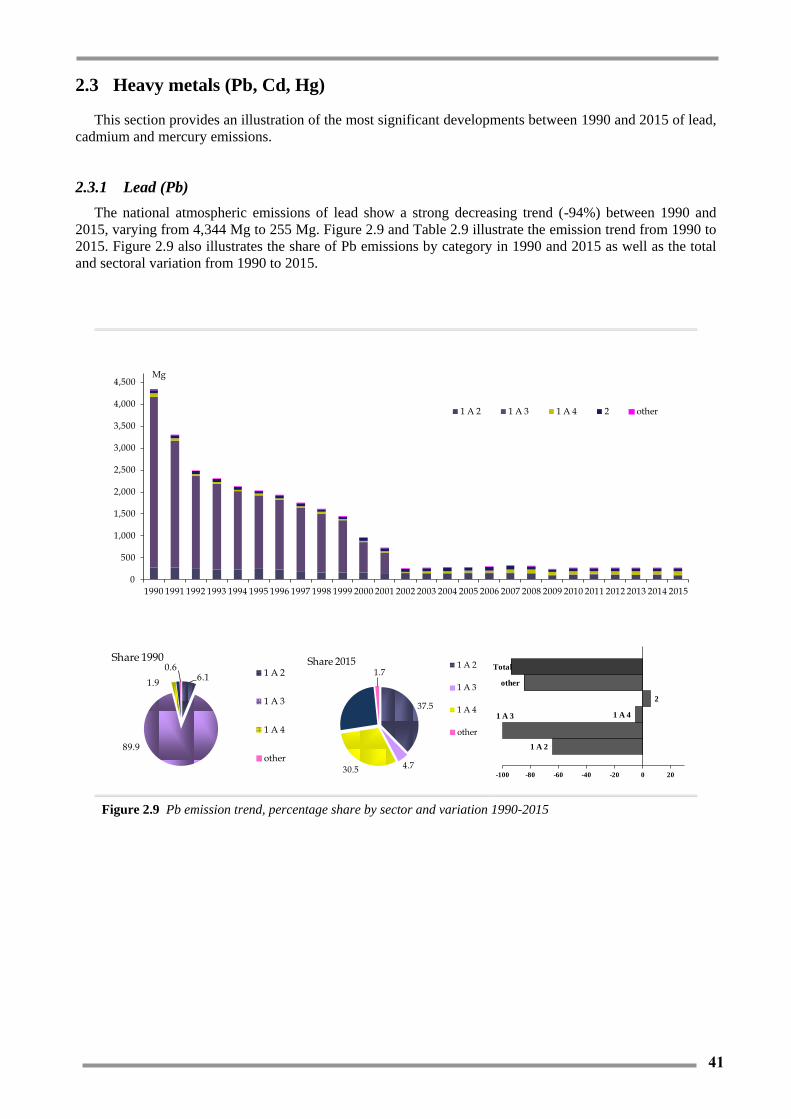
41
2.3 Heavy metals (Pb, Cd, Hg)
This section provides an illustration of the most significant developments between 1990 and 2015 of lead,
cadmium and mercury emissions.
2.3.1 Lead (Pb)
The national atmospheric emissions of lead show a strong decreasing trend (-94%) between 1990 and
2015, varying from 4,344 Mg to 255 Mg. Figure 2.9 and Table 2.9 illustrate the emission trend from 1990 to
2015. Figure 2.9 also illustrates the share of Pb emissions by category in 1990 and 2015 as well as the total
and sectoral variation from 1990 to 2015.
Figure 2.9 Pb emission trend, percentage share by sector and variation 1990-2015
0
500
1,000
1,500
2,000
2,500
3,000
3,500
4,000
4,500
1990 1991 1992 1993 1994 1995 1996 1997 1998 1999 2000 2001 2002 2003 2004 2005 2006 2007 2008 2009 2010 2011 2012 2013 2014 2015
1 A 2 1 A 3 1 A 4 2 other
6.1
89.9
1.9
0.6Share 1990
1 A 2
1 A 3
1 A 4
other
37.5
4.730.5
1.7Share 2015 1 A 2
1 A 3
1 A 4
other
1 A 2
1 A 3 1 A 4
2
other
Total
-100 -80 -60 -40 -20 0 20

42
Table 2.9 Pb emission trend from 1990 to 2015 (Mg)
1990 1995 2000 2005 2010 2011 2012 2013 2014 2015
Mg
Combustion in
energy and
transformation
industries 4 4 4 4 3 3 3 3 3 3
Non-industrial
combustion plants 14 17 22 46 74 57 68 74 75 78
Combustion -
industry 263 235 153 142 104 111 107 98 101 96
Production processes 64 68 67 74 70 77 73 68 68 66
Road transport 3,851 1,664 694 12 12 12 11 11 11 11
Other mobile sources
and machinery 142 44 13 1 1 1 1 1 1 1
Waste treatment and
disposal 6 5 3 4 2 2 3 3 1 1
Total 4,344 2,037 957 284 266 263 266 257 260 255
In 2015 emissions from combustion in industry have the most significant impact on the total (37%) and
show a reduction of about 64%; this reduction is to be attributed primarily to processes with contact, which
contribute with 58% to the sectoral reduction and account for almost the total share of the sector. Emissions
from production processes and, in particular, from processes in iron and steel industries and collieries,
increased by about 4%, and represent 26% of the total. Emissions from non industrial combustion plants
show a strong increase and represent, in 2015, 30% of the total. As to emissions from transport activities,
because of changes occurred in the legislation regarding fuels, trends show a sharp reduction in emissions
from 2002 onwards.

43
2.3.2 Cadmium (Cd)
The national atmospheric emissions of cadmium show a slight decreasing trend. Figure 2.10 and Table
2.10 illustrate the emission trend from 1990 to 2015. Figure 2.10 also illustrates the share of Cd emissions by
category in 1990 and 2015 as well as the total and sectoral variation from 1990 to 2015.
Figure 2.10 Cd emission trend, percentage share by sector and variation 1990-2015
-
2.0
4.0
6.0
8.0
10.0
12.0
1990 1991 1992 1993 1994 1995 1996 1997 1998 1999 2000 2001 2002 2003 2004 2005 2006 2007 2008 2009 2010 2011 2012 2013 2014 2015
1 A 1 1 A 2 1 A 3 1 A 4 1 A 5 1 B 2 5 C
1.9
56.3
3.6
15.1
0.03.2
16.93.0
Share 1990
1 A 11 A 21 A 31 A 41 A 51 B25 C
1.6
32.1
5.941.5
0.0
1.6
16.41.0
Share 20151 A 1
1 A 2
1 A 3
1 A 4
1 A 5
1 B
2
5 C 1 A 1
1 A 2
1 A 3
1 A 4
1 A 5
1 B
2
5 C
Total
-80 -60 -40 -20 0 20 40 60 80

44
Table 2.10 Cd emission trend from 1990 to 2015 (Mg)
1990 1995 2000 2005 2010 2011 2012 2013 2014 2015
Mg
Combustion in energy and
transformation industries 0.2 0.2 0.2 0.2 0.1 0.1 0.1 0.1 0.1 0.1
Non-industrial combustion
plants 1.5 1.2 1.7 2.6 2.6 1.9 2.3 2.5 2.5 2.6
Combustion - industry 5.6 5.6 5.0 3.3 2.5 2.7 2.6 2.3 2.3 2.0
Production processes 2.0 1.8 1.4 1.5 1.4 1.5 1.4 1.2 1.2 1.1
Road transport 0.3 0.4 0.4 0.4 0.4 0.4 0.4 0.3 0.4 0.4
Other mobile sources and
machinery 0.03 0.03 0.03 0.03 0.03 0.02 0.02 0.02 0.02 0.02
Waste treatment and disposal 0.3 0.3 0.1 0.2 0.1 0.1 0.1 0.1 0.1 0.1
Total 10.0 9.4 8.9 8.2 7.0 6.8 7.0 6.6 6.5 6.3
Emissions show a global reduction of 37% between 1990 and 2015, from 10.0 Mg to 6.3 Mg, mainly
driven by the reduction of emissions in the non ferrous metal industry, with the installation of the relevant
abatement technologies. Among the most significant variations, emissions from combustion in industry and
from non industrial combustion plants represent 32% and 41% of the total respectively, showing the former
a decrease (-64%) and the latter an increase (74%). Emissions from production processes decrease by about
43% and represent 18% of the total. Emissions from waste treatment and disposal (i.e. waste incineration),
accounting for 1% of the total, register a reduction of about 80%. A sector which show an increase in
emissions is road transport (+6%) accounting for 6% of the total levels.

45
2.3.3 Mercury (Hg)
The national atmospheric emissions of mercury show a quite stable trend in the period 1990-2015. Figure
2.11 and Table 2.11 illustrate the emission trend from 1990 to 2015. Figure 2.11 also illustrates the share of
Hg emissions by category in 1990 and 2015 as well as the total and sectoral variation from 1990 to 2015.
Figure 2.11 Hg emission trend, percentage share by sector and variation 1990-2015
0.0
2.0
4.0
6.0
8.0
10.0
12.0
14.0
1990 1991 1992 1993 1994 1995 1996 1997 1998 1999 2000 2001 2002 2003 2004 2005 2006 2007 2008 2009 2010 2011 2012 2013 2014 2015
1 A 1 1 A 2 1 A 4 1 B 2 5 C
9.5
36.0
5.21.6
45.4
2.2
Share 1990
1 A 1
1 A 2
1 A 4
1 B
2
5 C
8.4
26.7
31.3
0.7
32.2
0.8
Share 2015
1 A 11 A 21 A 41 B25 C
1 A 1
1 A 2
1 A 41 B
2
5 C
Total
-100 0 100 200 300

46
Table 2.11 Hg emission trend from 1990 to 2015 (Mg)
1990 1995 2000 2005 2010 2011 2012 2013 2014 2015
Mg
Combustion in energy and
transformation industries 1.1 1.1 1.1 1.1 0.9 0.9 0.9 0.7 0.7 0.7
Non-industrial combustion plants 0.6 0.7 1.0 2.0 2.4 1.9 2.2 2.4 2.5 2.6
Combustion - industry 4.2 4.0 3.4 3.4 2.5 2.5 2.2 2.1 2.3 2.2
Production processes 5.5 4.4 3.6 3.4 2.9 3.2 2.9 2.7 2.7 2.7
Waste treatment and disposal 0.3 0.2 0.1 0.2 0.1 0.1 0.1 0.1 0.1 0.1
Total 11.6 10.4 9.2 9.9 8.7 8.6 8.4 8.2 8.2 8.2
Emission trend shows a global reduction of about 29% from 1990 to 2015, varying from 11.6 Mg to 8.2
Mg. The general trend is driven by reduction of emissions in lead and zinc production industry as well as in
cement production industry, with the installation of the relevant abatement technologies. The main variations
concern: emissions from combustion in industry - processes with contact, accounting for 23% and decreasing
by 46%; emissions from production process - processes in iron and steel industries and collieries,
representing 32% of the total and increasing by 7%; emissions from non industrial combustion plants which
represent 31% of the total and showing the strongest increase (321%). Emissions deriving from combustion
in energy and transformation industries, accounting for 8%, show a 37% reduction. Emissions from
production process - processes in inorganic chemical industries, contributing to the total less than 1%, show
a large reduction, equal to 99% totally due to the technological changes for the production of chlorine.
Emissions from waste treatment and disposal, contributing to the total only for 1%, show a large reduction,
equal to 76%.
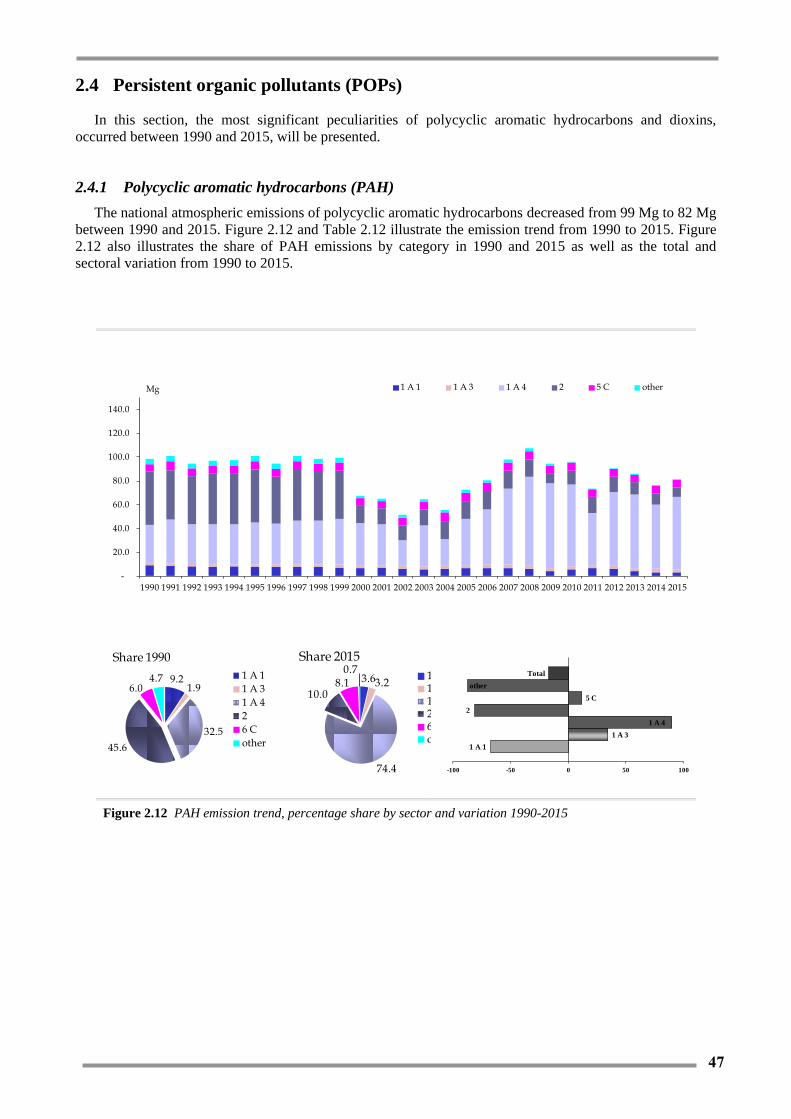
47
2.4 Persistent organic pollutants (POPs)
In this section, the most significant peculiarities of polycyclic aromatic hydrocarbons and dioxins,
occurred between 1990 and 2015, will be presented.
2.4.1 Polycyclic aromatic hydrocarbons (PAH)
The national atmospheric emissions of polycyclic aromatic hydrocarbons decreased from 99 Mg to 82 Mg
between 1990 and 2015. Figure 2.12 and Table 2.12 illustrate the emission trend from 1990 to 2015. Figure
2.12 also illustrates the share of PAH emissions by category in 1990 and 2015 as well as the total and
sectoral variation from 1990 to 2015.
Figure 2.12 PAH emission trend, percentage share by sector and variation 1990-2015
-
20.0
40.0
60.0
80.0
100.0
120.0
140.0
1990 1991 1992 1993 1994 1995 1996 1997 1998 1999 2000 2001 2002 2003 2004 2005 2006 2007 2008 2009 2010 2011 2012 2013 2014 2015
1 A 1 1 A 3 1 A 4 2 5 C other
9.21.9
32.5
45.6
6.04.7
Share 1990
1 A 1
1 A 3
1 A 4
2
6 C
other
3.63.2
74.4
10.08.1
0.7Share 2015
1 A 11 A 31 A 426 Cother
1 A 1
1 A 3
1 A 4
2
5 C
other
Total
-100 -50 0 50 100

48
Table 2.12 PAH emission trend from 1990 to 2015 (Mg)
1990 1995 2000 2005 2010 2011 2012 2013 2014 2015
Mg
Combustion in energy
and transformation
industries 9 8 7 6 6 7 6 4 3 3
Non-industrial
combustion plants 32 35 36 39 68 44 62 62 54 61
Combustion - industry 5 5 2 2 0.4 0.5 0.5 1 1 1
Production processes 45 45 14 15 12 14 13 10 10 8
Solvent and other product
use 0.01 0.01 0.01 0.01 0.01 0.01 0.01 0.01 0.01 0.01
Road transport 2 2 2 2 3 3 2 2 3 3
Other mobile sources and
machinery 0.3 0.3 0.3 0.4 0.3 0.3 0.3 0.3 0.3 0.2
Waste treatment and
disposal 6 7 6 7 7 7 7 6 6 7
Total 99 101 68 73 96 74 91 86 76 82
Between 1990 and 2015, total emissions show a decrease of about 17%. Among the most significant
changes, non industrial combustion plants, prevalently residential plants, account for 74% of the total in
2015 and show a strong increase (about 90%) due to the increase in wood consumption for heating.
Emissions from production processes, mainly processes in iron and steel industries, account for 10% of
the total and show a decrease of 82% due to the adoption of best abatement technologies for the coke
production; emissions from waste treatment and disposal, mainly open burning of agricultural wastes except
stubble burning, account for 8% of the total and show an increase of 12%. Emissions from combustion in
energy and transformation industries, which are driven by the combustion in iron and steel integrated plants,
account for 4% of the total and show a decrease of 68%. Emissions from road transport, accounting for 3%
in 2015, show an increase of about 38%. The share of other subsectors is about 1%.

49
2.4.2 Dioxins
The national atmospheric emissions of dioxins show a decreasing trend between 1990 and 2015, with
values varying from 503 g I Teq to 280 g I Teq. Figure 2.13 and Table 2.13 illustrate the emission trend from
1990 to 2015. Figure 2.13 also illustrates the share of dioxin emissions by category in 1990 and 2015 as well
as the total and sectoral variation from 1990 to 2015.
Figure 2.13 Dioxin emission trend, percentage share by sector and variation 1990-2015
-
50.0
100.0
150.0
200.0
250.0
300.0
350.0
400.0
450.0
500.0
1990 1991 1992 1993 1994 1995 1996 1997 1998 1999 2000 2001 2002 2003 2004 2005 2006 2007 2008 2009 2010 2011 2012 2013 2014 2015
1 A 1 1 A 2 1 A 3 1 A 4 2 5 C
5.0
23.3
3.3
34.6
13.4
20.5
Share 1990
1 A 1
1 A 2
1 A 3
1 A 4
2
5 C
2.120.0
5.342.4
27.4
2.8
Share 2015
1 A 1
1 A 2
1 A 3
1 A 4
2
5 C 1 A 1
1 A 2
1 A 3
1 A 4
2
5 C
Total
-100 -80 -60 -40 -20 0 20 40

50
Table 2.13 Dioxin emission trend from 1990 to 2015 (g I Teq)
1990 1995 2000 2005 2010 2011 2012 2013 2014 2015
g I Teq
Combustion in energy and
transformation industries 25 28 22 15 9 8 8 7 7 6
Non-industrial combustion
plants 174 165 151 87 134 87 122 122 106 119
Combustion - industry 117 121 111 116 63 63 52 52 57 56
Production processes 67 72 71 79 76 84 80 77 77 77
Road transport 16 19 21 22 20 19 17 16 16 15
Waste treatment and disposal 103 80 29 8 8 8 8 7 7 8
Total 503 484 404 327 309 268 287 282 269 280
The general trend shows a decrease from 1990 to 2015 equal to 44%, with a noticeable decline between
1995 and 2004 and between 2008 and 2010 because of the implementation of abatement system in the largest
Italian plant (steel production > 80% with respect to national production from integrated plants):
Double filtering system ESP (ElectroStatic Precipitator) + MEEP (Moving Electrode Electrostatic
Precipitator);
Reduction of the chlorine amount in the charge;
Injections of urea (able to form stable compounds with metals that catalyze the formation of
dioxins).
The most considerable reductions, between 1990 and 2015, are observed in waste treatment and disposal,
combustion in energy and transformation industries and combustion in industry, (-92%, -76%and -52%,
respectively). Specifically, the reduction is principally due to the cut of emissions from the combustion of
municipal waste both with energy recovery, reported under the non industrial sector, and without recovery,
reported under the waste sector due to the introduction of regulations establishing more stringent limits of
dioxin emissions from stacks.
In 2015, the subsectors which have contributed most to total emissions are production processes,
combustion in industry and non-industrial combustion plants accounting for 27%, 20% and 42% of the total
respectively. In particular emissions from production processes show an increase of 14% in the period 1990-
2015 due to the increase of the iron and steel production in electric arc furnaces.

51
2.4.3 Hexachlorobenzene (HCB)
The national atmospheric emissions of hexachlorobenzene show a decreasing trend in the period 1990-
2015, varying from 43 kg to 20 kg due to the decrease of the use of pesticide in agriculture. Figure 2.14 and
Table 2.14 illustrate the emission trend from 1990 to 2015. Figure 2.14 also illustrates the share of HCB
emissions by category in 1990 and 2015 as well as the total and sectoral variation from 1990 to 2015.
Figure 2.14 HCB emission trend, percentage share by sector and variation 1990-2015
0
5
10
15
20
25
30
35
40
45
50
1990 1991 1992 1993 1994 1995 1996 1997 1998 1999 2000 2001 2002 2003 2004 2005 2006 2007 2008 2009 2010 2011 2012 2013 2014 2015
1 A 1 1 A 2 1 A 4 3 D 5 C
0.5 11.2
4.3
54.2
29.7
Share 1990
1 A 1
1 A 2
1 A 4
2 D
5 C
3.512.8
14.0
1.967.7
Share 2015
1 A 1
1 A 2
1 A 4
2 D
5 C
1 A 1
1 A 2
1 A 4
3 D
5 C
Total
-150 -100 -50 0 50 100 150 200 250

52
Table 2.14 HCB emission trend from 1990 to 2015 (Mg)
1990 1995 2000 2005 2010 2011 2012 2013 2014 2015
Mg
Combustion in energy and
transformation industries 0.000 0.000 0.000 0.000 0.001 0.001 0.001 0.001 0.001 0.001
Non-industrial combustion
plants 0.002 0.003 0.006 0.006 0.004 0.003 0.003 0.003 0.003 0.003
Combustion - industry 0.005 0.005 0.004 0.004 0.003 0.004 0.004 0.003 0.003 0.003
Waste treatment and
disposal 0.013 0.014 0.010 0.008 0.003 0.009 0.014 0.014 0.014 0.013
Agriculture 0.023 0.016 0.005 0.002 0.003 0.001 0.000 0.000 0.000 0.000
Total 0.043 0.038 0.025 0.021 0.014 0.017 0.022 0.021 0.020 0.020
The sector contributing most to the general trend is waste treatment and disposal, in particular waste
incineration - sludge incineration. Specifically, the considerable increase of the amount of sludge burnt at a
specific incinerator is the reason of the peaks observed in 2001-2003 (incineration with energy recovery) and
in 2012-2015 (incineration without energy recovery). The other relevant sectors are combustion in industry
and non industrial combustion plants accounting for 13% and 14% respectively. Emissions from
combustion in energy and transformation industry and emissions from non industrial combustion plants
show an increase of 214% and 49% respectively between 1990 and 2015. In the same years for emissions
from waste treatment and disposal an increase of 5% has to be noted while emissions from combustion in
industry show a decrease of 47%. The use of pesticide in agriculture category is the main driver for the
decreasing trend of the HCB national emissions, emissions from this category show 98% decrease between
1990 and 2015.

53
2.4.4 Polychlorinated biphenyl (PCB)
The national atmospheric emissions of polychlorinated biphenyl show a decreasing trend in the period
1990-2015, about -33%, from 289 kg to 195 kg.
Figure 2.15 and Table 2.15 illustrate the emission trend from 1990 to 2015. Figure 2.15 also illustrates the
share of PCB emissions by category in 1990 and 2015 as well as the total and sectoral variation from 1990 to
2015.
Figure 2.15 PCB emission trend, percentage share by sector and variation 1990-2015
-10
40
90
140
190
240
290
1990 1991 1992 1993 1994 1995 1996 1997 1998 1999 2000 2001 2002 2003 2004 2005 2006 2007 2008 2009 2010 2011 2012 2013 2014 2015
1 A 1 1 A 2 1 A 4 2 5 C
42.1
19.4
5.0
31.7
1.9
Share 1990
1 A 1
1 A 2
1 A 4
2
6 C
34.1
9.115.5
40.6
0.7
Share 2015
1 A 1
1 A 2
1 A 4
2
6 C1 A 1
1 A 2
1 A 4
2
5 C
Total
-100 -50 0 50 100 150

54
Table 2.15 PCB emission trend from 1990 to 2015 (Mg)
1990 1995 2000 2005 2010 2011 2012 2013 2014 2015
Mg
Combustion in energy and
transformation industries 0.122 0.126 0.103 0.095 0.069 0.073 0.079 0.071 0.068 0.067
Non-industrial combustion
plants 0.015 0.018 0.025 0.036 0.033 0.023 0.029 0.030 0.028 0.030
Combustion - industry 0.056 0.053 0.039 0.040 0.016 0.018 0.017 0.015 0.015 0.018
Production processes 0.092 0.100 0.096 0.106 0.093 0.103 0.098 0.087 0.085 0.079
Waste treatment and
disposal 0.005 0.005 0.002 0.002 0.001 0.001 0.002 0.002 0.001 0.001
Total 0.289 0.301 0.266 0.278 0.211 0.218 0.225 0.204 0.198 0.195
The subsectors contributing most to the general trend are the production processes sector and the
combustion in energy and transformation industries sector, accounting for 41% and 34% of the total
emissions respectively, the former showing a decrease of 14%, the latter a reduction of 45%. The other
relevant subsectors are non industrial combustion plants accounting for 15% and relevantly increasing
(107%) and combustion in industry which accounts for 9% and decreases between 1990 and 2015 by 68%.

55
3 ENERGY (NFR SECTOR 1)
3.1 Overview of the sector
For the pollutants and sources discussed in this section, emissions result from the combustion of fuel. All
the pollutants reported under the UNECE/CLRTAP are estimated. Stationary and mobile categories are
covered for:
Electricity (power plants and Industrial producers);
Refineries (Combustion);
Iron and steel industries (Combustion)
Chemical and petrochemical industries (Combustion);
Construction industries (roof tiles, bricks);
Other industries (metal works factories, food, textiles, others);
Road Transport;
Coastal Shipping;
Railways;
Aircraft;
Domestic;
Commercial;
Public Service;
Fishing and Agriculture.
Fugitive emissions are also reported under the energy sector.
The national emission inventory is prepared using energy consumption information available from
national statistics and an estimate of the actual use of the fuels. The latter information is available at sectoral
level in a different number of publications and different details, such as fuel consumption, distance travelled
or some other statistical data related to emissions. For most of the combustion source categories, emissions
are estimated from fuel consumption data reported in the National Energy Balance (BEN) as supplied by the
Ministry for the Economic Development (MSE, several years (a)), and from emission factors appropriate to
the type of combustion and the pollutant.
The estimate from fuel consumption emission factors refers to stationary combustion in boilers and
heaters. The other categories are estimated by more complex methods discussed in the relevant sections. The
fuel consumption of “Other industries” is estimated so that the total fuel consumption of these sources is
consistent with the national energy balance.
Electricity generation by companies primarily for their own use is auto-generation, and the relevant
emissions should be reported under the industry concerned. However, national energy statistics report
emissions from electricity generation as a separate category. The Italian inventory makes an overall
calculation and then attempts to report as far as possible according to the methodology:
auto-generators are reported in the relevant industrial sectors of section “1.A.2 Manufacturing
Industries and Construction”, including sector “1.A.2.f Other”;
refineries auto-generation is included in section 1.A.1.b;
iron and steel auto-generation is included in section 1.A.1.c.
These reports are based on estimates of fuel used for steam generation connected with electricity
production supplied by the National Independent System Operator (TERNA, several years).
Emissions from the energy production plants in integrated iron and steel plants and emissions from coke

56
ovens are included in 1.A.1c category. Emissions from waste incineration facilities with energy recovery are
reported under category 1.A.4 a i (Combustion activity, commercial/institutional sector), whereas emissions
from other types of waste incineration facilities are reported under category 5.C (Waste incineration). In fact,
energy recovered by these plants is mainly used for district heating of commercial buildings. In particular,
for 2015, more than 98% of the total amount of waste incinerated is treated in plants with energy recovery
system. Different emission factors for municipal, industrial and oils, hospital waste, and sewage sludge are
applied, as reported in the waste chapter. Waste amount is then converted in energy content applying a factor
equal to 9.2 GJ/t of waste.
Emissions from landfill gas recovered are used for heating and power in commercial facilities and
reported under 1.A.4.a. Biogas recovered from the anaerobic digester of animal waste is used for utilities in
the agriculture sector and relative emissions are reported under 1.A.4.c. In consideration of the increasing of
the share of waste used to produce electricity, we plan to revise the allocation of these emissions under
category 1.A.1.a.
Under 1.A.2 g vii industrial off road machinery are reported; the methodology used to estimate emissions
from a range of portable or mobile equipment powered by reciprocating diesel engines is summarized.
Industrial off-road include construction equipment such as bulldozers, loaders, graders, scrapers, rollers and
excavators and other industrial machines as portable generators, compressors and cement mixers. Estimates
are calculated taking in account especially the population of the different classes, annual usage, average
power rating, load factor and technology distribution (EURO) according to the Guidebook (EMEP/EEA,
2016). COPERT II has been used for years 1994 and 1995 to estimate emissions and average emission
factors for vehicles and diesel fuel consumption. Population data have been estimated on the basis on a
survey of machinery sales. Machinery lifetime was estimated on the European averages reported in
EMEP/CORINAIR, 2007, the annual usage data were taken either from industry or published data by EEA.
The emission factors used came from EMEP/EEA and COPERT. The load factors were taken from
COPERT. It was possible to calculate fuel consumptions for each class based on fuel consumption factors
given in EMEP/CORINAIR, 2007. Comparison with known fuel consumption for certain groups of classes
suggested that the population method overestimated fuel consumption by factors of 1.2-1.5 for industrial
vehicles. Time series is reconstructed in relation to the diesel fuel use in industry reported in the national
energy balance as gasoil final consumption. Emission factors for NOX, CO, NMVOC and PM have been
updated taking in account the reduction factors established in the European Directive 97/68/EC, the timing of
application of the new limits and the tax of penetration of the new industrial vehicles in the total fleet.
Emission reduction factor reported in the European Directive 2004/26/EC Directive have been applied and
introduced in the emission estimates.
The energy sector account in 2015 for more than 50% of total emissions for all the pollutants estimated,
except for HCB which accounts for 30.4% and ammonia for 2.2%. In particular, emissions from the energy
sector are 96% of NOX, 95% of CO and BC, 91% PM2.5 and 90% of SOX national total emissions.
In 2015, the following categories are key categories for different pollutants: public electricity and heat
production (1A1a), petroleum refining (1A1b), stationary combustion in manufacturing industries (1A2f),
road transport categories (1A3b), national navigation (1A3d ii), stationary combustion plants in
commercial/institutional (1A4a i) and residential (1A4b i), off-road vehicles in agriculture, forestry and
fishing (1A4c ii), and fugitive emissions from refining and storage (1B2a iv).
The same categories are key categories for 1990 and for the trend analysis. In addition, for 1990, fugitive
emissions from distribution of oil products (1B2a v) for NMVOC, manufacture of solid fuels and other
energy industries (1A1c) for PAH emissions, and mobile combustion in manufacturing industries and
construction (1A2g vii) for BC are also key categories while for trend mobile combustion in manufacturing
industries and construction (1A2g vii) is also key category.
3.2 Methodological issues
Methodologies used for estimating emissions from this sector are based on and conform to the
EMEP/CORINAIR guidebook (EMEP/CORINAIR, 2007; EMEP/EEA, 2013; EMEP/EEA, 2016), the IPCC
Guidelines (IPCC, 1997; IPCC, 2006) and the Good Practice Guidance (IPCC, 2000).
57
Specifically for road transport, the most recent version of COPERT 4 programme, version 11.4, has been
used to calculate emissions (EMISIA SA, 2016); the updated version of the model has been applied for the
whole time series. In paragraph 3.8 more detailed information is supplied on these figures.
A detailed description on the methods and national specific circumstances as well as reference material of
the energy sector is documented in the national inventory report of the Italian greenhouse gas inventory
(ISPRA, 2017[a]). At national level, trends of the CLRTAP pollutants are described in the environmental
data yearbook published by ISPRA (ISPRA, 2016).
The National Energy Balance, published by the Ministry of Economic Development, is the main source of
information to estimate emissions from the energy sector as it reports fuel consumption for different sectors
at national level. Additional information for electricity production is provided by the major national
electricity producers and by the major national industry corporation. On the other hand, basic activity data
for road transport, maritime and aviation, such as the number of vehicles, harbour statistics and aircraft
landing and take-off cycles are provided in statistical yearbooks published both by the National Institute of
Statistics and the Ministry of Transportation. Other data are communicated by different category
associations.
Emission factors used are based on national sources, or else on values specified in the EMEP/EEA
guidebook and/or IPCC guidelines which are appropriate for Italy. Emission factors used for energy and
manufacturing industries and non industrial combustion, specifically categories 1A1, 1A2, 1A4 are available
on the ISPRA website at http://www.sinanet.isprambiente.it/it/sia-ispra/serie-storiche-emissioni/fattori-di-
emissione-per-le-sorgenti-di-combustione-stazionarie-in-italia/view as well as emission factors for road
transport (1A3b) are available at http://www.sinanet.isprambiente.it/it/sia-ispra/fetransp/ .
The Institute, specifically the same unit responsible for the inventory, also collects data in the context of
the European Emissions Trading Scheme, the National Pollutant Release and Transfer Register (Italian
PRTR) and the Large Combustion Plants (LCP) Directives. All these data are managed and used to compile
the inventory. Figures are cross checked to develop country-specific emission factors and input activity data;
whenever data cannot be straight used for the inventory compilation, they are considered as verification.
EPER/EPRTR data are yearly available from 2002 while ETS data from 2005 and LCP data from 1990 all on
yearly basis. In the EPRTR registry total emissions divided by category are reported by plants if they are
over the relevant ceiling for each pollutant. LCP data refer only to SOX, NOX and PM emissions that are
collected in stacks over 50 MWth and could result in figures lower those reported in the EPRTR. In the ETS
only CO2 and fuel consumption data are reported. QA/QC checks at plants level are directed to check the
submissions of data in the different context and evaluate the differences if any. For example, if emissions
submitted by a plant under LCP are higher than those submitted under the EPRTR we come back to the plant
for an explanation and the verification of data submitted. In addition, on the basis of fuel consumption
supplied under the ETS and average emission factor by fuel we estimates emissions at plant level and
compare them with those submitted in the EPRTR and LCP. Also in this case we ask for clarification to the
plant.
3.3 Time series and key categories
The following sections present an outline of the main key categories in the energy sector. Table 3.1
highlights the key categories identified in the sector.
The energy sector is the main source of emissions in Italy with a share of more than 80% for different
pollutants under the UNECE convention; specifically, for the main pollutants, in 2015 the sector accounts
for:
96% in national total NOX emissions;
95% in national total BC emissions;
95% in national total CO emissions;
91% in national total PM2.5 emissions;

58
90% in national total SOX emissions.
Moreover, the sector is also an important source for heavy metals; specifically in 2015, energy sector is
responsible for 81% of total Cd emissions and accounts for a high share of other heavy metals, As (99.7%),
Cu (95%), Ni (87%), Se (91%).
There are no differences as compared to the sectoral share in 1990, except for lead whose contribution in
1990 was 98% of total emissions, 25% higher than in 2015.
One of the most important source of emissions in the sector, in 2015, is represented by road transport
(1A3b), at least for the main pollutants: NOX (51.7%), BC (39.5%), CO (21.0%), NMVOC (17.1%), and
particulate matter (PM10 12.2%, PM2.5 11.3%). There has been a strong reduction in lead emissions from
1990 to 2015 in road transport due to replacement of lead gasoline. An in depth analysis of the road
transport category and its emission trends is reported in paragraph 3.8.
Manufacturing industries and construction (1A2f) is a main source of heavy metals and POPs, accounting
for about 37% of lead total emissions, 32% for cadmium, 27% for mercury, 20% for dioxin, 13% for HCB
and 9% for PCB. The source is key category also for PM10 and PM2.5, (4% both) as well as SOX, NOX, and
CO about 22%, 8% and 4% of total emissions.
Public electricity and heat production (1A1a) is a key source of SOX emissions in 2015 with a share of
14.2%, PCB (33.6%) and NOX emissions (4.8%). A strong reduction of SOX, NOX and PM10 emissions is
observed for this category (as well as for 1A2f category). The introduction of two regulatory instruments: the
DPR 203/88 (Decree of President of the Republic of 24th May 1988), laying down rules concerning the
authorisation of plants, and the Ministerial Decree of 12th July 1990, which introduced plant emission limits
for new plants of emissions for PM10, NOX and SOX, and required old plants to conform to the limit by
1997, explained the emission reduction in the ninety years. The shift from fuel oil to natural gas combined
with the increase of energy efficiency of the plants and the introduction of PM10 abatement technologies
have been implemented to comply with the emission limit values. From 2000 lower limits to the stacks have
been introduced, in the framework of environmental integrated authorisations, for the authorisation of new
plants and the implementation of the old ones, especially for those collocated in areas with air quality critical
values. For this reason plants have increase the use of natural gas heat and power combined technology. In
2015 in Italy there are still 10 coal plants and 4 fuel oil plants out of around 150 power plants included in this
source category. With exception of few biomass plants and some gasoil stationary engines in the small
islands the other plants are natural gas combined cycle thermoelectric power plant.
Petroleum refining (1A1b) is a key category for SOX emissions in 2015 with a share of 8.3%.
National navigation (1A3d ii) is key category for SOX (17.1%), NOX (9.2%), PM10 (3.1%) and PM2.5
(3.4%). The weight of this category on the total emissions has increased for SOX and NOX during the period
because of a sectoral delay in the introduction of relevant normative to reduce air emissions.
A sector increasing its level of emissions is the non-industrial combustion (1A4): NOX and NMVOC,
emissions of this category account for 16.7% and 25.0% of national total, respectively; CO emissions
account for 64.2%; PM10 and PM2.5 emissions account for 64.3% and 71.2% respectively; BC emissions
account for 47.6%; dioxin is 42.4%, PAH is 74.4% and HCB is 14.0% of national totals. These emissions are
prevalently due to biomass combustion, in winter, and they are also becoming critical for air quality issues.
Non-industrial combustion is also a key category for heavy metals due to the increase of combustion of
waste with energy recovery reported under the sector. An in depth analysis of this category is reported in the
paragraph 3.12.
Fugitive emissions in refinery from fossil fuel distribution and storage (1B2a iv) is key category in 2015
for SOX emissions (14.6%). Total SOX fugitive emissions from distribution of fossil fuels account for 18.0%
of the total.

59
Table 3.1 Key categories in the energy sector in 2015
1A1
a
1A1
b 1A1c 1A2f
1A2
g vii
1A3
a i
1A3
a ii
1A3
b i
1A3
b ii
1A3
b iii
1A3
b iv
1A3
b v
1A3
b vi 1A3c
1A3
d ii
1A3e
i
1A4
a i
1A4
bi
1A4
bii 1A4c
1A5
b 1B1a
1B1
b 1B2
SOX 14.2 8.3 1.6 21.8 0.0 0.3 0.1 0.2 0.0 0.1 0.0 0.0 17.1 0.0 3.1 4.8 0.0 0.0 0.1 18.0
NOX 4.8 1.6 0.3 8.5 1.0 0.6 0.3 20.5 6.7 23.8 0.7 0.1 9.2 0.0 4.5 5.6 0.0 6.7 0.4 0.7
NH3 0.0 0.2 0.0 1.5 0.0 0.0 0.0 0.0 0.0 0.0 0.4 0.0 0.0 0.0
NMVOC 0.3 0.1 0.0 0.8 0.2 0.1 0.1 2.9 0.4 0.9 6.1 6.8 0.0 2.0 0.0 3.0 20.5 0.1 1.3 0.1 0.0 0.1 5.3
CO 0.8 0.1 0.9 3.8 0.3 0.1 0.1 11.6 1.1 1.9 6.4 0.0 2.7 0.0 1.1 60.8 0.1 2.3 0.7 0.0
PM10 0.4 0.3 0.0 3.8 0.3 0.0 0.0 3.1 1.6 2.2 0.5 4.8 0.0 3.1 0.0 1.0 61.1 0.0 2.2 0.3 0.3 0.1 0.2
PM2.5 0.4 0.3 0.0 3.5 0.3 0.0 0.0 3.5 1.7 2.5 0.6 2.9 0.0 3.4 0.0 1.1 67.7 0.0 2.5 0.3 0.0 0.0 0.2
BC 0.1 0.1 0.1 1.0 1.2 0.1 0.0 18.7 9.3 10.7 0.7 0.1 3.9 0.0 0.6 38.7 0.0 8.3 1.1 0.2 0.1 0.2
Pb 0.9 0.1 0.0 37.5 0.2 0.1 4.3 0.0 26.5 3.9 0.0 0.0 0.2
Cd 1.3 0.3 0.0 32.0 0.0 0.0 0.0 3.1 0.6 1.0 0.1 0.8 0.0 0.2 34.0 7.2 0.0 0.3 0.0 1.6
Hg 7.0 1.2 0.1 26.7 28.1 3.0 0.2 0.7
PAH 0.4 0.0 3.1 0.6 0.0 0.0 0.0 2.0 0.4 0.6 0.0 0.0 0.1 2.1 71.7 0.0 0.6 0.0
Dioxin 1.1 1.0 20.0 3.6 0.8 0.7 0.2 1.0 41.2 0.2
HCB 3.5 12.8 6.0 7.9 0.0
PCB 33.6 0.5 9.1 7.3 8.1 0.0
Note: key categories are shaded in blue

60
3.4 QA/QC and verification
A complete description of methodological and activity data improvements are documented every year in a
QA/QC plan (ISPRA, 2017[b]).
The analysis of data collected from point sources allowed to distribute emissions at local level, for 2010
and previous years, as submitted under the CLTRAP. To illustrate an example, NOX emissions from point
sources are reported in Figure 3.1 for the year 2010. Point sources include: public electricity and heat
production plants, petroleum refineries, stationary combustion plants (iron and steel, non-ferrous metals,
chemicals, clinker) and pipeline compressors.
The figure highlights that the most critical industrial areas are distributed in few regions.
Figure 3.1 NOX emissions from point sources in 2005 (t)
In Figure 3.2, NOX emissions communicated by 229 facilities (power plants, refineries, cement plants and
iron and steel integrated plants), in the framework of the national E-PRTR register and LCP Directive, have
been processed and geographically located. The territorial distribution shows similar results to those reported
in the previous figure highlighting the industrial areas still in activity in 2010.

61
Figure 3.2 NOX emissions from point sources in 2010 (t)
Every five years emissions are disaggregated at regional and provincial level and figures are compared
with results obtained by regional bottom up inventories. Emissions disaggregated at local level are also used
as input for air quality modelling. NOX emissions from road transport have been disaggregated at NUTS3
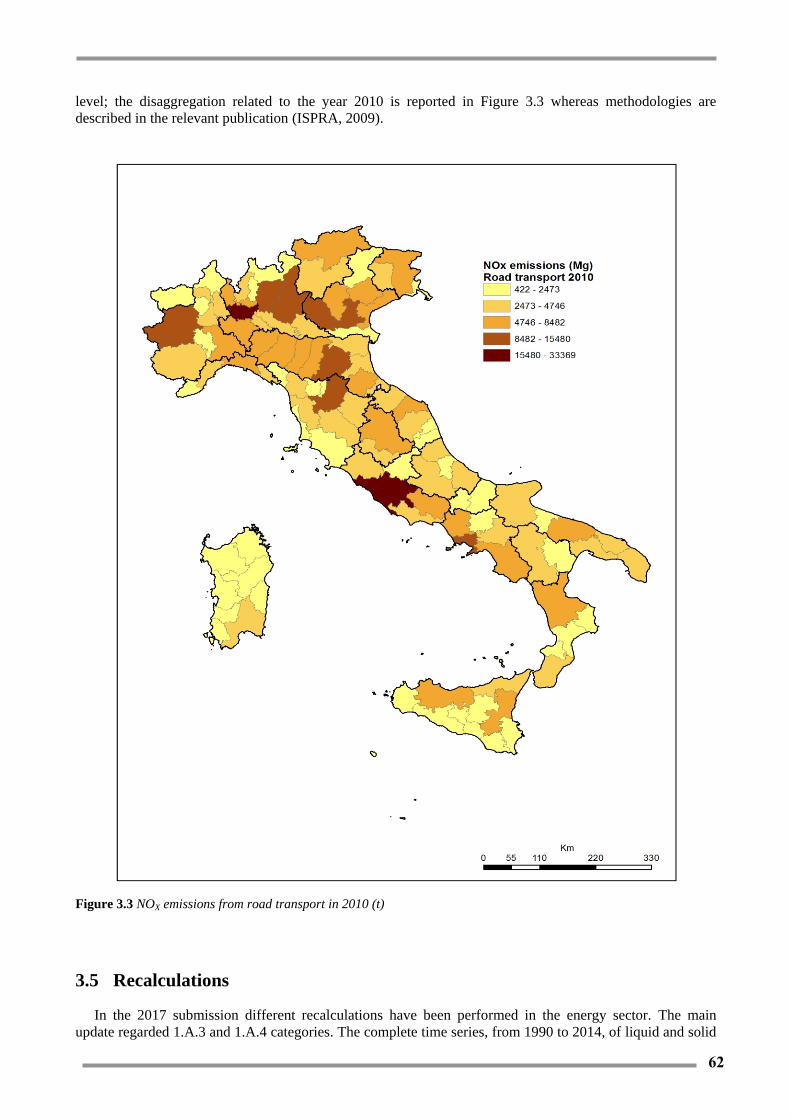
62
level; the disaggregation related to the year 2010 is reported in Figure 3.3 whereas methodologies are
described in the relevant publication (ISPRA, 2009).
Figure 3.3 NOX emissions from road transport in 2010 (t)
3.5 Recalculations
In the 2017 submission different recalculations have been performed in the energy sector. The main
update regarded 1.A.3 and 1.A.4 categories. The complete time series, from 1990 to 2014, of liquid and solid

63
fuel consumptions, for road transport (1.A.3.b), off-road vehicles (1.A.3.c, 1.A.3.d, 1.A.4.b ii, 1.A.4.c) and
heating system categories for stationary combustion (1.A.4.a i and 1.A.4.b i), have been updated on the basis
of figures submitted by the Ministry of Economic Development to the Joint Questionnaire
IEA/OECD/EUROSTAT.
Moreover, emission reduction targets established in the 2004/26/EC Directive have been applied affecting
emission estimates of railway category (1.A.3.c), recreational craft activities (1.A.3.d), household and
gardening mobile machinery (1.A.4.b ii), off-road in agriculture, forestry and fishing (1.A.4.c ii and 1.A.4.c
iii), and off-road machinery in industry (1.A.2.g vii). More detailed information is reported in the relevant
paragraphs.
For road transport (1.A.3.b), the upgraded version of COPERT 4, v.11.4 has been used resulting in a
general revision of emission estimates for the whole time series. More detailed results are reported in
paragraph 3.8.
In addition, for the category 1.A.4, emissions have been recalculated from 2011 to 2013 taking in account
the update of waste fuel consumption for commercial heating and NOX emission factor for natural gas for
2013 and 2014. More detailed information is reported in paragraph 3.12.
Concerning the aviation category (1.A.3.a), an overall assessment and comparison with emission
estimates provided for Italy by Eurocontrol lead to the update of both activity data, from 2002, and NOX,
SOX, CO, and PM emission factors from 2005, and a consequent recalculation of emissions from this
category. More detailed information is reported in paragraph 3.7.
3.6 Planned improvements
Specific improvements are detailed in the 2017 QA/QC plan (ISPRA, 2017[b]).
For the energy sector, a major progress regards the management of the information system where data
collected in the framework of different obligations, Large Combustion Plant, E-PRTR and Emissions
Trading, are gathered together thus highlighting the main discrepancies in information and detecting
potential errors. Moreover the complete use of the energy data provided by the Ministry of Economic
Development to the Joint Questionnaire IEA/OECD/EUROSTAT is planned in substitution of the national
energy balances used till now.
Further progress will regard the maritime sector improving the annual estimations on the basis of detailed
databases on ships movements while for the aviation sector further checks are needed for that regard
NMVOC and CH4 emission estimates provided by EUROCONTROL before to implement the relevant
changes in the national inventory.
With respect to PM10 and heavy metals emissions from Public Electricity and Heat Production category
(1A1a) while PM10 emissions are updated every year on the basis of data submitted by the plants in the
framework of the EPRTR registry, Large Combustion Plants Directive and Environmental Reports, heavy
metals emission factors time series have been reconstructed from 1990 to 2001 on the basis of a study
conducted by ENEL (major company in Italy) which reports heavy metals emissions measurements by fuel
and technology (with or without PM10 abatement technologies) of relevant national plants. From 2001 these
Emission factors have not been updated. Heavy metals emission data in the EPRTR registry refer only to few
not representative plants and are not sufficient to calculate average emission factors. Further work is planned
to update/change emission factors for those pollutants, as zinc, where figures reported in the EPRTR lead to
average values significantly different from those actually used.
64
3.7 Aviation (NFR SUBSECTOR 1.A.3.a)
3.7.1 Overview
Emissions from categories 1.A.3.a.i International Aviation and 1.A.3.a.ii Domestic Aviation are
estimated, including figures both for landing and take-off cycles (LTO) and for the cruise phase of the flight
(the latter reported as memo items and not included in the national totals).
3.7.2 Methodological issues
According to the IPCC Guidelines and Good Practice Guidance (IPCC, 1997; IPCC, 2006; IPCC, 2000) and
the EMEP/EEA Guidebook 2016 (EMEP/EEA, 2016), a national technique has been developed and applied
to estimate emissions.
The current method estimates emissions from the following assumptions and information.
Activity data comprise both fuel consumptions and aircraft movements, which are available in different level
of aggregation and derive from different sources as specified here below:
Total inland deliveries of aviation gasoline and jet fuel are provided in the national energy balance
(MSE, several years (a)). This figure is the best approximation of aviation fuel consumption, for
international and domestic use, but it is reported as a total and not split between domestic and
international.
Data on annual arrivals and departures of domestic and international landing and take-off cycles at
Italian airports are reported by different sources: National Institute of Statistics in the statistics
yearbooks (ISTAT, several years), Ministry of Transport in the national transport statistics
yearbooks (MIT, several years), the Italian civil aviation in the national aviation statistics yearbooks
(ENAC/MIT, several years), EUROCONTROL flights data time series 2002–2015
(EUROCONTROL, 2016).
An overall assessment and comparison with EUROCONTROL emission estimates was carried out this
year which lead to an update of the methodology used by Italy for this category. Data on the number of
flights, fuel consumption and emission factors were provided by EUROCONTROL in the framework of a
specific project funded by the European Commission, and quality checked by the European Environmental
Agency and its relevant Topic Centre (ETC/ACM), aimed at improving the reporting and the quality of
emission estimates from the aviation sector of each EU Member State under both the UNFCCC and LRTAP
conventions. The Advanced Emissions Model (AEM) was applied by Eurocontrol to derive these figures,
according to a Tier 3 methodology (EMEP/EEA, 2016).
EUROCONTROL fuel and emissions time series cover the period 2005-2015, while the number of flights
are available since 2002. In this year submission, EUROCONTROL data, related to Italy, on the number of
flights have been used to update the national inventory from 2002, while fuel and emissions data have been
used since 2005, with the exception of HC emissions (both NMVOC and CH4) and cruise emissions of CO,
for which the previous methodology has been kept, because of the need to further investigate on the
discrepancies with previous estimates.
For the time series from 1990 to 1999, figures for emission and consumption factors are derived by the
EMEP/CORINAIR guidebook (EMEP/CORINAIR, 2007), both for LTO cycles and cruise phases, taking
into account national specificities.
These specificities derived from the results of a national study which, taking into account detailed
information on the Italian air fleet and the origin-destination flights for the year 1999, calculated national
values for both domestic and international flights (Romano et al., 1999; ANPA, 2001; Trozzi et al., 2002 (a))
on the basis of the default emission and consumption factors reported in the EMEP/CORINAIR guidebook.
National average emissions and consumption factors were therefore estimated for LTO cycles and cruise
both for domestic and international flights from 1990 to 1999. Specifically, for the year referred to in the
survey, the method estimates emissions from the number of aircraft movements broken down by aircraft and
engine type (derived from ICAO database if not specified) at each of the principal Italian airports;
information about whether the flight is international or domestic and the related distance travelled has also
been considered. A Tier 3 method has been applied for 1999.In fact, figures on the number of flights,
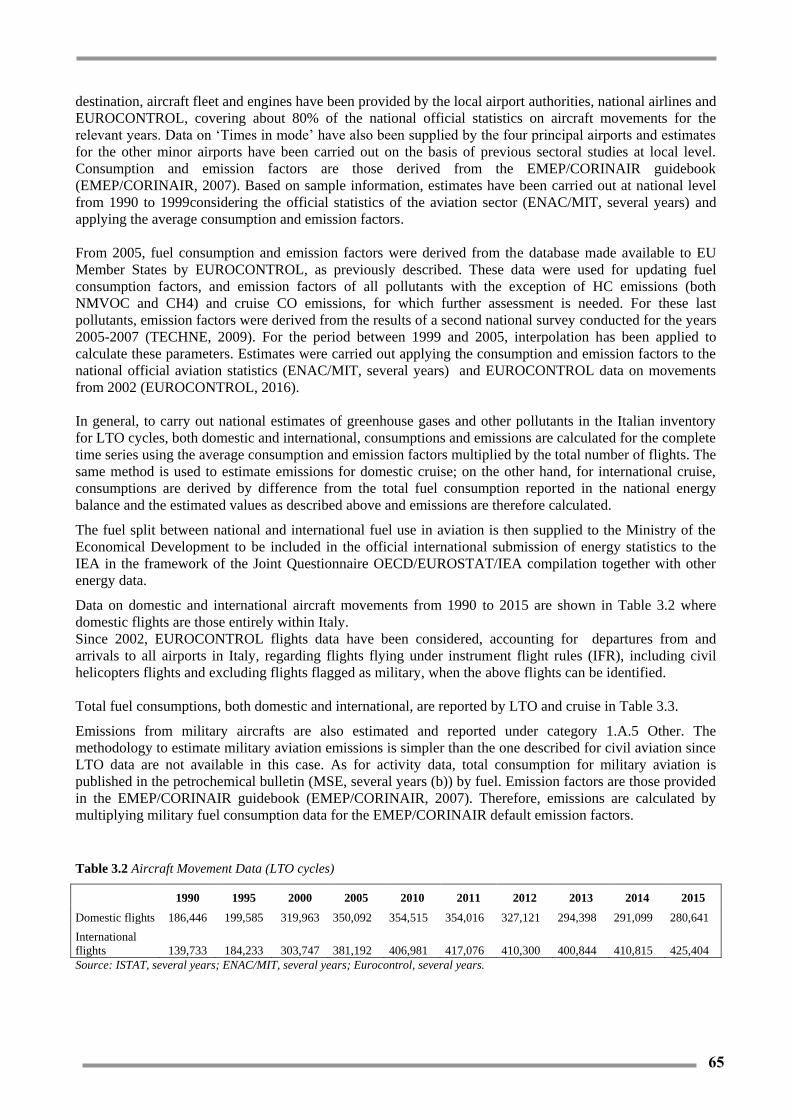
65
destination, aircraft fleet and engines have been provided by the local airport authorities, national airlines and
EUROCONTROL, covering about 80% of the national official statistics on aircraft movements for the
relevant years. Data on ‘Times in mode’ have also been supplied by the four principal airports and estimates
for the other minor airports have been carried out on the basis of previous sectoral studies at local level.
Consumption and emission factors are those derived from the EMEP/CORINAIR guidebook
(EMEP/CORINAIR, 2007). Based on sample information, estimates have been carried out at national level
from 1990 to 1999considering the official statistics of the aviation sector (ENAC/MIT, several years) and
applying the average consumption and emission factors.
From 2005, fuel consumption and emission factors were derived from the database made available to EU
Member States by EUROCONTROL, as previously described. These data were used for updating fuel
consumption factors, and emission factors of all pollutants with the exception of HC emissions (both
NMVOC and CH4) and cruise CO emissions, for which further assessment is needed. For these last
pollutants, emission factors were derived from the results of a second national survey conducted for the years
2005-2007 (TECHNE, 2009). For the period between 1999 and 2005, interpolation has been applied to
calculate these parameters. Estimates were carried out applying the consumption and emission factors to the
national official aviation statistics (ENAC/MIT, several years) and EUROCONTROL data on movements
from 2002 (EUROCONTROL, 2016).
In general, to carry out national estimates of greenhouse gases and other pollutants in the Italian inventory
for LTO cycles, both domestic and international, consumptions and emissions are calculated for the complete
time series using the average consumption and emission factors multiplied by the total number of flights. The
same method is used to estimate emissions for domestic cruise; on the other hand, for international cruise,
consumptions are derived by difference from the total fuel consumption reported in the national energy
balance and the estimated values as described above and emissions are therefore calculated.
The fuel split between national and international fuel use in aviation is then supplied to the Ministry of the
Economical Development to be included in the official international submission of energy statistics to the
IEA in the framework of the Joint Questionnaire OECD/EUROSTAT/IEA compilation together with other
energy data.
Data on domestic and international aircraft movements from 1990 to 2015 are shown in Table 3.2 where
domestic flights are those entirely within Italy.
Since 2002, EUROCONTROL flights data have been considered, accounting for departures from and
arrivals to all airports in Italy, regarding flights flying under instrument flight rules (IFR), including civil
helicopters flights and excluding flights flagged as military, when the above flights can be identified.
Total fuel consumptions, both domestic and international, are reported by LTO and cruise in Table 3.3.
Emissions from military aircrafts are also estimated and reported under category 1.A.5 Other. The
methodology to estimate military aviation emissions is simpler than the one described for civil aviation since
LTO data are not available in this case. As for activity data, total consumption for military aviation is
published in the petrochemical bulletin (MSE, several years (b)) by fuel. Emission factors are those provided
in the EMEP/CORINAIR guidebook (EMEP/CORINAIR, 2007). Therefore, emissions are calculated by
multiplying military fuel consumption data for the EMEP/CORINAIR default emission factors.
Table 3.2 Aircraft Movement Data (LTO cycles)
1990 1995 2000 2005 2010 2011 2012 2013 2014 2015
Domestic flights 186,446 199,585 319,963 350,092 354,515 354,016 327,121 294,398 291,099 280,641
International
flights 139,733 184,233 303,747 381,192 406,981 417,076 410,300 400,844 410,815 425,404
Source: ISTAT, several years; ENAC/MIT, several years; Eurocontrol, several years.

66
Table 3.3 Aviation jet fuel consumptions for domestic and international flights (Gg)
1990 1995 2000 2005 2010 2011 2012 2013 2014 2015
Gg
Domestic LTO 121 129 208 207 212 197 184 164 172 160
International LTO 123 162 258 257 282 271 271 267 294 310
Domestic cruise 387 414 654 590 652 644 591 537 531 497
International cruise 1215 1662 2296 2569 2615 2746 2637 2616 2637 2800
Source: ISPRA elaborations
3.7.3 Time series and key categories
Emission time series of NOX, NMVOC, SOX, TSP, CO, Pb are reported in Table 3.4, Table 3.5, Table 3.6,
Table 3.7, Table 3.8 and Table 3.9, respectively.
An upward trend in emission levels for civil aviation is observed from 1990 to 2015 which is explained by
the increasing number of LTO cycles. Nevertheless, the propagation of more modern aircrafts in the fleet
slows down the trend in the most recent years. There has also been a decrease in the number of flights in the
last years. Aviation is not a key category.
Table 3.4 Time series of NOX (Gg)
Source categories for NFR Subsector
1.A.3.a, 1.A.5.b 1990 1995 2000 2005 2010 2011 2012 2013 2014 2015
1 A 3 a ii (i) Domestic aviation LTO (civil) 1.36 1.47 2.50 2.55 2.72 2.67 2.50 2.23 2.23 2.13
1 A 3 a i (i) International aviation LTO (civil) 1.60 2.16 3.21 3.49 4.03 4.07 4.07 4.04 4.32 4.60
1 A 3 a Civil Aviation (LTO) 2.97 3.62 5.70 6.04 6.74 6.73 6.58 6.27 6.55 6.72
1A3 a ii (ii) Domestic aviation cruise (civil) 5.28 5.66 9.45 8.59 10.14 10.04 9.31 8.43 8.34 7.99
1A3a i (ii) International aviation cruise (civil) 18.85 26.83 38.68 34.25 38.11 39.07 38.50 38.27 40.67 43.27
1 A 5 b Other, Mobile (including military,
land based and recreational boats) 11.16 11.99 7.24 13.50 6.11 4.68 3.93 6.01 4.35 3.29
Table 3.5 Time series of NMVOC (Gg)
Source categories for NFR Subsector
1.A.3.a, 1.A.5.b 1990 1995 2000 2005 2010 2011 2012 2013 2014 2015
1 A 3 a ii (i) Domestic aviation LTO (civil) 0.24 0.26 0.54 1.03 0.60 0.60 0.56 0.50 0.49 0.48
1 A 3 a i (i) International aviation LTO (civil) 0.44 0.60 0.97 1.60 1.12 1.15 1.13 1.11 1.13 1.17
1 A 3 a Civil Aviation (LTO) 0.69 0.86 1.51 2.64 1.72 1.75 1.69 1.61 1.63 1.65
1A3 a ii (ii) Domestic aviation cruise (civil) 0.37 0.29 0.50 0.56 0.65 0.42 0.44 0.28 0.28 0.28
1A3a i (ii) International aviation cruise (civil) 0.68 0.97 1.37 1.06 1.05 1.07 1.05 1.03 1.06 1.09
1 A 5 b Other, Mobile (including military,
land based and recreational boats) 3.00 3.13 1.90 3.00 1.05 0.81 0.62 1.00 0.84 0.66

67
Table 3.6 Time series of SOX (Gg)
Source categories for NFR Subsector
1.A.3.a, 1.A.5.b 1990 1995 2000 2005 2010 2011 2012 2013 2014 2015
1 A 3 a ii (i) Domestic aviation LTO (civil) 0.11 0.12 0.21 0.23 0.23 0.21 0.19 0.17 0.18 0.17
1 A 3 a i (i) International aviation LTO (civil) 0.13 0.17 0.26 0.27 0.30 0.29 0.29 0.28 0.31 0.33
1 A 3 a Civil Aviation (LTO) 0.24 0.29 0.47 0.50 0.52 0.50 0.48 0.45 0.49 0.50
1A3 a ii (ii) Domestic aviation cruise (civil) 0.37 0.39 0.66 0.68 0.72 0.69 0.63 0.56 0.56 0.53
1A3a i (ii) International aviation cruise (civil) 1.25 1.78 2.58 2.37 2.54 2.59 2.54 2.52 2.66 2.81
1 A 5 b Other, Mobile (including military,
land based and recreational boats) 1.19 0.81 0.21 0.17 0.13 0.11 0.04 0.10 0.14 0.12
Table 3.7 Time series of TSP (Gg)
Source categories for NFR Subsector
1.A.3.a, 1.A.5.b 1990 1995 2000 2005 2010 2011 2012 2013 2014 2015
1 A 3 a ii (i) Domestic aviation LTO (civil) 0.01 0.01 0.02 0.02 0.02 0.02 0.02 0.02 0.02 0.02
1 A 3 a i (i) International aviation LTO (civil) 0.01 0.02 0.03 0.03 0.03 0.03 0.03 0.03 0.03 0.03
1 A 3 a Civil Aviation (LTO) 0.02 0.03 0.05 0.06 0.05 0.05 0.05 0.05 0.05 0.05
1A3 a ii (ii) Domestic aviation cruise (civil) 0.08 0.08 0.13 0.10 0.09 0.09 0.09 0.07 0.07 0.07
1A3a i (ii) International aviation cruise (civil) 0.26 0.38 0.54 0.50 0.40 0.41 0.39 0.38 0.40 0.41
1 A 5 b Other, Mobile (including military,
land based and recreational boats) 1.30 1.57 0.91 1.63 0.83 0.64 0.50 0.79 0.63 0.48
Table 3.8 Time series of CO (Gg)
Source categories for NFR Subsector
1.A.3.a, 1.A.5.b 1990 1995 2000 2005 2010 2011 2012 2013 2014 2015
1 A 3 a ii (i) Domestic aviation LTO (civil) 1.23 1.33 2.25 2.25 2.28 1.88 1.82 1.64 1.90 1.70
1 A 3 a i (i) International aviation LTO (civil) 1.72 2.31 3.31 2.79 2.92 2.57 2.54 2.51 3.02 3.21
1 A 3 a Civil Aviation (LTO) 2.95 3.63 5.56 5.04 5.20 4.45 4.36 4.15 4.92 4.91
1A3 a ii (ii) Domestic aviation cruise (civil) 13.78 7.82 14.27 17.96 23.97 9.57 11.88 3.38 3.42 3.90
1A3a i (ii) International aviation cruise (civil) 1.56 2.21 3.16 2.77 2.93 3.00 2.95 2.88 2.95 3.06
1 A 5 b Other, Mobile (including military,
land based and recreational boats) 65.12 79.02 45.49 54.48 17.33 14.12 6.32 13.90 19.55 16.49
Table 3.9 Time series of Pb (Mg)
Source categories for NFR Subsector
1.A.3.a, 1.A.5.b 1990 1995 2000 2005 2010 2011 2012 2013 2014 2015
1 A 3 a ii (i) Domestic aviation LTO (civil) 0.19 0.20 0.35 0.38 0.38 0.38 0.35 0.32 0.31 0.30
1 A 3 a i (i) International aviation LTO (civil) 0.21 0.28 0.43 0.54 0.57 0.59 0.58 0.56 0.58 0.60
1 A 3 a Civil Aviation (LTO) 0.39 0.48 0.77 0.91 0.96 0.97 0.93 0.88 0.89 0.90
1A3 a ii (ii) Domestic aviation cruise (civil) 0.57 0.62 1.06 1.16 1.18 1.18 1.09 0.98 0.97 0.93
1A3a i (ii) International aviation cruise (civil) 2.01 2.86 4.36 5.48 5.85 5.99 5.89 5.76 5.90 6.11
1 A 5 b Other, Mobile (including military,
land based and recreational boats) 16.34 4.22 1.16 0.001 NA 0.002 0.002 0.06 0.06 0.12
68
3.7.4 QA/QC and Uncertainty
Data used for estimating emissions from the aviation sector derive from different sources: local airport
authorities, national airlines operators, EUROCONTROL and official statistics by different Ministries and
national authorities.
Different QA/QC and verification activities are carried out for this category.
As regards past years, the results of the national studies and methodologies, applied at national and airport
level, were shared with national experts in the framework of an ad hoc working group on air emissions
instituted by the National Aviation Authority (ENAC). The group, chaired by ISPRA, included participants
from ENAC, Ministry of Environment, Land and Sea, Ministry of Transport, national airlines and local
airport authorities. The results reflected differences between airports, aircrafts used and times in mode spent
for each operation.
Currently, verification and comparison activities regard activity data and emission factors. In particular,
number offlights have been compared considering different sources: ENAC, ASSAEROPORTI, ISTAT,
EUROCONTROL and verification activities have been performed on the basis of the updated
EUROCONTROL data onfuel consumption and emission factors resulting in an update and improving of the
national inventory.
Furthermore, there is an ongoing collaboration and data exchange with regional environmental agencies
on this issue.
3.7.5 Recalculations
Recalculations were performed in this submission, on the basis of the integration in the Italian inventory
of EUROCONTROL data time series, resulting in variations of the number of flights, consumption and
emission factors, with respect to previous submission.
3.7.6 Planned improvements
Improvements for next submissions are planned on the basis of the outcome of the ongoing quality
assurance and quality control activities, in particular with regard to the results of investigation about data and
information deriving from different sources, in particular further assessment of EUROCONTROL data, and
comparison with ISTAT information.

69
3.8 Road transport (NFR SUBSECTOR 1.A.3.b)
3.8.1 Overview
The road transport sector contributes to the total national emissions in 2015 as follows: nitrogen oxides
emissions for 51.7% of the total; emissions of carbon monoxide for 21.0%, non-methane volatile organic
compounds for 17.1%, PM10 and PM2.5, for 12.2% and 11.3%, respectively, of the total.
The estimation refers to the following vehicle categories:
1.A.3.b.i Passenger cars
1.A.3.b.ii Light-duty trucks
1.A.3.b.iii Heavy-duty vehicles including buses
1.A.3.b.iv Mopeds and motorcycles
1.A.3.b.v Gasoline evaporation
1.A.3.b.vi Road vehicle tyre and brake wear
Emissions from road surface wear (code: 1.A.3.b.vii) are at present not estimated. Although emission
factors are available on the EMEP/EEA Guidebook they have been not included in the COPERT model
because considered not sufficiently reliable.
3.8.2 Methodological issues
A national methodology has been developed and applied to estimate emissions according to the IPCC
Guidelines and Good Practice Guidance (IPCC, 1997; IPCC, 2000; IPCC, 2006) and the EMEP/EEA
Guidebook (EMEP/EEA, 2016).
In general, the annual update of the model is based on the availability of new measurements and studies
regarding road transport emissions (for further information see: http://www.emisia.com/copert/).
The updated version 11.4 of the model COPERT 4 (EMISIA SA, 2016) has been used for the whole time
series (except for natural gas passenger cars detailed categories, differentiated for technology and for engine
capacity classes <1.4 l, 1.4 2 l, >2 l, for which a customized database has been used to correctly reproduce
the features of the Italian fleet).
COPERT 4 version 11.4 introduces the following upgrades respect to the previous version 11.3 used
(http://emisia.com/products/copert/versions):
- New PC Euro 6 2020+ and LDV Euro 6 2021+ vehicle category;
- Updated NOx emission factors for PC Diesel & LDV Diesel, Euro6 and on;
- PC Diesel post Euro 6;
- LDV Diesel post Euro 5.
The model, on the basis of the inputs inserted, gives output results separately for vehicles category and
urban, rural, highway areas, concerning emission estimates of CO, VOC, NMVOC, CH4, NOX, N2O, NH3,
PM2.5, PM10, PM exhaust (the emission factors of particulate matter from combustion refer to particles
smaller than 2.5 µm, that implicitly assumes that the fraction of particulate matter with diameter between 2.5
µm and 10 µm is negligible), CO2, SO2, heavy metals, NOX speciation in NO e NO2, the speciation in
elemental and organic carbon of PM, the speciation of NMVOC.
Resulting national emission factors at detailed level are available on the following public web address:
http://www.sinanet.isprambiente.it/it/sia-ispra/fetransp .
Data on fuel consumption of gasoline, diesel, liquefied petroleum gas (LPG), natural gas (CNG) and

70
biofuels are those reported in the national energy balance (MSE, several years); in 2017 consumption data
have been updated according to EUROSTAT energy balance, published on the MSE website
(http://dgsaie.mise.gov.it/dgerm/ben.asp).
Time series of consumptions, by fuel and vehicle categories, are detailed in the NFR.
3.8.2.1 Exhaust emissions
Exhaust emissions from vehicles subsectors are split between cold and hot emissions; estimates are
calculated either on the basis of a combination of total fuel consumption and fuel properties data or on the
basis of a combination of drive related emission factors and road traffic data.
The calculation of emissions is based on emission factors calculated for the vehicle models most widely
and systematically used, distinguishing between the type of vehicle, fuel, engine size or weight class,
standard legislation. The legislative standards introduced become more stringent over the years, ensuring that
new vehicles emit much less than the older ones as regards the regulated pollutants.
With reference to four groups of pollutants, the method of calculation of exhaust emissions is different.
The methodology implemented is derived from the EMEP/EEA Emission Inventory Guidebook 2016
(EMEP/EEA, 2016).
As regards the first two groups, methods are used leading to high standard detailed emissions data.
The first group includes: CO, NOX, VOC, CH4, NMVOC, N2O, NH3 and PM. For these pollutants,
specific emission factors are applied relating to different engine conditions and urban, rural and highway
driving shares.
The second group includes: CO2, SO2, Pb, Cd, Cr, Cu, Ni, Se, Zn. The emissions of these pollutants are
estimated on the basis of fuel consumption.
For the third group of pollutants, including PAHs and PCDDs and PCDFs, detailed data are not available
and then a simplified methodology is applied.
Finally the fourth group includes pollutants (alkanes, alkenes, alkynes, aldehydes, ketones, cycloalkanes
and aromatic compounds) obtained as a fraction of the total emissions of NMVOC, assuming that the
fraction of residual NMVOC are PAHs.
Because of the availability in Italy of an extensive and accurate database, a detailed methodology is
implemented in the model COPERT 4. Total emissions are calculated as the sum of hot emissions, deriving
from the engine when it reaches a hot temperature, and cold emissions produced during the heating process.
The different methodological approach is justified by the performance of vehicles in the two different
phases.
The production of emissions is also closely linked to the driving mode, differentiating for activity data
and emission factors, with reference to urban (where it is assumed that almost all cold emissions are
produced), rural and highway shares. Several factors contribute to the production of hot emissions such as
mileage, speed, type of road, vehicle age, engine capacity and weight. Cold emissions are mainly attributed
to urban share, and are attributed only to passenger cars and light duty vehicles. Varying according to the
weather conditions and driving behaviour, are related to the specific country.
Emissions of NMVOC, NOX, CO and PM are calculated on the basis of emission factors expressed in
grams per kilometre and road traffic statistics estimated by ISPRA on account of data released from Ministry
of Transport, ACI and ANCMA (several years). The emission factors are based on experimental
measurements of emissions from in-service vehicles of different types driven under test cycles with different
average speeds calculated from the emission functions and speed-coefficients provided by COPERT 4
(EMISIA SA, 2016). This source provides emission functions and coefficients relating emission factors (in
g/km) to average speed for each vehicle type and Euro emission standard derived by fitting experimental
measurements to polynomial functions. These functions were then used to calculate emission factor values
for each vehicle type and Euro emission standard at each of the average speeds of road and area types.
As regards the speciation of PM into elemental (EC, assumed to be equal to black carbon for road
transport) and organic carbon (OC), considering the organic material (OM) as the mass of organic carbon
corrected for the hydrogen content of the compounds collected, since the estimates are based on the

71
assumption that low-sulphur fuels are used, when advanced aftertreatments are used, EC and OM does not
add up to 100%, assuming that the remaining fraction consists of ash, nitrates, sulphates, water and
ammonium salts (EMEP/EEA 2016).
Emissions of fuel dependent pollutants have been estimated applying a different approach.
Data on consumption of various fuels are derived from official statistics aggregated at national level and
then estimated in the detail of vehicle categories, emission regulation and road type in Italy. The resulting
error of approximation deriving from the comparison between the calculated value and the statistical value of
the total fuel consumption, is corrected by applying a normalisation procedure to the breakdown of fuel
consumption by each vehicle type calculated on the basis of the fuel consumption factors added up, with
reference to the BEN figures for total fuel consumption in Italy (adjusted for off-road consumption).
The 1990-2015 inventory used fuel consumption factors expressed as grams of fuel per kilometre for each
vehicle type and average speed calculated from the emission functions and speed-coefficients provided by
the model COPERT 4, version 11.4. Emissions of sulphur dioxide and heavy metals are calculated applying
specific factors to consumption of gasoline, diesel, liquefied petroleum gas (LPG) and natural gas (CNG),
taken from the BEN (MSE, several years (a)), updated in 2017 according to EUROSTAT methodology
(http://dgsaie.mise.gov.it/dgerm/ben.asp).
Emissions of SO2 are based on the sulphur content of the fuel. Values for SO2 vary annually as the
sulphur-content of fuels change and are calculated every year for gasoline and gas oil and officially
communicated to the European Commission in the framework of the European Directives on fuel quality;
these figures are also published by the refineries industrial association (UP, several years).
Emissions of heavy metals are estimated on the basis of data regarding the fuel and lubricant content and
the engine wear; as reported in the EMEP/EEA Emission Inventory Guidebook 2016, these apparent fuel
metal content factors originate from the work of Winther and Slentø, 2010, and have been reviewed by the
TFEIP expert panel in transport and because of the scarce available information, the uncertainty in the
estimate of these values is still considered quite high.
3.8.2.2 Evaporative emissions
As regards NMVOC, the share of evaporative emissions is provided. These emissions are calculated only
for gasoline vehicles: passenger cars, light duty vehicles, mopeds and motorcycles. Depending on
temperature and vapour pressure of fuel, evaporative emissions have shown a growth over the years,
nevertheless recently the contribution has been reduced by the introduction of control systems such as the
canister. The estimation procedure is differentiated according to the processes of diurnal emission, running
losses and hot soak emissions (EMEP/EEA, 2016).
3.8.2.3 Emissions from tyre and brake wear
Not exhaust PM emissions from road vehicle tyre and brake wear are estimated (road wear is at present
not included in the estimation model). The focus is on the primary particles, deriving directly from tyre and
brake wear. The material produced by the effects of wear and attrition between surfaces is subject to
evaporation at high temperatures developed by the contact.
Emissions are influenced by, as regards tyres, composition and pressure of tyres, structure and
characteristics of vehicles, the peculiarities of the road and, as regards brakes, by the composition of the
materials of the components, the position, the configuration systems, and the mechanisms of actuation
(EMEP/EEA, 2016).
3.8.3 Activity data
The road traffic data used are vehicle-kilometre estimates for the different vehicle types and different road
classifications in the national road network. These data have to be further broken down by composition of
each vehicle fleet in terms of the fraction of different fuels types powered vehicles on the road and in terms
of the fraction of vehicles on the road set by the different emission regulations which applied when the
72
vehicle was first registered. These are related to the age profile of the vehicle fleet.
Basic data derive from different sources. Detailed data on the national fleet composition are found in the
yearly report from ACI (ACI, several years), used from 1990 to 2006, except for mopeds for which estimates
have been elaborated on the basis of National Association of Cycle-Motorcycle Accessories data on mopeds
fleet composition and mileages (ANCMA, several years). ANCMA data have been used up to 2011; since
2012 MIT mopeds fleet data have been used, because starting from 2012, mopeds are estimated to be all
registered.
The Ministry of Transport (MIT) provides specific fleet composition data for all vehicle categories from
2007 onwards, starting from 2013 submission. The Ministry of Transport in the national transport yearbook
(MIT, several years) reports mileages time series. Furthermore since 2015 MIT supplies information relating
the distribution of old gasoline cars over the detailed vehicles categories (PRE ECE; ECE 15/00-01; ECE
15/02; ECE 15/03; ECE 15/04; information obtained from the registration year; data used for the updating of
the time series since 2007). MIT data are used relating to: the passenger cars (the categories of “E85” and
“Hybrid Gasoline” passenger cars are introduced from 2007 onwards, the detailed “Gasoline < 0.8 l”
passenger cars subsector is introduced since 2012 and “Diesel<1.4 l” subsector since 2007 onwards, in
addition to the gasoline, diesel, LPG, CNG traditional ones); the diesel and gasoline light commercial
vehicles; the breakdown of the heavy duty trucks, buses and coaches fleet according to the different weight
classes and fuels (diesel almost exclusively for HDT, a negligible share consists of gasoline vehicles; diesel
for coaches; diesel and CNG for buses); the motorcycles fleet in the detail of subsector and legislation
standard of both 2-stroke and 4-stroke categories. Fleet values for mopeds are updated according to the
revisions of data published by ANCMA; fleet values for diesel buses are updated according to the updating
of the data on urban public buses, published on CNIT.
The National Institute of Statistics carries out annually a survey on heavy goods vehicles, including
annual mileages (ISTAT, several years).
The National Association of concessionaries of motorways and tunnels produces monthly statistics on
highway mileages by light and heavy vehicles (AISCAT, several years).
The National General Confederation of Transport and Logistics (CONFETRA, several years) and the
national Central Committee of road transporters (Giordano, 2007) supplied useful information and statistics
about heavy goods vehicles fleet composition and mileages.
Fuel consumption data derive basically from the National Energy Balance (MSE, several years (a));
supplementary information is taken from the Oil Bulletin (MSE, several years (b)) and from the statistics
published by the Association of Oil Companies (UP, several years). As regards biofuels, the consumption
has increased in view of the targets to be respected by Italy and set in the framework of the European
directive 20-20-20. The trend of biodiesel is explained by the fact that this biofuel has been tested since 1994
to 1996 before entering in production since 1998. The consumption of bioethanol, related to E85 passenger
cars category, is introduced since 2008, according to data resulting on the BEN.
Emissions are calculated from vehicles of the following types:
Gasoline passenger cars;
Diesel passenger cars;
LPG passenger cars;
CNG passenger cars;
E85 passenger cars;
Hybrid Gasoline passenger cars;
Gasoline Light Goods Vehicles (Gross Vehicle Weight (GVW) <= 3.5 tonnes);
Diesel Light Goods Vehicles (Gross Vehicle Weight (GVW) <= 3.5 tonnes);
Rigid-axle Heavy Goods Vehicles (GVW > 3.5 tonnes);
Articulated Heavy Goods Vehicles (GVW > 3.5 tonnes);
Diesel Buses and coaches;
CNG Buses;
Mopeds and motorcycles.

73
In Table 3.10 the historical series of annual consumption data (Mg) for the different fuel types is reported.
Table 3.10 Annual fuel consumption data (Mg)
Fuel 1990 1995 2000 2005 2010 2011 2012 2013 2014 2015
Gasoline Leaded 12280212 10112250 4542113 0 0 0 0 0 0 0
Gasoline Unleaded 639115 7060391 12175814 13482132 9806890 9467995 8377986 8014000 8103811 7809940
Diesel 15278022 14445441 17059010 22327864 21557266 21806853 20768959 20255549 21704506 21128587
LPG 1342000 1478000 1422000 1029000 1214000 1267000 1350000 1537000 1564000 1654000
CNG 182656 215573 293799 341876 610015 629433 664107 710151 757400 786518
Biodiesel 0 44491 64723 173709 1275023 1264601 1241150 1156033 1037042 1122160
Bioethanol 0 0 0 0 142106 132750 123428 87178 12039 30420
Source: ISPRA elaborations on BEN, BP, UP data
The final reports on the physic-chemical characterization of fossil fuels used in Italy, carried out by the
Fuel Experimental Station, that is an Italian Institute operating in the framework of the Department of
Industry, are used with the aim to improve fuel quality specifications (surveys conducted in 2000 and in
2012 – 2013). Fuel information has also been updated for the entire time series on the basis of the annual
reports published by ISPRA about the fuel quality in Italy.
Fuel information has been updated also as regards country specific fuel consumption factors for gasoline
and diesel passenger cars on the basis of the results published by the European Environmental Agency in the
report “Monitoring CO2 emissions from new passenger cars and vans in 2015” (EEA, several years).
A normalisation procedure is applied to ensure that the breakdown of fuel consumption by each vehicle
type calculated on the basis of the fuel consumption factors then added up matches the BEN figures for total
fuel consumption in Italy (adjusted for off-road consumption).
In COPERT a simulation process is started up having the target to equalize calculated and statistical
consumptions, separately for fuel (gasoline including bioethanol, diesel including biodiesel, LPG and CNG)
at national level, with the aim to obtain final estimates the most accurate as possible. Once all data and input
parameters have been inserted and all options have been set reflecting the peculiar situation of the Country,
emissions and consumptions are calculated by the model in the detail of the vehicle category legislation
standard; then the aggregated consumption values so calculated are compared with the input statistical
national aggregated values (deriving basically from the National Energy Balance, as described above) and a
percentage deviation is calculated.
On the basis of the obtained deviation value, a process of refinement of the estimates is performed by
acting on control variables such as speeds and mileages. These variables values are changed according to the
constraints on the national average variability ranges (identified on the basis of the official data and
information on the fleet peculiarities, described in this chapter). As a result of sequential refinements on
input data in the detail of vehicle category legislation standard, the estimation process is repeated until the
achievement of the deviation value 0.00% as minimum target, assumed as goodness of fit to the “true” BEN
statistical value.
The results of the fuel balance process for the year 2015 in Italy, obtained from the application of the
model COPERT 4, are shown in the following table 3.11.
Table 3.11 Fuel balance results for Italy, year 2015
Fuel Statistical (t) Calculated (t) Deviation (%)
Gasoline (fossil & bio) 7,840,360.00 7,840,360.64 0.0000%
Diesel (fossil & bio) 22,250,746.62 22,250,740.63 0.0000%
LPG 1,654,000.00 1,654,000.30 0.0000%
CNG 786,518.00 786,518.38 0.0000%
Source: ISPRA elaborations by Copert model

74
In the following Tables 3.12, 3.13, 3.14 and 3.15 detailed data on the relevant vehicle mileages in the
circulating fleet are reported, subdivided according to the main emission regulations (ISPRA elaborations on
ACI, ANCMA and MIT data).
Table 3.12 Passenger Cars technological evolution: circulating fleet calculated as stock data multiplied by actual
mileage (%)
1990 1995 2000 2005 2010 2011 2012 2013 2014 2015
PRE ECE, pre-1973 0.05 0.03 0.01 0.01 0.002 0.002 0.003 0.002 0.002 0.002
ECE 15/00-01, 1973-1978 0.11 0.04 0.01 0.004 0.003 0.003 0.003 0.003 0.003 0.003
ECE 15/02-03, 1978-1984 0.32 0.15 0.03 0.01 0.01 0.008 0.009 0.008 0.007 0.007
ECE 15/04, 1985-1992 0.53 0.56 0.28 0.10 0.04 0.03 0.03 0.03 0.03 0.03
PC Euro 1 - 91/441/EEC, from 1/1/93 0.001 0.23 0.27 0.17 0.05 0.04 0.03 0.03 0.02 0.02
PC Euro 2 - 94/12/EEC, from 1/1/97 - - 0.39 0.32 0.22 0.19 0.15 0.15 0.13 0.12
PC Euro 3 - 98/69/EC Stage2000, from 1/1/2001 - - - 0.31 0.19 0.18 0.18 0.14 0.13 0.13
PC Euro 4 - 98/69/EC Stage2005, from 1/1/2006 - - - 0.09 0.44 0.43 0.45 0.45 0.43 0.43
PC Euro 5 - EC 715/2007, from 1/1/2011 - - - - 0.04 0.11 0.14 0.19 0.23 0.21
PC Euro 6 - EC 715/2007, from 9/1/2015 - - - - - 0.0000001 0.0003 0.003 0.02 0.06
Total 1.00 1.00 1.00 1.00 1.00 1.00 1.00 1.00 1.00 1.00
a. Gasoline cars technological evolution
1990 1995 2000 2005 2010 2011 2012 2013 2014 2015
Conventional, pre-1993 1.00 0.92 0.34 0.06 0.01 0.01 0.01 0.01 0.00 0.00
PC Euro 1 - 91/441/EEC, from 1/1/93 - 0.08 0.10 0.03 0.01 0.01 0.01 0.00 0.00 0.00
PC Euro 2 - 94/12/EEC, from 1/1/97 - - 0.56 0.22 0.05 0.03 0.03 0.03 0.03 0.02
PC Euro 3 - 98/69/EC Stage2000, from 1/1/2001 - - - 0.56 0.31 0.25 0.23 0.21 0.20 0.18
PC Euro 4 - 98/69/EC Stage2005, from 1/1/2006 - - - 0.12 0.55 0.53 0.51 0.48 0.44 0.42
PC Euro 5 - EC 715/2007, from 1/1/2011 - - - - 0.07 0.17 0.22 0.27 0.32 0.33
PC Euro 6 - EC 715/2007, from 9/1/2015 - - - - 0.0001 0.0003 0.0007 0.002 0.009 0.040
Total 1.00 1.00 1.00 1.00 1.00 1.00 1.00 1.00 1.00 1.00
b. Diesel cars technological evolution
1990 1995 2000 2005 2010 2011 2012 2013 2014 2015
Conventional, pre-1993 1.00 0.90 0.71 0.47 0.04 0.03 0.02 0.02 0.02 0.01
PC Euro 1 - 91/441/EEC, from 1/1/93 - 0.10 0.20 0.26 0.03 0.03 0.02 0.02 0.01 0.01
PC Euro 2 - 94/12/EEC, from 1/1/97 - - 0.09 0.19 0.08 0.11 0.08 0.07 0.04 0.03
PC Euro 3 - 98/69/EC Stage2000, from 1/1/2001 - - - 0.06 0.08 0.10 0.07 0.07 0.05 0.05
PC Euro 4 - 98/69/EC Stage2005, from 1/1/2006 - - - 0.01 0.75 0.66 0.60 0.55 0.51 0.45
PC Euro 5 - EC 715/2007, from 1/1/2011 - - - - 0.03 0.07 0.20 0.28 0.35 0.36
PC Euro 6 - EC 715/2007, from 9/1/2015 - - - - - - 0.0001 0.0007 0.03 0.08
Total 1.00 1.00 1.00 1.00 1.00 1.00 1.00 1.00 1.00 1.00
c. Lpg cars technological evolution
1990 1995 2000 2005 2010 2011 2012 2013 2014 2015
Conventional, pre-1993 1.00 0.89 0.54 0.24 0.01 0.01 0.01 0.01 0.01 0.01
PC Euro 1 - 91/441/EEC, from 1/1/93 - 0.11 0.24 0.22 0.02 0.02 0.01 0.01 0.01 0.01
PC Euro 2 - 94/12/EEC, from 1/1/97 - - 0.22 0.27 0.15 0.10 0.08 0.07 0.04 0.03
PC Euro 3 - 98/69/EC Stage2000, from 1/1/2001 - - - 0.21 0.12 0.12 0.12 0.08 0.08 0.06
PC Euro 4 - 98/69/EC Stage2005, from 1/1/2006 - - - 0.06 0.59 0.59 0.54 0.51 0.46 0.41
PC Euro 5 - EC 715/2007, from 1/1/2011 - - - - 0.10 0.16 0.23 0.32 0.37 0.37
PC Euro 6 - EC 715/2007, from 9/1/2015 - - - - - - 0.00001 0.0001 0.04 0.11
Total 1.00 1.00 1.00 1.00 1.00 1.00 1.00 1.00 1.00 1.00
d. CNG cars technological evolution

75
2008 2009 2010 2011 2012 2013 2014 2015
PC Euro 4 - 98/69/EC Stage2005, from 1/1/2006 1.00 1.00 0.88 0.68 0.54 0.54 0.52 0.53
PC Euro 5 - EC 715/2007, from 1/1/2011 - - 0.12 0.32 0.46 0.46 0.47 0.47
PC Euro 6 - EC 715/2007, from 9/1/2015 - - - - - - 0.00 0.01
Total
1.00 1.00 1.00 1.00 1.00 1.00 1.00 1.00
e. E85 cars technological evolution (from 2008 onwards)
2007 2008 2009 2010 2011 2012 2013 2014 2015
PC Euro 4 - 98/69/EC Stage2005, from 1/1/2006 1.00 1.00 0.65 0.54 0.43 0.35 0.23 0.15 0.22
PC Euro 5 - EC 715/2007, from 1/1/2011 - - 0.35 0.46 0.57 0.64 0.77 0.77 0.61
PC Euro 6 - EC 715/2007, from 9/1/2015 - - - - - 0.01 0.001 0.08 0.16
Total
1.00 1.00 1.00 1.00 1.00 1.00 1.00 1.00 1.00
f. Hybrid Gasoline cars technological evolution (from 2007 onwards)
Source: ISPRA elaborations on MIT and ACI data
Table 3.13 Light Duty Vehicles technological evolution: circulating fleet calculated as stock data multiplied by actual
mileage (%)
1990 1995 2000 2005 2010 2011 2012 2013 2014 2015
Conventional, pre 10/1/94 1.00 0.93 0.63 0.35 0.08 0.07 0.07 0.05 0.05 0.05
LD Euro 1 - 93/59/EEC, from 10/1/94 - 0.07 0.22 0.17 0.11 0.08 0.08 0.06 0.06 0.05
LD Euro 2 - 96/69/EEC, from 10/1/98 - - 0.15 0.15 0.30 0.23 0.22 0.22 0.21 0.20
LD Euro 3 - 98/69/EC Stage2000, from 1/1/2002 - - - 0.31 0.26 0.23 0.22 0.20 0.20 0.19
LD Euro 4 - 98/69/EC Stage2005, from 1/1/2007 - - - 0.01 0.25 0.30 0.29 0.31 0.30 0.31
LD Euro 5 - 2008 Standards 715/2007/EC, from
1/1/2012 - - - - 0.004 0.10 0.13 0.16 0.18 0.19
LD Euro 6 - - - - - - - 0.00 0.005 0.01
Total 1.00 1.00 1.00 1.00 1.00 1.00 1.00 1.00 1.00 1.00
a. Gasoline Light Duty Vehicles technological evolution
1990 1995 2000 2005 2010 2011 2012 2013 2014 2015
Conventional, pre 10/1/94 1.00 0.93 0.60 0.28 0.08 0.08 0.04 0.02 0.02 0.02
LD Euro 1 - 93/59/EEC, from 10/1/94 - 0.07 0.21 0.13 0.07 0.07 0.05 0.05 0.05 0.04
LD Euro 2 - 96/69/EEC, from 10/1/98 - - 0.19 0.18 0.23 0.21 0.19 0.15 0.14 0.14
LD Euro 3 - 98/69/EC Stage2000, from 1/1/2002 - - - 0.39 0.33 0.32 0.33 0.33 0.33 0.23
LD Euro 4 - 98/69/EC Stage2005, from 1/1/2007 - - - 0.01 0.28 0.29 0.32 0.34 0.32 0.35
LD Euro 5 - 2008 Standards 715/2007/EC, from
1/1/2012 - - - - 0.01 0.03 0.06 0.11 0.15 0.21
LD Euro 6 - - - - 0.0000003 0.0000003 0.000007 0.00003 0.0003 0.005
Total 1.00 1.00 1.00 1.00 1.00 1.00 1.00 1.00 1.00 1.00
b. Diesel Light Duty Vehicles technological evolution
Source: ISPRA elaborations on MIT and ACI data
Table 3.14 Heavy Duty Trucks and Buses technological evolution: circulating fleet calculated as stock data multiplied
by actual mileage (%)
1990 1995 2000 2005 2010 2011 2012 2013 2014 2015
Conventional, pre 10/1/93 1.00 0.90 0.68 0.40 0.19 0.18 0.16 0.12 0.12 0.11
HD Euro I - 91/542/EEC Stage I, from
10/1/93 - 0.10 0.10 0.06 0.05 0.05 0.05 0.05 0.04 0.04
HD Euro II - 91/542/EEC Stage II, from
10/1/96 - - 0.22 0.27 0.22 0.21 0.20 0.20 0.19 0.18
HD Euro III - 2000 Standards, 99/96/EC,
from 10/1/2001 - - - 0.27 0.34 0.33 0.33 0.33 0.33 0.32
HD Euro IV - 2005 Standards,
99/96/EC, from 10/1/2006 - - - - 0.06 0.06 0.06 0.06 0.06 0.06
HD Euro V - 2008 Standards, 99/96/EC,
from 10/1/2009 - - - - 0.14 0.17 0.20 0.23 0.24 0.24
HD Euro VI – EC 595/2009, from - - - - - - 0.00002 0.002 0.02 0.04
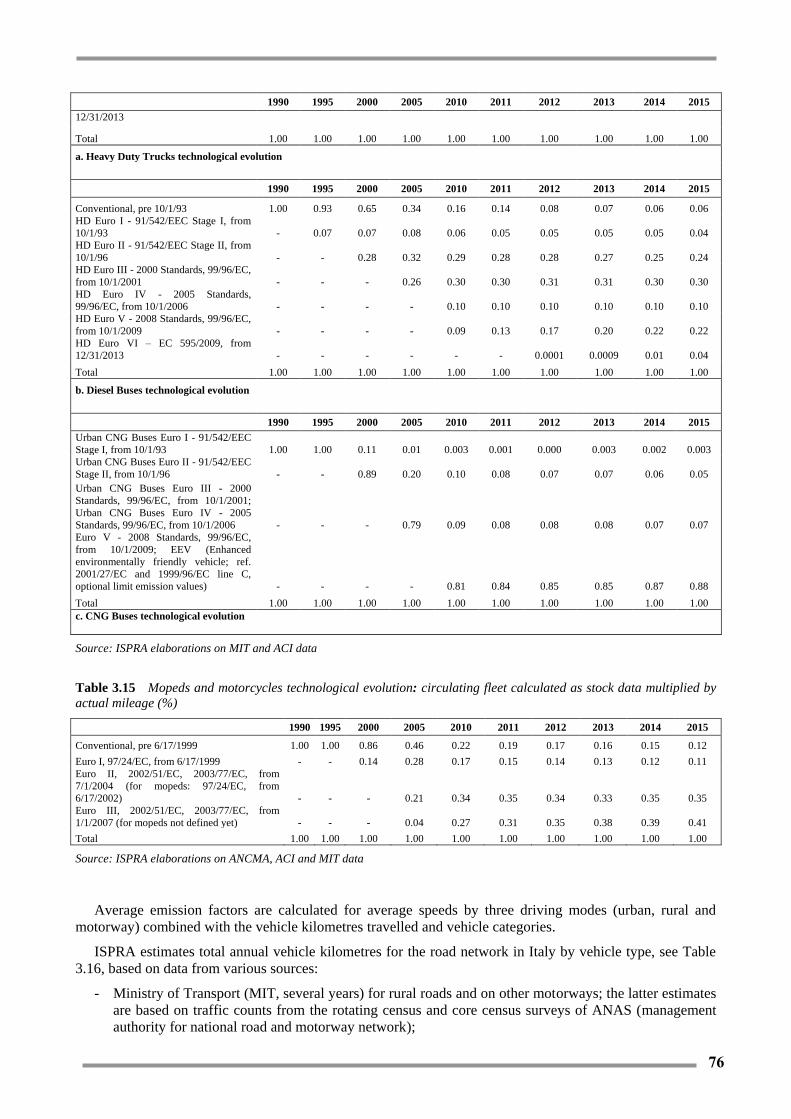
76
1990 1995 2000 2005 2010 2011 2012 2013 2014 2015
12/31/2013
Total 1.00 1.00 1.00 1.00 1.00 1.00 1.00 1.00 1.00 1.00
a. Heavy Duty Trucks technological evolution
1990 1995 2000 2005 2010 2011 2012 2013 2014 2015
Conventional, pre 10/1/93 1.00 0.93 0.65 0.34 0.16 0.14 0.08 0.07 0.06 0.06
HD Euro I - 91/542/EEC Stage I, from
10/1/93 - 0.07 0.07 0.08 0.06 0.05 0.05 0.05 0.05 0.04
HD Euro II - 91/542/EEC Stage II, from
10/1/96 - - 0.28 0.32 0.29 0.28 0.28 0.27 0.25 0.24
HD Euro III - 2000 Standards, 99/96/EC,
from 10/1/2001 - - - 0.26 0.30 0.30 0.31 0.31 0.30 0.30
HD Euro IV - 2005 Standards,
99/96/EC, from 10/1/2006 - - - - 0.10 0.10 0.10 0.10 0.10 0.10
HD Euro V - 2008 Standards, 99/96/EC,
from 10/1/2009 - - - - 0.09 0.13 0.17 0.20 0.22 0.22
HD Euro VI – EC 595/2009, from
12/31/2013 - - - - - - 0.0001 0.0009 0.01 0.04
Total 1.00 1.00 1.00 1.00 1.00 1.00 1.00 1.00 1.00 1.00
b. Diesel Buses technological evolution
1990 1995 2000 2005 2010 2011 2012 2013 2014 2015
Urban CNG Buses Euro I - 91/542/EEC
Stage I, from 10/1/93 1.00 1.00 0.11 0.01 0.003 0.001 0.000 0.003 0.002 0.003
Urban CNG Buses Euro II - 91/542/EEC
Stage II, from 10/1/96 - - 0.89 0.20 0.10 0.08 0.07 0.07 0.06 0.05
Urban CNG Buses Euro III - 2000
Standards, 99/96/EC, from 10/1/2001;
Urban CNG Buses Euro IV - 2005
Standards, 99/96/EC, from 10/1/2006 - - - 0.79 0.09 0.08 0.08 0.08 0.07 0.07
Euro V - 2008 Standards, 99/96/EC,
from 10/1/2009; EEV (Enhanced
environmentally friendly vehicle; ref.
2001/27/EC and 1999/96/EC line C,
optional limit emission values) - - - - 0.81 0.84 0.85 0.85 0.87 0.88
Total 1.00 1.00 1.00 1.00 1.00 1.00 1.00 1.00 1.00 1.00
c. CNG Buses technological evolution
Source: ISPRA elaborations on MIT and ACI data
Table 3.15 Mopeds and motorcycles technological evolution: circulating fleet calculated as stock data multiplied by
actual mileage (%)
1990 1995 2000 2005 2010 2011 2012 2013 2014 2015
Conventional, pre 6/17/1999 1.00 1.00 0.86 0.46 0.22 0.19 0.17 0.16 0.15 0.12
Euro I, 97/24/EC, from 6/17/1999 - - 0.14 0.28 0.17 0.15 0.14 0.13 0.12 0.11
Euro II, 2002/51/EC, 2003/77/EC, from
7/1/2004 (for mopeds: 97/24/EC, from
6/17/2002) - - - 0.21 0.34 0.35 0.34 0.33 0.35 0.35
Euro III, 2002/51/EC, 2003/77/EC, from
1/1/2007 (for mopeds not defined yet) - - - 0.04 0.27 0.31 0.35 0.38 0.39 0.41
Total 1.00 1.00 1.00 1.00 1.00 1.00 1.00 1.00 1.00 1.00
Source: ISPRA elaborations on ANCMA, ACI and MIT data
Average emission factors are calculated for average speeds by three driving modes (urban, rural and
motorway) combined with the vehicle kilometres travelled and vehicle categories.
ISPRA estimates total annual vehicle kilometres for the road network in Italy by vehicle type, see Table
3.16, based on data from various sources:
- Ministry of Transport (MIT, several years) for rural roads and on other motorways; the latter estimates
are based on traffic counts from the rotating census and core census surveys of ANAS (management
authority for national road and motorway network);
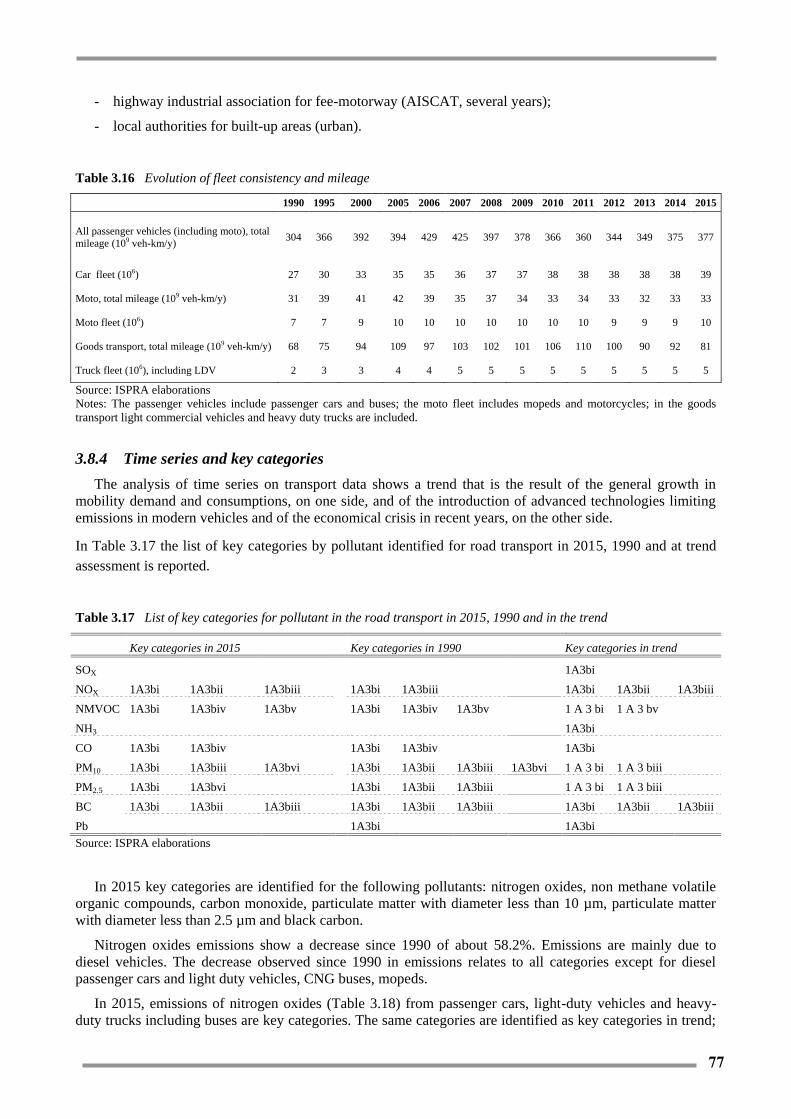
77
- highway industrial association for fee-motorway (AISCAT, several years);
- local authorities for built-up areas (urban).
Table 3.16 Evolution of fleet consistency and mileage
1990 1995 2000 2005 2006 2007 2008 2009 2010 2011 2012 2013 2014 2015
All passenger vehicles (including moto), total
mileage (109 veh-km/y) 304 366 392 394 429 425 397 378 366 360 344 349 375 377
Car fleet (106) 27 30 33 35 35 36 37 37 38 38 38 38 38 39
Moto, total mileage (109 veh-km/y) 31 39 41 42 39 35 37 34 33 34 33 32 33 33
Moto fleet (106) 7 7 9 10 10 10 10 10 10 10 9 9 9 10
Goods transport, total mileage (109 veh-km/y) 68 75 94 109 97 103 102 101 106 110 100 90 92 81
Truck fleet (106), including LDV 2 3 3 4 4 5 5 5 5 5 5 5 5 5
Source: ISPRA elaborations
Notes: The passenger vehicles include passenger cars and buses; the moto fleet includes mopeds and motorcycles; in the goods
transport light commercial vehicles and heavy duty trucks are included.
3.8.4 Time series and key categories
The analysis of time series on transport data shows a trend that is the result of the general growth in
mobility demand and consumptions, on one side, and of the introduction of advanced technologies limiting
emissions in modern vehicles and of the economical crisis in recent years, on the other side.
In Table 3.17 the list of key categories by pollutant identified for road transport in 2015, 1990 and at trend
assessment is reported.
Table 3.17 List of key categories for pollutant in the road transport in 2015, 1990 and in the trend
Key categories in 2015 Key categories in 1990 Key categories in trend
SOX 1A3bi
NOX 1A3bi 1A3bii 1A3biii
1A3bi 1A3biii 1A3bi 1A3bii 1A3biii
NMVOC 1A3bi 1A3biv 1A3bv
1A3bi 1A3biv 1A3bv
1 A 3 bi 1 A 3 bv
NH3 1A3bi
CO 1A3bi 1A3biv 1A3bi 1A3biv 1A3bi
PM10 1A3bi 1A3biii 1A3bvi
1A3bi 1A3bii 1A3biii 1A3bvi 1 A 3 bi 1 A 3 biii
PM2.5 1A3bi 1A3bvi 1A3bi 1A3bii 1A3biii 1 A 3 bi 1 A 3 biii
BC 1A3bi 1A3bii 1A3biii
1A3bi 1A3bii 1A3biii
1A3bi 1A3bii 1A3biii
Pb 1A3bi 1A3bi
Source: ISPRA elaborations
In 2015 key categories are identified for the following pollutants: nitrogen oxides, non methane volatile
organic compounds, carbon monoxide, particulate matter with diameter less than 10 µm, particulate matter
with diameter less than 2.5 µm and black carbon.
Nitrogen oxides emissions show a decrease since 1990 of about 58.2%. Emissions are mainly due to
diesel vehicles. The decrease observed since 1990 in emissions relates to all categories except for diesel
passenger cars and light duty vehicles, CNG buses, mopeds.
In 2015, emissions of nitrogen oxides (Table 3.18) from passenger cars, light-duty vehicles and heavy-
duty trucks including buses are key categories. The same categories are identified as key categories in trend;
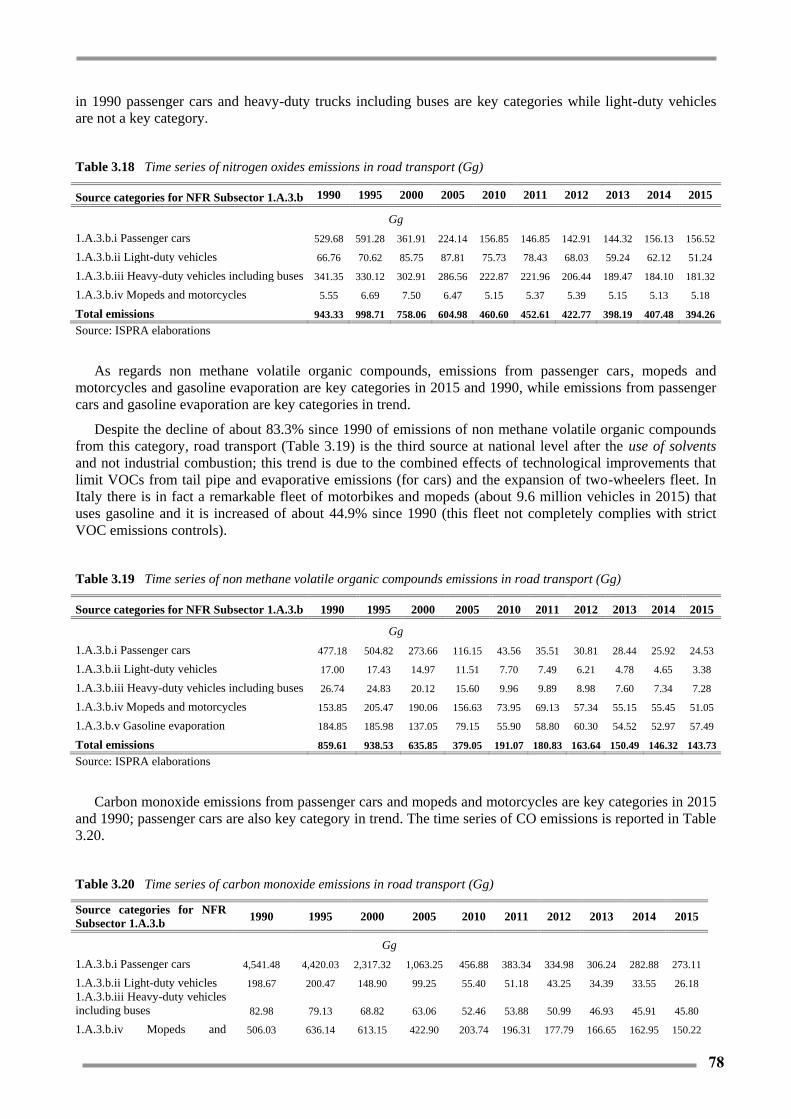
78
in 1990 passenger cars and heavy-duty trucks including buses are key categories while light-duty vehicles
are not a key category.
Table 3.18 Time series of nitrogen oxides emissions in road transport (Gg)
Source categories for NFR Subsector 1.A.3.b 1990 1995 2000 2005 2010 2011 2012 2013 2014 2015
Gg
1.A.3.b.i Passenger cars 529.68 591.28 361.91 224.14 156.85 146.85 142.91 144.32 156.13 156.52
1.A.3.b.ii Light-duty vehicles 66.76 70.62 85.75 87.81 75.73 78.43 68.03 59.24 62.12 51.24
1.A.3.b.iii Heavy-duty vehicles including buses 341.35 330.12 302.91 286.56 222.87 221.96 206.44 189.47 184.10 181.32
1.A.3.b.iv Mopeds and motorcycles 5.55 6.69 7.50 6.47 5.15 5.37 5.39 5.15 5.13 5.18
Total emissions 943.33 998.71 758.06 604.98 460.60 452.61 422.77 398.19 407.48 394.26
Source: ISPRA elaborations
As regards non methane volatile organic compounds, emissions from passenger cars, mopeds and
motorcycles and gasoline evaporation are key categories in 2015 and 1990, while emissions from passenger
cars and gasoline evaporation are key categories in trend.
Despite the decline of about 83.3% since 1990 of emissions of non methane volatile organic compounds
from this category, road transport (Table 3.19) is the third source at national level after the use of solvents
and not industrial combustion; this trend is due to the combined effects of technological improvements that
limit VOCs from tail pipe and evaporative emissions (for cars) and the expansion of two-wheelers fleet. In
Italy there is in fact a remarkable fleet of motorbikes and mopeds (about 9.6 million vehicles in 2015) that
uses gasoline and it is increased of about 44.9% since 1990 (this fleet not completely complies with strict
VOC emissions controls).
Table 3.19 Time series of non methane volatile organic compounds emissions in road transport (Gg)
Source categories for NFR Subsector 1.A.3.b 1990 1995 2000 2005 2010 2011 2012 2013 2014 2015
Gg
1.A.3.b.i Passenger cars 477.18 504.82 273.66 116.15 43.56 35.51 30.81 28.44 25.92 24.53
1.A.3.b.ii Light-duty vehicles 17.00 17.43 14.97 11.51 7.70 7.49 6.21 4.78 4.65 3.38
1.A.3.b.iii Heavy-duty vehicles including buses 26.74 24.83 20.12 15.60 9.96 9.89 8.98 7.60 7.34 7.28
1.A.3.b.iv Mopeds and motorcycles 153.85 205.47 190.06 156.63 73.95 69.13 57.34 55.15 55.45 51.05
1.A.3.b.v Gasoline evaporation 184.85 185.98 137.05 79.15 55.90 58.80 60.30 54.52 52.97 57.49
Total emissions 859.61 938.53 635.85 379.05 191.07 180.83 163.64 150.49 146.32 143.73
Source: ISPRA elaborations
Carbon monoxide emissions from passenger cars and mopeds and motorcycles are key categories in 2015
and 1990; passenger cars are also key category in trend. The time series of CO emissions is reported in Table
3.20.
Table 3.20 Time series of carbon monoxide emissions in road transport (Gg)
Source categories for NFR
Subsector 1.A.3.b 1990 1995 2000 2005 2010 2011 2012 2013 2014 2015
Gg
1.A.3.b.i Passenger cars 4,541.48 4,420.03 2,317.32 1,063.25 456.88 383.34 334.98 306.24 282.88 273.11
1.A.3.b.ii Light-duty vehicles 198.67 200.47 148.90 99.25 55.40 51.18 43.25 34.39 33.55 26.18
1.A.3.b.iii Heavy-duty vehicles
including buses 82.98 79.13 68.82 63.06 52.46 53.88 50.99 46.93 45.91 45.80
1.A.3.b.iv Mopeds and 506.03 636.14 613.15 422.90 203.74 196.31 177.79 166.65 162.95 150.22
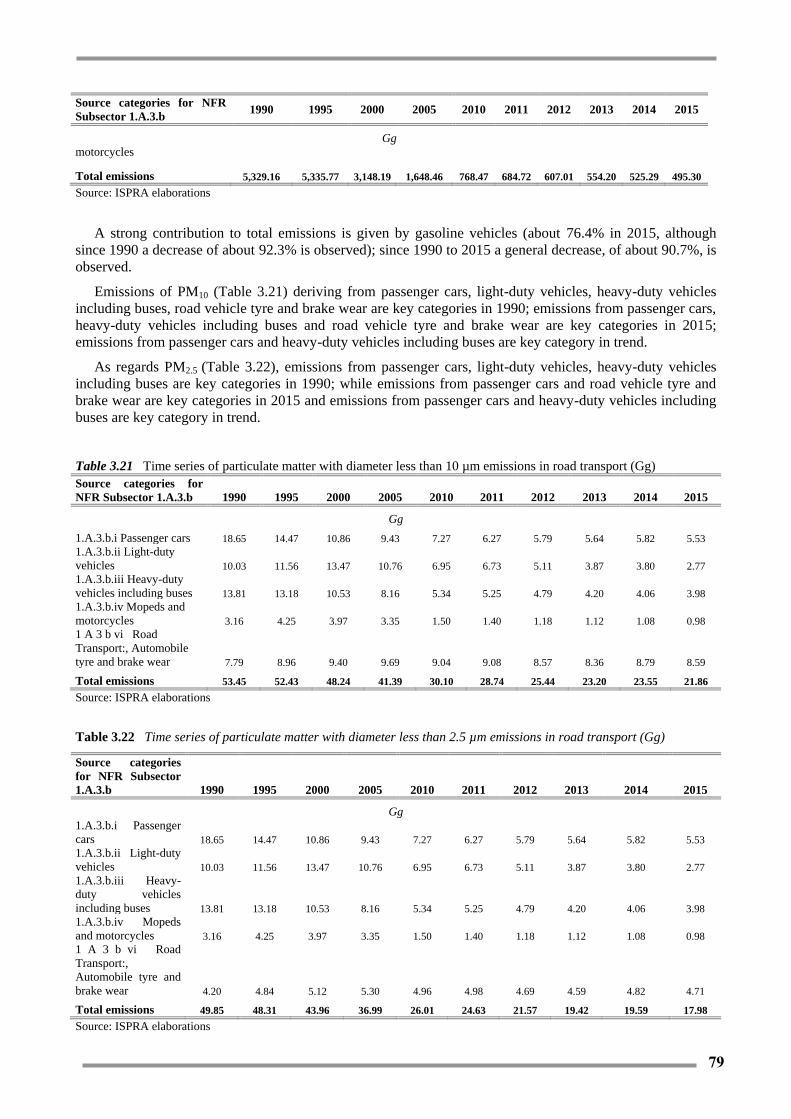
79
Source categories for NFR
Subsector 1.A.3.b 1990 1995 2000 2005 2010 2011 2012 2013 2014 2015
Gg
motorcycles
Total emissions 5,329.16 5,335.77 3,148.19 1,648.46 768.47 684.72 607.01 554.20 525.29 495.30
Source: ISPRA elaborations
A strong contribution to total emissions is given by gasoline vehicles (about 76.4% in 2015, although
since 1990 a decrease of about 92.3% is observed); since 1990 to 2015 a general decrease, of about 90.7%, is
observed.
Emissions of PM10 (Table 3.21) deriving from passenger cars, light-duty vehicles, heavy-duty vehicles
including buses, road vehicle tyre and brake wear are key categories in 1990; emissions from passenger cars,
heavy-duty vehicles including buses and road vehicle tyre and brake wear are key categories in 2015;
emissions from passenger cars and heavy-duty vehicles including buses are key category in trend.
As regards PM2.5 (Table 3.22), emissions from passenger cars, light-duty vehicles, heavy-duty vehicles
including buses are key categories in 1990; while emissions from passenger cars and road vehicle tyre and
brake wear are key categories in 2015 and emissions from passenger cars and heavy-duty vehicles including
buses are key category in trend.
Table 3.21 Time series of particulate matter with diameter less than 10 µm emissions in road transport (Gg)
Source categories for
NFR Subsector 1.A.3.b 1990 1995 2000 2005 2010 2011 2012 2013 2014 2015
Gg
1.A.3.b.i Passenger cars 18.65 14.47 10.86 9.43 7.27 6.27 5.79 5.64 5.82 5.53
1.A.3.b.ii Light-duty
vehicles 10.03 11.56 13.47 10.76 6.95 6.73 5.11 3.87 3.80 2.77
1.A.3.b.iii Heavy-duty
vehicles including buses 13.81 13.18 10.53 8.16 5.34 5.25 4.79 4.20 4.06 3.98
1.A.3.b.iv Mopeds and
motorcycles 3.16 4.25 3.97 3.35 1.50 1.40 1.18 1.12 1.08 0.98
1 A 3 b vi Road
Transport:, Automobile
tyre and brake wear 7.79 8.96 9.40 9.69 9.04 9.08 8.57 8.36 8.79 8.59
Total emissions 53.45 52.43 48.24 41.39 30.10 28.74 25.44 23.20 23.55 21.86
Source: ISPRA elaborations
Table 3.22 Time series of particulate matter with diameter less than 2.5 µm emissions in road transport (Gg)
Source categories
for NFR Subsector
1.A.3.b 1990 1995 2000 2005 2010 2011 2012 2013 2014 2015
Gg
1.A.3.b.i Passenger
cars 18.65 14.47 10.86 9.43 7.27 6.27 5.79 5.64 5.82 5.53
1.A.3.b.ii Light-duty
vehicles 10.03 11.56 13.47 10.76 6.95 6.73 5.11 3.87 3.80 2.77
1.A.3.b.iii Heavy-
duty vehicles
including buses 13.81 13.18 10.53 8.16 5.34 5.25 4.79 4.20 4.06 3.98
1.A.3.b.iv Mopeds
and motorcycles 3.16 4.25 3.97 3.35 1.50 1.40 1.18 1.12 1.08 0.98
1 A 3 b vi Road
Transport:,
Automobile tyre and
brake wear 4.20 4.84 5.12 5.30 4.96 4.98 4.69 4.59 4.82 4.71
Total emissions 49.85 48.31 43.96 36.99 26.01 24.63 21.57 19.42 19.59 17.98
Source: ISPRA elaborations

80
Emissions of particulate matter with diameter less than 10µm and less than 2.5µm show a decreasing
trend since 1990 respectively of about -59.1% and -63.9%; despite the decrease, diesel vehicles (passenger
cars, light duty vehicles and heavy duty trucks) are mainly responsible for road transport emissions giving a
strong contribution to total emissions, in 2015 about 82.4% and 85.3% out of the total for PM10 and PM2.5
respectively.
Emissions of black carbon are reported in Table 3.23. Emissions from passenger cars, light-duty vehicles
and heavy-duty trucks including buses are key categories in 1990, 2015 and in trend.
The emissions trend is generally decreasing (-59.6% since 1990). The main contribution to total
emissions is given by diesel vehicles, in 2015 equal to 97.8% out of the total. Despite of the decrease, road
transport is the main source of emissions at national level in 2015 (39.5%).
Table 3.23 Time series of black carbon emissions in road transport (Gg)
Source categories
for NFR Subsector
1.A.3.b 1990 1995 2000 2005 2010 2011 2012 2013 2014 2015
Gg
1.A.3.b.i Passenger
cars 10.04 7.77 6.57 6.97 5.88 5.05 4.67 4.54 4.67 4.42
1.A.3.b.ii Light-duty
vehicles 5.51 6.39 7.84 7.05 5.16 5.02 3.97 3.10 3.05 2.20
1.A.3.b.iii Heavy-
duty vehicles
including buses 6.91 6.73 5.59 4.66 3.27 3.24 2.98 2.67 2.58 2.53
1.A.3.b.iv Mopeds
and motorcycles 0.62 0.83 0.77 0.59 0.26 0.25 0.20 0.19 0.19 0.17
Total emissions 23.07 21.73 20.77 19.27 14.59 13.56 11.82 10.50 10.49 9.32
Source: ISPRA elaborations
Emissions of SOX, NH3 and Pb (Table 3.24) are not key categories in 2015, despite emissions Pb from
passenger cars are key categories in 1990 and emissions of SOX, NH3 and Pb from passenger cars are key
categories in trend. Emissions of these pollutants deriving from road transport are irrelevant in 2015,
compared to other sectors. Emissions of SOX and Pb show strong decreases (since 2002, Pb resulting
emissions are not exhaust), due to limits on fuels properties imposed by legislation. SOX emissions decrease
by 99.7%, representing 0.3% of the total in 2015. Emissions of Pb decrease of 99.7% and represent, in 2015,
4.3% of total national emissions. Emissions of NH3, despite the strong increase since 1990, in 2015 account
for just 1.6% out of the total.
Table 3.24 Time series of sulphur oxides, ammonia and lead emissions in road transport
SOX , NH3, Pb Total Emissions for
NFR Subsector 1.A.3.b 1990 1995 2000 2005 2010 2011 2012 2013 2014 2015
SOX (Gg) 129.66 71.70 11.93 2.21 0.43 0.43 0.43 0.42 0.43 0.37
NH3 (Gg) 0.73 5.14 20.16 14.87 9.23 8.51 7.10 6.78 6.42 6.18
Pb (Mg) 3,851.12 1,663.67 693.95 12.48 11.54 11.59 10.94 10.66 11.19 10.93
Source: ISPRA elaborations
3.8.5 QA/QC and Uncertainty
Data used for estimating emissions from the road transport sector, derive from different sources,
including official statistics providers and industrial associations.
A specific procedure undertaken for improving the inventory in the sector regards the establishment of a
national expert panel in road transport which involves, on a voluntary basis, different institutions, local

81
agencies and industrial associations cooperating for improving activity data and emission factors accuracy.
In this group emission estimates are presented annually and new methodologies are shared and discussed.
Reports and data of the meetings can be found at the following address:
http://groupware.sinanet.isprambiente.it/expert_panel/library.
Besides, time series resulting from the recalculation due to the application of COPERT 4 have been
discussed with national experts in the framework of an ad hoc working group on air emissions inventories.
The group is chaired by ISPRA and includes participants from the local authorities responsible for the
preparation of local inventories, sectoral experts, the Ministry of Environment, Land and Sea, and air quality
model experts. Recalculations are comparable with those resulting from application of the new model at
local level. Top-down and bottom-up approaches have been compared with the aim at identifying the major
problems and future possible improvements in the methodology to be addressed.
A Montecarlo analysis has been carried out by EMISIA on behalf of the Joint Research Centre (Kouridis
et al., 2010) in the framework of the study “Uncertainty estimates and guidance for road transport emission
calculations” for 2005 emissions. The study shows an uncertainty assessment, at Italian level, for road
transport emissions on the basis of 2005 input parameters of the COPERT 4 model (v. 7.0).
3.8.6 Recalculation
The annual update of the emissions time series from road transport implies a periodic review process. In
2017 submission the historical series has been revised according to the application of the model COPERT 4
v.11.4 for all vehicle categories except for CNG passenger cars, for which a country specific database has
been used.
Regarding fuel consumption, values have been updated according to data published in 2017 in the new
EUROSTAT format of the energy balance (http://dgsaie.mise.gov.it/dgerm/ben.asp ).
As regards input fleet data, fleet values for mopeds have been updated according to data provided by the
Ministry of Transport for the years 2012 – 2015, taken as reference because the mopeds fleet is considered to
be completely registered since 2012.
Fleet values for urban buses in 2014 have been updated according to the updating of the data on urban
public buses, published on CNIT 2014 – 2015.
The transition to version 11.4 of the model provided the chance for global checks and revisions of input
data and parameters for the entire historical time series. Consequentially the fuel balancing process is
applied, acting mainly on control variables such as mileage, with the aim to minimize the deviation between
statistical and calculated fuel consumption values.
The final report on the physic-chemical characterization of fossil fuels used in Italy, carried out by the
Fuel Experimental Station, has been used since 2015 submission, with the aim to improve fuel quality
specifications. Fuel information has also been updated for the entire time series on the basis of the annual
reports published by ISPRA about the fuel quality in Italy.
Since 2015 fuel information has been updated also as regards country specific fuel consumption factors
for gasoline and diesel passenger cars on the basis of the results published by EEA in the report “Monitoring
CO2 emissions from passenger cars and vans in 2015” (EEA, several years).
3.8.7 Planned improvements
Improvements for the next submission will be connected to the possible new availability of data and
information regarding activity data, calculation factors and parameters, new developments of the
methodology and the update of the software.

82
3.9 Railways (NFR SUBSECTOR 1.A.3.c)
The electricity used by the railways for electric traction is supplied from the public distribution system, so
the emissions arising from its generation are reported under category 1.A.1.a Public Electricity.
Emissions from diesel trains are reported under the IPCC category 1.A.3.c Railways. Estimates are based
on the gasoil consumption for railways reported in BEN (MSE, several years [a], updated in 2017 according
to EUROSTAT methodology (http://dgsaie.mise.gov.it/dgerm/ben.asp), and on the methodology Tier1, and
emission factors from the EMEP/EEA Emission Inventory Guidebook 2016 (EMEP/EEA, 2016).
Fuel consumption data are collected by the Ministry of Economic Development, responsible of the energy
balance, from the companies with diesel railways. The activity is present only in those areas without
electrified railways, which are limited in the national territory. The trend reflects the decrease of the use of
these railways. Because of low values, emissions from railways do not represent a key category. In Table
3.25, diesel consumptions (TJ) and nitrogen oxides, non-methane volatile organic compounds, sulphur
oxides, ammonia, particulate and carbon monoxide emissions (Gg) are reported.
Table 3.25 Consumptions and Emissions time series in railways
Consumptions and
Emissions for NFR
Subsector 1.A.3.c
1990 1995 2000 2005 2010 2011 2012 2013 2014 2015
Diesel Consumption (TJ) 8,364.61 8,193.91 5,846.69 4,139.63 2,688.63 1,920.45 2,304.54 1,621.71 768.18 938.89
Emissions from diesel
trains (Gg)
NOX 10.27 10.06 7.18 5.08 3.24 2.27 2.66 1.82 0.84 1.00
NMVOC 0.91 0.89 0.64 0.45 0.29 0.20 0.24 0.17 0.08 0.09
SOX 1.18 0.77 0.08 0.01 0.00 0.00 0.00 0.00 0.00 0.00
NH3 0.00 0.00 0.00 0.00 0.00 0.00 0.00 0.00 0.00 0.00
PM2.5 0.28 0.28 0.20 0.14 0.08 0.06 0.07 0.05 0.02 0.03
PM10 0.28 0.28 0.20 0.14 0.09 0.06 0.07 0.05 0.02 0.03
TSP 0.29 0.28 0.20 0.14 0.09 0.06 0.07 0.05 0.02 0.03
BC 0.18 0.18 0.13 0.09 0.06 0.04 0.05 0.03 0.01 0.02
CO 2.10 2.05 1.47 1.04 0.67 0.48 0.58 0.41 0.19 0.24
Source: ISPRA elaborations
In this submission recalculations affected this category for the whole time series due to the adoption of the
National Energy Balance figures officially provided to the OECD/IEA/EUROSTAT Joint Questionnaire and
to the adoption of the updated factors of the EMEP/EEA Emission Inventory Guidebook 2016 (EMEP/EEA,
2016), for NOX. NMVOC and PM, as well as the consideration of the European Directive 2004/26/EC (EC,
2004) introducing emission limits for the new rail traction engines for the same pollutants.
No specific improvements are planned for the next submission.
83
3.10 Navigation (NFR SUBSECTOR 1.A.3.d)
3.10.1 Overview
This source category includes all emissions from fuels delivered to water-borne navigation. Emissions
decreased from 1990 to 2015, because of the reduction in fuel consumed in harbour and navigation activities;
the number of movements, showing an increase since 1990, reverses the trend in recent years. National
navigation is a key category in 2015 with respect to emissions of SOX, NOX, PM10 and PM2.5.
3.10.2 Methodological issues
Emissions of the Italian inventory from the navigation sector are carried out according to the IPCC
Guidelines and Good Practice Guidance (IPCC, 1997; IPCC, 2000) and the EMEP/EEA Guidebook
(EMEP/EEA, 2016). In particular, a national methodology has been developed following the EMEP/EEA
Guidebook which provides details to estimate emissions from domestic navigation, specifying recreational
craft, ocean-going ships by cruise and harbour activities; emissions from international navigation are also
estimated and included as memo item but not included in national totals (EMEP/EEA, 2016). Inland, coastal
and deep-sea fishing are estimated and reported under 1.A.4.c. International inland waterways do not occur
in Italy.
The methodology developed to estimate emissions is based on the following assumptions and
information.
Activity data comprise both fuel consumptions and ship movements, which are available in different level
of aggregation and derive from different sources as specified here below:
Total deliveries of fuel oil, gas oil and marine diesel oil to marine transport are given in national
energy balance (MSE, several years (a)) but the split between domestic and international is not
provided;
Naval fuel consumption for inland waterways, ferries connecting mainland to islands and leisure
boats, is also reported in the national energy balance as it is the fuel for shipping (MSE, several
years (a));
Data on annual arrivals and departures of domestic and international shipping calling at Italian
harbours are reported by the National Institute of Statistics in the statistics yearbooks (ISTAT,
several years (a)) and Ministry of Transport in the national transport statistics yearbooks (MIT,
several years).
As for emission and consumption factors, figures are derived by the EMEP/EEA guidebook (EMEP/EEA,
2016), both for recreational and harbour activities and national cruise, taking into account national
specificities. These specificities derive from the results of a national study which, taking into account
detailed information on the Italian marine fleet and the origin-destination movement matrix for the year
1997, calculated national values (ANPA, 2001; Trozzi et al., 2002 (b)) on the basis of the default emission
and consumption factors reported in the EMEP/CORINAIR guidebook (EMEP/CORINAIR, 2007).
National average emissions and consumption factors were therefore estimated for harbour and cruise
activities both for domestic and international shipping from 1990 to 1999. In 2009 submission the study was
updated for the years 2004, 2005 and 2006 in order to consider most recent trends in the maritime sector both
in terms of modelling between domestic and international consumptions and improvements of operational
activities in harbour (TECHNE, 2009). On the basis of the results, national average emissions and
consumption factors were updated from 2000.
Specifically, for the years referred to in the surveys, the current method estimates emissions from the
number of ships movements broken down by ship type at each of the principal Italian ports considering the
information of whether the ship movement is international or domestic, the average tonnage and the relevant
distance travelled.
For those years, in fact, figures on the number of arrivals, destination, and fleet composition have been
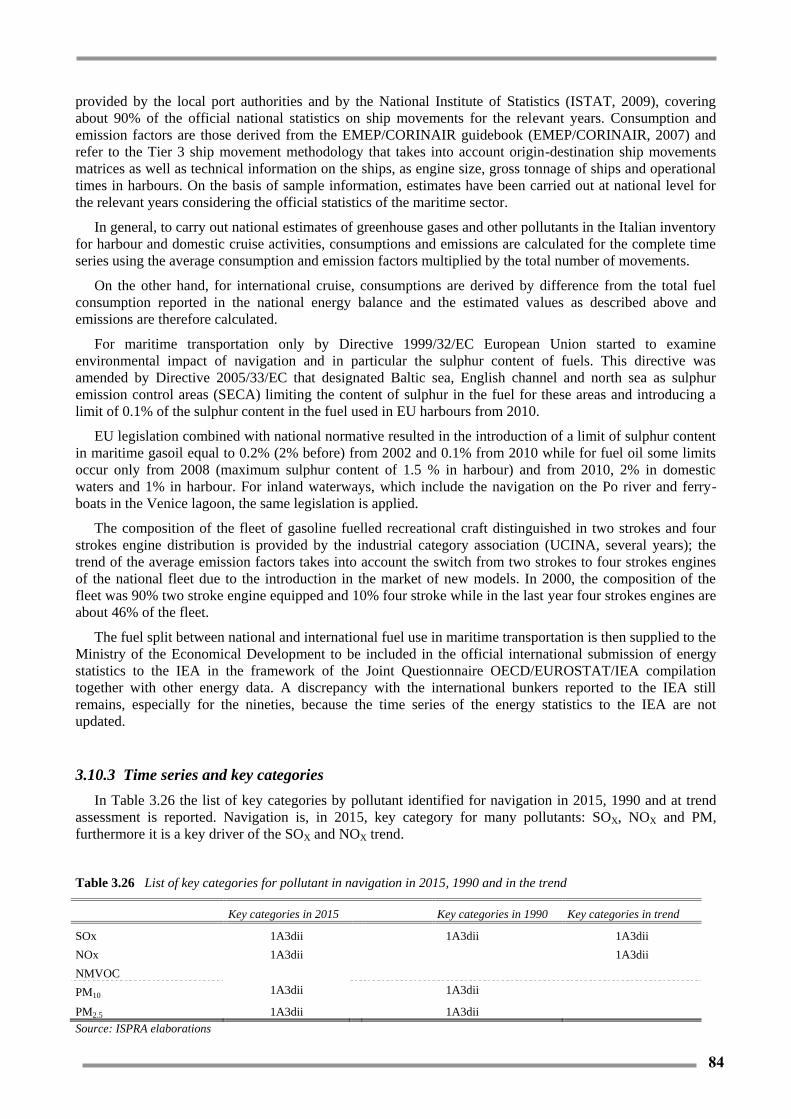
84
provided by the local port authorities and by the National Institute of Statistics (ISTAT, 2009), covering
about 90% of the official national statistics on ship movements for the relevant years. Consumption and
emission factors are those derived from the EMEP/CORINAIR guidebook (EMEP/CORINAIR, 2007) and
refer to the Tier 3 ship movement methodology that takes into account origin-destination ship movements
matrices as well as technical information on the ships, as engine size, gross tonnage of ships and operational
times in harbours. On the basis of sample information, estimates have been carried out at national level for
the relevant years considering the official statistics of the maritime sector.
In general, to carry out national estimates of greenhouse gases and other pollutants in the Italian inventory
for harbour and domestic cruise activities, consumptions and emissions are calculated for the complete time
series using the average consumption and emission factors multiplied by the total number of movements.
On the other hand, for international cruise, consumptions are derived by difference from the total fuel
consumption reported in the national energy balance and the estimated values as described above and
emissions are therefore calculated.
For maritime transportation only by Directive 1999/32/EC European Union started to examine
environmental impact of navigation and in particular the sulphur content of fuels. This directive was
amended by Directive 2005/33/EC that designated Baltic sea, English channel and north sea as sulphur
emission control areas (SECA) limiting the content of sulphur in the fuel for these areas and introducing a
limit of 0.1% of the sulphur content in the fuel used in EU harbours from 2010.
EU legislation combined with national normative resulted in the introduction of a limit of sulphur content
in maritime gasoil equal to 0.2% (2% before) from 2002 and 0.1% from 2010 while for fuel oil some limits
occur only from 2008 (maximum sulphur content of 1.5 % in harbour) and from 2010, 2% in domestic
waters and 1% in harbour. For inland waterways, which include the navigation on the Po river and ferry-
boats in the Venice lagoon, the same legislation is applied.
The composition of the fleet of gasoline fuelled recreational craft distinguished in two strokes and four
strokes engine distribution is provided by the industrial category association (UCINA, several years); the
trend of the average emission factors takes into account the switch from two strokes to four strokes engines
of the national fleet due to the introduction in the market of new models. In 2000, the composition of the
fleet was 90% two stroke engine equipped and 10% four stroke while in the last year four strokes engines are
about 46% of the fleet.
The fuel split between national and international fuel use in maritime transportation is then supplied to the
Ministry of the Economical Development to be included in the official international submission of energy
statistics to the IEA in the framework of the Joint Questionnaire OECD/EUROSTAT/IEA compilation
together with other energy data. A discrepancy with the international bunkers reported to the IEA still
remains, especially for the nineties, because the time series of the energy statistics to the IEA are not
updated.
3.10.3 Time series and key categories
In Table 3.26 the list of key categories by pollutant identified for navigation in 2015, 1990 and at trend
assessment is reported. Navigation is, in 2015, key category for many pollutants: SOX, NOX and PM,
furthermore it is a key driver of the SOX and NOX trend.
Table 3.26 List of key categories for pollutant in navigation in 2015, 1990 and in the trend
Key categories in 2015 Key categories in 1990 Key categories in trend
SOx 1A3dii 1A3dii 1A3dii
NOx 1A3dii
1A3dii
NMVOC
PM10 1A3dii 1A3dii
PM2.5 1A3dii 1A3dii
Source: ISPRA elaborations

85
Estimates of fuel consumption for domestic use, in the national harbours or for travel within two Italian
destinations, and bunker fuels used for international travels are reported in Table 3.27.
An upward trend in emission levels is observed from 1990 to 2000, explained by the increasing number
of ship movements. Nevertheless, the operational improvements in harbour activities and a reduction in ship
domestic movements inverted the tendency in the last years.
Table 3.27 Marine fuel consumptions in domestic navigation and international bunkers (Gg) and pollutants emissions
from domestic navigation (Gg)
Consumptions and
Emissions for NFR
Subsector 1.A.3.d 1990 1995 2000 2005 2010 2011 2012 2013 2014 2015
Gasoline for
recreational craft
(Gg) 182.00 210.00 213.00 199.00 169.00 149.00 99.00 99.00 99.00 99.00
Diesel oil for inland
waterways (Gg) 19.80 22.73 20.20 24.75 18.18 21.82 24.95 30.20 28.28 27.43
Fuels used in
domestic cruise
navigation (Gg) 778.06 706.38 811.37 739.97 725.35 678.27 611.22 575.01 572.60 538.52
Fuel in harbours
(dom+int ships)
(Gg) 748.46 692.95 818.48 758.89 743.90 695.61 626.85 589.72 587.24 552.29
Fuel in international
Bunkers (Gg) 1,350.07 1,233.96 1,277.90 2,147.25 2,174.64 2,245.24 1,958.69 1,540.26 1,388.73 1,755.63
Emissions from National Navigation (Gg)
Emissions of NOx 95.55 87.97 102.48 94.94 93.28 87.42 78.63 74.39 74.08 69.83
Emissions of
NMVOC 46.11 52.42 50.17 43.28 31.82 27.47 18.49 17.82 17.19 16.66
Emissions of SOx 77.94 70.31 81.49 49.73 28.38 26.54 23.91 22.50 22.40 21.07
Emissions of PM2.5 9.30 8.83 9.61 8.90 7.86 7.24 6.22 5.90 5.83 5.51
Emissions of PM10 9.33 8.86 9.65 8.94 7.89 7.27 6.25 5.93 5.86 5.53
Emissions of CO 102.27 115.57 124.77 122.86 109.42 96.71 66.19 65.28 64.68 63.35
Source: ISPRA elaborations
3.10.4 QA/QC and Uncertainty
Basic data to estimate emissions are reconstructed starting from information on ship movements and fleet
composition coming from different sources. Data collected in the framework of the national study from the
local port authorities, carried out in 2009 (TECHNE, 2009), were compared with the official statistics
supplied by ISTAT, which are collected from maritime operators with a yearly survey and communicated at
international level to EUROSTAT. Differences and problems were analysed in details and solved together
with ISTAT experts. Different sources of data are usually used and compared during the compilation of the
annual inventory.
Besides, time series resulting from the recalculation have been presented to the national experts in the
framework of an ad hoc working group on air emissions inventories. The group is chaired by ISPRA and
includes participants from the local authorities responsible for the preparation of local inventories, sectoral
experts, the Ministry of Environment, Land and Sea, and air quality model experts. Top-down and bottom-up
approaches have been compared with the aim to identify the potential problems and future improvements to
be addressed. There is also an ongoing collaboration and data exchange with regional environmental
agencies on this issue.
3.10.5 Recalculations
Recalculations, respect to the previous submission, regard emissions since 1990; specifically lubricants

86
previously attributed to navigation, as fuel international bunkers, have been now attributed to the IPPU
sector according to the 2006 IPCC Guidelines (IPCC, 2006) which requires to be estimated and reported in
the energy sector only lubricants consumption for two stroke engines in road transport.
Recalculation affected also emissions from recreation crafts, in consideration of the European Directive
2003/44, from 2007, which establishes NOx, NMVOC, CO emission limits for new engines and of the
update, for the whole time series, of NOx, NMVOC, CO, PM and NH3 emission factors according to the
EMEP/EEA Guidebook (EMEP/EEA, 2016).
3.10.6 Planned improvements
Further improvements will regard a verification of activity data on ship movements and emission
estimates with regional environmental agencies, especially with those more affected by maritime pollution.
3.11 Pipeline compressors (NFR SUBSECTOR 1.A.3.e)
Pipeline compressors category (1.A.3e) includes all emissions from fuels delivered to the transportation
by pipelines and storage of natural gas. Relevant pollutants emissions typical of a combustion process, such
as SOX, NOX, CO and PM emissions, derive from this category. This category is not a key category.
Emissions from pipeline compressors are estimated on the basis of natural gas fuel consumption used for
the compressors and the relevant emission factors. The amount of fuel consumption is estimated on the basis
of data supplied for the whole time series by the national operators of natural gas distribution (SNAM and
STOGIT) and refers to the fuel consumption for the gas storage and transportation; this consumption is part
of the fuel consumption reported in the national energy balance in the consumption and losses sheet.
Emission factors are those reported in the EMEP/EEA Guidebook for gas turbines (EMEP/CORINAIR,
2007). Emissions communicated by the national operators in their environmental reports are also taken into
account to estimate air pollutants, especially SOX, NOX, CO and PM10.
Regarding QA/QC, fuel consumptions reported by the national operators for this activity are compared
with the amount of natural gas internal consumption and losses reported in the energy balance.
Starting from the length of pipelines, the average energy consumptions by kilometre are calculated and
used for verification of data collected by the operators. Energy consumptions and emissions by kilometre
calculated on the basis of data supplied by SNAM, which is the main national operator, are used to estimate
the figures for the other operators when their annual data are not available.
In Table 3.28, nitrogen oxides, non-methane volatile organic compounds, sulphur oxides, particulate and
carbon monoxide emissions (Gg) are reported.
Table 3.28 Emissions from pipeline compressors (Gg)
Emissions
for NFR
Subsector
1.A.3.e
1990 1995 2000 2005 2010 2011 2012 2013 2014 2015
NOx 2.89 4.18 2.96 2.37 1.71 0.90 0.99 0.86 0.50 0.36
NMVOC 0.02 0.03 0.04 0.04 0.05 0.03 0.03 0.03 0.02 0.02
SOx 0.01 0.01 0.01 0.01 0.01 0.01 0.01 0.01 0.01 0.01
PM10 0.02 0.03 0.05 0.03 0.03 0.02 0.02 0.02 0.01 0.02
CO 1.26 1.38 1.03 0.60 0.61 0.36 0.34 0.31 0.25 0.23
Source: ISPRA elaborations

87
3.12 Civil sector: small combustion and off-road vehicles (NFR SUBSECTOR
1.A.4 - 1.A.5)
3.12.1 Overview
Emissions from energy use in the civil sector cover combustion in small-scale combustion units, with
thermal capacity < 50 MWth, and off road vehicles in the commercial, residential and agriculture sectors.
The emissions refer to the following categories:
1 A 4 a i Commercial / Institutional: Stationary
1 A 4 a ii Commercial / Institutional: Mobile
1 A 4 b i Residential: Stationary plants
1 A 4 b ii Residential: Household and gardening (mobile)
1 A 4 c i Agriculture/Forestry/Fishing: Stationary
1 A 4 c ii Agriculture/Forestry/Fishing: Off-road Vehicles and Other Machinery
1A 4 c iii Agriculture/Forestry/Fishing: National Fishing
1 A 5 a Other, Stationary (including military)
1 A 5 b Other, Mobile (Including military, land based and recreational boats)
In Table 3.29 the list of categories for small combustion and off road vehicles identified as key categories
by pollutant for 2015, 1990 and in the trend is reported.
Table 3.29 List of key categories by pollutant in the civil sector in 2015, 1990 and trend
Key categories in 2015 Key categories in 1990 Key categories in trend
SOX 1 A 4 b i 1 A 4 a i
NOX 1 A 4 b i 1 A 4 c ii 1 A 4 c ii 1 A 4 a i 1 A 4 b i
NMVOC 1 A 4 b i 1 A 4 a i 1 A 4 b i 1 A 4 c ii 1 A 4 b i 1 A 4 a i 1 A 4 c ii
CO 1 A 4 b i 1 A 4 b i 1 A 4 b i
PM10 1 A 4 b i 1 A 4 b i 1 A 4 c ii 1 A 4 b i 1 A 4 c ii
PM2.5 1 A 4 b i 1 A 4 b i 1 A 4 c ii 1 A 4 b i 1 A 4 c ii
BC 1 A 4 b i 1 A 4 c ii 1 A 4 c ii 1 A 4 b i 1 A 4 b i 1 A 4 c ii
Pb 1 A 4 a i 1 A 4 a i
Cd 1 A 4 a i 1 A 4 b i 1 A 4 a i 1 A 4 a i 1 A 4 b i
Hg 1 A 4 a i 1 A 4 a i
PAH 1 A 4 b i 1 A 4 b i 1 A 4 b i
DIOX 1 A 4 b i 1 A 4 a i 1 A 4 b i 1 A 4 b i 1 A 4 a i
HCB 1 A 4 b i
PCB 1 A 4 a i 1 A 4 b i
3.12.2 Activity data
The Commercial / Institutional emissions arise from the energy used in the institutional, service and
commercial buildings, mainly for heating. Additionally, this category includes all emissions due to wastes
used in electricity generation. In the residential sector the emissions arise from the energy used in residential
buildings, mainly for heating and the sector includes emission from household and gardening machinery.
The Agriculture/ Forestry/ Fishing sector includes all emissions due to the fuel use in agriculture, mainly to
produce mechanical energy, the fuel use in fishing and for machinery used in the forestry sector. Emissions

88
from military aircraft and naval vessels are reported under 1A.5.b Mobile.
The estimation procedure follows that of the basic combustion data sheet. Emissions are estimated from
the energy consumption data that are reported in the national energy balance (MSE, several years (a)). The
national energy balance does separate energy consumption between civil and agriculture-fishing, but it does
not distinguish between Commercial – Institutional and Residential. But this information is available in the
Joint Questionnaire OECD/IEA/EUROSTAT prepared by the Ministry of Economical Development and
officially sent to the international organizations. In this submission the updated fuel consumption time series
according to the joint Questionnaire have been updated for the following fuels: steam coal, coke oven coke,
residual oil, gasoil, kerosene, LPG, gas work gas.
For natural gas, which have not been yet updated with data reported to the international organizations,
total consumption is subdivided between commercial and residential on the basis of the percentage figures
estimated by ENEA and reported in its annual energy report (ENEA, several years).
Emissions from 1.A.4.b Residential and 1.A.4.c Agriculture/Forestry/Fishing are disaggregated into those
arising from stationary combustion and those from off-road vehicles and other machinery.
The time series of fuel consumption for the civil sector are reported in Table 3.30.
Table 3.30 Time series of fuel consumption for the civil sector
1990 1995 2000 2005 2010 2011 2012 2013 2014 2015
TJ
1 A 4 a i Commercial /
Institutional: Stationary plants 213,278 259,740 318,033 431,470 496,865 427,362 425,566 422,050 374,818 402,137
1 A 4 b i Residential: Stationary
plants 1,002,188 1,006,045 1,040,976 1,181,750 1,235,229 1,074,934 1,153,137 1,150,737 958,697 1,068,422
1 A 4 b ii Residential: Household
and gardening (mobile) 466 571 373 154 66 57 57 57 57 57
1 A 4 c i
Agriculture/Forestry/Fishing:
Stationary
9,684 9,508 8,176 10,247 8,833 8,227 7,883 7,825 7,160 8,234
1 A 4 c ii
Agriculture/Forestry/Fishing: Off-
road Vehicles and Other
Machinery
96,471 101,859 94,605 95,805 84,404 82,917 79,717 79,715 80,014 81,208
1A 4 c iii
Agriculture/Forestry/Fishing:
National Fishing
8,407 9,645 8,578 10,457 7,726 7,724 7,042 6,189 6,445 6,189
1 A 5 b Other, Mobile (Including
military, land based and
recreational boats)
14,830 20,800 11,587 16,935 8,995 7,110 4,594 8,061 7,959 6,384
The emission factors used derive from the EMEP/EEA Emission Inventory Guidebook 2009
(EMEP/EEA, 2009).
3.12.3 Methodological issues
A national methodology has been developed and applied to estimate NOX emissions from gas powered
plants and all emissions for wood combustion while emissions from waste combustion in incinerator with
energy recovery have been calculated from the database of incinerator plants which includes plant specific
emission factors on the basis of their technology and measurements data (ENEA-federAmbiente, 2012).
More detail information is available in the relevant paragraph of the waste sector chapter.
3.12.3.1 NOX emissions from gas powered plants in the civil sector
A national methodology has been developed and applied to estimate NOX emissions from gas powered
plants in the civil sector, according to the EMEP/EEA Guidebook (EMEP/EEA, 2016).
On the basis of the information and data reported in available national studies for the year 2003, a

89
distribution of heating plants in the domestic sector by technology and typology has been assessed for that
year together with their specific emissions factors. Data related to heating plants, both commercial and
residential, have been supplied for 2003 by a national energy research institute (CESI, 2005). In this study,
for the residential sector, the sharing of single and multifamily houses plants by technology and a
quantitative estimation of the relevant gas powered ones are reported, including their related NOX emission
factors. Domestic final consumption by type of plant, single or multifamily plants, has been estimated on the
basis of data supplied by ENEA on their distribution (ENEA, several years).
Data reported by ASSOTERMICA (ASSOTERMICA, several years) on the number of heating plants
sold have been used for the years after 2003 to update the information related to the technologies. A linear
regression, for the period 1995-2003, has been applied, while for the period 1990-1994, the technology with
the highest emission factor has been assumed to be operating.
In Table 3.31 the time series of NOX average emission factors for the relevant categories is reported.
Table 3.31 Time series of NOX emissions factor for the civil sector
EF NOx 1990 1995 2000 2005 2010 2015
g/Gj
1 A 4 a i Commercial / Institutional: Stationary 50 48.5 40.2 35.2 32.4 30.6
1 A 4 b i Residential: Stationary plants 50 48.2 38.6 32.4 31.3 30.7
3.12.3.2 Emissions from wood combustion in the civil sector
A national methodology has been developed and applied to estimate emissions from wood combustion in
the civil sector, according to the TIER 2 methodology reported in the EMEP/EEA Guidebook (EMEP/EEA,
2016). In the past years, several surveys have been carried out to estimate national wood consumption in the
domestic heating and the related technologies used. In the estimation process, three surveys have been taken
into account: the first survey (Gerardi and Perrella, 2001) has evaluated the technologies for wood
combustion used in Italy for the year 1999, the second survey (ARPA, 2007) was related to the year 2006,
while the third survey (SCENARI/ISPRA, 2013) was related to the year 2012. The technologies assessed by
the abovementioned surveys and their distribution are reported in Table 3.32.
Table 3.32 Distribution of wood combustion technologies
Distribution of wood combustion technologies
1999 2006 2012
%
Fireplaces 51.3 44.7 51.2
Stoves 28.4 27.6 22.9
Advanced fireplaces 15.4 20.2 15.8
Pellet stoves 0 3.1 4.0
Advanced stoves 4.8 4.4 6.0
Average emission factors for 1999, 2006 and 2012 have been estimated at national level taking into
account the technology distributions; for 1990 only old technologies (fireplaces and stoves) have been
considered and linear regressions have been applied to reconstruct the time series from 1990 to 2006. For the
years till 2011, emission factors from 2006 have been used in absence of further available information.
For NMVOC, PAH, PM10 and PM2.5 emission factors the results of the experimental study funded by
the Ministry of Environment and conducted by the research institute ‘Stazione Sperimentale dei
Combustibili’ (SSC, 2012) have been used. This study measured and compared NOX, CO, NMVOC, SOX,
TSP, PM10, PM2.5, PAH and Dioxin emissions for the combustion of different wood typically used in Italy

90
as beech, hornbeam, oak, locust and spruce-fir, in open and closed fireplaces, traditional and innovative
stoves, and pellet stoves. Emissions from certificated and not certificated pellets have been also measured
and compared. In general measured emission factors results in the ranges supplied by the EMEP/EEA
Guidebook but for some pollutants and technologies results are sensibly different. In particular NMVOC
emissions for all the technologies are close or lower to the minimum value of the range reported in the
Guidebook, as well as PM emissions with exception of emissions from pellet stoves which are higher of the
values suggested in the case of the use of not certificated pellet. For these pollutants the minimum values of
the range in the Guidebook have been used when appropriate. For that concern PAH, measured emissions
from open fireplaces are much lower than the minimum value of the range in the Guidebook while those
from the advanced stoves are close to the superior values of the range for all the PAH compounds. In this
case for open fireplaces experimental values have been used while for the other technologies the minimum or
maximum values of the range in the Guidebook have been used as appropriate. For the other pollutants
where differences with the values suggested by the Guidebook are not sensible, a more in depth analysis will
be conducted with the aim to update the emission factors used if needed.
In Table 3.33 emission factors used for the Italian inventory are reported.
Table 3.33 Emission factors for wood combustion
1990 1995 2000 2005 2010 2015
g/Gj
NOx 50 55 59 61 61 60
CO 6000 5791 5591 5427 5395 5275
NMVOC 762 715 672 643 638 631
SO2 10 11 12 13 13 12
NH3 9 7 6 6 6 6
PM10 507 465 428 408 404 407
PM2.5 503 461 424 404 400 402
BC 40 37 35 34 34 34
PAH 0.25 0.24 0.23 0.22 0.22 0.22
Dioxin
(g/GJ) 0.48 0.47 0.45 0.44 0.44 0.42
PCB 0.00006 0.00006 0.00006 0.00006 0.00006 0.00006
HCB 0.00001 0.00001 0.00001 0.00001 0.00001 0.00001
As 0.001 0.001 0.001 0.001 0.001 0.0005
Cd 0.002 0.002 0.001 0.001 0.001 0.001
Cr 0.001 0.002 0.003 0.003 0.003 0.003
Cu 0.01 0.01 0.01 0.01 0.01 0.01
Hg 0.0004 0.0004 0.0004 0.0004 0.0004 0.0004
Ni 0.002 0.002 0.002 0.002 0.002 0.002
Pb 0.04 0.04 0.04 0.04 0.04 0.04
Se 0.001 0.001 0.001 0.001 0.001 0.0005
Zn 0.10 0.10 0.10 0.09 0.09 0.09
B(a)P 0.07 0.07 0.06 0.06 0.06 0.07
B(b)F 0.09 0.08 0.08 0.08 0.08 0.08
B(k)F 0.04 0.04 0.04 0.04 0.04 0.03
IND 0.05 0.05 0.05 0.04 0.04 0.04
In 2014 the national Institute of Statistics (ISTAT) carried out a survey, funded by the Ministry of Economic
Development and infrastructure (MSE), on the final energy consumption of households for residential
heating which include the fuel consumption of solid biomass, as wood and pellets (ISTAT, 2014). In this

91
regard the survey resulted in an official statistics for 2012 and 2013 of wood and pellet fuel consumption at
national and regional level including the information on the relevant equipments. The resulting figure for
2013 doubled the value reported in the National Energy Balance for previous years which asked for the need
to update the whole time series. An ad hoc working group has been established, involving ISPRA, MSE and
the energy management system national operator (GSE), to reconstruct the complete time series of wood and
pellet fuel consumption which has been recalculated and officially submitted to Eurostat in June 2015.
The methodology to recalculate consumption figures has taken in account the amount of wood harvested for
energy purposes, the amount of wood biomass from pruning, import and export official statistics to estimate
total wood consumption. A model to estimate the annual amount of wood for heating has been developed on
the basis of the annual energy total biomass demand of households estimated considering the degree days
time series, the number of households, the energy efficiency of equipments and fuel consumption statistics
for the other fuels. As a consequence, time series for residential heating have been completely recalculated
affecting the relevant pollutants and resulting in important recalculations at national total levels.
3.12.4 Time series and key categories
The time series of emissions for civil sector shows an increasing trend for all pollutants except for SOX
and NOX, due to a gradually shift of diesel fuel to gas, concerning SOX, and to a replacement of classic
boilers with those with low emission for NOX. All the other pollutants have a growing trend, as a
consequence of the increase of wood combustion.
More in detail the decrease of SO2 emissions is the combination of the switch of fuel from gasoil and fuel
oil to natural gas and LPG and the reduction in the average sulphur content of liquid fuels. The SO2 emission
factors for 1990 and 2015 by fuels are shown in the following box.
EMISSION FACTORS (kg/Gj)
FUEL 1990 2015
steam coal 0.646 0.646
coke oven coke 0.682 0.682
wood and similar 0.010 0.012
municipal waste 0.069 0.050
biodiesel 0.047 0.047
residual oil 1.462 0.146
gas oil 0.140 0.047
kerosene 0.018 0.018
natural gas - -
biogas - -
LPG - -
gas works gas 0.011 0.011
motor gasoline 0.023 0.023
Time series of emissions is reported in Table 3.34.
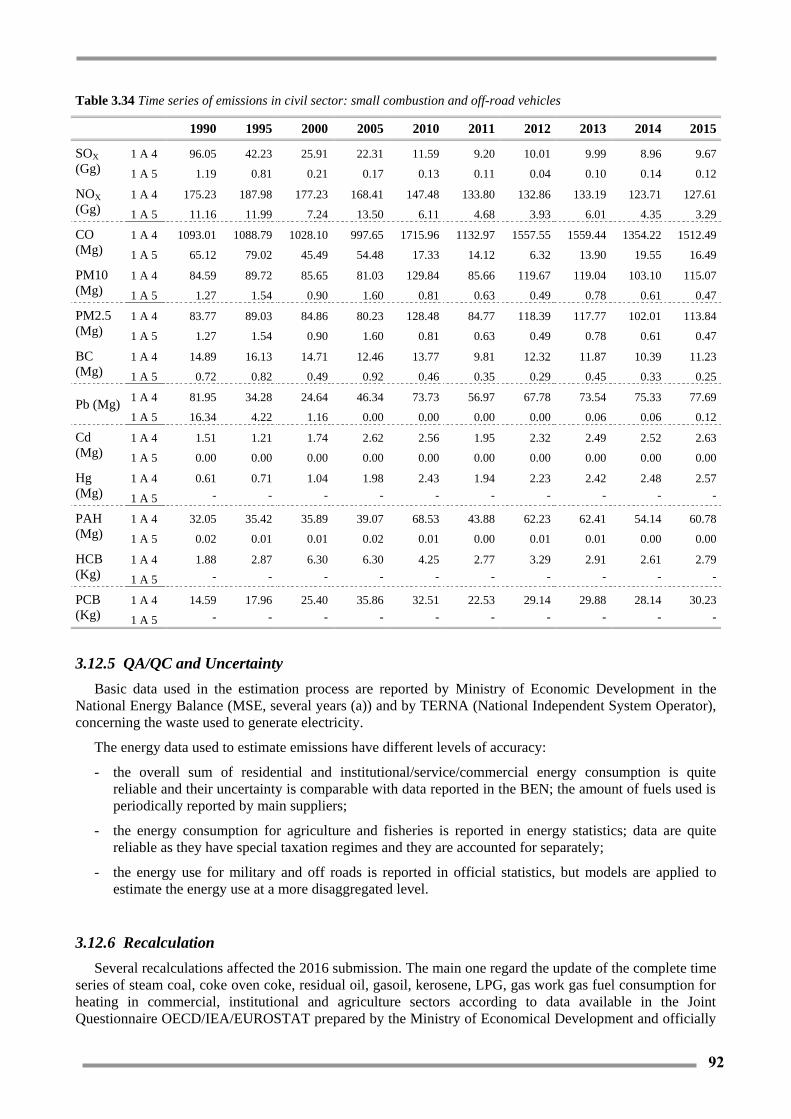
92
Table 3.34 Time series of emissions in civil sector: small combustion and off-road vehicles
1990 1995 2000 2005 2010 2011 2012 2013 2014 2015
SOX
(Gg)
1 A 4 96.05 42.23 25.91 22.31 11.59 9.20 10.01 9.99 8.96 9.67
1 A 5 1.19 0.81 0.21 0.17 0.13 0.11 0.04 0.10 0.14 0.12
NOX
(Gg) 1 A 4 175.23 187.98 177.23 168.41 147.48 133.80 132.86 133.19 123.71 127.61
1 A 5 11.16 11.99 7.24 13.50 6.11 4.68 3.93 6.01 4.35 3.29
CO
(Mg) 1 A 4 1093.01 1088.79 1028.10 997.65 1715.96 1132.97 1557.55 1559.44 1354.22 1512.49
1 A 5 65.12 79.02 45.49 54.48 17.33 14.12 6.32 13.90 19.55 16.49
PM10
(Mg)
1 A 4 84.59 89.72 85.65 81.03 129.84 85.66 119.67 119.04 103.10 115.07
1 A 5 1.27 1.54 0.90 1.60 0.81 0.63 0.49 0.78 0.61 0.47
PM2.5
(Mg) 1 A 4 83.77 89.03 84.86 80.23 128.48 84.77 118.39 117.77 102.01 113.84
1 A 5 1.27 1.54 0.90 1.60 0.81 0.63 0.49 0.78 0.61 0.47
BC
(Mg) 1 A 4 14.89 16.13 14.71 12.46 13.77 9.81 12.32 11.87 10.39 11.23
1 A 5 0.72 0.82 0.49 0.92 0.46 0.35 0.29 0.45 0.33 0.25
Pb (Mg) 1 A 4 81.95 34.28 24.64 46.34 73.73 56.97 67.78 73.54 75.33 77.69
1 A 5 16.34 4.22 1.16 0.00 0.00 0.00 0.00 0.06 0.06 0.12
Cd
(Mg) 1 A 4 1.51 1.21 1.74 2.62 2.56 1.95 2.32 2.49 2.52 2.63
1 A 5 0.00 0.00 0.00 0.00 0.00 0.00 0.00 0.00 0.00 0.00
Hg
(Mg) 1 A 4 0.61 0.71 1.04 1.98 2.43 1.94 2.23 2.42 2.48 2.57
1 A 5 - - - - - - - - - -
PAH
(Mg)
1 A 4 32.05 35.42 35.89 39.07 68.53 43.88 62.23 62.41 54.14 60.78
1 A 5 0.02 0.01 0.01 0.02 0.01 0.00 0.01 0.01 0.00 0.00
HCB
(Kg) 1 A 4 1.88 2.87 6.30 6.30 4.25 2.77 3.29 2.91 2.61 2.79
1 A 5 - - - - - - - - - -
PCB
(Kg) 1 A 4 14.59 17.96 25.40 35.86 32.51 22.53 29.14 29.88 28.14 30.23
1 A 5 - - - - - - - - - -
3.12.5 QA/QC and Uncertainty
Basic data used in the estimation process are reported by Ministry of Economic Development in the
National Energy Balance (MSE, several years (a)) and by TERNA (National Independent System Operator),
concerning the waste used to generate electricity.
The energy data used to estimate emissions have different levels of accuracy:
- the overall sum of residential and institutional/service/commercial energy consumption is quite
reliable and their uncertainty is comparable with data reported in the BEN; the amount of fuels used is
periodically reported by main suppliers;
- the energy consumption for agriculture and fisheries is reported in energy statistics; data are quite
reliable as they have special taxation regimes and they are accounted for separately;
- the energy use for military and off roads is reported in official statistics, but models are applied to
estimate the energy use at a more disaggregated level.
3.12.6 Recalculation
Several recalculations affected the 2016 submission. The main one regard the update of the complete time
series of steam coal, coke oven coke, residual oil, gasoil, kerosene, LPG, gas work gas fuel consumption for
heating in commercial, institutional and agriculture sectors according to data available in the Joint
Questionnaire OECD/IEA/EUROSTAT prepared by the Ministry of Economical Development and officially

93
sent to the international organizations. Also kerosene and gasoline fuel consumptions for national fishing
have been updated according to the OECD/IEA/EUROSTAT energy balance figures.
Energy recovery from waste reported in the commercial heating has been updated from 2011; in
particular activity data have been updated for 2014 for urban waste and from 2011 for industrial waste.
Further details are reported in the waste chapter. Recalculations affected mainly heavy metals, HCB and
PCB.
For 2013 and 2014, NOX emission factors for natural gas consumption in residential and commercial
small combustion plants have been updated on the basis of data published in the annual report of the
equipment producer association (Assotermica, several years).
3.12.7 Planned improvements
On the basis of the surveys on wood consumption and combustion technologies carried out by ISPRA
(SCENARI/ISPRA, 2013) and by ISTAT (ISTAT, 2014), the updating of average emission factors is
planned for the next submission.
An in depth analysis of emission factors resulting from the experimental study carried out by SSC (SSC,
2012) for biomass and their comparison with the values suggested by the last version of the EMEP/EEA
Guidebook (EMEP/EEA, 2016) will be carried out and emission factors will be updated if needed.
3.13 Fugitive emissions from natural gas distribution (NFR SUBSECTOR
1.B.2b)
NMVOC fugitive emissions from the distribution of natural gas (both in pipelines and in the distribution
network) are calculated every year on the basis of fugitive natural gas emissions and the content of NMVOC
in the gas distributed. The methodology and references are reported in detail in the NIR (ISPRA, 2017[a]).
CH4, CO2 and NMVOC emissions have been estimated on the basis of activity data published by industry,
the national authority, and information collected annually by the Italian gas operators. Emission estimates
take into account the information on: the amount of natural gas distributed supplied by the main national
company (SNAM); length of pipelines, distinct by low, medium and high pressure and by type, cast iron,
grey cast iron, steel or polyethylene pipelines as supplied by the national authority for the gas distribution
(AEEG); natural gas losses reported in the national energy balance; methane emissions reported by operators
in their environmental reports (EDISON, SNAM,). NMVOC and CO2 emissions have been calculated
considering CO2 content in the leaked natural gas.
The average natural gas chemical composition has been calculated from the composition of natural gas
produced and imported. Main parameters of mixed natural gas, as calorific value, molecular weight, and
density, have been calculated as well. Data on chemical composition and calorific value are supplied by the
main national gas providers for domestic natural gas and for each country of origin.
The following table shows average data for national pipelines natural gas.
Table 3.35 Average composition for pipelines natural gas and main parameters
1990 1995 2000 2005 2010 2011 2012 2013 2014 2015
HCV (kcal/m3) 9,156 9,193 9,221 9,267 9,331 9,287 9,304 9,280 9,262 9,309
NCV (kcal/m3) 8,255 8,290 8,325 8,360 8,418 8,376 8,393 8,370 8,354 8,397
Molecular weight 17.03 17.19 17.37 17.44 17.46 17.26 17.41 17.32 17.35 17.33
Density (kg/Sm3) 0.72 0.73 0.74 0.74 0.74 0.73 0.74 0.73 0.73 0.73
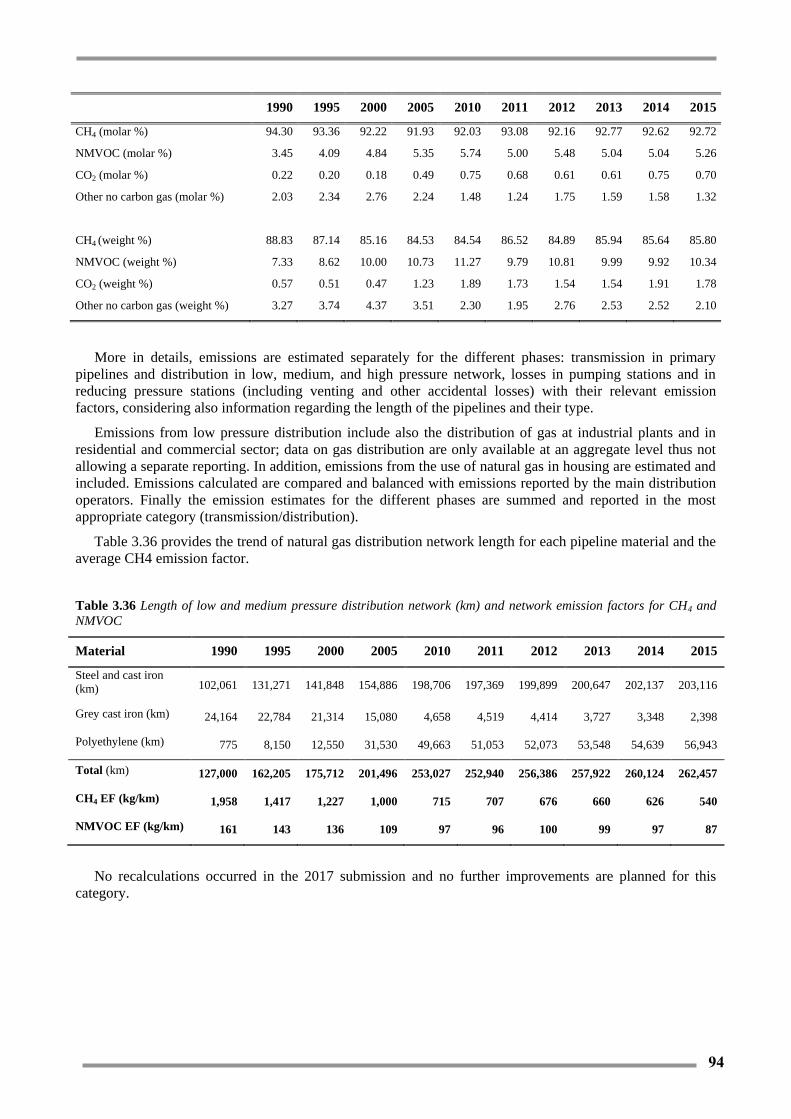
94
1990 1995 2000 2005 2010 2011 2012 2013 2014 2015
CH4 (molar %) 94.30 93.36 92.22 91.93 92.03 93.08 92.16 92.77 92.62 92.72
NMVOC (molar %) 3.45 4.09 4.84 5.35 5.74 5.00 5.48 5.04 5.04 5.26
CO2 (molar %) 0.22 0.20 0.18 0.49 0.75 0.68 0.61 0.61 0.75 0.70
Other no carbon gas (molar %) 2.03 2.34 2.76 2.24 1.48 1.24 1.75 1.59 1.58 1.32
CH4 (weight %) 88.83 87.14 85.16 84.53 84.54 86.52 84.89 85.94 85.64 85.80
NMVOC (weight %) 7.33 8.62 10.00 10.73 11.27 9.79 10.81 9.99 9.92 10.34
CO2 (weight %) 0.57 0.51 0.47 1.23 1.89 1.73 1.54 1.54 1.91 1.78
Other no carbon gas (weight %) 3.27 3.74 4.37 3.51 2.30 1.95 2.76 2.53 2.52 2.10
More in details, emissions are estimated separately for the different phases: transmission in primary
pipelines and distribution in low, medium, and high pressure network, losses in pumping stations and in
reducing pressure stations (including venting and other accidental losses) with their relevant emission
factors, considering also information regarding the length of the pipelines and their type.
Emissions from low pressure distribution include also the distribution of gas at industrial plants and in
residential and commercial sector; data on gas distribution are only available at an aggregate level thus not
allowing a separate reporting. In addition, emissions from the use of natural gas in housing are estimated and
included. Emissions calculated are compared and balanced with emissions reported by the main distribution
operators. Finally the emission estimates for the different phases are summed and reported in the most
appropriate category (transmission/distribution).
Table 3.36 provides the trend of natural gas distribution network length for each pipeline material and the
average CH4 emission factor.
Table 3.36 Length of low and medium pressure distribution network (km) and network emission factors for CH4 and
NMVOC
Material 1990 1995 2000 2005 2010 2011 2012 2013 2014 2015
Steel and cast iron
(km) 102,061 131,271 141,848 154,886 198,706 197,369 199,899 200,647 202,137 203,116
Grey cast iron (km) 24,164 22,784 21,314 15,080 4,658 4,519 4,414 3,727 3,348 2,398
Polyethylene (km) 775 8,150 12,550 31,530 49,663 51,053 52,073 53,548 54,639 56,943
Total (km) 127,000 162,205 175,712 201,496 253,027 252,940 256,386 257,922 260,124 262,457
CH4 EF (kg/km) 1,958 1,417 1,227 1,000 715 707 676 660 626 540
NMVOC EF (kg/km) 161 143 136 109 97 96 100 99 97 87
No recalculations occurred in the 2017 submission and no further improvements are planned for this
category.
95
4 IPPU - INDUSTRIAL PROCESSES (NFR SECTOR 2)
4.1 Overview of the sector
Emission estimates in this category include emissions from all industrial processes and also by-products
or fugitive emissions, which originate from these processes. Where emissions are released simultaneously
from the production process and from combustion, as in the cement industry, they are estimated separately
and included in the appropriate categories, in sector 2 and in sector 1 category 1.A.2. This sector makes
important contributions to the emissions of heavy metals, PAH, dioxins and PCB.
Regarding emissions of the main pollutants, in 2015, industrial processes account for 10.1% of SO2
emissions, 0.6% of NOX, 0.1% of NH3, 4.8% of NMVOC and 2.7% of CO. About particulate matter, in 2015
this sector accounts for 5.0% of PM10 emissions and 4.4% of PM2.5. Industrial processes make a significant
contribution to the total Italian emissions of heavy metals, despite significant reductions since 1990;
particularly this sector accounts for 25.7% of Pb emissions, 16.4% of Cd and 32.2% of Hg. Regarding POPs
emissions, 10.0% of PAH total emissions is emitted from industrial processes as well as 27.4% of dioxins
and 40.6% of PCB.
In 2015, iron and steel sector (2C1) is a key category at level assessment for PM10, PM2.5, Pb, Cd, Hg,
PAH, PCDD/PCDF and PCB; emissions from cement production (2A1) is a key category source for SO2
emissions. In 1990 other chemical industry (2B10a) is a key category for Hg and iron and steel production
(2C1) is a key category for PM10, Cd, Hg, PAH, PCDD/PCDF and PCB. At trend assessment, iron and steel
sector is key category for Pb, Hg, PAH, PCDD/PCDF and PCB while cement production is a key category
for SO2 emissions.
4.2 Methodological issues
Methodologies used for estimating emissions from this sector are based on and comply with the
EMEP/CORINAIR guidebook (EMEP/CORINAIR, 2007) and EMEP/EEA guidebook (EMEP/EEA, 2013),
the IPCC Guidelines (IPCC, 1997; IPCC, 2006) and the Good Practice Guidance (IPCC, 2000). Included
also in this sector are by-products or fugitive emissions, which originate from industrial processes.
There are different sources relevant to estimate emissions from this sector; activity data are provided by
national statistics and industrial associations but a lot of information is supplied directly from industry. In
fact, as for the energy sector, references derive from data collected in the framework of the national PRTR
reporting obligation, the Large Combustion Plant directives and the European Emissions Trading Scheme.
Other small plants communicate their emissions which are also considered individually. These processes
have improved the efficiency in collecting data and the exchange of information. Whenever data cannot be
straight used for the inventory compilation, they are taken into account as verification practice.
Environmental Reports published by industrial associations are also considered in the verification process.
Mineral products (2A)
In this sector emissions from the following processes are estimated and reported: cement production and
lime production.
Cement production (2A1), is relevant for SO2 and PM10 emissions and accounts for 5.1% and 1.5% of
the respective total national emissions in 2015.
During the last 15 years, in Italy, changes in cement production sector have occurred, leading to a more
stable structure confirming the leadership for the production in Europe. The oldest plants closed, wet
processes were abandoned in favour of dry processes so as to improve the implementation of more modern
and efficient technologies. Since 2011 Italy has become the second cement producer country in the EU 27
and the reduction of clinker production has been confirmed in 2015. Actually, 25 companies (68 plants of
which: 37 full cycle and 31 grinding plants) operate in this sector: multinational companies and small and
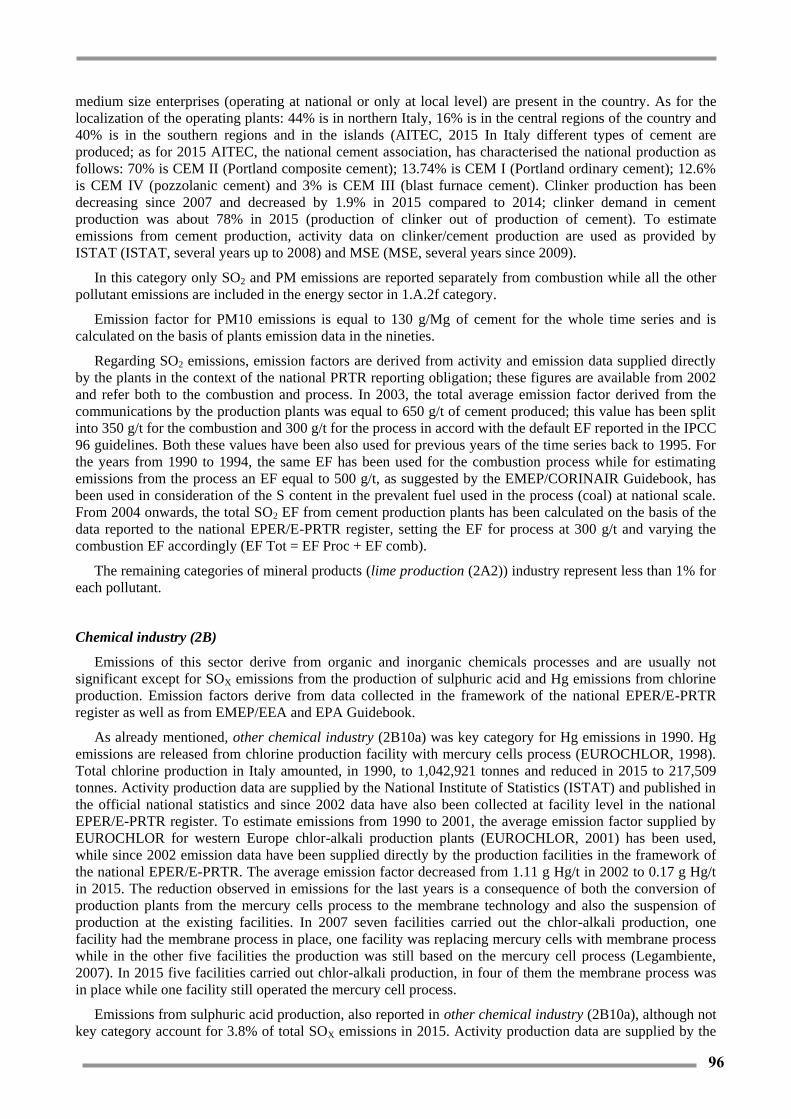
96
medium size enterprises (operating at national or only at local level) are present in the country. As for the
localization of the operating plants: 44% is in northern Italy, 16% is in the central regions of the country and
40% is in the southern regions and in the islands (AITEC, 2015 In Italy different types of cement are
produced; as for 2015 AITEC, the national cement association, has characterised the national production as
follows: 70% is CEM II (Portland composite cement); 13.74% is CEM I (Portland ordinary cement); 12.6%
is CEM IV (pozzolanic cement) and 3% is CEM III (blast furnace cement). Clinker production has been
decreasing since 2007 and decreased by 1.9% in 2015 compared to 2014; clinker demand in cement
production was about 78% in 2015 (production of clinker out of production of cement). To estimate
emissions from cement production, activity data on clinker/cement production are used as provided by
ISTAT (ISTAT, several years up to 2008) and MSE (MSE, several years since 2009).
In this category only SO2 and PM emissions are reported separately from combustion while all the other
pollutant emissions are included in the energy sector in 1.A.2f category.
Emission factor for PM10 emissions is equal to 130 g/Mg of cement for the whole time series and is
calculated on the basis of plants emission data in the nineties.
Regarding SO2 emissions, emission factors are derived from activity and emission data supplied directly
by the plants in the context of the national PRTR reporting obligation; these figures are available from 2002
and refer both to the combustion and process. In 2003, the total average emission factor derived from the
communications by the production plants was equal to 650 g/t of cement produced; this value has been split
into 350 g/t for the combustion and 300 g/t for the process in accord with the default EF reported in the IPCC
96 guidelines. Both these values have been also used for previous years of the time series back to 1995. For
the years from 1990 to 1994, the same EF has been used for the combustion process while for estimating
emissions from the process an EF equal to 500 g/t, as suggested by the EMEP/CORINAIR Guidebook, has
been used in consideration of the S content in the prevalent fuel used in the process (coal) at national scale.
From 2004 onwards, the total SO2 EF from cement production plants has been calculated on the basis of the
data reported to the national EPER/E-PRTR register, setting the EF for process at 300 g/t and varying the
combustion EF accordingly (EF Tot = EF Proc + EF comb).
The remaining categories of mineral products (lime production (2A2)) industry represent less than 1% for
each pollutant.
Chemical industry (2B)
Emissions of this sector derive from organic and inorganic chemicals processes and are usually not
significant except for SOX emissions from the production of sulphuric acid and Hg emissions from chlorine
production. Emission factors derive from data collected in the framework of the national EPER/E-PRTR
register as well as from EMEP/EEA and EPA Guidebook.
As already mentioned, other chemical industry (2B10a) was key category for Hg emissions in 1990. Hg
emissions are released from chlorine production facility with mercury cells process (EUROCHLOR, 1998).
Total chlorine production in Italy amounted, in 1990, to 1,042,921 tonnes and reduced in 2015 to 217,509
tonnes. Activity production data are supplied by the National Institute of Statistics (ISTAT) and published in
the official national statistics and since 2002 data have also been collected at facility level in the national
EPER/E-PRTR register. To estimate emissions from 1990 to 2001, the average emission factor supplied by
EUROCHLOR for western Europe chlor-alkali production plants (EUROCHLOR, 2001) has been used,
while since 2002 emission data have been supplied directly by the production facilities in the framework of
the national EPER/E-PRTR. The average emission factor decreased from 1.11 g Hg/t in 2002 to 0.17 g Hg/t
in 2015. The reduction observed in emissions for the last years is a consequence of both the conversion of
production plants from the mercury cells process to the membrane technology and also the suspension of
production at the existing facilities. In 2007 seven facilities carried out the chlor-alkali production, one
facility had the membrane process in place, one facility was replacing mercury cells with membrane process
while in the other five facilities the production was still based on the mercury cell process (Legambiente,
2007). In 2015 five facilities carried out chlor-alkali production, in four of them the membrane process was
in place while one facility still operated the mercury cell process.
Emissions from sulphuric acid production, also reported in other chemical industry (2B10a), although not
key category account for 3.8% of total SOX emissions in 2015. Activity production data are supplied by the

97
National Institute of Statistics (ISTAT) and published in the official national statistics and since 2004 data
have also been collected at facility level in the national EPER/E-PRTR register. Emission factors from 1990
to 1994 and from 2002 are derived from emission data supplied directly by the production facilities in the
framework of the CORINAIR inventory project and of the national EPER/E-PRTR, respectively.
Metal production (2C)
The main activities in this sector are those regarding the iron and steel production.
The main processes involved in iron and steel production are those related to sinter and blast furnace
plants, to basic oxygen and electric furnaces and to rolling mills.
The sintering process is a pre-treatment step in the production of iron where fine particles of metal ores
are agglomerated. Agglomeration of the fine particles is necessary to increase the passageway for the gases
during the blast furnace process and to improve physical features of the blast furnace burden. Coke and a
mixture of sinter, lump ore and fluxes are introduced into the blast furnace. In the furnace the iron ore is
increasingly reduced and liquid iron and slag are collected at the bottom of the furnace, from where they are
tapped. The combustion of coke provides both the carbon monoxide (CO) needed for the reduction of iron
oxide into iron and the additional heat needed to melt the iron and impurities. The resulting material, pig iron
(and also scrap), is transformed into steel in subsequent furnaces which may be a basic oxygen furnace
(BOF) or electric arc furnace (EAF). Oxygen steelmaking allows the oxidation of undesirable impurities
contained in the metallic feedstock by blowing pure oxygen. The main elements thus converted into oxides
are carbon, silicon, manganese, phosphorus and sulphur.
In an electric arc furnace steel is produced from polluted scrap. The scrap is mainly produced by cars
shredding and does not have a constant quality, even if, thanks to the selection procedures, the scrap quality
is better year by year.
The iron and steel cycle is closed by rolling mills with production of long products, flat products and
pipes.
In 1990 there were four integrated iron and steel plants in Italy. In 2015, there are only two of the above
mentioned plants, one of which lacks BOF; oxygen steel production represents about 21.8 % of the total
production and the arc furnace steel the remaining 78.2 % (FEDERACCIAI, several years). Currently, long
products represent about 45% of steel production in Italy, flat products about 43%, and pipe the remaining
12%. Almost the whole flat production derives from only one integrated iron and steel plant while, in steel
plants equipped with electric ovens almost all located in the northern regions, long products are produced
(e.g carbon steel, stainless steels) and seamless pipes (only one plant) (FEDERACCIAI, several years).
Basic information for Iron and steel production derives from different sources in the period 1990-2015.
Activity data are supplied by official statistics published in the national statistics yearbook (ISTAT, several
years) and by the sectoral industrial association (FEDERACCIAI, several years).
For the integrated plants, emission and production data have been communicated by the two largest plants
for the years 1990-1995 in the framework of the CORINAIR emission inventory, distinguished by sinter,
blast furnace and BOF, and by combustion and process emissions. From 2000 production data have been
supplied by all the plants in the framework of the ETS scheme, for the years 2000-2004 disaggregated for
sinter, blast furnace and BOF plants, from 2005 specifying carbonates and fuels consumption. For 2002-2015
data have also been supplied by all the four integrated iron and steel plants in the framework of the EPER/E-
PRTR registry but not distinguished between combustion and process. Qualitative information and
documentation available on the plants allowed reconstructing their history including closures or
modifications of part of the plants; additional qualitative information regarding the plants, collected and
checked for other environmental issues or directly asked to the plant, permitted to individuate the main
driving of the emission trends for pig iron and steel productions. Emissions from lime production in steel
making industries are reported in 1A2 Manufacturing Industries and Construction category.
In 2015, iron and steel sector (2C1) is key category for PM10, PM2.5, Pb, Cd, Hg, PAH, PCDD/PCDF
and PCB. In Table 4.1 relevant emission factors are reported.

98
Table 4.1 Emission factors for iron and steel for the year 2015
PM10
[g/Mg]
PM2.5
[g/Mg]
Cd
[mg/Mg]
Hg
[mg/Mg]
Pb
[mg/Mg]
PCB
[mg/Mg]
PAH
[mg/Mg]
PCDD/PCDF
[μg T-eq/Mg]
Blast furnace
charging 60 37.5
Pig iron
tapping 41.4 25.9 0.3 0.3 15 950
Basic oxygen
furnace
Areal 62 54.3 25 3 850 3.6
Point 122 106.8 25 3 850 3.6
Electric arc
furnace 124 108.5 50 150 3450 3.6 1.9 4.45
Rolling mills Areal 59 45.9 125
Point 28.2 21.9 125
Sinter plant
(except
combustion)
Areal 16 12.8
Point 8.3 6.6
PM10 emission factors for integrated plants derive from personal communication of the largest Italian
producer of pig iron and steel (ILVA, 1997) while PM10 emission factor for electric arc furnace derives
from a sectoral study (APAT, 2003). The Emission factors manual PARCOM-ATMOS (TNO, 1992), the
EMEP/Corinair Guidebook (EMEP/CORINAIR, 2006) and the IPPC Bref Report (IPPC, 2001) provide
emission factors for heavy metals while a sectoral study (APAT, 2003) provides Cd emission factors for
electric arc furnace.
Regarding POPs emissions, emission factors usually originate from EMEP/CORINAIR
(EMEP/CORINAIR, 2007, EMEP/CORINAIR, 2006) except those relating to PAH and PCDD/PCDF from
electric arc furnace that derive from direct measurements in some Italian production plants (ENEA-AIB-
MATT, 2002). Dioxin emissions for sinter plant, and other sources within steelworks manufacturing oxygen
steel occur during the combustion process and they are measured to the stack; emissions are therefore
reported in the energy sector in 1.A.2f category. In 2015 the average emission factor is equal to 0.16
micrograms TEQ per Mg of sinter produced. EF is calculated yearly on the basis of measurements done in
the two existing sinter plant in Italy.
As for other iron and steel activities, a series of technical meetings with the most important Italian
manufacturers was held in the framework of the national PRTR in order to clarify methodologies for
estimating POPs emissions. In the last years, a strict cooperation with some local environmental agencies
allowed the acquisition of new data, the assessment of these data is still ongoing and improvements in
emission estimates are expected for the next years.
Emission factors used in 1990 estimates generally derive from Guidebook EMEP/CORINAIR.
The remaining categories of metal production industry represent less than 2% for each pollutant.
Other production (2G – 2H – 2L)
In 2H sector, non-energy emissions from pulp and paper as well as food and drink production, especially
wine and bread, are reported. Lead emissions from batteries manufacturing can be found in 2L sector. 2G
sector includes NMVOC emissions due to the use of lubricants.
Emissions from these categories are usually negligible except NMVOC emissions from food and drink
(2H2) accounting for 2.6% of the national total in 2015. Emissions from this category refer to the processes
in the production of bread, wine, beer and spirits. Activity data are derived from official statistics supplied by
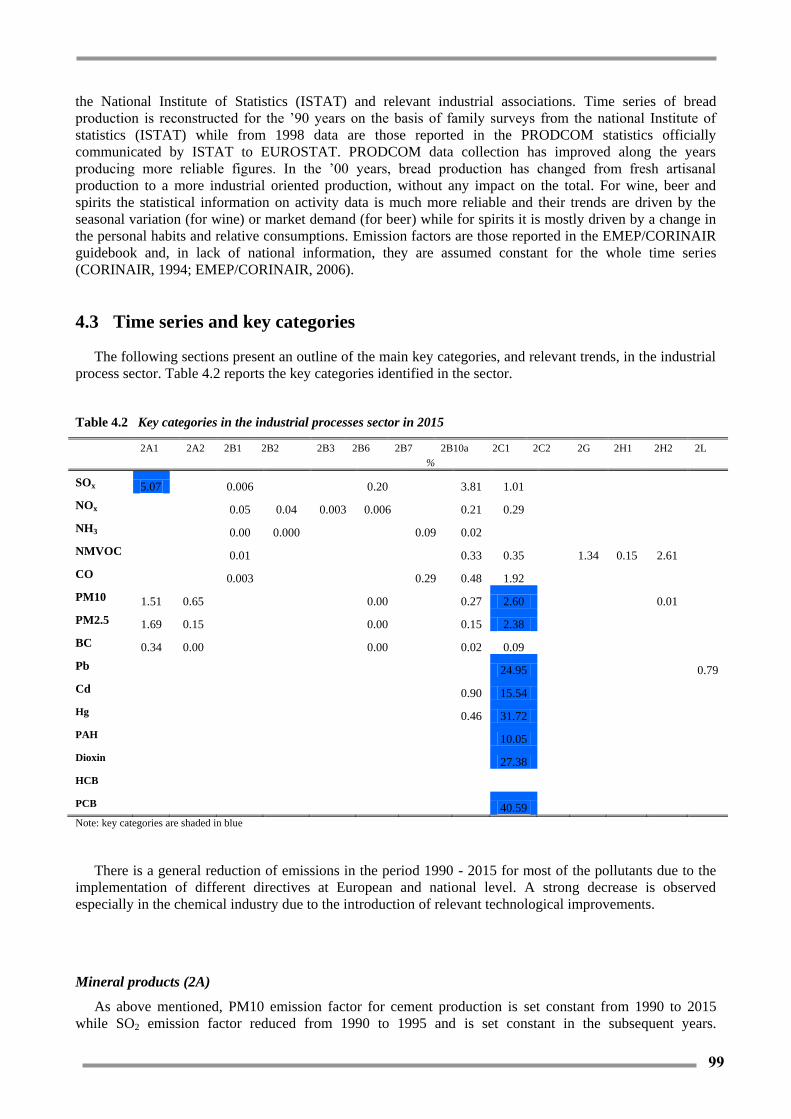
99
the National Institute of Statistics (ISTAT) and relevant industrial associations. Time series of bread
production is reconstructed for the ’90 years on the basis of family surveys from the national Institute of
statistics (ISTAT) while from 1998 data are those reported in the PRODCOM statistics officially
communicated by ISTAT to EUROSTAT. PRODCOM data collection has improved along the years
producing more reliable figures. In the ’00 years, bread production has changed from fresh artisanal
production to a more industrial oriented production, without any impact on the total. For wine, beer and
spirits the statistical information on activity data is much more reliable and their trends are driven by the
seasonal variation (for wine) or market demand (for beer) while for spirits it is mostly driven by a change in
the personal habits and relative consumptions. Emission factors are those reported in the EMEP/CORINAIR
guidebook and, in lack of national information, they are assumed constant for the whole time series
(CORINAIR, 1994; EMEP/CORINAIR, 2006).
4.3 Time series and key categories
The following sections present an outline of the main key categories, and relevant trends, in the industrial
process sector. Table 4.2 reports the key categories identified in the sector.
Table 4.2 Key categories in the industrial processes sector in 2015
2A1 2A2 2B1 2B2 2B3 2B6 2B7 2B10a 2C1 2C2 2G 2H1 2H2 2L
%
SOx 5.07 0.006 0.20 3.81 1.01
NOx 0.05 0.04 0.003 0.006 0.21 0.29
NH3 0.00 0.000 0.09 0.02
NMVOC 0.01 0.33 0.35 1.34 0.15 2.61
CO 0.003 0.29 0.48 1.92
PM10 1.51 0.65 0.00 0.27 2.60 0.01
PM2.5 1.69 0.15 0.00 0.15 2.38
BC 0.34 0.00 0.00 0.02 0.09
Pb 24.95 0.79
Cd 0.90 15.54
Hg 0.46 31.72
PAH 10.05
Dioxin 27.38
HCB
PCB 40.59
Note: key categories are shaded in blue
There is a general reduction of emissions in the period 1990 - 2015 for most of the pollutants due to the
implementation of different directives at European and national level. A strong decrease is observed
especially in the chemical industry due to the introduction of relevant technological improvements.
Mineral products (2A)
As above mentioned, PM10 emission factor for cement production is set constant from 1990 to 2015
while SO2 emission factor reduced from 1990 to 1995 and is set constant in the subsequent years.
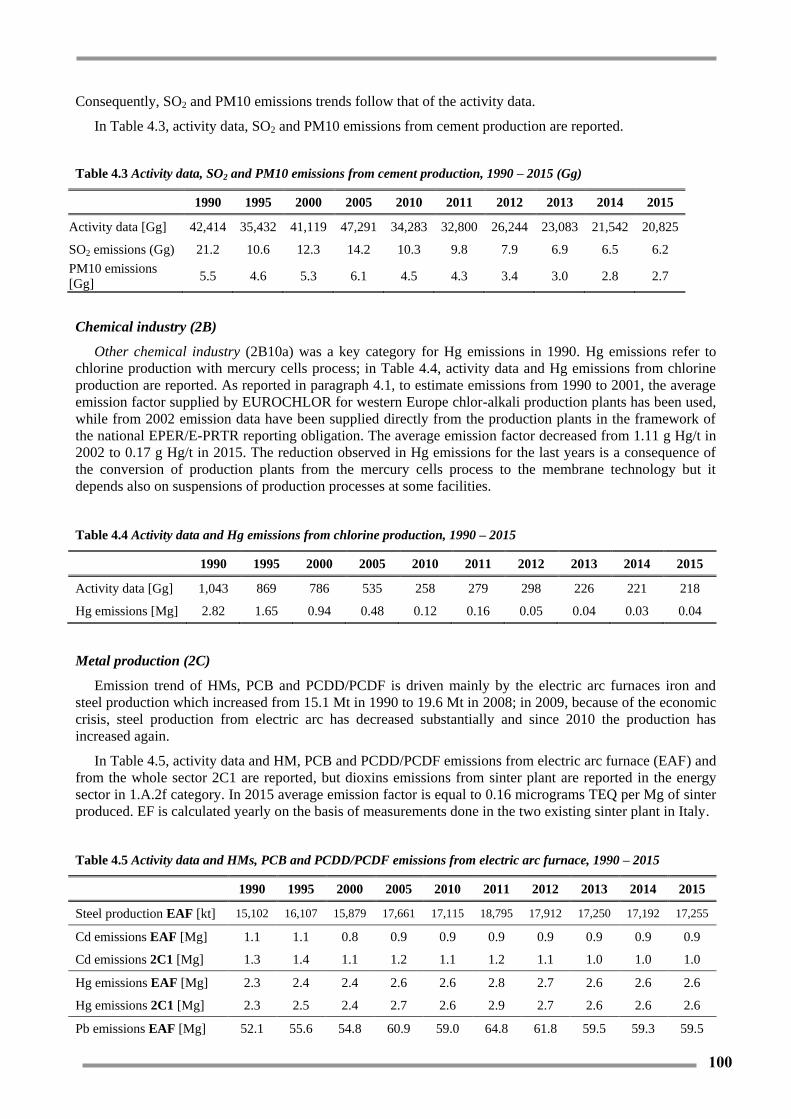
100
Consequently, SO2 and PM10 emissions trends follow that of the activity data.
In Table 4.3, activity data, SO2 and PM10 emissions from cement production are reported.
Table 4.3 Activity data, SO2 and PM10 emissions from cement production, 1990 – 2015 (Gg)
1990 1995 2000 2005 2010 2011 2012 2013 2014 2015
Activity data [Gg] 42,414 35,432 41,119 47,291 34,283 32,800 26,244 23,083 21,542 20,825
SO2 emissions (Gg) 21.2 10.6 12.3 14.2 10.3 9.8 7.9 6.9 6.5 6.2
PM10 emissions
[Gg] 5.5 4.6 5.3 6.1 4.5 4.3 3.4 3.0 2.8 2.7
Chemical industry (2B)
Other chemical industry (2B10a) was a key category for Hg emissions in 1990. Hg emissions refer to
chlorine production with mercury cells process; in Table 4.4, activity data and Hg emissions from chlorine
production are reported. As reported in paragraph 4.1, to estimate emissions from 1990 to 2001, the average
emission factor supplied by EUROCHLOR for western Europe chlor-alkali production plants has been used,
while from 2002 emission data have been supplied directly from the production plants in the framework of
the national EPER/E-PRTR reporting obligation. The average emission factor decreased from 1.11 g Hg/t in
2002 to 0.17 g Hg/t in 2015. The reduction observed in Hg emissions for the last years is a consequence of
the conversion of production plants from the mercury cells process to the membrane technology but it
depends also on suspensions of production processes at some facilities.
Table 4.4 Activity data and Hg emissions from chlorine production, 1990 – 2015
1990 1995 2000 2005 2010 2011 2012 2013 2014 2015
Activity data [Gg] 1,043 869 786 535 258 279 298 226 221 218
Hg emissions [Mg] 2.82 1.65 0.94 0.48 0.12 0.16 0.05 0.04 0.03 0.04
Metal production (2C)
Emission trend of HMs, PCB and PCDD/PCDF is driven mainly by the electric arc furnaces iron and
steel production which increased from 15.1 Mt in 1990 to 19.6 Mt in 2008; in 2009, because of the economic
crisis, steel production from electric arc has decreased substantially and since 2010 the production has
increased again.
In Table 4.5, activity data and HM, PCB and PCDD/PCDF emissions from electric arc furnace (EAF) and
from the whole sector 2C1 are reported, but dioxins emissions from sinter plant are reported in the energy
sector in 1.A.2f category. In 2015 average emission factor is equal to 0.16 micrograms TEQ per Mg of sinter
produced. EF is calculated yearly on the basis of measurements done in the two existing sinter plant in Italy.
Table 4.5 Activity data and HMs, PCB and PCDD/PCDF emissions from electric arc furnace, 1990 – 2015
1990 1995 2000 2005 2010 2011 2012 2013 2014 2015
Steel production EAF [kt] 15,102 16,107 15,879 17,661 17,115 18,795 17,912 17,250 17,192 17,255
Cd emissions EAF [Mg] 1.1 1.1 0.8 0.9 0.9 0.9 0.9 0.9 0.9 0.9
Cd emissions 2C1 [Mg] 1.3 1.4 1.1 1.2 1.1 1.2 1.1 1.0 1.0 1.0
Hg emissions EAF [Mg] 2.3 2.4 2.4 2.6 2.6 2.8 2.7 2.6 2.6 2.6
Hg emissions 2C1 [Mg] 2.3 2.5 2.4 2.7 2.6 2.9 2.7 2.6 2.6 2.6
Pb emissions EAF [Mg] 52.1 55.6 54.8 60.9 59.0 64.8 61.8 59.5 59.3 59.5

101
1990 1995 2000 2005 2010 2011 2012 2013 2014 2015
Pb emissions 2C1 [Mg] 61.1 65.7 64.1 71.0 66.5 73.4 69.9 65.4 65.0 63.7
PCB emissions EAF [kg] 54.4 58.0 57.2 63.6 61.6 67.7 64.5 62.1 61.9 62.1
PCB emissions 2C1 [kg] 91.7 100.0 95.8 105.7 92.7 103.4 98.1 86.7 85.4 79.3
PCDD/PCDF emissions
EAF [g T-eq] 67.2 71.7 70.7 78.6 76.2 83.6 79.7 76.8 76.5 76.8
PCDD/PCDF emissions
2C1 [g T-eq] 67.2 71.7 70.7 78.6 76.2 83.6 79.7 76.8 76.5 76.8
For Pb and Hg, the same EFs have been used for the whole time series (derived by the EMEP/CORINAIR
Guidebook), while for Cd a national emission factor, equal to 50 mg/t, was available thanks to a sectoral
study (APAT, 2003) and refers to the years after 1997.
This study shows range < 1-54 mg/t and the value set to 50 mg/t was chosen for conservative reason
being more consistent with the old one; this value should include technology progresses occurred in the iron
and steel production activities in those years. In lack of information for the years backwards, the default
CORINAIR EF was used.
For PCB and PCDD/PCDF, emission factors are constant from 1990 to 2015 and emission trends are
ruled by activity data.
Following the decision 2012/17 of the Executive Body of the Convention on Long Range Transboundary
Air Pollution, that requests Italy to submit information concerning the status and details of its work to
improve the emission inventory of PAH, Italy in recent years has reviewed the estimates regarding PAH
major sources. In the 2013 submission different recalculations have been performed in the energy and waste
sector, emissions from iron and steel production have been revised in the 2014 submission. The most
important update regards pig iron tapping emission factor considering, since 2000, the abatement due to
fabric filters and the relevant EF derived from the Guidebook EMEP/CORINAIR 2006 (0.95 g/Mg).
Investigations on the largest integrated plant in Italy confirmed the installation of fabric filters on each point
of emission related to pig iron tapping (MATTM, 2011). As regards EAF too, EF has been update on the
basis of a sectoral study (APAT, 2003) which reports the development of abatement technologies in the ‘90s
in Italy and the consequent evolution in the plants with the installation of fabric filters; but in this case the
update is referred to 1990-1999 because the EF used in previous submissions concerned already abated
emissions.
In Table 4.6, activity data and PAH emissions from integrated plants and from the whole sector 2C1 are
reported.
Table 4.6 Steel production data and PAH emissions from integrated plants, 1990 – 2015
1990 1995 2000 2005 2010 2011 2012 2013 2014 2015
Pig iron production
[Gg] 11,852 11,678 11,209 11,424 8,555 9,837 9,424 6,933 6,434 5,051
Steel production
BOF [Gg] 10,365 11,664 10,744 11,688 8,635 9,940 9,345 6,830 6,523 4,763
PAH emissions i.p.*
[Mg] 41.9 41.3 11.7 12.1 9.2 10.5 10.1 7.6 7.1 5.8
PAH emissions 2C1
[Mg] 44.9 44.5 14.3 15.1 11.9 13.5 13.0 10.2 9.7 8.2
*i.p.: integrated plants
Other production (2G – 2H – 2L)
Emissions from these categories are usually negligible except for NMVOC emissions from food and

102
drink (2H2) accounting for 2.6% of the national total. Emissions from this category refer to the processes in
the production of bread, wine, beer and spirits. Emission factors are assumed constant for the whole time
series. In Table 4.7, activity data and NMVOC emissions from sector 2H2 are reported.
Table 4.7 Activity data and NMVOC emissions from sector 2H2, 1990 – 2015
1990 1995 2000 2005 2010 2011 2012 2013 2014 2015
Activity data - Bread [Gg] 4,153 3,882 3,565 4,109 4,161 3,737 3,764 3,486 3,423 3,391
Activity data – Wine [106 dm3] 5,521 5,620 5,409 5,057 4,673 4,270 4,107 4,797 4,209 4,936
Activity data – Beer [106 dm3] 1,215 1,199 1,258 1,280 1,281 1,341 1,348 1,326 1,352 1,402
Activity data – Spirits [106
dm3] 268 232 206 161 115 103 102 92 98 98
NMVOC emissions [Gg] 31.7 29.2 26.8 27.5 25.9 23.3 23.3 22.1 21.7 22.0
4.4 QA/QC and verification
Activity data and emissions reported under EU-ETS and the national EPER/EPRTR register are compared
to the information provided by the industrial associations. The general outcome of this verification step
shows consistency among the information collected under different legislative frameworks and information
provided by the relevant industrial associations.
Every five years emissions are disaggregated at regional and provincial level and figures are compared
with results obtained by regional bottom up inventories. PM10 emissions disaggregated at local level are also
used as input for air quality modelling. The distribution of PM10 emissions from the industrial processes
sector at NUTS3 level for 2010 is reported in Figure 4.1; methodologies are described in the relevant
publication (ISPRA, 2009).

103
Figure 4.1 PM10 emissions from industrial processes in 2010 (t)
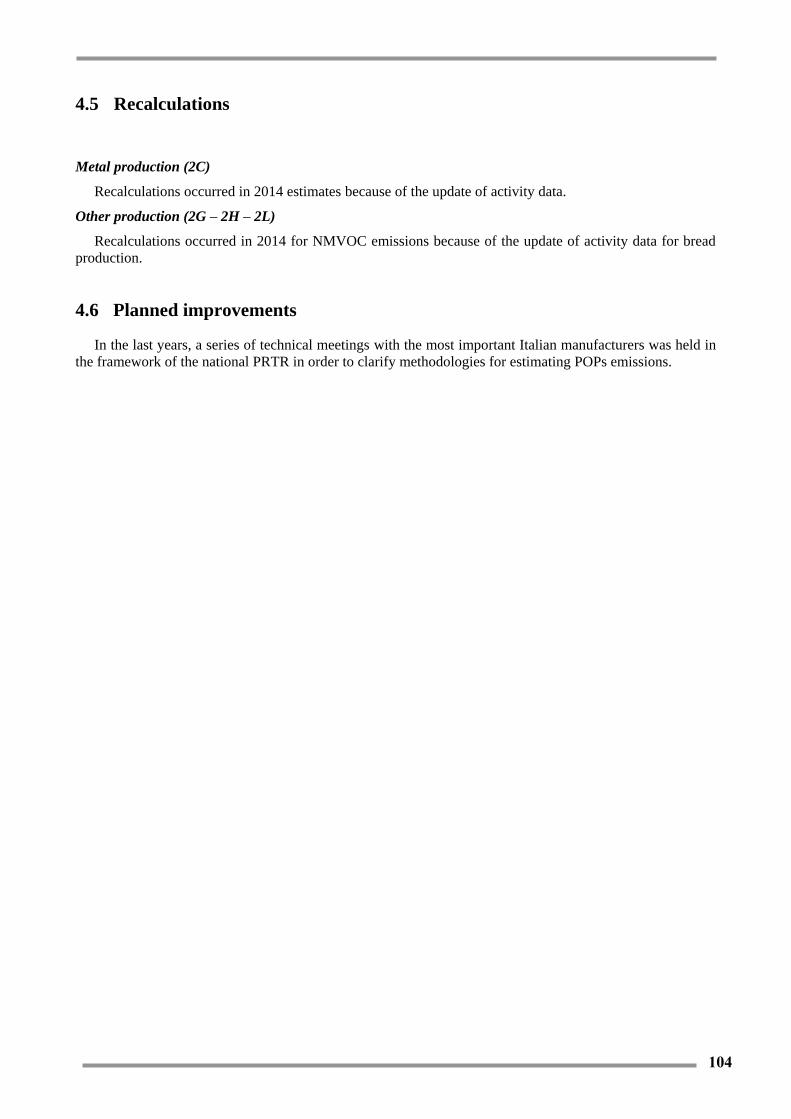
104
4.5 Recalculations
Metal production (2C)
Recalculations occurred in 2014 estimates because of the update of activity data.
Other production (2G – 2H – 2L)
Recalculations occurred in 2014 for NMVOC emissions because of the update of activity data for bread
production.
4.6 Planned improvements
In the last years, a series of technical meetings with the most important Italian manufacturers was held in
the framework of the national PRTR in order to clarify methodologies for estimating POPs emissions.
105
5 IPPU - SOLVENT AND OTHER PRODUCT USE (NFR SECTOR 2)
5.1 Overview of the sector
In this sector all non combustion emissions from other industrial sectors than manufacturing and energy
industry are reported.
Emissions are related to the use of solvent in paint application, degreasing and dry cleaning, chemical
products, manufacture and processing and other solvent use, including emissions from road paving with
asphalt and asphalt roofing activities.
NMVOC emissions are estimated from all the categories of the sector as well as PM for polyester and
polyvinylchloride processing, in the chemical product category, and for asphalt processes and PAH
emissions from the preservation of wood in the other solvent use.
The categories included in the sector are specified in the following.
2D3a Domestic solvent use includes emissions from the use of solvent in household cleaning and
car care products as well as cosmetics.
2D3b Road paving with asphalt includes emissions from the production and use of asphalt for
road paving.
2D3c Asphalt roofing includes emissions from the manufacturing of roofing products and the
blowing of asphalt.
2D3d1 Decorative coating includes emissions from paint application for construction and
buildings, domestic use and wood products.
2D3d2 Industrial coating includes emissions from paint application for manufacture of
automobiles, car repairing, coil coating, boat building and other industrial paint application.
2D3e Degreasing includes emissions from the use of solvents for metal degreasing and cleaning.
2D3f Dry cleaning includes emissions from the use of solvent in cleaning machines.
2D3g Chemical products, manufacture and processing covers the emissions from the use of
chemical products such as polyurethane and polystyrene foam processing, manufacture of paints,
inks and glues, textile finishing and leather tanning.
2D3h Printing includes emissions from the use of solvent in the printing industry
2D3i Other product use addresses emissions from glass wool enduction, printing industry, fat,
edible and non-edible oil extraction, preservation of wood, application of glues and adhesives,
vehicles dewaxing.
No other emissions from the sector occur.
NMVOC emissions from 2D3a, 2D3d, 2D3g and 2D3i are key categories in 2015; the same categories
were also key categories in 1990. For the trend 1990-2015, 2D3a, 2D3d and 2D3g result as key categories.
The sector accounts, in 2015, for 42.6% of total national NMVOC emissions, whereas in 1990 the weight
out of the total was equal to 31.7%. Total sectoral NMVOC emissions decreased by 41.6%, between 1990
and 2015.
PM, BC and PAH emissions are also estimated but they account for less than 1%.
In Figure 5.1 the share of NMVOC emissions of the sector is reported for the years 1990 and 2015.

106
Figure 5.1 Share of NMVOC emissions for the solvent use sector in 1990 and 2015
5.2 Methodological issues
The sector is characterized by a multitude of activities which implies that the collection of activity data
and emission factors is laborious. A lot of contacts have been established in different sectors with industrial
associations and documentation has been collected even though improvements are still needed especially in
some areas.
Emissions of NMVOC from solvent use have been estimated according to the methodology reported in
the EMEP/EEA guidebook, applying both national and international emission factors (Vetrella, 1994;
EMEP/CORINAIR, 2007; EMEP/EEA, 2016). Country specific emission factors provided by several
accredited sources have been used extensively, together with data from the national EPER/PRTR registry; in
particular, for paint application (Offredi, several years; FIAT, several years), solvent use in dry cleaning
(ENEA/USLRMA, 1995), solvent use in textile finishing and in the tanning industries (Techne, 1998;
Regione Toscana, 2001; Regione Campania, 2005; GIADA, 2006). Basic information from industry on
percentage reduction of solvent content in paints and other products has been applied to EMEP/EEA
emission factors in order to evaluate the reduction in emissions during the considered period.
A more detailed description is reported for the key categories of NMVOC emissions in the following
sections.
Domestic solvent use (2D3a)
The category comprises a lot of subcategories whose emissions, specifically NMVOC, originate from the
use of solvent in household cleaning and car care products as well as cosmetics.
Emissions from this category have been calculated using a detailed methodology, based on VOC content
per type of consumer product. Emissions from domestic solvent use comprise emissions from the use of
products for household and cleaning and for cosmetics which are derived as described in the following.
Activity data
Activity data are expressed as the sum, in tonnes, of household and cleaning products and cosmetics.
Household and cleaning products: data are communicated by the National Association of Detergents and
Specialties for industry and home care (Assocasa, several years) either by personal communications or
2 D 3 a
19%
2 D 3 d1
14%
2 D 3 d2
30%
2 D 3 e
8%
2 D 3 f
1%
2 D 3 g
13%
2 D 3 h
3%
Other
12%
1990
2 D 3 a
22%
2 D 3 d1
23%
2 D 3 d2
24%
2 D 3 e
4%
2 D 3 f
1%
2 D 3 g
14%
2 D 3 h
4%
Other
8%
2015

107
Association Reports and refer to the consumption of soaps and detergents and cleaning and maintenance
products.
Cosmetics: data are the sum of cosmetics products in aerosol form and other cosmetics.
Figures of cosmetics in aerosol form are provided by the Italian Aerosol Association (AIA, several years
a and b) and refer to the number of pieces of products sold for personal care (spray deodorants, hair
styling foams and other hair care products, shaving foams, and other products). These figures are then
converted in tonnes by means of the capacity of the different cosmetics containers.
Figures for other cosmetics products are derived by the Production Statistics Database (Prodcom)
supplied by the National Institute of Statistics (ISTAT, several years a and b) by difference with the
previous aerosol data.
Time series of cosmetics production is reconstructed by means of the annual production index,
considering the year 2000 as the base year because this is the year where production national statistics and
Prodcom data coincide. The next step is the calculation of apparent consumption taking into account import-
export data derived by the National Association of Cosmetic Companies (UNIPRO, several years). Since
these figures also include aerosol cosmetics, the amount of aerosol cosmetics is subtracted.
Final consumption is therefore estimated.
Emission factors
NMVOC emission factors are expressed in percentage of solvent contained in products.
Household and cleaning products: figures are communicated by the relevant industrial association,
ASSOCASA, by personal communications. For leather, shoes, wood etc. and car maintenance products,
figures are taken from BiPro Association. For insecticides and disinfectants, emission factors derive from
national studies at local level.
Cosmetics: for aerosol cosmetics, the emission factor is communicated by the Italian Aerosol Association
for the year 2004, and supposed constant from 1995. For other cosmetics, information from BiPro has been
considered (EC report 'Screening study to identify reductions in VOC emissions due to the restrictions in the
VOC content of products', year 2002 (EC, 2002)), and supposed constant from 1996.
Decorative coating (2D3d1)
The category includes NMVOC emissions from the application of paint for construction and buildings,
domestic use and wood products.
Activity data on the consumption of paint for construction and buildings and related domestic use are
provided by the Ministry of Productive Activities for 1990 and 1991 (MICA, 1999) and updated on the basis
of production figures provided annually by the National Institute of Statistics (ISTAT, several years [a] and
[b] ).
From 2007 onwards, data are also provided by SSOG (Stazione Sperimentale per le industrie degli Oli e
dei Grassi, Experimental Station for Oils and Fats Industries), which collects information and data regarding
national production and imports for paint categories set out in the directive 2004/42/EC on the limitation of
emissions of volatile organic compounds due to the use of organic solvents in certain paints and varnishes
and vehicle refinishing products. The purpose of this directive is to limit the total content of VOCs in certain
paints and varnishes and vehicle refinishing products in order to prevent or reduce air pollution resulting
from the contribution of VOCs to the formation of tropospheric ozone. The directive sets maximum VOCs
content limit values for some paints and varnishes.
As for emission factors, those for construction and buildings are taken from the EMEP/EEA guidebook
and are considered constant till 2009, whereas the default values for domestic use vary in consideration of
the different share between solvent and water content in paint throughout the years. In particular, the
variation of emission factor from 1990 to 2000 is equal to 35%-65% up to 25%-75% in 2000, on the basis of
qualitative information supplied by industry on the increase of water based paints products in the market.

108
From 2010, emission factors are calculated taking into account maximum VOC content limit values for paint
and varnishes set out in Annex II A of Directive 2004/42/EC and data collected by SSOG. The comparison
of national emission estimates for this category with those produced by IIASA for 2010 resulted in similar
values.
On the other hand, information on activity data and emission factors for emissions from wood products
are provided by the national association of wood finishing (Offredi, several years). Emission factors have
been calculated for 1990, 1998 and 2003 on the basis of information provided by the industrial association
distinguishing the different type of products which contain different solvent percentages. Data have been
supplied also for the years 2005 and 2006. Actually, we are keeping constant the 2006 value unless the
association provides us with updated information. For previous years, values have been interpolated.
In this category, emissions from paint application in wood are one of the biggest contributors to national
NMVOC emissions and the relevant share has grown considerably in recent years. NMVOC emissions due
to the use of paint and other products except from industrial coating could not be controlled properly in the
past since the EU Directive 2004/42/EC entered into force. This directive, transposed in Italian legislation in
2004, sets out maximum VOC content for many paint, varnishes and vehicle refinishing products that had to
be achieved in two steps. The early limit values, to be respected from 2007 till 2009, did not lead to a
significant reduction of NMVOC emissions, while the latest values, that had to be respected from 2010
onwards, brought to a significant decrease.
Industrial coating (2D3d2)
The category includes emissions from paint application for manufacture of automobiles, car repairing,
coil coating, boat building and other industrial paint application.
Activity data on the number of vehicles are provided by the National Automobile Association (ACI,
several years) in the Annual Statistical Report and the emission factors are those reported by the main
automobile producers on the relevant activity in their environmental reports and communicated from 2003 in
the framework of E-PRTR.
For the paint used in car repairing, activity data are provided by the Ministry of Productive Activities for
1990 and 1991 (MICA, 1999) and updated on the basis of production figures provided annually by the
National Institute of Statistics (ISTAT, several years [a] and [b]). The default emission factor (provided by
the EMEP guidebook) used from 1990 to 1995 equal to 700 g/kg paint is also confirmed by the European
guidelines for car repairing provided by the Conseil Europeen de l’Industrie des Peintures (CEPE, 1999).
The reduction of the emission factor in 1999 (13% of 1995) is applied on the basis of information on
different shares between solvent and water based paint throughout the years provided by the national study
PINTA (Piano nazionale di tutela della qualità dell’aria, ENEA 1997). From 1996 to 1999 the reduction is
linear. From 1999 to 2006 the value is kept constant. From 2007 onwards emission factors have been
calculated taking into account the maximum VOC content limit values for paint and varnishes set out in
Annex II B of Directive 2004/42/EC and data collected by SSOG.
Concerning coil coating, boat building and other industrial paint application, activity data are provided by
the Ministry of Productive Activities for 1990 and 1991 (MICA, 1999) and updated annually by the National
Institute of Statistics (ISTAT, several years [a] and [b]). Emission factors are taken from the EMEP
guidebook considering the national legislation where relevant.
Emission factors of the other industrial paint application from 1990 to 1995 are constant and derive from
the 1999 EMEP/CORINAIR guidebook. The reduction of the emission factor from 1996 to 2004 is applied
on the basis of information on different share of paints throughout the years provided by the national study
PINTA. From 2010, the value of the 1999 Guidebook has been chosen considering the further reduction of
the sector (in PINTA, the reduction for 2005 with respect to 1995 is equal to 37%, and for 2010 64%.
Considering the default emission factor 250 g/kg of paint, the reduction is equal to 53%).
NMVOC emissions from category 3A2 are decreasing constantly from the nineties, when all industrial
installations have been subjected to permits from local authorities. Since then, most of the installations have
to comply with emission limit values and technological requirements imposed at regional level, taking in
account the EU directives on industrial emissions (i.e. Directive 99/13/EC on the limitation of emissions of

109
volatile organic compounds due to the use of organic solvents in certain activities and installations (EC,
1999)) and often going beyond the European legislation.
With regard to car repairing the emission cut from 2007 onwards is mainly due to the maximum contents
of VOC set by EU Directive 2004/42/EC (EC, 2004).
Dry cleaning (2D3f)
Concerning dry cleaning, activity data, equal to 30,000 machines, remain unchanged throughout the time
series and the emission factor is calculated based on the allocation of machines to closed-circuit (CCM) and
open-circuit (OCM). Different amounts of solvent are used in these machines and have different emission
factors. The emission factors are calculated assuming that in 1990 the closed-circuit machines were 60%, in
1995 represented 90% and in 1999 up to 100%.
The average consumption of solvent per machine is equal to 258 kg/year for CCM and 763 kg/year for
OCM, as derived from a national study by ENEA/USL-RMA (ENEA/USL-RMA, 1995). It is assumed that
only perchlorethylene is used. These values are multiplied by the emission factors of the Guidebook EMEP,
expressed as kg of solvent consumed (equal to 0.4 and 0.8 kg/kg of solvent, for CCM and OCM,
respectively) and then the average annual emission factor was calculated based on the percentage distribution
of closed and open circuit machines.
Chemical products, manufacture and processing (2D3g)
The category comprises emissions from the use of chemical products such as polyester, polyurethane,
polyvinylchloride and polystyrene foam processing, manufacture of paints, inks and glues, textile finishing
and leather tanning.
Activity data for polystyrene and polyurethane are derived from the relevant industrial associations, and
ISTAT (ISTAT, several years [a] and [b]), whereas emission factors are from the EMEP/CORINAIR
guidebook. For what concerns polyurethane, the relevant national industrial association has communicated
that the phase out of CFC gases occurred in the second half of nineties and the blowing agent currently used
is penthane.
As for polyvinylchloride (PVC), activity data and emission factors are supplied in the framework of the
national PRTR. NMVOC emissions are entirely attributed to the phase of PVC production; no use of
solvents occurs in the PVC processing. This information has been provided by the relevant industrial plant,
EVC Italy, in 2001.
For the other categories, activity data are provided by the relevant industrial associations and by ISTAT,
while emission factors are taken from the EMEP/CORINAIR guidebook considering national information on
the solvent content in products supplied by the specific industrial associations.
As regard rubber processing, emission factors for the first years of nineties have been provided by the
industrial association. The use of the Swedish emission factor from 1997 was justified in lack of other
updated data.
For the glues manufacturing category, emission factors for 1990 are derived from the 1992
EMEP/CORINAIR guidebook. The trend of emission factor is estimated on the basis of the trend of the
emission factor for consumption of glue (as indicated by the industrial association). From 1995 to 2004, the
industrial association communicated data on consumption and solvent content by product. The reductions
from 2000 are based on the assumptions of PINTA. From 2004 the emission factor has been assumed
constant in lack of updated information. For previous years, values have been interpolated.
As regards leather tanning, emission factor for 1990 is from Legislative Decree 152/2006, equal to the
maximum VOC content limit value (150 g/m2). For 2000 and 2003, emission factors have been calculated
on the basis of emission figures derived by the national studies on the major leather tanning industries and
statistical production.

110
Other product use (2D3i)
The category includes NMVOC emissions from the application of glues and adhesives, which account for
about 90% of the emission from the category, emissions from fat, edible and non edible oil extraction and
minor emissions from glass wool enduction.
Activity data and emission factors for the application of glues and adhesives had been provided by the
relevant industrial association up to 2004. After that period, activity data have been updated on the basis of
information by ISTAT (ISTAT, several years [a] and [b]) whereas the emission factor is considered constant
in absence of further information.
For fat, edible and non edible oil extraction activity data derive from the FAOSTAT database
(http://faostat.fao.org) whereas default emission factors do not change over the period.
5.3 Time series and key categories
The sector accounts, in 2015, for about 42.6% of total national NMVOC emissions, whereas in 1990 the
weight out of the total was equal to 31.7%. PM, BC and PAH emissions are also estimated in this sector but
they account for less than 1%.
NMVOC emissions from the sector decreased from 1990 to 2015 of about 41.6%, from 604 Gg in 1990 to
353 Gg in 2015, mainly due to the reduction of emissions in paint application, in degreasing and dry cleaning
and in other product use. The general reduction observed in the emission trend of the sector is due to the
implementation of the European Directive 1999/13/EC (EC, 1999) on the limitation of emissions of volatile
organic compounds due to the use of organic solvents, entered into force in Italy in January 2004, and the
European Directive 2004/42/EC (EC, 2004), entered in force in Italy in March 2006, which establishes a
reduction of the solvent content in products. In 2015, specifically, the reduction of emissions from paint
application, which dropped by 38% as compared to 1990, is due to the implementation of the Italian
Legislative Decree 161/2006.
Figure 5.2 shows emission trends from 1991 to 2015 with respect to 1990 by sub-sector.
Figure 5.2 Trend of NMVOC emissions from 1991 to 2015 as compared to 1990
The main source of emissions is paint application (2D3d) where NMVOC emissions derive mainly from
wood application and construction and building. The second source of emissions is domestic solvent use
(2D3a), mostly for the consumption of cosmetics, followed by chemical products and other product use
(2D3g), especially for emissions deriving from polyurethane processing, paints manufacturing and leather
tanning.
Table 5.1 represents the pollutants estimated in the sector and the key categories identified.
-80%
-60%
-40%
-20%
0%
20%
40%
19
91
19
92
19
93
19
94
19
95
19
96
19
97
19
98
19
99
20
00
20
01
20
02
20
03
20
04
20
05
20
06
20
07
20
08
20
09
20
10
20
11
20
12
20
13
20
14
20
15
Paint application Degreasing and dry cleaning Chemical products Other
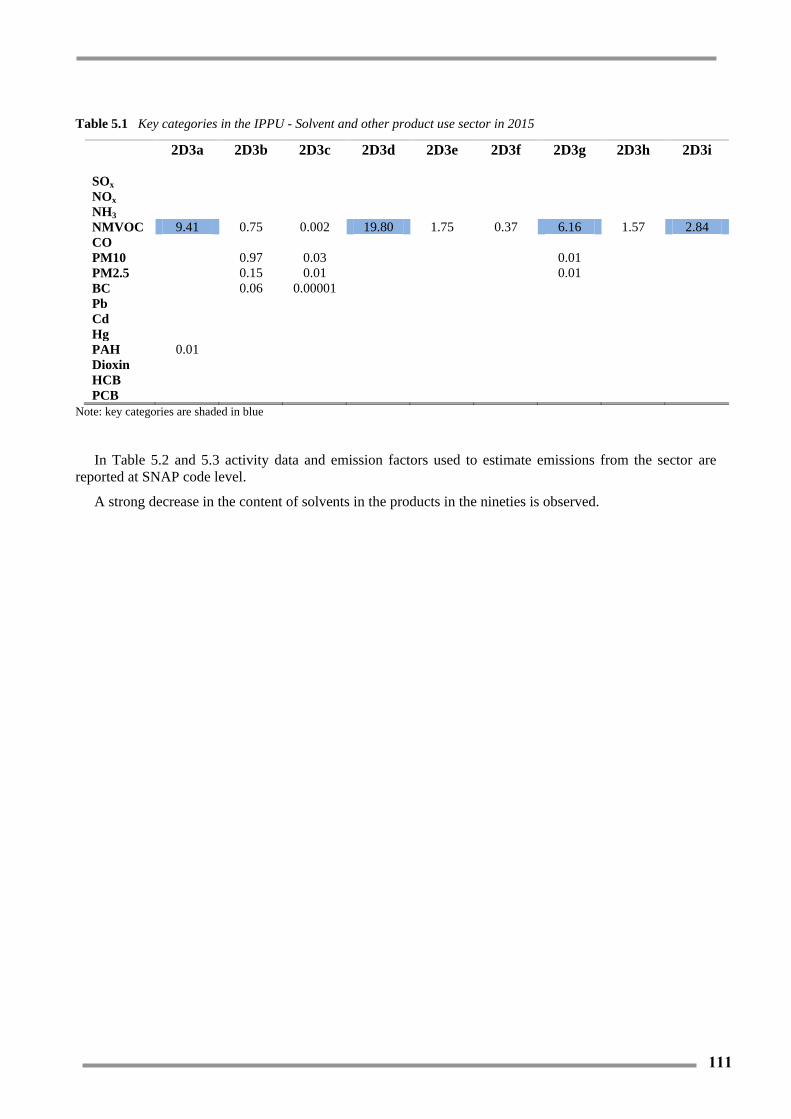
111
Table 5.1 Key categories in the IPPU - Solvent and other product use sector in 2015
2D3a 2D3b 2D3c 2D3d 2D3e 2D3f 2D3g 2D3h 2D3i
SOx
NOx
NH3
NMVOC 9.41 0.75 0.002 19.80 1.75 0.37 6.16 1.57 2.84
CO
PM10 0.97 0.03 0.01
PM2.5 0.15 0.01 0.01
BC 0.06 0.00001
Pb
Cd
Hg
PAH 0.01
Dioxin
HCB
PCB
Note: key categories are shaded in blue
In Table 5.2 and 5.3 activity data and emission factors used to estimate emissions from the sector are
reported at SNAP code level.
A strong decrease in the content of solvents in the products in the nineties is observed.

112
Table 5.2 Activity data in the IPPU - Solvent and other product use sector
1990 1995 2000 2005 2010 2015
06 01 Paint application
06 01 01 Paint application : manufacture of automobiles vehicles 2,865,857 2,521,355 2,770,104 1,766,930 1,310,425 1,323,107
06 01 02 Paint application : car repairing Mg paint 22,250 17,850 24,276 23,475 18,545 23,901
06 01 03 Paint application : construction and buildings (except item 06.01.07) Mg paint 111,644 120,736 125,928 163,455 168,358 158,661
06 01 04 Paint application : domestic use (except 06.01.07) Mg paint 420,000 420,000 420,000 420,000 420,000 420,000
06 01 05 Paint application : coil coating Mg paint 14,500 14,500 14,500 14,500 14,500 14,500
06 01 06 Paint application : boat building Mg paint 10,000 10,000 10,000 10,000 10,000 10,000
06 01 07 Paint application : wood Mg paint 150,000 150,000 140,000 140,000 123,250 80,000
Other industrial paint application Mg paint 125,000 125,000 125,000 125,000 125,000 125,000
06 02 Degreasing, dry cleaning and electronics
06 02 01 Metal degreasing Mg solvents 52,758 32,775 25,895 22,237 19,095 16,398
06 02 02 Dry cleaning machines 30,000 30,000 30,000 30,000 30,000 30,000
06 03 Chemical products manufacturing or processing
06 03 01 Polyester processing Mg product 179,852 197,882 168,704 112,188 89,638 94,389
06 03 02 Polyvinylchloride processing Mg product 617,600 575,600 405,285 348,497 0 0
06 03 03 Polyurethane processing Mg product 145,700 230,633 350,187 175,278 196,585 196,585
06 03 04 Polystyrene foam processing (c) Mg product 85,004 80,400 90,200 35,200 33,692 46,800
06 03 05 Rubber processing Mg product 671,706 700,859 810,124 831,187 607,667 545,989
06 03 06 Pharmaceutical products manufacturing Mg product 80,068 88,094 104,468 106,861 110,183 120,904
06 03 07 Paints manufacturing Mg product 697,129 747,417 900,683 964,631 891,882 866,285
06 03 08 Inks manufacturing Mg product 87,527 110,667 132,256 132,521 133,979 108,600
06 03 09 Glues manufacturing Mg product 111,683 266,169 302,087 331,770 317,560 249,152
06 03 10 Asphalt blowing Mg product 77,248 70,336 77,408 88,896 65,000 25,000
06 03 12 Textile finishing 1000 m2 1,332,679 1,301,105 1,173,047 987,705 831,236 631,573
06 03 13 Leather tanning 1000 m2 173,700 183,839 200,115 157,891 186,824 162,500
06 04 Other use of solvents and related activities
06 04 01 Glass wool enduction Mg product 105,029 119,120 139,421 129,958 115,923 88,658
06 04 02 Mineral wool enduction Mg product 0 11,000 18,000 20,500 0 0
06 04 03 Printing industry Mg ink 73,754 91,667 100,690 111,550 98,206 88,029
06 04 04 Fat, edible and non edible oil extraction Mg product 5,070,398 7,560,387 6,539,796 7,939,548 7,088,890 5,185,738
06 04 05 Application of glues and adhesives Mg product 98,500 234,751 266,996 292,687 280,150 219,801
06 04 08 Domestic solvent use (other than paint application)(k) Mg product 1,938,779 2,282,020 2,410,338 2,767,759 2,614,274 2,275,335
06 04 09 Vehicles dewaxing vehicles 2,540,597 1,740,212 2,361,075 2,238,344 1,972,070 1,594,259
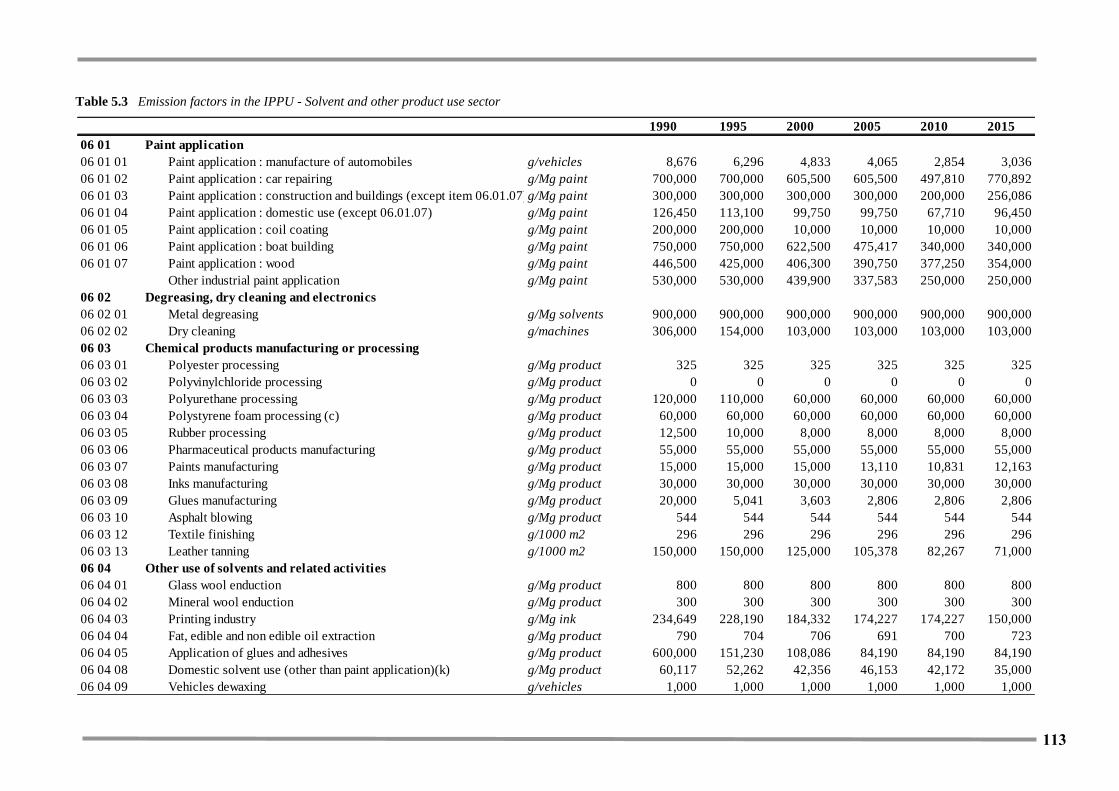
113
Table 5.3 Emission factors in the IPPU - Solvent and other product use sector
1990 1995 2000 2005 2010 2015
06 01 Paint application
06 01 01 Paint application : manufacture of automobiles g/vehicles 8,676 6,296 4,833 4,065 2,854 3,036
06 01 02 Paint application : car repairing g/Mg paint 700,000 700,000 605,500 605,500 497,810 770,892
06 01 03 Paint application : construction and buildings (except item 06.01.07) g/Mg paint 300,000 300,000 300,000 300,000 200,000 256,086
06 01 04 Paint application : domestic use (except 06.01.07) g/Mg paint 126,450 113,100 99,750 99,750 67,710 96,450
06 01 05 Paint application : coil coating g/Mg paint 200,000 200,000 10,000 10,000 10,000 10,000
06 01 06 Paint application : boat building g/Mg paint 750,000 750,000 622,500 475,417 340,000 340,000
06 01 07 Paint application : wood g/Mg paint 446,500 425,000 406,300 390,750 377,250 354,000
Other industrial paint application g/Mg paint 530,000 530,000 439,900 337,583 250,000 250,000
06 02 Degreasing, dry cleaning and electronics
06 02 01 Metal degreasing g/Mg solvents 900,000 900,000 900,000 900,000 900,000 900,000
06 02 02 Dry cleaning g/machines 306,000 154,000 103,000 103,000 103,000 103,000
06 03 Chemical products manufacturing or processing
06 03 01 Polyester processing g/Mg product 325 325 325 325 325 325
06 03 02 Polyvinylchloride processing g/Mg product 0 0 0 0 0 0
06 03 03 Polyurethane processing g/Mg product 120,000 110,000 60,000 60,000 60,000 60,000
06 03 04 Polystyrene foam processing (c) g/Mg product 60,000 60,000 60,000 60,000 60,000 60,000
06 03 05 Rubber processing g/Mg product 12,500 10,000 8,000 8,000 8,000 8,000
06 03 06 Pharmaceutical products manufacturing g/Mg product 55,000 55,000 55,000 55,000 55,000 55,000
06 03 07 Paints manufacturing g/Mg product 15,000 15,000 15,000 13,110 10,831 12,163
06 03 08 Inks manufacturing g/Mg product 30,000 30,000 30,000 30,000 30,000 30,000
06 03 09 Glues manufacturing g/Mg product 20,000 5,041 3,603 2,806 2,806 2,806
06 03 10 Asphalt blowing g/Mg product 544 544 544 544 544 544
06 03 12 Textile finishing g/1000 m2 296 296 296 296 296 296
06 03 13 Leather tanning g/1000 m2 150,000 150,000 125,000 105,378 82,267 71,000
06 04 Other use of solvents and related activities
06 04 01 Glass wool enduction g/Mg product 800 800 800 800 800 800
06 04 02 Mineral wool enduction g/Mg product 300 300 300 300 300 300
06 04 03 Printing industry g/Mg ink 234,649 228,190 184,332 174,227 174,227 150,000
06 04 04 Fat, edible and non edible oil extraction g/Mg product 790 704 706 691 700 723
06 04 05 Application of glues and adhesives g/Mg product 600,000 151,230 108,086 84,190 84,190 84,190
06 04 08 Domestic solvent use (other than paint application)(k) g/Mg product 60,117 52,262 42,356 46,153 42,172 35,000
06 04 09 Vehicles dewaxing g/vehicles 1,000 1,000 1,000 1,000 1,000 1,000
114
5.4 QA/QC and verification
Data production and consumption time series for some activities (paint application in constructions and
buildings, polyester processing, polyurethane processing, pharmaceutical products, paints manufacturing,
glues manufacturing, textile finishing, leather tanning, fat edible and non edible oil extraction, application of
glues and adhesives) are checked with data acquired by the National Statistics Institute (ISTAT, several
years a, b and c), the Sectoral Association of the Italian Federation of the Chemical Industry (AVISA,
several years) and the Food and Agriculture Organization of the United Nations (FAO, several years). For
specific categories, emission factors and emissions are also shared with the relevant industrial associations;
this is particularly the case of paint application for wood, some chemical processes and anaesthesia and
aerosol cans.
In the framework of the MeditAIRaneo project, ISPRA commissioned to Techne Consulting S.r.l. a
survey to collect national information on emission factors in the solvent sector. The results, published in the
report “Rassegna dei fattori di emissione nazionali ed internazionali relativamente al settore solventi”
(TECHNE, 2004), have been used to verify and validate emission estimates. In 2008, ISPRA commissioned
to Techne Consulting S.r.l. another survey to compare emission factors with the last update figures published
in the EMEP/CORINAIR guidebook (EMEP/CORINAIR, 2007). The results are reported in “Fattori di
emissione per l’utilizzo di solventi” (TECHNE, 2008) and have been used to update emission factors for
polyurethane and polystyrene foam processing activities.
In addition, for paint application, data communicated from the industries in the framework of the EU
Directive 2004/42, implemented by the Italian Legislative Decree 161/2006, on the limitation of emissions of
volatile organic compounds due to the use of organic solvents in certain paints and varnishes and vehicle
refinishing products have been used as a verification of emission estimates. These data refer to the
composition of the total amount of paints and varnishes (water and solvent contents) in different
subcategories for interior and exterior use and the total amount of products used for vehicle refinishing and
they are available from the year 2007.
Verifications of the emissions from the sector occurred in 2012, on account of the bilateral independent
review between Italy and Spain and the revision of national estimates and projections in the context of the
National emission ceilings Directive for the EU Member States and the Gothenburg Protocol of the
Convention on Long-Range Transboundary Air Pollution (CLRTAP). The analysis by category did not
highlight the need of major methodological revisions of the sector; an additional source of emissions was
added affecting only NMVOC emissions.
Furthermore, every five years ISPRA carries out emission estimates at NUTS level which is the occasion
of an additional check with local environmental agencies.
The distribution of NMVOC emissions from the solvent and other product use sector at NUTS3 level for
2010 is reported in Figure 5.3; methodologies are described in the relevant publication (ISPRA, 2009).
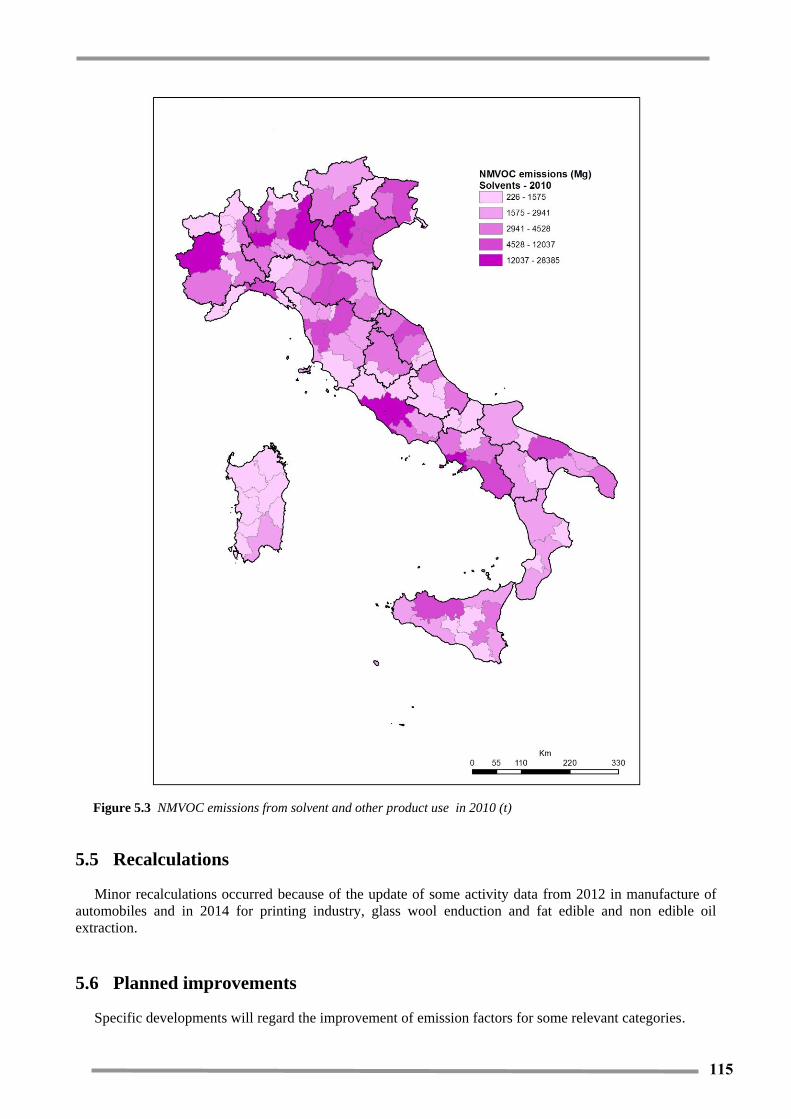
115 115
Figure 5.3 NMVOC emissions from solvent and other product use in 2010 (t)
5.5 Recalculations
Minor recalculations occurred because of the update of some activity data from 2012 in manufacture of
automobiles and in 2014 for printing industry, glass wool enduction and fat edible and non edible oil
extraction.
5.6 Planned improvements
Specific developments will regard the improvement of emission factors for some relevant categories.
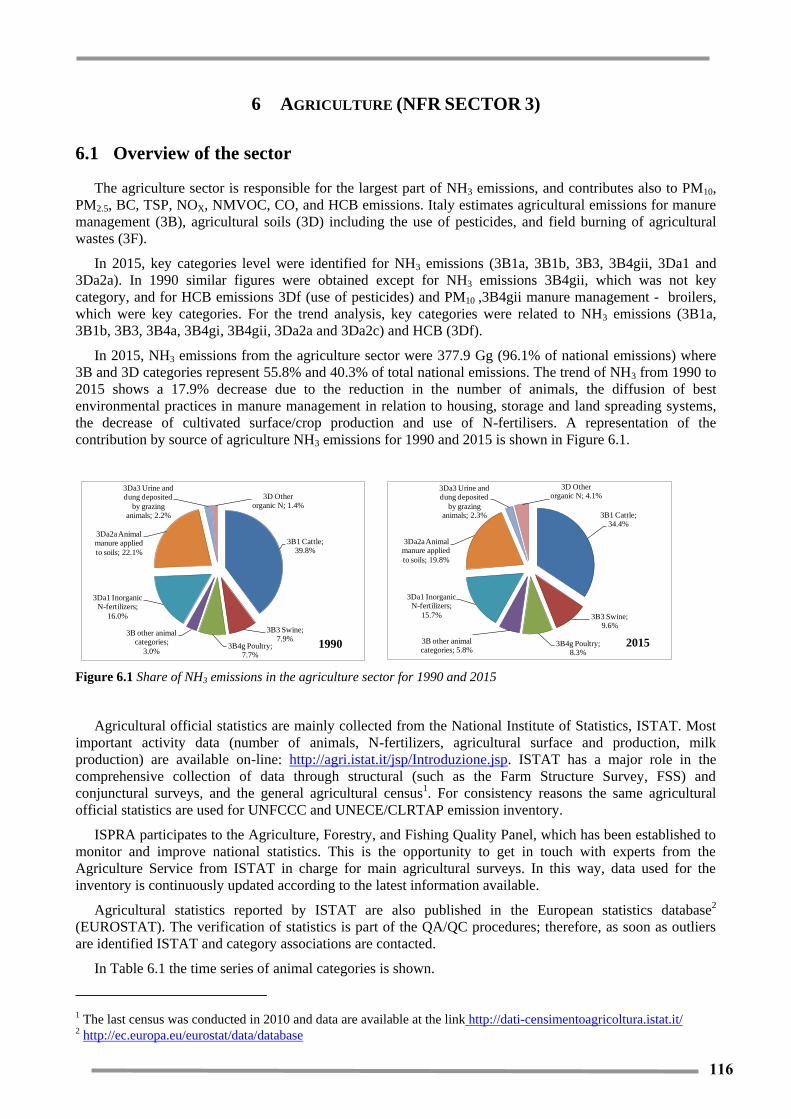
116 116
6 AGRICULTURE (NFR SECTOR 3)
6.1 Overview of the sector
The agriculture sector is responsible for the largest part of NH3 emissions, and contributes also to PM10,
PM2.5, BC, TSP, NOX, NMVOC, CO, and HCB emissions. Italy estimates agricultural emissions for manure
management (3B), agricultural soils (3D) including the use of pesticides, and field burning of agricultural
wastes (3F).
In 2015, key categories level were identified for NH3 emissions (3B1a, 3B1b, 3B3, 3B4gii, 3Da1 and
3Da2a). In 1990 similar figures were obtained except for NH3 emissions 3B4gii, which was not key
category, and for HCB emissions 3Df (use of pesticides) and PM10 ,3B4gii manure management - broilers,
which were key categories. For the trend analysis, key categories were related to NH3 emissions (3B1a,
3B1b, 3B3, 3B4a, 3B4gi, 3B4gii, 3Da2a and 3Da2c) and HCB (3Df).
In 2015, NH3 emissions from the agriculture sector were 377.9 Gg (96.1% of national emissions) where
3B and 3D categories represent 55.8% and 40.3% of total national emissions. The trend of NH3 from 1990 to
2015 shows a 17.9% decrease due to the reduction in the number of animals, the diffusion of best
environmental practices in manure management in relation to housing, storage and land spreading systems,
the decrease of cultivated surface/crop production and use of N-fertilisers. A representation of the
contribution by source of agriculture NH3 emissions for 1990 and 2015 is shown in Figure 6.1.
Figure 6.1 Share of NH3 emissions in the agriculture sector for 1990 and 2015
Agricultural official statistics are mainly collected from the National Institute of Statistics, ISTAT. Most
important activity data (number of animals, N-fertilizers, agricultural surface and production, milk
production) are available on-line: http://agri.istat.it/jsp/Introduzione.jsp. ISTAT has a major role in the
comprehensive collection of data through structural (such as the Farm Structure Survey, FSS) and
conjunctural surveys, and the general agricultural census1. For consistency reasons the same agricultural
official statistics are used for UNFCCC and UNECE/CLRTAP emission inventory.
ISPRA participates to the Agriculture, Forestry, and Fishing Quality Panel, which has been established to
monitor and improve national statistics. This is the opportunity to get in touch with experts from the
Agriculture Service from ISTAT in charge for main agricultural surveys. In this way, data used for the
inventory is continuously updated according to the latest information available.
Agricultural statistics reported by ISTAT are also published in the European statistics database2
(EUROSTAT). The verification of statistics is part of the QA/QC procedures; therefore, as soon as outliers
are identified ISTAT and category associations are contacted.
In Table 6.1 the time series of animal categories is shown.
1 The last census was conducted in 2010 and data are available at the link http://dati-censimentoagricoltura.istat.it/ 2 http://ec.europa.eu/eurostat/data/database
3B1 Cattle; 39.8%
3B3 Swine; 7.9%
3B4g Poultry; 7.7%
3B other animal categories;
3.0%
3Da1 Inorganic N-fertilizers;
16.0%
3Da2a Animal manure applied
to soils; 22.1%
3Da3 Urine and dung deposited
by grazing animals; 2.2%
3D Other organic N; 1.4%
1990
3B1 Cattle; 34.4%
3B3 Swine; 9.6%
3B4g Poultry; 8.3%
3B other animal categories; 5.8%
3Da1 Inorganic N-fertilizers;
15.7%
3Da2a Animal manure applied
to soils; 19.8%
3Da3 Urine and dung deposited
by grazing animals; 2.3%
3D Other organic N; 4.1%
2015

117 117
Table 6.1 Time series of animals
Year
Dairy cattle
Non-dairy
cattle Buffalo Sheep Goats Horses
Mules/a
sses Swine Rabbits Poultry
Fur
animals
heads
1990 2,641,755 5,110,397 94,500 8,739,253 1,258,962 287,847 83,853 6,949,091 14,893,771 173,341,562 325,121
1995 1,754,981 4,142,544 354,402 7,942,641 959,915 373,327 50,966 7,602,093 17,549,225 200,718,160 160,000
2000 2,641,755 5,110,397 94,500 8,739,253 1,258,962 287,847 83,853 6,949,091 14,893,771 173,341,562 325,121
2005 1,754,981 4,142,544 354,402 7,942,641 959,915 373,327 50,966 7,602,093 17,549,225 200,718,160 160,000
2010 2,641,755 5,110,397 94,500 8,739,253 1,258,962 287,847 83,853 6,949,091 14,893,771 173,341,562 325,121
2011 2,079,783 5,189,304 148,404 10,667,971 1,372,937 314,778 37,844 6,625,890 17,110,587 184,202,416 220,000
2012 2,065,000 4,988,000 192,000 11,089,000 1,375,000 280,000 33,000 6,828,000 17,873,993 176,722,211 230,000
2013 1,842,004 4,409,921 205,093 7,954,167 945,895 278,471 30,254 7,484,162 20,504,282 188,595,022 200,000
2014 1,746,140 4,086,317 365,086 7,900,016 982,918 373,324 46,475 7,588,658 17,957,421 198,346,719 125,000
2015 1,754,981 4,142,544 354,402 7,942,641 959,915 373,327 50,966 7,602,093 17,549,225 200,718,160 160,000
In Table 6.2 the nitrogen content of N-fertilisers by type applied to soils is shown together with the
differentiated EFs. Detailed figures for “other nitrogenous fertilizers” are reported from 1998 because
disaggregated official statistics from ISTAT were available only from that year (ENEA, 2006).
Table 6.2 Time series of N content by fertilisers and relevant emission factors
Type of fertilizers
Emission Nitrogen content (t N yr-1)
factor 1990 1995 2000 2005 2010 2011 2012 2013 2014 2015
Ammonium sulphate 10% 50,762 61,059 36,698 27,855 32,568 27,418 27,246 15,599 13,597 16,986
Calcium cyanamide 2% 3,310 507 3,003 2,357 4,958 4,675 4,408 4,164 3,091 3,046
Nitrate (*) 2% 157,221 189,907 164,134 167,872 72,833 72,334 103,606 72,930 92,569 91,357
Urea 15% 291,581 321,196 329,496 317,814 209,829 219,033 344,981 282,197 246,957 266,154
Other nitric nitrogen 2% - - 3,204 5,219 3,332 3,479 4,122 2,908 1,943 1,189
Other ammoniacal
nitrogen 2% - - 6,278 18,069 12,412 12,993 13,517 3,820 4,279 7,035
Other amidic
nitrogenous 15% - - 6,988 17,420 15,366 17,663 23,906 19,572 22,855 11,796
Phosphate nitrogen 5% 112,237 99,468 77,916 69,758 45,837 47,272 51,277 50,726 36,773 35,054
Potassium nitrogen 2% 3,937 2,876 5,291 12,289 15,955 17,758 16,720 24,322 8,922 9,077
NPK nitrogen 2% 138,018 101,528 113,897 106,384 64,462 65,444 75,142 48,097 48,979 50,174
Organic mineral 2% 444 20,960 38,688 34,809 19,085 27,897 18,641 22,209 25,161 25,986
Total 757,509 797,500 785,593 779,846 496,637 515,966 683,566 546,542 505,126 517,854
(*) includes ammonium nitrate < 27% and ammonium nitrate > 27% and calcium nitrate
6.2 Methodological issues
Methodologies used for estimating national emissions from this sector are based on and conform to the
EMEP/EEA Guidebook (EMEP/CORINAIR, 2007; EMEP/EEA, 2013; EMEP/EEA, 2016), the 2006 IPCC
Guidelines (IPCC, 1997; IPCC, 2006) and the IPCC Good Practice Guidance (IPCC, 2000). Consistency
among methodologies for the preparation of the agricultural emission inventory under the UNFCCC and
UNECE/CLRTAP is guaranteed through an operational synergy for activity data collection, inventory
preparation and reporting to international conventions and European Directives (Cóndor and De Lauretis,
2007). Information reported in the National Inventory Report/Common Reporting Format (NIR/CRF) for the
GHG inventory is coherent and consistent with information reported in the Informative Inventory
Report/Nomenclature for Reporting (IIR/NFR).
Manure management (3B)
For 3B category, Italy has estimated emissions for pollutants recommended in the 2013 and 2016
EMEP/EEA Guidebook (NH3, NOX, NMVOC, PM10, and PM2.5). A detailed and updated description of the
methodologies for the estimation of NH3 emissions, as well as of national specific circumstances and
reference material, is provided in sectoral reports (APAT, 2005; Cóndor et al., 2008; Cóndor, 2011), and in
the NIR (ISPRA, several years [a]). Detailed information on activity data sources, methods and EFs by
pollutant for 3B category is shown in Table 6.3.

118 118
Table 6.3 Activity data sources, methods and emission factors by pollutant for manure management
NFR code Animal
category Method
Activity
data Emission Factor
3B1a, 3B1b Cattle T2 (NH3), T1 (NOx, NMVOC, PM10,
PM2.5) NS
CS (NH3), D (NOx,
NMVOC, PM10, PM2.5)
3B4a, 3B2,
3B4d, 3B4e,
3B4f
Buffalo, Sheep,
Goats, Horses,
Mules and Asses
T1 (NH3, NOx, NMVOC, PM10, PM2.5) NS, IS CS (NH3), D (NMVOC,
NOx, PM10, PM2.5)
3B3 Swine T2 (NH3), T1 (NOx, NMVOC, PM10,
PM2.5) NS
CS (NH3), D (NMVOC,
NOx, PM10, PM2.5)
3B4gi,
3B4gii,
3B4giv
Poultry T2 (NH3), T1 (NOx, NMVOC, PM10,
PM2.5) AS
CS (NH3), D (NMVOC,
NOx, PM10, PM2.5)
3B4h Other T1 (NH3, NOx) NS CS (NH3), D (NOx)
NS=national statistics; IS= International statistics (FAO); AS= category association statistics (UNAITALIA);
CS=country-specific; D=Default (from guidebook)
Concerning the 3B category, the estimation procedure for NH3 emissions consists in successive
subtractions from the quantification of nitrogen excreted annually for each livestock category. This quantity
can be divided in two different fluxes, depending on whether animals are inside (housing, storage and
manure application) or outside the stable (grazing). More in detail, part of the nitrogen excreted in housing
volatilizes during the settle of manure in the local farming and it is calculated with the relevant emission
factor in housing for the different livestock; this amount is therefore subtracted from the total nitrogen
excreted to derive the amount of nitrogen for storage. During storage another fraction of nitrogen is lost
(calculated with the relevant emission factor for storage), which is then subtracted to obtain the amount of
nitrogen available for the agronomic spreading. Losses occurring during the spreading are finally calculated
with the specific emission factor for spreading. For the nitrogen excreted in the pasture losses due to
volatilization calculated with the relevant emission factor for grazing by livestock only occur at this stage
(CRPA, 2006[a]).
The manure application source is reported in 3Da2a Animal manure applied to soils and the animal
grazing source is reported in 3Da3 Urine and dung deposited by grazing animals.
The excretion rates (CRPA, 2006[a]; GU, 2006; Xiccato et al., 2005), slurry/solid manure production and
average weights (CRPA, 2006[a]; GU, 2006; Regione Emilia Romagna, 2004) were updated with country
specific information. Other improvements of country specific EFs were obtained with research studies
(CRPA, 2006 [a], [b], CRPA, 2010[b]). Average weight and N excretion rate for NH3 estimations are
reported in Table 6.4.
Table 6.4 Average weight and nitrogen excretion rates from livestock categories in 2015
Category Weight
kg
Housing Grazing Total
kg head-1 yr-1
Non-dairy cattle 381.5 49.55 1.42 50.97
Dairy cattle 602.7 110.20 5.80 116.00
Buffalo 510.5 89.22 2.66 91.89
Other swine (*) 88.3 13.48 - 13.48
Sow (*) 172.1 28.31 - 28.31
Sheep 47.0 1.62 14.58 16.20
Goats 45.3 1.62 14.58 16.20
Horses 550.0 20.00 30.00 50.00
Mules and asses 300.0 20.00 30.00 50.00
Poultry 1.7 0.50 - 0.50
Rabbit 1.6 1.02 - 1.02
Fur animals 1.0 4.10 - 4.10
(*) Other swine and sows are sources that represent the ‘swine’ category
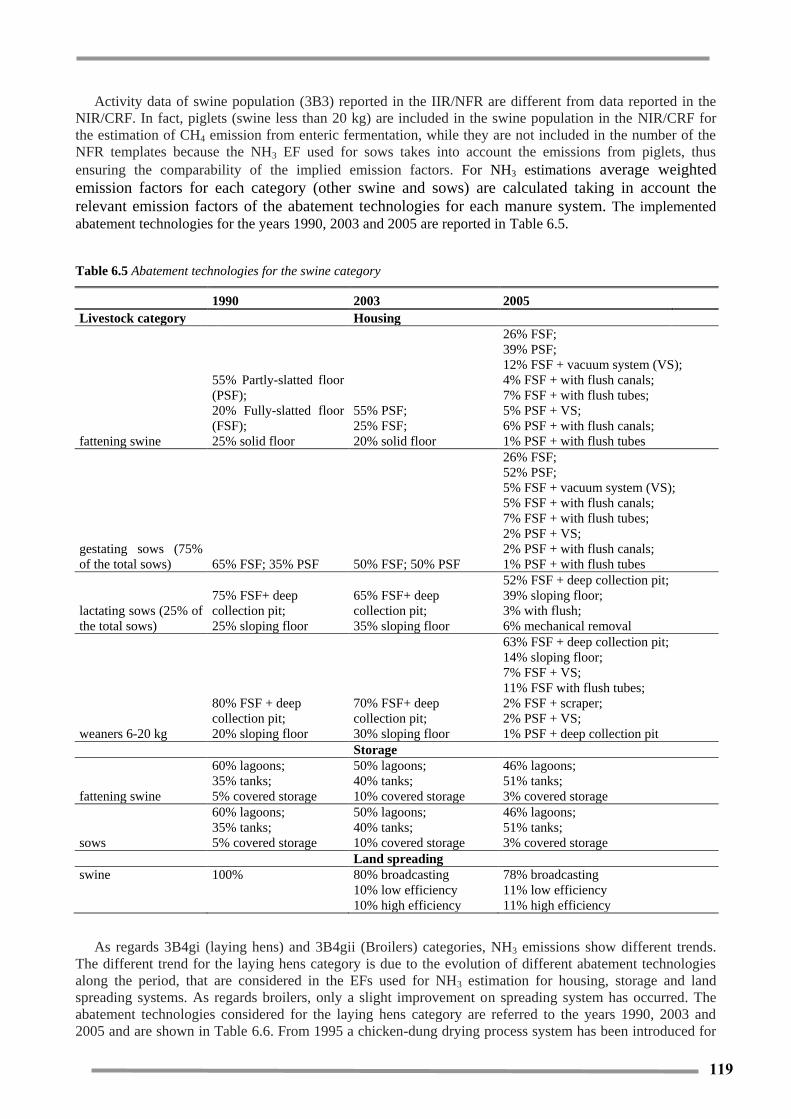
119 119
Activity data of swine population (3B3) reported in the IIR/NFR are different from data reported in the
NIR/CRF. In fact, piglets (swine less than 20 kg) are included in the swine population in the NIR/CRF for
the estimation of CH4 emission from enteric fermentation, while they are not included in the number of the
NFR templates because the NH3 EF used for sows takes into account the emissions from piglets, thus
ensuring the comparability of the implied emission factors. For NH3 estimations average weighted
emission factors for each category (other swine and sows) are calculated taking in account the
relevant emission factors of the abatement technologies for each manure system. The implemented
abatement technologies for the years 1990, 2003 and 2005 are reported in Table 6.5.
Table 6.5 Abatement technologies for the swine category
1990 2003 2005
Livestock category Housing
fattening swine
55% Partly-slatted floor
(PSF);
20% Fully-slatted floor
(FSF);
25% solid floor
55% PSF;
25% FSF;
20% solid floor
26% FSF;
39% PSF;
12% FSF + vacuum system (VS);
4% FSF + with flush canals;
7% FSF + with flush tubes;
5% PSF + VS;
6% PSF + with flush canals;
1% PSF + with flush tubes
gestating sows (75%
of the total sows) 65% FSF; 35% PSF 50% FSF; 50% PSF
26% FSF;
52% PSF;
5% FSF + vacuum system (VS);
5% FSF + with flush canals;
7% FSF + with flush tubes;
2% PSF + VS;
2% PSF + with flush canals;
1% PSF + with flush tubes
lactating sows (25% of
the total sows)
75% FSF+ deep
collection pit;
25% sloping floor
65% FSF+ deep
collection pit;
35% sloping floor
52% FSF + deep collection pit;
39% sloping floor;
3% with flush;
6% mechanical removal
weaners 6-20 kg
80% FSF + deep
collection pit;
20% sloping floor
70% FSF+ deep
collection pit;
30% sloping floor
63% FSF + deep collection pit;
14% sloping floor;
7% FSF + VS;
11% FSF with flush tubes;
2% FSF + scraper;
2% PSF + VS;
1% PSF + deep collection pit
Storage
fattening swine
60% lagoons;
35% tanks;
5% covered storage
50% lagoons;
40% tanks;
10% covered storage
46% lagoons;
51% tanks;
3% covered storage
sows
60% lagoons;
35% tanks;
5% covered storage
50% lagoons;
40% tanks;
10% covered storage
46% lagoons;
51% tanks;
3% covered storage
Land spreading
swine 100% 80% broadcasting 78% broadcasting
10% low efficiency 11% low efficiency
10% high efficiency 11% high efficiency
As regards 3B4gi (laying hens) and 3B4gii (Broilers) categories, NH3 emissions show different trends.
The different trend for the laying hens category is due to the evolution of different abatement technologies
along the period, that are considered in the EFs used for NH3 estimation for housing, storage and land
spreading systems. As regards broilers, only a slight improvement on spreading system has occurred. The
abatement technologies considered for the laying hens category are referred to the years 1990, 2003 and
2005 and are shown in Table 6.6. From 1995 a chicken-dung drying process system has been introduced for
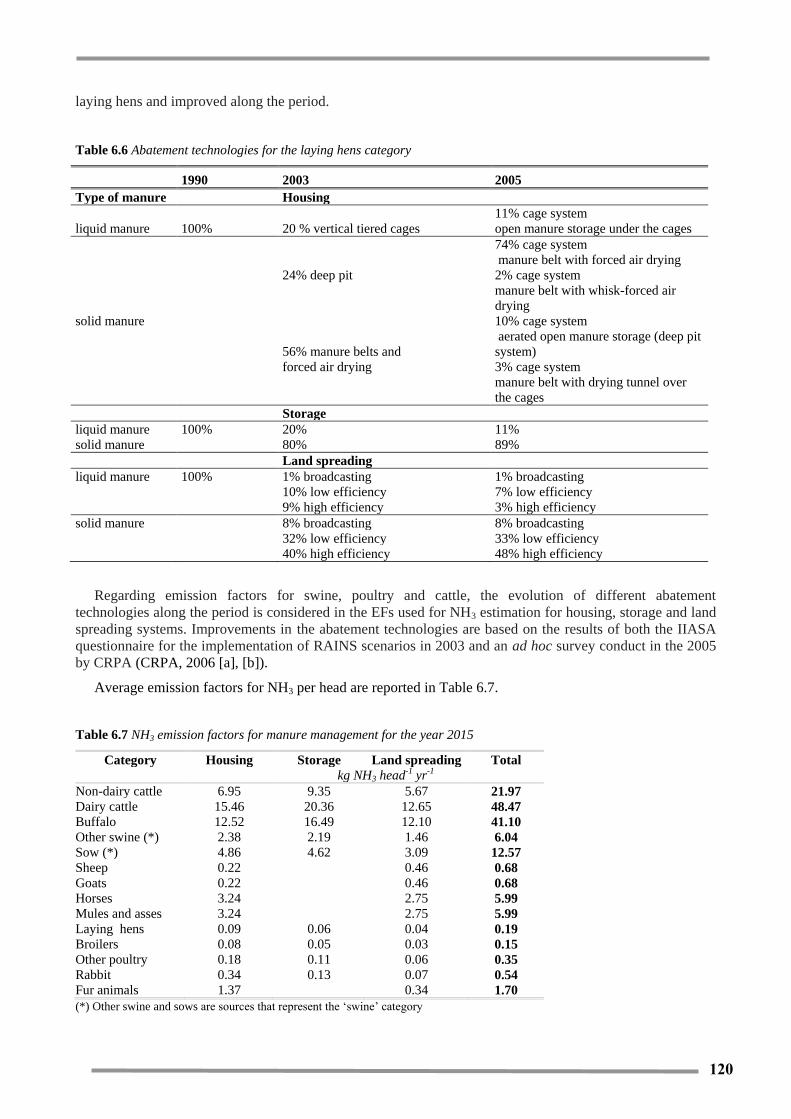
120 120
laying hens and improved along the period.
Table 6.6 Abatement technologies for the laying hens category
1990 2003 2005
Type of manure
Housing
liquid manure 100% 20 % vertical tiered cages
11% cage system
open manure storage under the cages
solid manure
24% deep pit
74% cage system
manure belt with forced air drying
2% cage system
manure belt with whisk-forced air
drying
56% manure belts and
forced air drying
10% cage system
aerated open manure storage (deep pit
system)
3% cage system
manure belt with drying tunnel over
the cages
Storage
liquid manure 100% 20% 11%
solid manure 80% 89%
Land spreading
liquid manure 100% 1% broadcasting 1% broadcasting
10% low efficiency 7% low efficiency
9% high efficiency 3% high efficiency
solid manure
8% broadcasting 8% broadcasting
32% low efficiency 33% low efficiency
40% high efficiency 48% high efficiency
Regarding emission factors for swine, poultry and cattle, the evolution of different abatement
technologies along the period is considered in the EFs used for NH3 estimation for housing, storage and land
spreading systems. Improvements in the abatement technologies are based on the results of both the IIASA
questionnaire for the implementation of RAINS scenarios in 2003 and an ad hoc survey conduct in the 2005
by CRPA (CRPA, 2006 [a], [b]).
Average emission factors for NH3 per head are reported in Table 6.7.
Table 6.7 NH3 emission factors for manure management for the year 2015
Category Housing Storage Land spreading Total
kg NH3 head-1 yr-1
Non-dairy cattle 6.95 9.35 5.67 21.97
Dairy cattle 15.46 20.36 12.65 48.47
Buffalo 12.52 16.49 12.10 41.10
Other swine (*) 2.38 2.19 1.46 6.04
Sow (*) 4.86 4.62 3.09 12.57
Sheep 0.22 0.46 0.68
Goats 0.22 0.46 0.68
Horses 3.24 2.75 5.99
Mules and asses 3.24 2.75 5.99
Laying hens 0.09 0.06 0.04 0.19
Broilers 0.08 0.05 0.03 0.15
Other poultry 0.18 0.11 0.06 0.35
Rabbit 0.34 0.13 0.07 0.54
Fur animals 1.37 0.34 1.70
(*) Other swine and sows are sources that represent the ‘swine’ category

121 121
For NOX emissions (during housing and storage) a tier 1 method was used for calculations. EFs by
livestock category and manure type derived from the EMEP/EEA Guidebook (EMEP/EEA, 2013) are
constant for the whole time series for the different livestock categories.
For NMVOC emissions a tier 1 method was used for calculations. EFs used are constant for the whole
time series for the different livestock categories. NMVOC EFs are those included in the US EPA AP 42
Compilation of Air Pollutant Emission Factors Guidebook (http://www.epa.gov/ttn/chief/ap42/index.html).
For particulate matter emissions a tier 1 method was used for calculations. EFs for PM10 and PM2.5 are
derived from the EMEP/EEA Guidebook (EMEP/EEA, 2016; EMEP/CORINAIR, 2006), modified on the
basis of the Italian animal breeding characteristics and weight parameters (Cóndor et al., 2008; Cóndor,
2011). For swine and poultry, emission factors have been updated from 2010, estimating a gradual transition
to the new factors from 2005, reflecting changes in manure management systems recorded by ISTAT
surveys (FSS and the agricultural census). In the current submission, emissions from turkeys, sheep, goats,
mules and asses and fur animals are also estimated.
Average emission factors for PM per head are reported in Table 6.8.
Table 6.8 PM emission factors for manure management for the year 2015
Category PM10 PM2.5
kg PM head-1 yr-1
Non-dairy cattle 0.315 0.208
Dairy cattle 0.592 0.386
Buffalo 0.484 0.317
Other swine (*) 0.190 0.008
Sow (*) 0.225 0.011
Sheep 0.053 0.016
Goats 0.051 0.015
Horses 0.242 0.154
Mules and asses 0.137 0.086
Laying hens 0.033 0.002
Broilers 0.024 0.002
Other poultry 0.053 0.010
Rabbit - -
Fur animals 0.053 0.002
(*) Other swine and sows are sources that represent the ‘swine’ category
Agricultural soils (3D)
For agricultural soils, estimations of NH3 emissions account for the direct application of synthetic N-
fertilizers (3Da1), animal manure applied to soils (3Da2a), sewage sludge applied to soils (3Da2b), other
organic fertilisers applied to soil (3Da2c), animal grazing (3Da3) and N fixed by cultivated crops,
leguminous cultivation (3De). For the same sources, emissions of NOX were estimated (except for 3De
Cultivated crops). Crop residues applied to soils (3Da4) and Indirect emissions from managed soils (3Db)
emissions have not been estimated as in the guidelines there is insufficient information. HCB emissions from
the use of pesticides have been estimated and reported in 3Df category.
NH3 emissions from synthetic N-fertilizer (3Da1) are based on the guidebook methodology, which
provides different EFs by type of fertilizers taking into account climatic conditions (EFs in Table 6.2). A
tier1/tier 2 method has been implemented for 3Da1 source. NH3 emissions from synthetic N-fertilizers are
obtained with the amount of the N content by type of fertilizer multiplied by the specific EFs. A validation of
EFs and estimations was carried out considering the results of a research study that estimated, at NUTS 2
level, emissions for the use of synthetic N-fertilizers considering type of cultivation, altitude, and climatic
conditions (CRPA, 2010[b]; Cóndor and Valli, 2011). NOX emission factor is 0.7% of the N content
(EMEP/CORINAIR, 2006)
The method for estimating NH3 emissions from animal manure applied to soils (3Da2a) is described in
3B (tier 2). The default NOX EF is from EMEP/EEA Guidebook (EMEP/EEA, 2013).
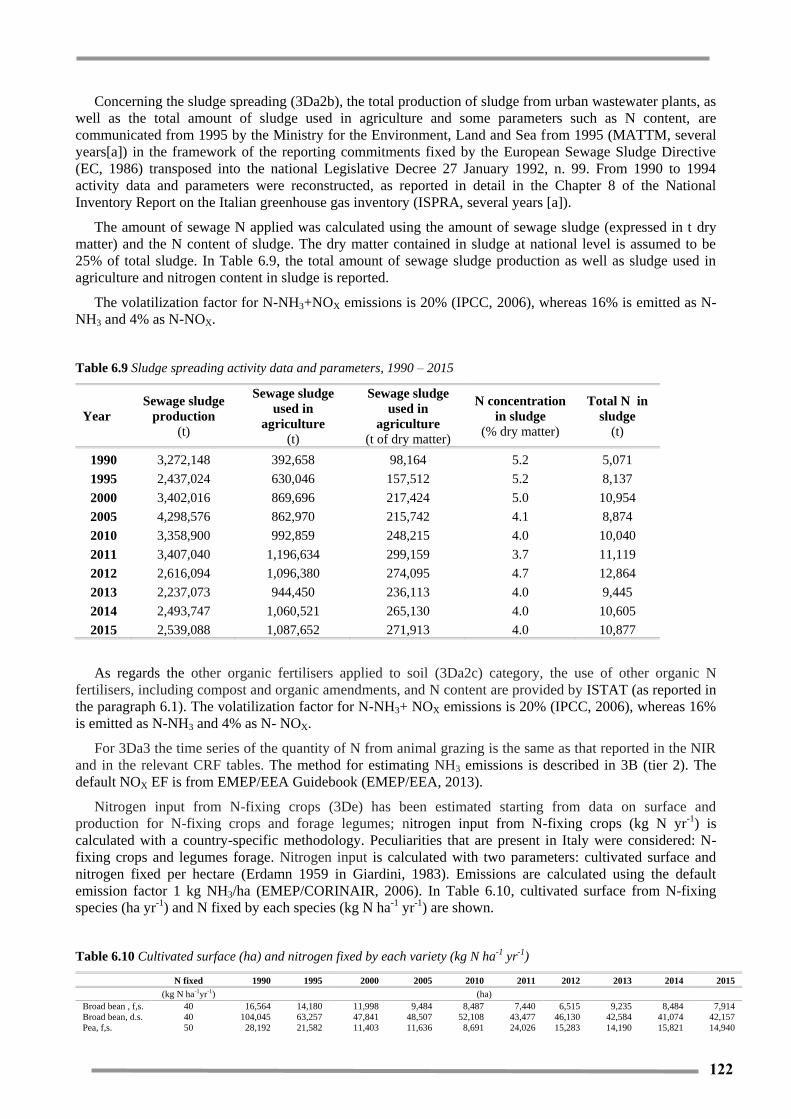
122 122
Concerning the sludge spreading (3Da2b), the total production of sludge from urban wastewater plants, as
well as the total amount of sludge used in agriculture and some parameters such as N content, are
communicated from 1995 by the Ministry for the Environment, Land and Sea from 1995 (MATTM, several
years[a]) in the framework of the reporting commitments fixed by the European Sewage Sludge Directive
(EC, 1986) transposed into the national Legislative Decree 27 January 1992, n. 99. From 1990 to 1994
activity data and parameters were reconstructed, as reported in detail in the Chapter 8 of the National
Inventory Report on the Italian greenhouse gas inventory (ISPRA, several years [a]).
The amount of sewage N applied was calculated using the amount of sewage sludge (expressed in t dry
matter) and the N content of sludge. The dry matter contained in sludge at national level is assumed to be
25% of total sludge. In Table 6.9, the total amount of sewage sludge production as well as sludge used in
agriculture and nitrogen content in sludge is reported.
The volatilization factor for N-NH3+NOX emissions is 20% (IPCC, 2006), whereas 16% is emitted as N-
NH3 and 4% as N-NOX.
Table 6.9 Sludge spreading activity data and parameters, 1990 – 2015
Year
Sewage sludge
production
(t)
Sewage sludge
used in
agriculture
(t)
Sewage sludge
used in
agriculture
(t of dry matter)
N concentration
in sludge
(% dry matter)
Total N in
sludge
(t)
1990 3,272,148 392,658 98,164 5.2 5,071
1995 2,437,024 630,046 157,512 5.2 8,137
2000 3,402,016 869,696 217,424 5.0 10,954
2005 4,298,576 862,970 215,742 4.1 8,874
2010 3,358,900 992,859 248,215 4.0 10,040
2011 3,407,040 1,196,634 299,159 3.7 11,119
2012 2,616,094 1,096,380 274,095 4.7 12,864
2013 2,237,073 944,450 236,113 4.0 9,445
2014 2,493,747 1,060,521 265,130 4.0 10,605
2015 2,539,088 1,087,652 271,913 4.0 10,877
As regards the other organic fertilisers applied to soil (3Da2c) category, the use of other organic N
fertilisers, including compost and organic amendments, and N content are provided by ISTAT (as reported in
the paragraph 6.1). The volatilization factor for N-NH3+ NOX emissions is 20% (IPCC, 2006), whereas 16%
is emitted as N-NH3 and 4% as N- NOX.
For 3Da3 the time series of the quantity of N from animal grazing is the same as that reported in the NIR
and in the relevant CRF tables. The method for estimating NH3 emissions is described in 3B (tier 2). The
default NOX EF is from EMEP/EEA Guidebook (EMEP/EEA, 2013).
Nitrogen input from N-fixing crops (3De) has been estimated starting from data on surface and
production for N-fixing crops and forage legumes; nitrogen input from N-fixing crops (kg N yr-1) is
calculated with a country-specific methodology. Peculiarities that are present in Italy were considered: N-
fixing crops and legumes forage. Nitrogen input is calculated with two parameters: cultivated surface and
nitrogen fixed per hectare (Erdamn 1959 in Giardini, 1983). Emissions are calculated using the default
emission factor 1 kg NH3/ha (EMEP/CORINAIR, 2006). In Table 6.10, cultivated surface from N-fixing
species (ha yr-1) and N fixed by each species (kg N ha-1 yr-1) are shown.
Table 6.10 Cultivated surface (ha) and nitrogen fixed by each variety (kg N ha-1 yr-1)
N fixed 1990 1995 2000 2005 2010 2011 2012 2013 2014 2015
(kg N ha-1yr-1) (ha)
Broad bean , f,s. 40 16,564 14,180 11,998 9,484 8,487 7,440 6,515 9,235 8,484 7,914 Broad bean, d.s. 40 104,045 63,257 47,841 48,507 52,108 43,477 46,130 42,584 41,074 42,157 Pea, f,s. 50 28,192 21,582 11,403 11,636 8,691 24,026 15,283 14,190 15,821 14,940

123 123
N fixed 1990 1995 2000 2005 2010 2011 2012 2013 2014 2015
Pea, d.s. 72 10,127 6,625 4,498 11,134 11,692 10,770 9,861 9,458 9,970 11,181 Chickpea 40 4,624 3,023 3,996 5,256 6,813 5,830 7,928 8,259 9,037 11,167 Lentil 40 1,048 1,038 1,016 1,786 2,458 2,156 2,629 2,643 2,463 3,099 Vetch 80 5,768 6,532 6,800 7,656 8,000 8,000 8,200 8,200 8,200 8,230 Lupin 40 3,303 3,070 3,300 2,500 4,000 4,000 5,000 5,000 5,000 4,620 Soya bean 58 521,169 195,191 256,647 152,331 159,511 165,955 152,993 184,146 232,867 308,979 Alfalfa 194 987,000 823,834 810,866 779,430 745,128 728,034 599,031 708,208 699,296 667,325 Clover grass 103 224,087 125,009 114,844 103,677 102,691 101,819 86,976 108,310 115,902 119,942
Total 1,958,025 1,301,746 1,307,702 1,165,298 1,135,606 1,128,033 963,956 1,125,191 1,169,608 1,222,483
(*) f.s.=fresh seed; d.s.=dry seed
HCB emissions from the use of pesticides (3Df) have been estimated. The category is key category at
level assessment in 1990 and trend assessment. HCB emissions result from the use of HCB as pesticide but
also by the use of other pesticides which contain HCB as an impurity.
The availability of data allows estimating emissions from pesticides where HCB is found as an impurity,
as in lindane, DCPA, clorotalonil and Picloram. Emissions from the use of HCB as a pesticide were not
estimated. On the basis of the amount of HCB contained in these pesticides (lindane: 0.01%; DCPA: 0.1%;
clorotalonil: 0.005%; Picloram: 0.005%) and applying the HCB emission factor provided from the
EMEP/EEA Guidebook, HCB emissions result in 23 kg for 1990 and 0.39 kg in 2013 for Italy. An
international research work at European level (Berdowski et al., 1997) estimated 400kg of HCB emissions
from pesticide use for Italy in 1990 while in the last years these emissions should be null.
Detailed information on activity data sources, methods and EFs by pollutant is shown in Table 6.11.
Table 6.11 Activity data sources, methods and emission factors by pollutant for agriculture soils
NFR code Category Method Activity data Emission Factor
3Da1 Inorganic N-fertilizers (includes also urea
application)
T1/T2 (NH3),
T1 (NOX) NS D (NH3, NOX)
3Da2a Animal manure applied to soils T1/T2 (NH3),
T1 (NOX) NS
CS (NH3), D
(NOX)
3Da2b Sewage sludge applied to soils T1 (NH3, NOX) NS D (NH3, NOX)
3Da2c Other organic fertilisers applied to soils
(including compost) T1 (NH3, NOX) NS D (NH3, NOX)
3Da3 Urine and dung deposited by grazing
animals T2 (NH3) NS CS (NH3)
3Da4 Crop residues applied to soils
3Db Indirect emissions from managed soils
3Dc
Farm-level agricultural operations
including storage, handling and transport
of agricultural products
- - -
3Dd Off-farm storage, handling and transport
of bulk agricultural products - - -
3De Cultivated crops CS (NH3) NS D (NH3)
3Df Use of pesticides T1 (HCB) NS D (HCB)
Field burning of agricultural residues (3F)
NMVOC, CO, NOX, PM10, PM2.5 and BC emissions have been estimated, applying the tier 1 approach. A
detailed description of the methodology and parameters used is shown in the NIR (ISPRA, several years [a]).
The same methodology to estimate emissions from open burning of waste, as reported in paragraph 7.2 of the
waste section (see Small scale waste burning (5C2) subparagraph), is used on the basis of the amount of
fixed residues instead of removable residues. Concerning NOX, CO, NMVOC, IPCC emission factors have
been used (IPCC, 1997), while for PM10 and PM2.5 emission factors from the USEPA (EPA, 1995) and BC
emission factors from the EMEP/EEA Guidebook (EMEP/EEA, 2013) have been applied.
As concerns NOX and CO emission factors, values used are in the range of the tier 1 emission factors
from the EMEP/EEA Guidebook (EMEP/EEA, 2016).

124 124
As concerns PM emission factors, values used are lower than those (both tier 1 and tier 2) reported in the
EMEP/EEA Guidebook (EMEP/EEA, 2016). The tier 1 emission factors from EMEP/EEA Guidebook are
similar but not equal to the average of the values relating to four types of crops reported in the reference
scientific publication mentioned in the Guidebook (Jenkins, 1996a). However for field burning of rice
cultivation, the emission factor reported in the Guidebook is very different from that in the reference
publication of Jenkins. Also in consideration of these issues emission factors have not been changed with
those of the Guidebook and further work is planned with the aim to find values more representative of our
country.
6.3 Time series and key categories
The following sections present an outline of the main key categories in the agriculture sector.
The agriculture sector is the main source of NH3 emissions in Italy; for the main pollutants, in 2015 the
sector accounts for:
96.1% of national total NH3 emissions
7.2% of national total PM10 emissions
3.1% of national total PM2.5 emissions
3.2% of national total NOX emissions and
1.9% of national total HCB emissions
Moreover, the sector comprises 0.5% of total CO emissions, 0.5% of BC and 0.1% of NMVOC. There are
no particular differences as compared to the sectoral share in 1990 when the agriculture sector accounted for
97.8% of NH3 emissions, 7.4% of PM10, 2.9% of PM2.5, 1.2% of NOX, except for HCB emissions where
agriculture accounted for 54.2% of total national emissions.
Table 6.12 reports the key categories identified in the agriculture sector while the time series of NH3
emissions by sources is shown in Table 6.13.
Concerning NH3 emissions, the category manure management (3B) represents, in 2015, 55.8% of national
total ammonia emissions (57.0% in 1990). In particular, NH3 emissions from cattle (3B1) stand for 59.2% of
3B emissions, while emissions from swine (3B3) and poultry (3B4g) represent 16.5% and 14.3%,
respectively. The category agricultural soils (3D) represents, in 2015, 40.3% of national total ammonia
emissions (40.8% in 1990). The animal manure applied to soils (3Da2a) and the use of synthetic N-fertilisers
(3Da1) represent 47.3% and 37.5% of 3D emissions, respectively.
Regarding PM10 emissions, the category manure management (3B) accounts for 5.9% in 2015 (6.6% in
1990) of national total PM10 emissions. Poultry (3B4g), cattle (3B1) and swine (3B3) represent the major
contributors to the total PM10 emissions from category 3B with 57.8%, 22.0% and 13.3%, respectively. For
PM2.5 emissions, the category manure management (3B) contributes for 1.7% in 2015 (2.0% in 1990) of
national total PM2.5 emissions. Cattle (3B1) accounts for 57.9%, while poultry (3B4g) stands for 28.0% to the
total PM2.5 emissions from category 3B.
For NOX emissions, the category agricultural soils (3D) contributes for 3.0% in 2015 (1.1% in 1990).
Inorganic N-fertilizers (3Da1) and Other organic fertilisers applied to soils (3Da2c) account for 52.2% and
35.0% of total 3D emissions, respectively.
Table 6.12 Key categories in the agriculture sector in 2015
SOX NOX NH3 NMVOC CO PM10 PM2.5 BC Pb Cd Hg PAH DIOX HCB PCB
%
3B1a 0.03 16.63 0.01
0.60 0.44
3B1b 0.04 16.39 0.03
0.70 0.51
3B2 0.01 0.40 0.00
0.21 0.07
3B3 0.00 9.19 0.02
0.78 0.04
3B4a 0.00 2.76 0.00
0.10 0.07
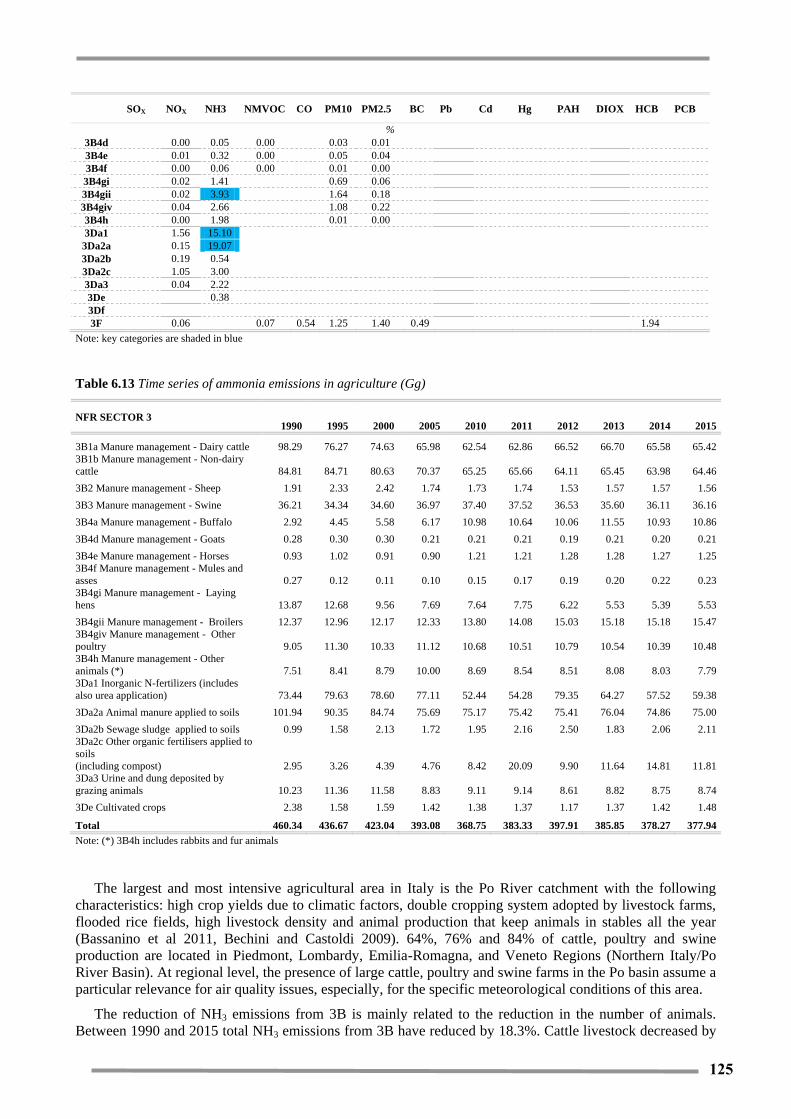
125 125
SOX NOX NH3 NMVOC CO PM10 PM2.5 BC Pb Cd Hg PAH DIOX HCB PCB
%
3B4d 0.00 0.05 0.00
0.03 0.01
3B4e 0.01 0.32 0.00
0.05 0.04
3B4f 0.00 0.06 0.00
0.01 0.00
3B4gi 0.02 1.41
0.69 0.06
3B4gii 0.02 3.93
1.64 0.18
3B4giv 0.04 2.66
1.08 0.22
3B4h 0.00 1.98
0.01 0.00
3Da1 1.56 15.10
3Da2a 0.15 19.07
3Da2b 0.19 0.54
3Da2c 1.05 3.00
3Da3 0.04 2.22
3De 0.38
3Df
3F 0.06 0.07 0.54 1.25 1.40 0.49
1.94
Note: key categories are shaded in blue
Table 6.13 Time series of ammonia emissions in agriculture (Gg)
NFR SECTOR 3 1990 1995 2000 2005 2010 2011 2012 2013 2014 2015
3B1a Manure management - Dairy cattle 98.29 76.27 74.63 65.98 62.54 62.86 66.52 66.70 65.58 65.42
3B1b Manure management - Non-dairy
cattle 84.81 84.71 80.63 70.37 65.25 65.66 64.11 65.45 63.98 64.46
3B2 Manure management - Sheep 1.91 2.33 2.42 1.74 1.73 1.74 1.53 1.57 1.57 1.56
3B3 Manure management - Swine 36.21 34.34 34.60 36.97 37.40 37.52 36.53 35.60 36.11 36.16
3B4a Manure management - Buffalo 2.92 4.45 5.58 6.17 10.98 10.64 10.06 11.55 10.93 10.86
3B4d Manure management - Goats 0.28 0.30 0.30 0.21 0.21 0.21 0.19 0.21 0.20 0.21
3B4e Manure management - Horses 0.93 1.02 0.91 0.90 1.21 1.21 1.28 1.28 1.27 1.25
3B4f Manure management - Mules and
asses 0.27 0.12 0.11 0.10 0.15 0.17 0.19 0.20 0.22 0.23
3B4gi Manure management - Laying
hens 13.87 12.68 9.56 7.69 7.64 7.75 6.22 5.53 5.39 5.53
3B4gii Manure management - Broilers 12.37 12.96 12.17 12.33 13.80 14.08 15.03 15.18 15.18 15.47
3B4giv Manure management - Other
poultry 9.05 11.30 10.33 11.12 10.68 10.51 10.79 10.54 10.39 10.48
3B4h Manure management - Other
animals (*) 7.51 8.41 8.79 10.00 8.69 8.54 8.51 8.08 8.03 7.79
3Da1 Inorganic N-fertilizers (includes
also urea application) 73.44 79.63 78.60 77.11 52.44 54.28 79.35 64.27 57.52 59.38
3Da2a Animal manure applied to soils 101.94 90.35 84.74 75.69 75.17 75.42 75.41 76.04 74.86 75.00
3Da2b Sewage sludge applied to soils 0.99 1.58 2.13 1.72 1.95 2.16 2.50 1.83 2.06 2.11
3Da2c Other organic fertilisers applied to
soils
(including compost) 2.95 3.26 4.39 4.76 8.42 20.09 9.90 11.64 14.81 11.81
3Da3 Urine and dung deposited by
grazing animals 10.23 11.36 11.58 8.83 9.11 9.14 8.61 8.82 8.75 8.74
3De Cultivated crops 2.38 1.58 1.59 1.42 1.38 1.37 1.17 1.37 1.42 1.48
Total 460.34 436.67 423.04 393.08 368.75 383.33 397.91 385.85 378.27 377.94
Note: (*) 3B4h includes rabbits and fur animals
The largest and most intensive agricultural area in Italy is the Po River catchment with the following
characteristics: high crop yields due to climatic factors, double cropping system adopted by livestock farms,
flooded rice fields, high livestock density and animal production that keep animals in stables all the year
(Bassanino et al 2011, Bechini and Castoldi 2009). 64%, 76% and 84% of cattle, poultry and swine
production are located in Piedmont, Lombardy, Emilia-Romagna, and Veneto Regions (Northern Italy/Po
River Basin). At regional level, the presence of large cattle, poultry and swine farms in the Po basin assume a
particular relevance for air quality issues, especially, for the specific meteorological conditions of this area.
The reduction of NH3 emissions from 3B is mainly related to the reduction in the number of animals.
Between 1990 and 2015 total NH3 emissions from 3B have reduced by 18.3%. Cattle livestock decreased by

126 126
25.4% (from 7,752,152 to 5,781,348 heads). Dairy cattle and non-dairy cattle have decreased by 30.9% and
22.6%, respectively. The so-called first pillar of the EU Common Agriculture Policy (CAP), dealing with
market support, had a strong impact through the milk quota system by reducing animal numbers in the dairy
sector to compensate for increasing animal productivity (EEA, 2016). On the contrary, swine and poultry
have increased between 1990 and 2015 by 4.6% and 13.3%, respectively (see Table 6.1). Abatement
technologies are considered in the EFs used for NH3 estimations. Research studies funded by ISPRA, such as
the MeditAiraneo project, or by the Ministry of Environment have allowed us to collect information on the
inclusion of abatement technologies in Italy, especially those related to the swine and poultry recovery and
treatment of manure and to land spreading (CRPA, 2006[b]; Cóndor et al., 2008; CRPA, 2010[b]).
NH3 emissions of 3D category are driven by the animal manure applied to soils and the use of inorganic
N-fertilizers. Between 1990-2015 emissions have decreased by 26.4% and 19.2% mainly due to the
reduction of the number of animals and the use of inorganic N-fertilizers, that are decreased overall by
45.6% (although the urea decreased by 8.6%). According to the Italian Fertilizer Association (AIF,
Associazione Italiana Fertilizzanti) the use of fertilisers is determined by their cost and particularly by the
price of agricultural products. In the last years, as a consequence of agriculture product price decreasing,
minor amount of fertilisers has been used by farmers to reduce costs (Perelli, 2007). Furthermore, the EU
Nitrates Directive which aims at reducing and preventing water pollution caused by nitrates from agricultural
sources has addressed the lower use of synthetic and nitrogen-based fertilisers (EEA, 2016).
Every 5 years the national emission inventory is disaggregated at NUTS3 level as requested by CLRTAP
(Cóndor et al., 2008). A database with the time series for all sectors and pollutants has been published
(ISPRA, 2008; ISPRA, 2009; ISPRA, several years [c]; ISPRA, several years [d]). The disaggregation of
2010 agricultural emissions has also been finalised and figures are available at the following web site:
http://www.sinanet.isprambiente.it/it/inventaria/disaggregazione_prov2005/disagreggazione%202010/view.
The disaggregation (NUTS3) of the NH3 agricultural emissions is shown in Figure 6.2. In 2010, four regions
contributed with more than 60% of agricultural NH3 emissions: Lombardia, Veneto, Emilia Romagna and
Piemonte.
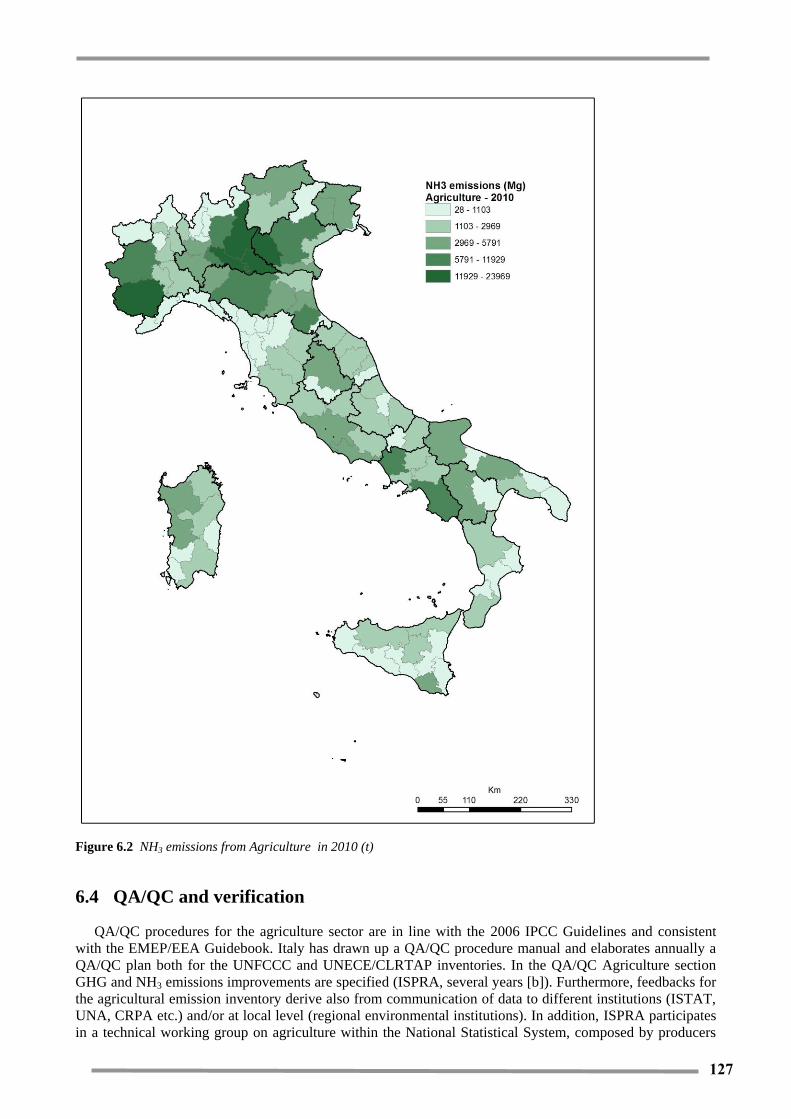
127 127
Figure 6.2 NH3 emissions from Agriculture in 2010 (t)
6.4 QA/QC and verification
QA/QC procedures for the agriculture sector are in line with the 2006 IPCC Guidelines and consistent
with the EMEP/EEA Guidebook. Italy has drawn up a QA/QC procedure manual and elaborates annually a
QA/QC plan both for the UNFCCC and UNECE/CLRTAP inventories. In the QA/QC Agriculture section
GHG and NH3 emissions improvements are specified (ISPRA, several years [b]). Furthermore, feedbacks for
the agricultural emission inventory derive also from communication of data to different institutions (ISTAT,
UNA, CRPA etc.) and/or at local level (regional environmental institutions). In addition, ISPRA participates
in a technical working group on agriculture within the National Statistical System, composed by producers

128 128
and users of agricultural statistics.
Data used to estimate emissions were verified with census data. Slight differences in the livestock number
(cattle and other swine) are found between conjunctural surveys (used for emissions estimation) and
Agricultural census for the year 2010; while for the other categories the differences are more significant. In
the conjunctural surveys, the number of heads of the sows, sheep, goats, mules and asses, broilers, hens
categories is on average 15% higher than the census, whereas for other poultry the difference is 30% and for
horses and rabbits is more than double.
Average NH3 emission factors for manure management from animal housing have been estimated, for
each animal category, on the basis of animal housing collected by the 2010 Agricultural Census. Comparing
the obtained values against the country specific parameters, used in the estimation process, slight deviations
result, mainly due to the different level of aggregation.
Ammonia emissions for swine and poultry manure management from housing and storage were compared
with data reported in the E-PRTR registry for the year 2014, which represent 62.1% and 19.5%, respectively,
of national NH3 emissions for the same categories (3B).
Data on national sales of synthetic nitrogen fertilizers (by type of fertilizers) as provided by
Assofertilizzanti – Federchimica3 (personal communication) for the period 2012-2015 have been compared
to official statistics provided by ISTAT and used to estimate the FSN amount. Differences were mainly found
for the amount of simple mineral nitrogen fertilizers, where data from Assofertilizzanti are higher by 20%, on
average, for the years 2013-2015. This could be due to a possible double counting of some product which
could be considered as a single product and as a compound with other fertilizers. Further investigations will
be conducted.
6.5 Recalculations
In 2017, recalculations were implemented for the agricultural emission inventory.
PM emissions have been updated on the basis of the new emission factors for the manure management
category (3B) reported in the last version of the EMEP/EEA Guidebook (EMEP/EEA, 2016).
The percentage distribution between liquid and solid manure of the category Other cattle has been
corrected for all time series (changes in NOx and PM emissions – 3B).
NOX emissions from housing and storage for rabbit have been considered (slight increase in 3B).
The number of fur animals has been update for the period 2012-2014 (slight changes in NH3, NOx and
NMVOC emissions – 3B and 3D).
Minor variations of NH3 emissions (3D) for the period 1990-2014 is due to the update of the NH3
emission factor for leguminous cultivation (3De), where the new one is taken from the 2007
EMEP/CORINAIR Guidebook4 (EMEP/CORINAIR, 2007), and the update of activity data relative to the
vetch and lupine cultivated surface (only for the year 2014).
Updating data on rice production for the year 2014 involves a slight increase in NOx, NMVOC, CO, PM
and BC emissions (3F).
6.6 Planned improvements
Since the 2006 submission, results from a specific project on Mediterranean area, the MeditAIRaneo
Agriculture project, have been included in the preparation of the UNFCCC/UNECE-CLRTAP agricultural
emission inventory (CRPA, 2006[a]). Moreover, outcomes from the convention signed between APAT (now
3 Federchimica is the National Association of the Chemical Industry and Assofertilizzanti represents the production companies of the fertilizer industry.
4 In the latest versions of the Guidebook, emission factor is no longer reported.

129 129
ISPRA) and the Ministry for the Environment, Land and Sea on NH3 emission scenarios have been
incorporated to the agricultural emissions inventory (CRPA, 2006 [a], [b]; ENEA, 2006, CRPA, 2010[b]).
Currently, uncertainty analysis, for the agricultural emission sector, is carried out only for the GHG
emission inventory. We plan to estimate uncertainties also for the other pollutants, including NH3 and PM.
Monte Carlo analysis has also been performed for one key category of the GHG agricultural emission
inventory; initial results are shown in the NIR (ISPRA, several years [a]).
No emissions are estimated for 3Da4 Crop residues applied to soils, 3Db Indirect emissions from
managed soils, 3Dc Farm-level agricultural operations including storage, handling and transport of
agricultural products and 3Dd off-farm storage, handling and transport of bulk agricultural products.
However, Italy will assess the availability of AD and EFs for these categories.
The ad hoc “Survey on Agricultural Production Methods” (SAPM) regulated by the EU will be crucial
for improving the preparation of the agricultural emission inventory. In Italy, this survey was carried out
during the 2010 General Agricultural Census; analysis of census data is on progress. Information such as
animal grazing period, animal housing, storage systems characteristics, and the use of manure/slurry for land
application have been collected. Some information at NUTS3 level (Italian provinces) has been already
collected with the incorporation of specific queries in the Farm Structure Survey (FSS) from 2005 and 2007.
Information on housing and storage systems, respectively, was analysed and will be validated with
information that will be obtained from the 2010 Agricultural Census (CRPA, 2010[a]) and from the 2013
FSS. In the coming years, specific surveys or the inclusion of specific queries on already existing surveys
such as Farm Structure Survey (FSS) or Farm Accounting Data Network (FADN) will provide valuable
information on animal and agronomic production methods.
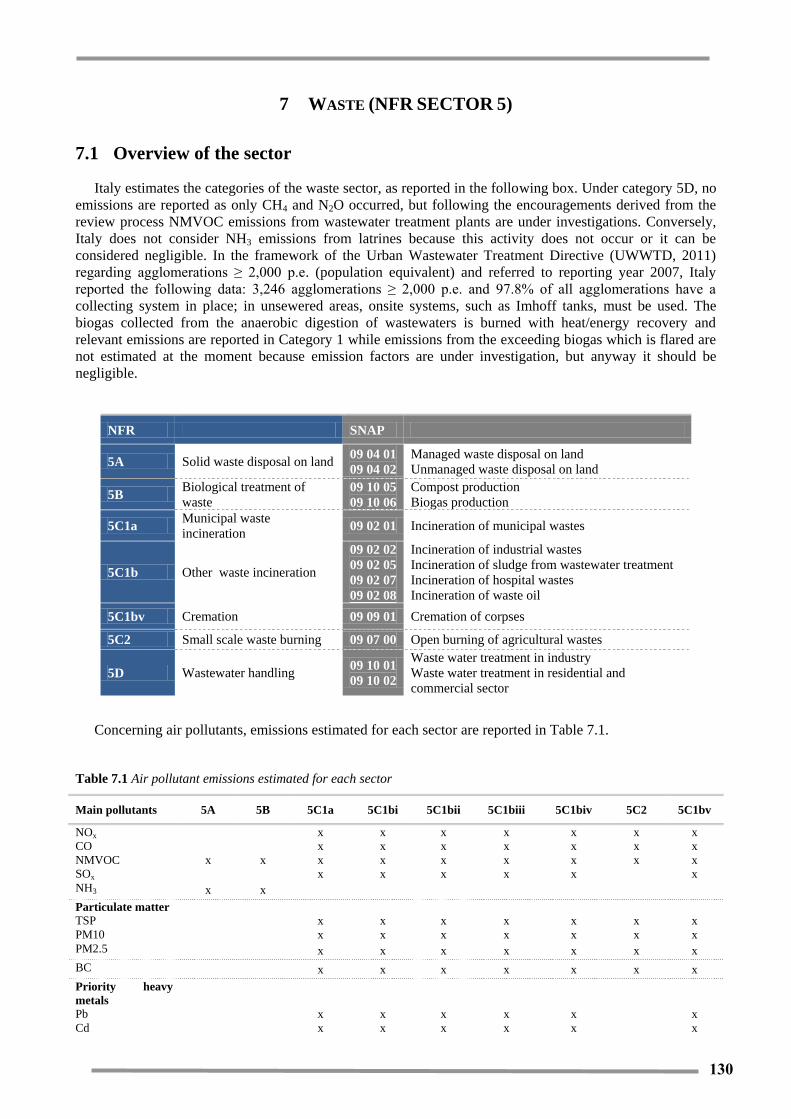
130 130
7 WASTE (NFR SECTOR 5)
7.1 Overview of the sector
Italy estimates the categories of the waste sector, as reported in the following box. Under category 5D, no
emissions are reported as only CH4 and N2O occurred, but following the encouragements derived from the
review process NMVOC emissions from wastewater treatment plants are under investigations. Conversely,
Italy does not consider NH3 emissions from latrines because this activity does not occur or it can be
considered negligible. In the framework of the Urban Wastewater Treatment Directive (UWWTD, 2011)
regarding agglomerations ≥ 2,000 p.e. (population equivalent) and referred to reporting year 2007, Italy
reported the following data: 3,246 agglomerations ≥ 2,000 p.e. and 97.8% of all agglomerations have a
collecting system in place; in unsewered areas, onsite systems, such as Imhoff tanks, must be used. The
biogas collected from the anaerobic digestion of wastewaters is burned with heat/energy recovery and
relevant emissions are reported in Category 1 while emissions from the exceeding biogas which is flared are
not estimated at the moment because emission factors are under investigation, but anyway it should be
negligible.
NFR SNAP
5A Solid waste disposal on land 09 04 01
09 04 02
Managed waste disposal on land
Unmanaged waste disposal on land
5B Biological treatment of
waste
09 10 05
09 10 06
Compost production
Biogas production
5C1a Municipal waste
incineration 09 02 01 Incineration of municipal wastes
5C1b Other waste incineration
09 02 02
09 02 05
09 02 07
09 02 08
Incineration of industrial wastes
Incineration of sludge from wastewater treatment
Incineration of hospital wastes
Incineration of waste oil
5C1bv Cremation 09 09 01 Cremation of corpses
5C2 Small scale waste burning 09 07 00 Open burning of agricultural wastes
5D Wastewater handling 09 10 01
09 10 02
Waste water treatment in industry
Waste water treatment in residential and
commercial sector
Concerning air pollutants, emissions estimated for each sector are reported in Table 7.1.
Table 7.1 Air pollutant emissions estimated for each sector
Main pollutants 5A 5B 5C1a 5C1bi 5C1bii 5C1biii 5C1biv 5C2 5C1bv
NOx x x x x x x x
CO x x x x x x x
NMVOC x x x x x x x x x
SOx x x x x x x
NH3 x x
Particulate matter
TSP x x x x x x x
PM10 x x x x x x x
PM2.5 x x x x x x x
BC x x x x x x x
Priority heavy
metals
Pb x x x x x x
Cd x x x x x x

131 131
Main pollutants 5A 5B 5C1a 5C1bi 5C1bii 5C1biii 5C1biv 5C2 5C1bv
Hg x x x x x x
POPs Annex II
PCB x x x x x
POPs Annex III
Dioxins x x x x x x x
PAH x x x x x x x
HCB x x x x x
Other heavy
metals
As x x x x x x
Cr x x x x x x
Cu x x x x x x
Ni x x x x x x
Se x x x x
Zn x x x x x
In 2015, sewage sludge incineration (5C1b iv), is key category for HCB emissions. In 1990, industrial
waste incineration (5C1b i) and municipal waste incineration (5C1a) are key categories for dioxins
emissions whereas sewage sludge incineration (5C1b iv) is key category for HCB. As regard the trend,
industrial waste incineration (5C1b i) and municipal waste incineration (5C1a) are key categories for
dioxins emissions whereas sewage sludge incineration (5C1b iv) is key category for HCB.
The waste sector, and in particular Waste incineration (5C), is a source of different pollutants; for the
main pollutants, in 2015, the sector accounts for:
67.7 % in national total HCB emissions;
8.1 % in national total PAH emissions;
3.9 % in national total BC emissions;
2.8 % in national total Dioxin emissions;
2.0% in national total CO emissions.
Moreover, the sector comprises 1.4% of total PM10 and PM2.5 emissions, 1.6% of NH3, 1.3% of
NMVOC, and for what concerns priority heavy metals 1.0% of Cd, .
7.2 Methodological issues
Solid waste disposal on land (5A)
Solid waste disposal on land is a major source concerning greenhouse gas emissions but not concerning
air pollutants. Notwithstanding, NMVOC and NH3 emissions are estimated, as a percentage of methane
emitted, calculated using the IPCC Tier 2 methodology (IPCC, 1997; IPCC, 2000), through the application
of the First Order Decay Model (FOD). A detailed description of the model and its application to Italian
landfills is reported in the National Inventory Report on the Italian greenhouse gas inventory (ISPRA, 2017
[a]).
Emissions from the landfill gas combustion in landfills flaring are not estimated at the moment: activity
data are available but emission factors are under investigation.
It is assumed that landfill gas composition is 50% VOC. The percentage by weight of CH4 compared to
the total VOC emitted is 98.7%. The remaining 1.3% (NMVOC) consists of paraffinic, aromatic and
halogenated hydrocarbons (Gaudioso et al., 1993): this assumption refers to US EPA data (US EPA, 1990).
As regard ammonia, emission factor has been assumed equal to 1 volume per cent of VOC too
(Tchobanoglous et al., 1993).
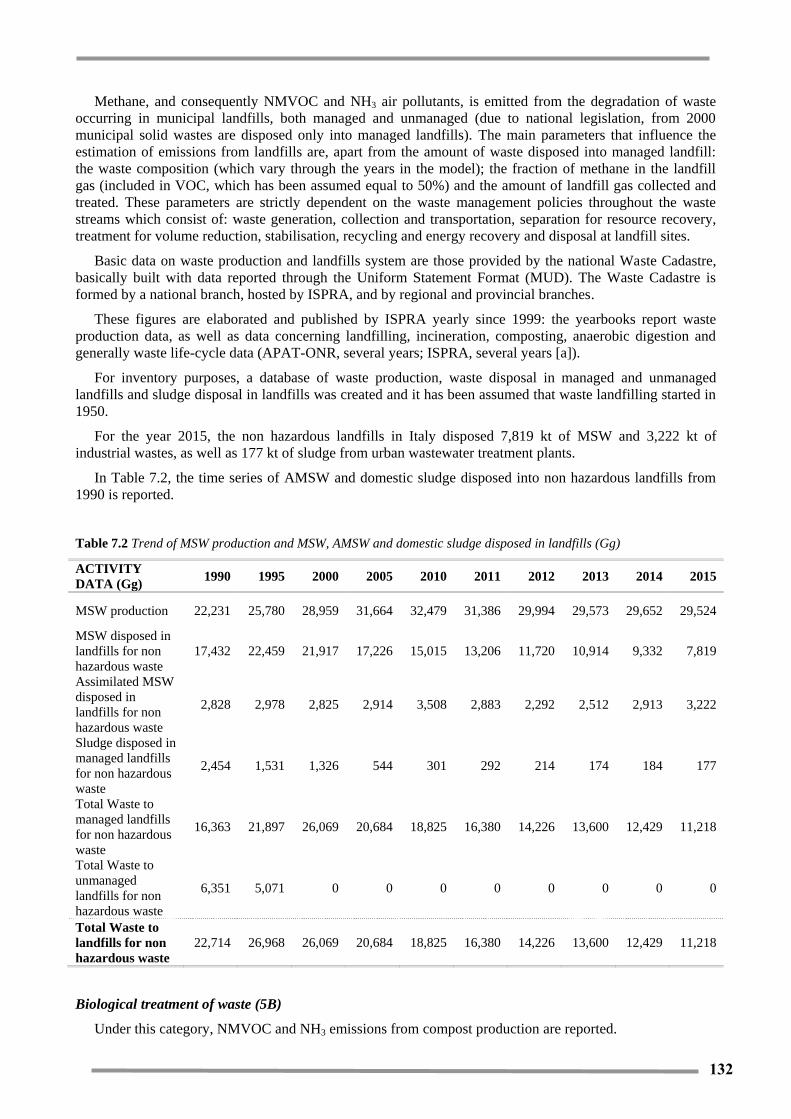
132 132
Methane, and consequently NMVOC and NH3 air pollutants, is emitted from the degradation of waste
occurring in municipal landfills, both managed and unmanaged (due to national legislation, from 2000
municipal solid wastes are disposed only into managed landfills). The main parameters that influence the
estimation of emissions from landfills are, apart from the amount of waste disposed into managed landfill:
the waste composition (which vary through the years in the model); the fraction of methane in the landfill
gas (included in VOC, which has been assumed equal to 50%) and the amount of landfill gas collected and
treated. These parameters are strictly dependent on the waste management policies throughout the waste
streams which consist of: waste generation, collection and transportation, separation for resource recovery,
treatment for volume reduction, stabilisation, recycling and energy recovery and disposal at landfill sites.
Basic data on waste production and landfills system are those provided by the national Waste Cadastre,
basically built with data reported through the Uniform Statement Format (MUD). The Waste Cadastre is
formed by a national branch, hosted by ISPRA, and by regional and provincial branches.
These figures are elaborated and published by ISPRA yearly since 1999: the yearbooks report waste
production data, as well as data concerning landfilling, incineration, composting, anaerobic digestion and
generally waste life-cycle data (APAT-ONR, several years; ISPRA, several years [a]).
For inventory purposes, a database of waste production, waste disposal in managed and unmanaged
landfills and sludge disposal in landfills was created and it has been assumed that waste landfilling started in
1950.
For the year 2015, the non hazardous landfills in Italy disposed 7,819 kt of MSW and 3,222 kt of
industrial wastes, as well as 177 kt of sludge from urban wastewater treatment plants.
In Table 7.2, the time series of AMSW and domestic sludge disposed into non hazardous landfills from
1990 is reported.
Table 7.2 Trend of MSW production and MSW, AMSW and domestic sludge disposed in landfills (Gg)
ACTIVITY
DATA (Gg) 1990 1995 2000 2005 2010 2011 2012 2013 2014 2015
MSW production 22,231 25,780 28,959 31,664 32,479 31,386 29,994 29,573 29,652 29,524
MSW disposed in
landfills for non
hazardous waste
17,432 22,459 21,917 17,226 15,015 13,206 11,720 10,914 9,332 7,819
Assimilated MSW
disposed in
landfills for non
hazardous waste
2,828 2,978 2,825 2,914 3,508 2,883 2,292 2,512 2,913 3,222
Sludge disposed in
managed landfills
for non hazardous
waste
2,454 1,531 1,326 544 301 292 214 174 184 177
Total Waste to
managed landfills
for non hazardous
waste
16,363 21,897 26,069 20,684 18,825 16,380 14,226 13,600 12,429 11,218
Total Waste to
unmanaged
landfills for non
hazardous waste
6,351 5,071 0 0 0 0 0 0 0 0
Total Waste to
landfills for non
hazardous waste
22,714 26,968 26,069 20,684 18,825 16,380 14,226 13,600 12,429 11,218
Biological treatment of waste (5B)
Under this category, NMVOC and NH3 emissions from compost production are reported.
133 133
The amount of waste treated in composting plants has shown a great increase from 1990 to 2015 (from
283,879 Mg to 7,288,305 Mg).
Information on input waste to composting plants is published yearly by ISPRA since 1996, including data
for 1993 and 1994 (ANPA, 1998; APAT-ONR, several years; ISPRA, several years [a]), while for 1987 and
1995 only data on compost production are available (MATTM, several years [a]; AUSITRA-Assoambiente,
1995); on the basis of this information the whole time series has been reconstructed.
The composting plants are classified in two different kinds: the plants that treat a selected waste (food,
market, garden waste, sewage sludge and other organic waste, mainly from the agro-food industry); and the
mechanical-biological treatment plants, that treat the unselected waste to produce compost, refuse derived
fuel (RDF), and a waste with selected characteristics for landfilling or incinerating system.
It is assumed that 100% of the input waste to the composting plants from selected waste is treated as
compost, while in mechanical-biological treatment plants 30% of the input waste is treated as compost on the
basis of national studies and references (Favoino and Cortellini, 2001; Favoino and Girò, 2001). NMVOC
emission factor (51g NMVOC kg-1 treated waste) is from international scientific literature too (Finn and
Spencer, 1997).
Waste Incineration (5C1a – 5C1b)
Regarding waste incineration, methodology used for estimating emissions is based on and consistent with
the EMEP/CORINAIR Guidebook (EMEP/CORINAIR, 2007).
In this sector only emissions from facilities without energy recovery are reported, whereas emissions from
waste incineration facilities with energy recovery are reported in the Energy Sector 1A4a. In 2015, about
98% of the total amount of waste incinerated is treated in plants with energy recovery system.
Existing incinerators in Italy are used for the disposal of municipal waste, together with some industrial
waste, sanitary waste and sewage sludge for which the incineration plant has been authorized by the
competent authority. Other incineration plants are used exclusively for industrial and sanitary waste, both
hazardous and not, and for the combustion of waste oils, whereas there are plants that treat residual waste
from waste treatments, as well as sewage sludge.
A complete database of the incineration plants is now available, updated with the information reported in
the yearly report on waste production and management published by ISPRA (APAT-ONR, several years;
ISPRA, several years). For each plant a lot of information is reported, among which the year of the
construction and possible upgrade, the typology of combustion chamber and gas treatment section, energy
recovery section (thermal or electric), and the type and amount of waste incinerated (municipal, industrial,
etc.). A specific emission factor is therefore used for each pollutant combined with plant specific waste
activity data.
In Table 7.3, emission factors for each pollutant and waste typology are reported. Emission factors have
been estimated on the basis of a study conducted by ENEA (De Stefanis P., 1999), based on emission data
from a large sample of Italian incinerators (FEDERAMBIENTE, 1998; AMA-Comune di Roma, 1996), legal
thresholds (Ministerial Decree 19 November 1997, n. 503 of the Ministry of Environment; Ministerial
Decree 12 July 1990) and expert judgements.
For PCB and HCB emission factors published on the Guidebook EMEP/EEA (EMEP/CORINAIR, 2007)
in the relevant chapters are used, a survey on HCB emission factor from sludge incineration is currently
underway.
Since 2010, emission factors for urban waste incinerators have been updated on the basis of data provided
by plants (ENEA-federAmbiente, 2012; De Stefanis P., 2012) concerning the annual stack flow, the amount
of waste burned and the average concentrations of the pollutants at the stack.

134 134
Table 7.3 Emission factors for waste incineration
Air Pollutant u.m Municipal
1990-2009
Municipal
Since
2010
Industrial Clinical Sludge Oil
NOx kg/t 1.15 0.62 2 0.603624 3 2
CO kg/t 0.07 0.07 0.56 0.07542 0.6 0.07542
NMVOC kg/t 0.46046 0.46046 7.4 7.4 0.25116 7.4
SO2 kg/t 0.39 0.02 1.28 0.02594 1.28 1.28
PM10 g/t 46 6.06 240 25.676 180 240
PM2.5 g/t 46 6.06 240 25.676 180 240
BC g/t 1.61 0.21 8.40 0.90 6.30 8.40
As g/t 0.05 0.02 0.12 0.0042 0.5 0.12
Cu g/t 1 0.001 1.2 0.564 10 1.2
Se g/t 0.013 0.013 0.006 0.03736 - 0.006
Zn g/t 0.017 0.017 12.6 - 10 12.6
Cd g/t 0.25 0.01 0.8 0.001128 1.2 0.8
Cr g/t 0.45 0.002 1.6 0.01168 3 1.6
Hg g/t 0.15 0.033 0.8 0.03684 1.2 0.8
Ni g/t 16.35 0.001 0.8 0.02504 3 0.8
Pb g/t 1.35 1.04 24 0.0246 3 24
PAH g/t 0.05 0.00054 0.48 0.00014126 0.6 0.48
PCB g/t 0.005 0.00005 0.005 0.02 0.005 -
HCB g/t 0.001 0.00002 0.0001 0.019 0.500 -
Concerning dioxin emissions, clinical and industrial emission factors are also derived from data collected
from a large sample of Italian incinerators and legal thresholds, as well as expert judgement; in particular for
municipal solid waste, emission factors vary within the years and the facility on the basis of plant technology
(i.e. typology of combustion chamber and gas treatment section) and the year of the upgrade. This site
specific evaluation has been possible thanks to a study conducted in the past for a sample of municipal waste
incinerators located in Regione Lombardia in order to produce an assessment of field-based values
applicable to other facilities with the same characteristics (Pastorelli et al., 2001) and, since 2010 urban
waste data, thanks to the abovementioned survey (ENEA-federAmbiente, 2012). Moreover, for the
incineration plants reported in the national EPER/PRTR register, verification of emissions has been carried
out.
In Table 7.4 dioxin emission factors for waste incineration are reported for 1990 and 2015.
Table 7.4 Dioxin emission factors for 1990 and 2015
Waste Typology u.m 1990 2015
Municipal g/t 115 - 1.6 0.1
Clinical g/t 200 0.5
Industrial g/t 80 - 135 0.5
Sludge g/t 77 0.5
Oil g/t 200 0.5
In Table 7.5 activity data are reported by type of waste.
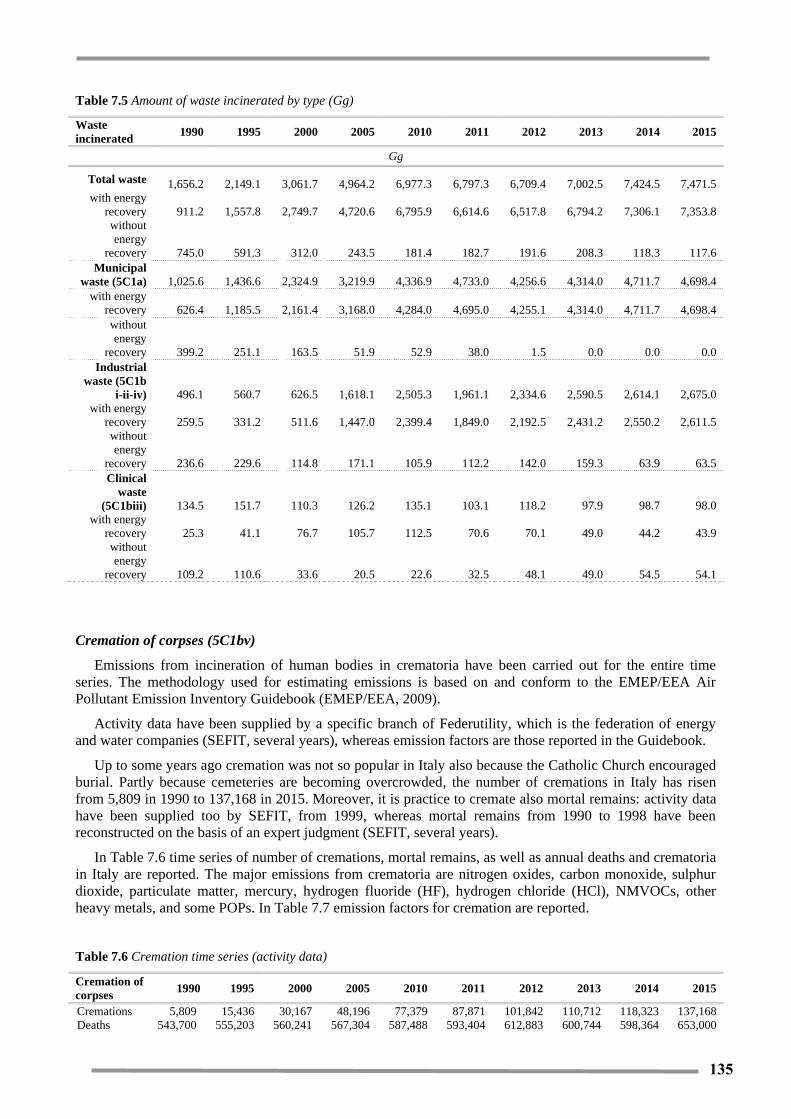
135 135
Table 7.5 Amount of waste incinerated by type (Gg)
Waste
incinerated 1990 1995 2000 2005 2010 2011 2012 2013 2014 2015
Gg
Total waste 1,656.2 2,149.1 3,061.7 4,964.2 6,977.3 6,797.3 6,709.4 7,002.5 7,424.5 7,471.5
with energy
recovery 911.2 1,557.8 2,749.7 4,720.6 6,795.9 6,614.6 6,517.8 6,794.2 7,306.1 7,353.8
without
energy
recovery 745.0 591.3 312.0 243.5 181.4 182.7 191.6 208.3 118.3 117.6
Municipal
waste (5C1a) 1,025.6 1,436.6 2,324.9 3,219.9 4,336.9 4,733.0 4,256.6 4,314.0 4,711.7 4,698.4
with energy
recovery 626.4 1,185.5 2,161.4 3,168.0 4,284.0 4,695.0 4,255.1 4,314.0 4,711.7 4,698.4
without
energy
recovery 399.2 251.1 163.5 51.9 52.9 38.0 1.5 0.0 0.0 0.0
Industrial
waste (5C1b
i-ii-iv) 496.1 560.7 626.5 1,618.1 2,505.3 1,961.1 2,334.6 2,590.5 2,614.1 2,675.0
with energy
recovery 259.5 331.2 511.6 1,447.0 2,399.4 1,849.0 2,192.5 2,431.2 2,550.2 2,611.5
without
energy
recovery 236.6 229.6 114.8 171.1 105.9 112.2 142.0 159.3 63.9 63.5
Clinical
waste
(5C1biii) 134.5 151.7 110.3 126.2 135.1 103.1 118.2 97.9 98.7 98.0
with energy
recovery 25.3 41.1 76.7 105.7 112.5 70.6 70.1 49.0 44.2 43.9
without
energy
recovery 109.2 110.6 33.6 20.5 22.6 32.5 48.1 49.0 54.5 54.1
Cremation of corpses (5C1bv)
Emissions from incineration of human bodies in crematoria have been carried out for the entire time
series. The methodology used for estimating emissions is based on and conform to the EMEP/EEA Air
Pollutant Emission Inventory Guidebook (EMEP/EEA, 2009).
Activity data have been supplied by a specific branch of Federutility, which is the federation of energy
and water companies (SEFIT, several years), whereas emission factors are those reported in the Guidebook.
Up to some years ago cremation was not so popular in Italy also because the Catholic Church encouraged
burial. Partly because cemeteries are becoming overcrowded, the number of cremations in Italy has risen
from 5,809 in 1990 to 137,168 in 2015. Moreover, it is practice to cremate also mortal remains: activity data
have been supplied too by SEFIT, from 1999, whereas mortal remains from 1990 to 1998 have been
reconstructed on the basis of an expert judgment (SEFIT, several years).
In Table 7.6 time series of number of cremations, mortal remains, as well as annual deaths and crematoria
in Italy are reported. The major emissions from crematoria are nitrogen oxides, carbon monoxide, sulphur
dioxide, particulate matter, mercury, hydrogen fluoride (HF), hydrogen chloride (HCl), NMVOCs, other
heavy metals, and some POPs. In Table 7.7 emission factors for cremation are reported.
Table 7.6 Cremation time series (activity data)
Cremation of
corpses 1990 1995 2000 2005 2010 2011 2012 2013 2014 2015
Cremations 5,809 15,436 30,167 48,196 77,379 87,871 101,842 110,712 118,323 137,168
Deaths 543,700 555,203 560,241 567,304 587,488 593,404 612,883 600,744 598,364 653,000
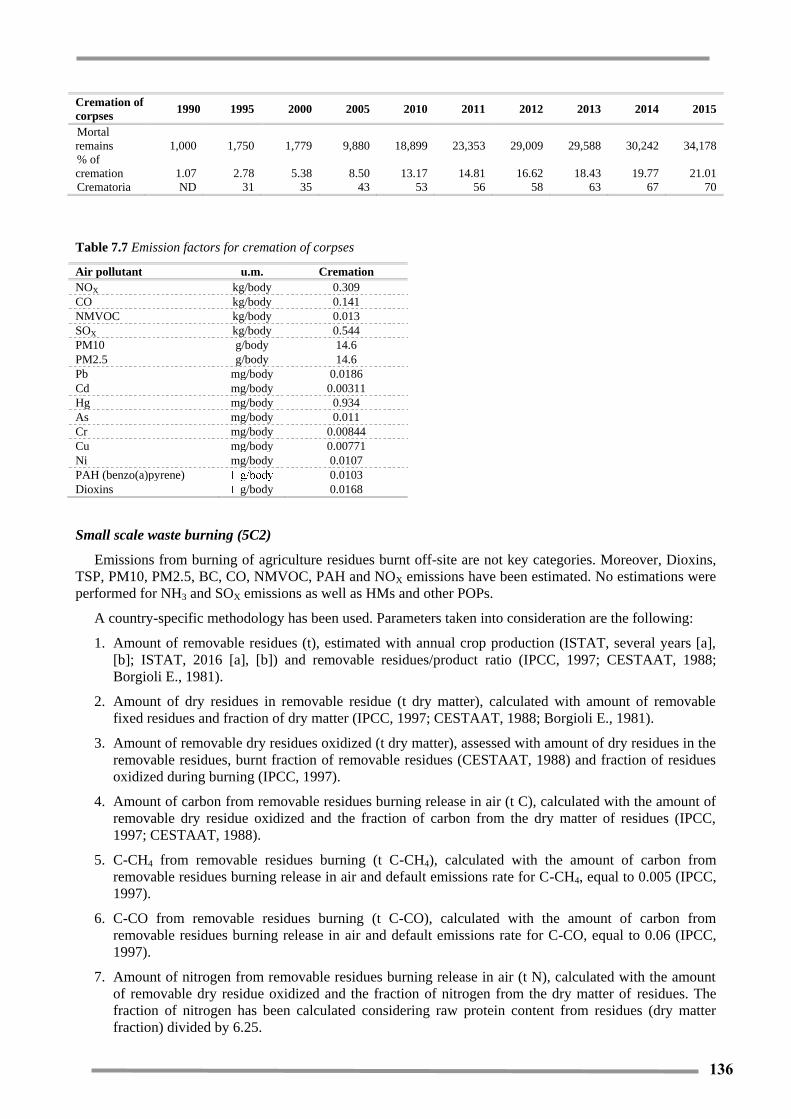
136 136
Cremation of
corpses 1990 1995 2000 2005 2010 2011 2012 2013 2014 2015
Mortal
remains 1,000 1,750 1,779 9,880 18,899 23,353 29,009 29,588 30,242 34,178
% of
cremation 1.07 2.78 5.38 8.50 13.17 14.81 16.62 18.43 19.77 21.01
Crematoria ND 31 35 43 53 56 58 63 67 70
Table 7.7 Emission factors for cremation of corpses
Air pollutant u.m. Cremation
NOX kg/body 0.309
CO kg/body 0.141
NMVOC kg/body 0.013
SOX kg/body 0.544
PM10 g/body 14.6
PM2.5 g/body 14.6
Pb mg/body 0.0186
Cd mg/body 0.00311
Hg mg/body 0.934
As mg/body 0.011
Cr mg/body 0.00844
Cu mg/body 0.00771
Ni mg/body 0.0107
PAH (benzo(a)pyrene) 0.0103
Dioxins g/body 0.0168
Small scale waste burning (5C2)
Emissions from burning of agriculture residues burnt off-site are not key categories. Moreover, Dioxins,
TSP, PM10, PM2.5, BC, CO, NMVOC, PAH and NOX emissions have been estimated. No estimations were
performed for NH3 and SOX emissions as well as HMs and other POPs.
A country-specific methodology has been used. Parameters taken into consideration are the following:
1. Amount of removable residues (t), estimated with annual crop production (ISTAT, several years [a],
[b]; ISTAT, 2016 [a], [b]) and removable residues/product ratio (IPCC, 1997; CESTAAT, 1988;
Borgioli E., 1981).
2. Amount of dry residues in removable residue (t dry matter), calculated with amount of removable
fixed residues and fraction of dry matter (IPCC, 1997; CESTAAT, 1988; Borgioli E., 1981).
3. Amount of removable dry residues oxidized (t dry matter), assessed with amount of dry residues in the
removable residues, burnt fraction of removable residues (CESTAAT, 1988) and fraction of residues
oxidized during burning (IPCC, 1997).
4. Amount of carbon from removable residues burning release in air (t C), calculated with the amount of
removable dry residue oxidized and the fraction of carbon from the dry matter of residues (IPCC,
1997; CESTAAT, 1988).
5. C-CH4 from removable residues burning (t C-CH4), calculated with the amount of carbon from
removable residues burning release in air and default emissions rate for C-CH4, equal to 0.005 (IPCC,
1997).
6. C-CO from removable residues burning (t C-CO), calculated with the amount of carbon from
removable residues burning release in air and default emissions rate for C-CO, equal to 0.06 (IPCC,
1997).
7. Amount of nitrogen from removable residues burning release in air (t N), calculated with the amount
of removable dry residue oxidized and the fraction of nitrogen from the dry matter of residues. The
fraction of nitrogen has been calculated considering raw protein content from residues (dry matter
fraction) divided by 6.25.

137 137
8. N-NOX from removable residues burning (t N-NOX), calculated with the amount of nitrogen from
removable residues burning release in air and the default emissions rate for N- NOX, equal to 0.121
(IPCC, 1997).
NMVOC emissions have been considered equal to CH4 emissions. As regards the other pollutants, the
following emission factors have been used to estimate PAH, PM, BC and dioxins (Table 7.8).
Table 7.8 Emission factors for burning of agriculture residues
Air pollutant u.m. Removable residues References
PAH g/t 8.58 TNO, 1995
PM10 g/t 3.3 EMEP/CORINAIR, 2007
PM2.5 g/t 2.8 EMEP/CORINAIR, 2007
Dioxins g/t 10 EMEP/CORINAIR, 2007
BC g/t 1.2 EMEP/EEA, 2013
Removable residues from agriculture production are estimated for each crop type (cereal, green crop,
permanent cultivation) taking into account the amount of crop produced, from national statistics (ISTAT,
several years [a], [b]; ISTAT, 2014 [a], [b]), the ratio of removable residue in the crop, the dry matter content
of removable residue, the ratio of removable residue burned, the fraction of residues oxidised in burning, the
carbon and nitrogen content of the residues. Most of these wastes refer especially to the prunes of olives and
wine, because of the typical national cultivation. Activity data (agricultural production) used for estimating
burning of agriculture residues are reported in Table 7.9. Emissions due to stubble burning, which are
emissions only from the agriculture residues burned on field, are reported in the agriculture sector, under 4.F.
Under the waste sector the burning of removable agriculture residues that are collected and could be
managed in different ways (disposed in landfills, used to produce compost or used to produce energy) is
reported. Different percentages of the removable agriculture residue burnt for different residues are assumed,
varying from 10% to 90%, according to national and international literature. Moreover, these removable
wastes are assumed to be all burned in open air (e.g. on field), taking in consideration the highest available
CO, NMVOC, PM, PAH and dioxins emission factors as reported in the table above. The amount of biomass
from pruning used for domestic heating is reported in the energy sector in the 1A4b category as biomass fuel.
Table 7.9 Time series of crop productions (Gg)
Production 1990 1995 2000 2005 2010 2011 2012 2013 2014 2015
Gg
Cereals
Wheat 8,108.5 7,946.1 7,427.7 7,717.1 6,849.9 6,641.8 7,654.2 7,312.0 7,141.9 7,394.5
Rye 20.8 19.8 10.3 7.9 13.9 14.4 16.1 14.3 11.5 13.2
Barley 1,702.5 1,387.1 1,261.6 1,214.1 944.3 950.9 940.2 875.6 848.7 955.1
Oats 298.4 301.3 317.9 429.2 288.9 297.1 292.4 246.9 241.1 261.4
Rice 1,290.7 1,320.9 1,245.6 1,444.8 1,574.3 1,560.1 1,601.5 1,433.1 1,415.9 1,518.3
Maize 5,863.9 8,454.2 10,139.6 10,427.9 8,495.9 9,752.4 7,888.7 7,899.6 9,250.0 7,073.9
Sorghum 114.2 214.8 215.2 184.9 275.6 299.9 157.8 316.9 368.8 294.2
Woody
crops
Grapes 8,438.0 8,447.7 8,869.5 8,553.6 7,839.7 7,054.7 6,918.0 8,010.4 6,930.8 7,915.0
Olives 912.5 3,323.5 2,810.3 3,774.8 3,117.8 3,168.3 3,017.5 2,940.5 1,913.7 2,732.9
Citrus
Orchards 2,868.8 2,607.7 3,100.2 3,518.1 3,820.6 3,434.8 2,925.1 2,720.6 2,705.5 3,151.5
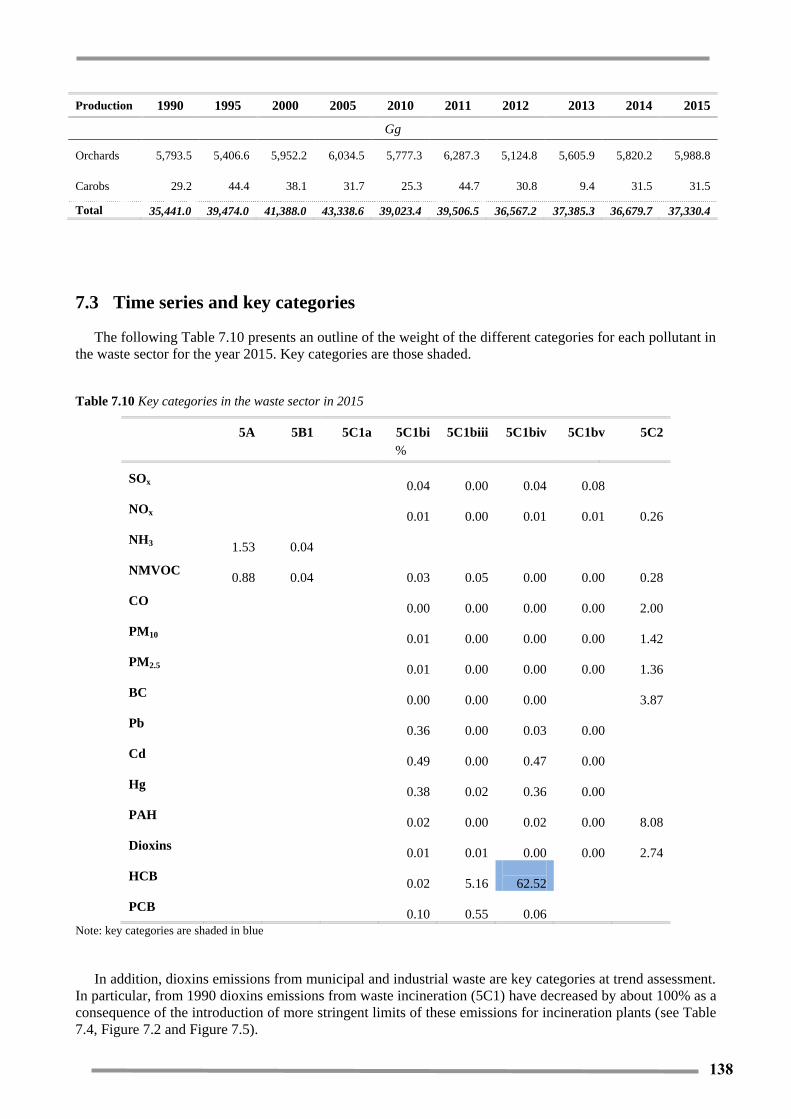
138 138
Production 1990 1995 2000 2005 2010 2011 2012 2013 2014 2015
Gg
Orchards 5,793.5 5,406.6 5,952.2 6,034.5 5,777.3 6,287.3 5,124.8 5,605.9 5,820.2 5,988.8
Carobs 29.2 44.4 38.1 31.7 25.3 44.7 30.8 9.4 31.5 31.5
Total 35,441.0 39,474.0 41,388.0 43,338.6 39,023.4 39,506.5 36,567.2 37,385.3 36,679.7 37,330.4
7.3 Time series and key categories
The following Table 7.10 presents an outline of the weight of the different categories for each pollutant in
the waste sector for the year 2015. Key categories are those shaded.
Table 7.10 Key categories in the waste sector in 2015
5A 5B1 5C1a 5C1bi 5C1biii 5C1biv 5C1bv 5C2
%
SOx 0.04
0.00
0.04
0.08
NOx 0.01
0.00
0.01
0.01
0.26
NH3
1.53
0.04
NMVOC
0.88
0.04 0.03
0.05
0.00
0.00
0.28
CO 0.00
0.00
0.00
0.00
2.00
PM10 0.01
0.00
0.00
0.00
1.42
PM2.5 0.01
0.00
0.00
0.00
1.36
BC 0.00
0.00
0.00
3.87
Pb 0.36
0.00
0.03
0.00
Cd 0.49
0.00
0.47
0.00
Hg 0.38
0.02
0.36
0.00
PAH 0.02
0.00
0.02
0.00
8.08
Dioxins 0.01
0.01
0.00
0.00
2.74
HCB 0.02
5.16
62.52
PCB 0.10
0.55
0.06
Note: key categories are shaded in blue
In addition, dioxins emissions from municipal and industrial waste are key categories at trend assessment.
In particular, from 1990 dioxins emissions from waste incineration (5C1) have decreased by about 100% as a
consequence of the introduction of more stringent limits of these emissions for incineration plants (see Table
7.4, Figure 7.2 and Figure 7.5).

139 139
The following pie charts show, for the main pollutants, the contribution of each sub-category to the total
emissions from the waste sector, both for 1990 and 2015 (Figure 7.1, Figure 7.2, Figure 7.3 and Figure 7.4).
It is important to point out that industrial waste incineration is the major source of HCB emissions (63%
of the national total), in particular the waste water sludge incineration, 12.46 Kg in 2015, which shows an
increase of 20.3% with respect to the reference year (Figure 7.2).
Finally, in Table 7.11, emissions time series for each pollutant of the waste sector are reported. In the
period 1990-2015, total emissions from incineration plants increase, but whereas emissions from plants with
energy recovery show a strong growth, emissions from plants without energy recovery decreased because of
the legal constraints which impose the energy production. For 2015, about 98% of the total amount of waste
incinerated is treated in plants with energy recovery system reported in 1A4a.

140 140
Figure 7.1 Contribution of CO, NOX and NMVOC sub-category emissions to waste sector total emissions
0.09%
99.85%
5C1biii
5C1bi-
ii-iv5C1a
5C1bv
5C2
2015CO0.33%
99.58%
5C1biii
5C1bi-
ii-iv5C1a
5C1bv
5C2
1990CO
1.64% 7.63%
0.00%
88.43%
5C1biii
5C1bi-
ii-iv5C1a
5C1bv
5C2
2015NOx3%
18%
17%
62%
5C1biii
5C1bi-
ii-iv5C1a
5C1bv
5C2
1990NOx
71.16%
3.71%
3.63%
2.64%
0.00%
0.02%
18.85% 5A
5B
5C1biii
5C1bi-
ii-iv5C1a
2015NMVOC
67.68%0.10%
5.72%
11.34%
1.30%
0.00%13.86%
5A
5B
5C1biii
5C1bi-
ii-iv5C1a
1990NMVOC

141 141
Figure 7.2 Contribution of POPs Annex III sub-category emissions to waste sector total emissions
0.50%
99.50%
5C1biii
5C1bi-
ii-iv
5C1a
5C1bv
5C2
2015PAH1.95%
97.71%
5C1biii
5C1bi-
ii-iv
5C1a
5C1bv
5C2
1990PAH
0.41%
99.20%
5C1biii
5C1bi-
ii-iv
5C1a
5C1bv
5C2
2015Diox
20%
32%
41%
7%5C1biii
5C1bi-
ii-iv
5C1a
5C1bv
5C2
1990Diox
7.62%
92.38%
0.00%
5C1biii
5C1bi-
ii-iv
5C1a
2015HCB
16%
81%
3%
5C1biii
5C1bi-
ii-iv
5C1a
1990HCB
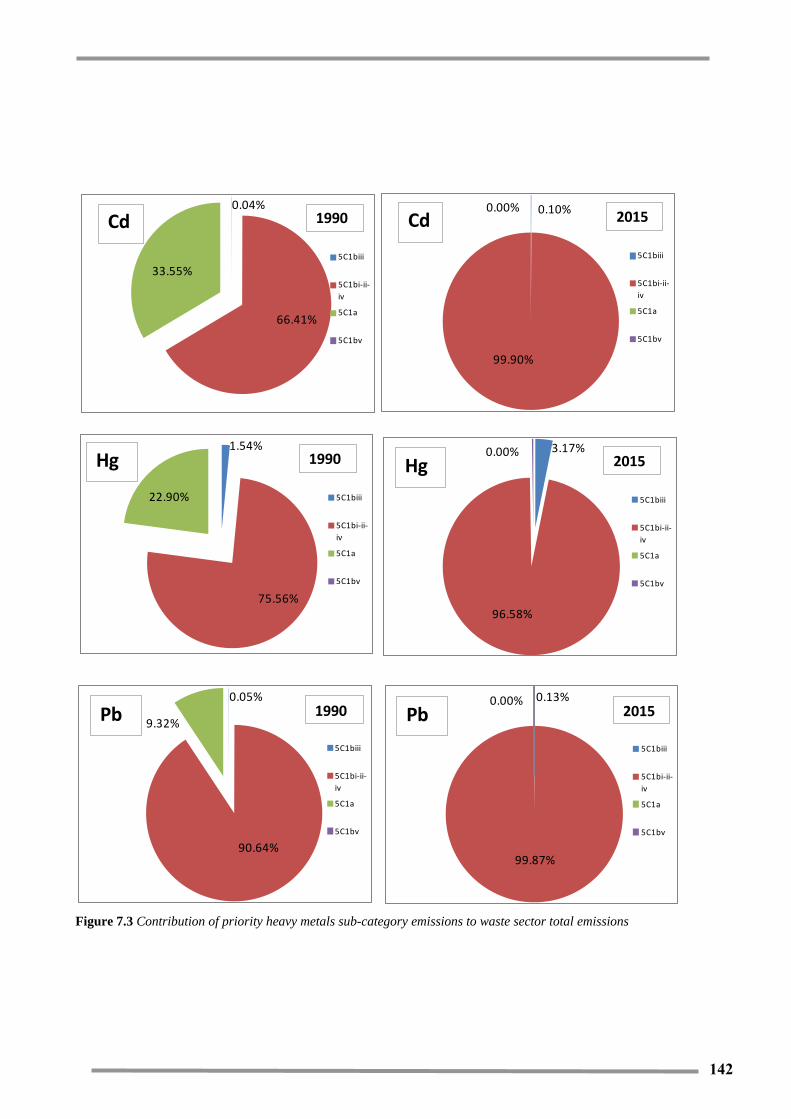
142 142
Figure 7.3 Contribution of priority heavy metals sub-category emissions to waste sector total emissions
0.10%
99.90%
0.00%
5C1biii
5C1bi-ii-
iv
5C1a
5C1bv
Cd 2015
3.17%
96.58%
0.00%
5C1biii
5C1bi-ii-
iv
5C1a
5C1bv
Hg 2015
0.13%
99.87%
0.00%
5C1biii
5C1bi-ii-
iv
5C1a
5C1bv
Pb 2015
0.04%
66.41%
33.55%5C1biii
5C1bi-ii-
iv
5C1a
5C1bv
Cd 1990
1.54%
75.56%
22.90% 5C1biii
5C1bi-ii-
iv
5C1a
5C1bv
Hg 1990
0.05%
90.64%
9.32%
5C1biii
5C1bi-ii-
iv
5C1a
5C1bv
Pb 1990
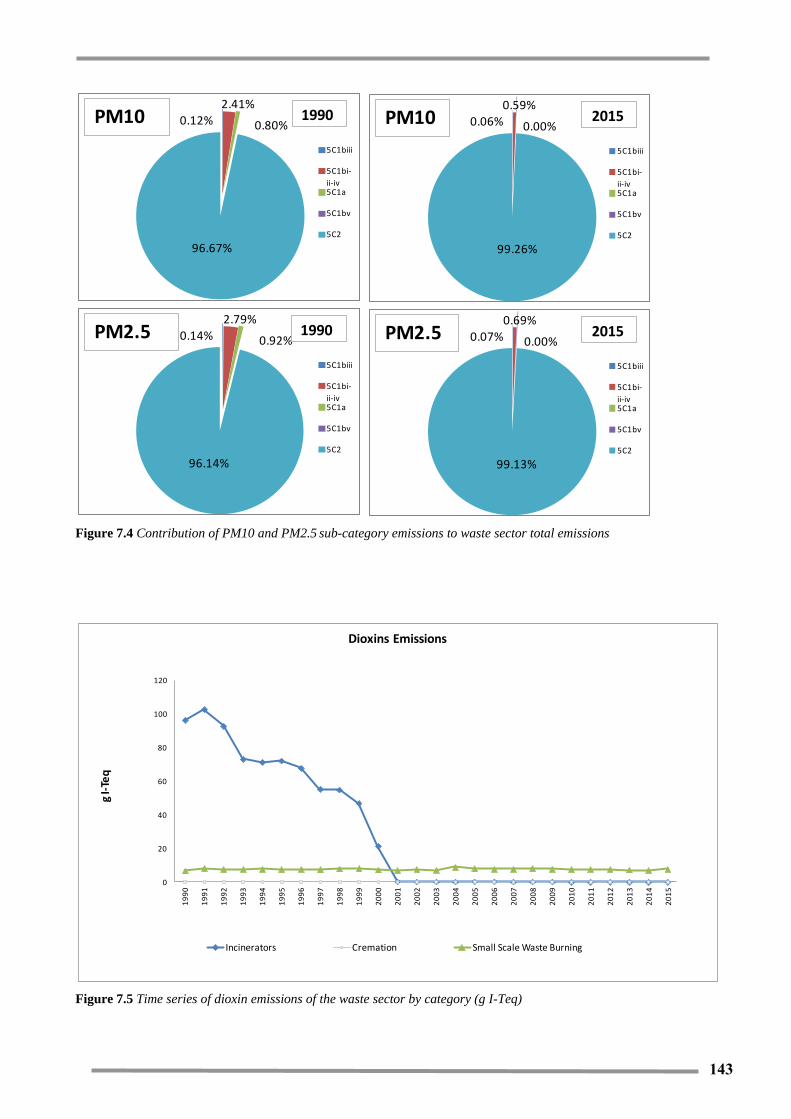
143 143
Figure 7.4 Contribution of PM10 and PM2.5 sub-category emissions to waste sector total emissions
Figure 7.5 Time series of dioxin emissions of the waste sector by category (g I-Teq)
0.12%
2.41%
0.80%
96.67%
5C1biii
5C1bi-
ii-iv5C1a
5C1bv
5C2
1990PM10 0.06%
0.59%
0.00%
99.26%
5C1biii
5C1bi-
ii-iv5C1a
5C1bv
5C2
2015PM10
0.14%
2.79%
0.92%
96.14%
5C1biii
5C1bi-
ii-iv5C1a
5C1bv
5C2
1990PM2.5 0.07%
0.69%
0.00%
99.13%
5C1biii
5C1bi-
ii-iv5C1a
5C1bv
5C2
2015PM2.5
0
20
40
60
80
100
120
19
90
19
91
19
92
19
93
19
94
19
95
19
96
19
97
19
98
19
99
20
00
20
01
20
02
20
03
20
04
20
05
20
06
20
07
20
08
20
09
20
10
20
11
20
12
20
13
20
14
20
15
g I-
Teq
Dioxins Emissions
Incinerators Cremation Small Scale Waste Burning

144 144
Table 7.11 Time series emissions in the waste sector by category and pollutant
WASTE SECTOR 1990 1995 2000 2005 2010 2011 2012 2013 2014 2015
Solid waste disposal
(5A)
NMVOC (Gg) 9.57 8.92 10.22 10.37 9.23 8.93 8.96 8.06 7.90 7.44
NH3 (Gg) 7.76 7.23 8.28 8.41 7.48 7.24 7.26 6.53 6.41 6.03
Biological treatment
of waste (5B)
NMVOC (Gg) 0.01 0.03 0.14 0.28 0.36 0.36 0.36 0.38 0.41 0.37
NH3 (Gg) 0.01 0.02 0.07 0.13 0.17 0.17 0.17 0.18 0.19 0.17
Waste incineration
(5C)
CO (Gg) 40.68 46.90 45.38 50.47 47.18 46.79 47.66 44.86 42.03 47.20
NOx (Gg) 2.68 2.80 2.34 2.55 2.32 2.31 2.35 2.31 2.00 2.21
NMVOC (Gg) 4.55 4.75 3.26 3.78 3.25 3.27 3.52 3.57 2.79 3.01
SOx (Gg) 0.48 0.42 0.24 0.28 0.21 0.21 0.27 0.29 0.18 0.19
PM10 (Gg) 2.31 2.55 2.45 2.68 2.55 2.54 2.54 2.45 2.34 2.56
PM2.5 (Gg) 1.99 2.19 2.10 2.31 2.19 2.18 2.19 2.10 2.01 2.19
BC (Gg) 0.81 0.89 0.87 0.95 0.91 0.91 0.90 0.87 0.84 0.91
PAH (t) 5.94 6.57 6.34 6.95 6.62 6.59 6.60 6.34 6.08 6.64
Dioxins (g I-Teq)) 103.22 79.68 28.76 8.18 7.73 7.69 7.70 7.41 7.10 7.76
HCB (kg) 12.86 13.96 9.87 8.26 3.43 8.81 14.29 13.95 13.58 13.49
PCB (kg) 5.36 4.61 2.06 1.52 0.98 1.21 1.67 1.78 1.41 1.40
As (t) 0.06 0.05 0.03 0.03 0.02 0.02 0.03 0.03 0.02 0.02
Cd (t) 0.30 0.26 0.14 0.16 0.09 0.10 0.12 0.14 0.06 0.06
Cr (t) 0.59 0.51 0.28 0.32 0.18 0.20 0.27 0.29 0.14 0.14
Cu (t) 0.93 0.79 0.48 0.41 0.19 0.30 0.43 0.45 0.33 0.33
Hg (t) 0.26 0.23 0.12 0.15 0.09 0.10 0.13 0.14 0.06 0.06
Ni (t) 6.76 4.34 2.81 1.02 0.10 0.13 0.17 0.19 0.11 0.11
Pb (t) 5.78 5.36 2.60 3.85 2.47 2.39 2.85 3.28 1.01 1.00
Se (t) 0.01 0.01 0.00 0.00 0.00 0.00 0.00 0.00 0.00 0.00
Zn (t) 2.93 2.84 1.40 2.12 1.32 1.37 1.72 1.94 0.74 0.74
7.4 Recalculations
In the following table the recalculations occurred in the 2017 submission with respect the last year
submission are reported at category level for the whole time series
Table 7.12 Recalculations in the waste sector by category and pollutant
WASTE SECTOR 1990 1995 2000 2005 2010 2011 2012 2013 2014
Solid waste disposal
(5A)
NMVOC -10.58% -9.72% 1.19% 4.92% 5.29% 7.07% 10.26% 11.22%
NH3 -10.58% -9.72% 1.19% 4.92% 5.29% 7.07% 10.26% 11.22%
Biological treatment of
waste (5B)
NMVOC
NH3
Waste incineration
(5C)
CO 0.03% -0.01% 0.01% -0.02% -0.01% -0.01% 0.68%
NOx 0.03% -0.01% 0.01% -0.02% -0.01% -0.01% -8.69%
NMVOC 0.02% -0.01% 0.01% -0.01% -0.01% -0.01% -20.18%
SOx -42.80%
PM10 0.02% -0.01% 0.01% -0.01% -0.01% -0.01% -0.21%
PM2.5 0.02% -0.01% 0.01% -0.01% -0.01% -0.01% -0.38%
BC 0.02% -0.01% 0.01% -0.01% -0.01% -0.01% 0.74%
PAH 0.02% -0.01% 0.01% -0.01% -0.01% -0.01% 0.02%
Dioxins 0.01% -0.01% 0.01% -0.01% -0.01% -0.01% 0.13%
HCB -6.98%
PCB -24.22%
As -42.99%
Cd -57.59%

145 145
WASTE SECTOR 1990 1995 2000 2005 2010 2011 2012 2013 2014
Cr -54.83%
Cu -29.97%
Hg -56.74%
Ni -44.67%
Pb -70.62%
Se -17.61%
Zn -63.55%
According with the discussion during the ESD review about CH4 emissions from landfills, Italy partially
revised the half life values considering the change in the Italian climatic conditions in terms of annual
precipitation. The estimated trends of cumulated rainfall from 1951 to 2015 are decreasing (ISPRA, several
years [b]; http://www.scia.isprambiente.it/Documentazione/RAPPORTOCLIMA2015.pdf), above all in the
south of Italy where waste management is still largely carried out using landfills. Less precipitation means
higher half life values and different distribution of emissions in time. Consequently, emissions of NMVOC
and NH3 undergo a recalculation decreasing by 10.6% in 1992 and increasing by 11.2% in 2014.
About biological treatment, no recalculations occurred.
As regards incineration, recalculations occurred from 1998 because of the update of orchards activity data
and the consequent change in the emissions from burning of agriculture residues. Changes from 2011 have
been due to the update of activity data supplied by waste incinerators too.
The analysis regarding incineration plants has been conducted through verifications and comparisons with
data reported in E-PRTR registry, Emissions Trading Scheme and updated data of incinerated waste amount
by plants.
7.5 Planned improvements
Emissions from flaring of exceeding biogas in landfills and wastewater treatment plants are under
investigation and will be included in further submissions.
Following the encouragement derived from the review process NMVOC emissions from wastewater
treatment plants are under investigations.
As regards incineration, a survey on HCB emission factor from sludge incineration is ongoing as well as
further investigation on emission factors from cremation collecting the relevant data at plant level.
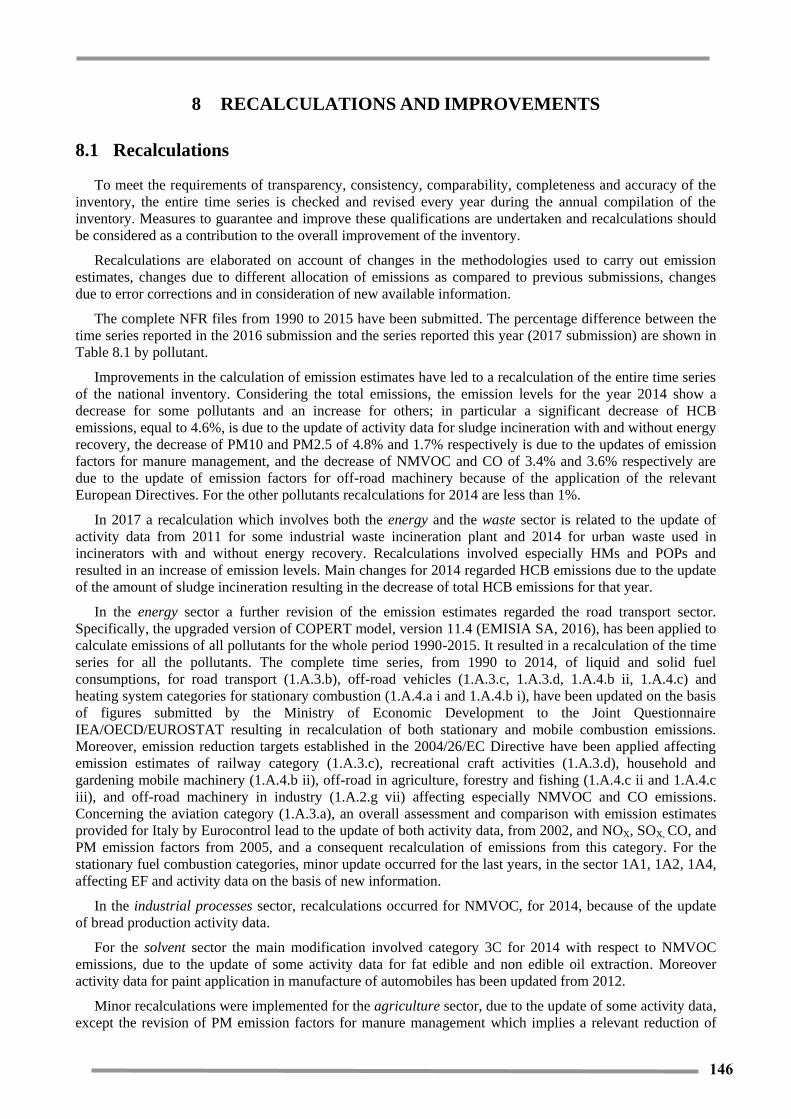
146 146
8 RECALCULATIONS AND IMPROVEMENTS
8.1 Recalculations
To meet the requirements of transparency, consistency, comparability, completeness and accuracy of the
inventory, the entire time series is checked and revised every year during the annual compilation of the
inventory. Measures to guarantee and improve these qualifications are undertaken and recalculations should
be considered as a contribution to the overall improvement of the inventory.
Recalculations are elaborated on account of changes in the methodologies used to carry out emission
estimates, changes due to different allocation of emissions as compared to previous submissions, changes
due to error corrections and in consideration of new available information.
The complete NFR files from 1990 to 2015 have been submitted. The percentage difference between the
time series reported in the 2016 submission and the series reported this year (2017 submission) are shown in
Table 8.1 by pollutant.
Improvements in the calculation of emission estimates have led to a recalculation of the entire time series
of the national inventory. Considering the total emissions, the emission levels for the year 2014 show a
decrease for some pollutants and an increase for others; in particular a significant decrease of HCB
emissions, equal to 4.6%, is due to the update of activity data for sludge incineration with and without energy
recovery, the decrease of PM10 and PM2.5 of 4.8% and 1.7% respectively is due to the updates of emission
factors for manure management, and the decrease of NMVOC and CO of 3.4% and 3.6% respectively are
due to the update of emission factors for off-road machinery because of the application of the relevant
European Directives. For the other pollutants recalculations for 2014 are less than 1%.
In 2017 a recalculation which involves both the energy and the waste sector is related to the update of
activity data from 2011 for some industrial waste incineration plant and 2014 for urban waste used in
incinerators with and without energy recovery. Recalculations involved especially HMs and POPs and
resulted in an increase of emission levels. Main changes for 2014 regarded HCB emissions due to the update
of the amount of sludge incineration resulting in the decrease of total HCB emissions for that year.
In the energy sector a further revision of the emission estimates regarded the road transport sector.
Specifically, the upgraded version of COPERT model, version 11.4 (EMISIA SA, 2016), has been applied to
calculate emissions of all pollutants for the whole period 1990-2015. It resulted in a recalculation of the time
series for all the pollutants. The complete time series, from 1990 to 2014, of liquid and solid fuel
consumptions, for road transport (1.A.3.b), off-road vehicles (1.A.3.c, 1.A.3.d, 1.A.4.b ii, 1.A.4.c) and
heating system categories for stationary combustion (1.A.4.a i and 1.A.4.b i), have been updated on the basis
of figures submitted by the Ministry of Economic Development to the Joint Questionnaire
IEA/OECD/EUROSTAT resulting in recalculation of both stationary and mobile combustion emissions.
Moreover, emission reduction targets established in the 2004/26/EC Directive have been applied affecting
emission estimates of railway category (1.A.3.c), recreational craft activities (1.A.3.d), household and
gardening mobile machinery (1.A.4.b ii), off-road in agriculture, forestry and fishing (1.A.4.c ii and 1.A.4.c
iii), and off-road machinery in industry (1.A.2.g vii) affecting especially NMVOC and CO emissions.
Concerning the aviation category (1.A.3.a), an overall assessment and comparison with emission estimates
provided for Italy by Eurocontrol lead to the update of both activity data, from 2002, and NOX, SOX, CO, and
PM emission factors from 2005, and a consequent recalculation of emissions from this category. For the
stationary fuel combustion categories, minor update occurred for the last years, in the sector 1A1, 1A2, 1A4,
affecting EF and activity data on the basis of new information.
In the industrial processes sector, recalculations occurred for NMVOC, for 2014, because of the update
of bread production activity data.
For the solvent sector the main modification involved category 3C for 2014 with respect to NMVOC
emissions, due to the update of some activity data for fat edible and non edible oil extraction. Moreover
activity data for paint application in manufacture of automobiles has been updated from 2012.
Minor recalculations were implemented for the agriculture sector, due to the update of some activity data,
except the revision of PM emission factors for manure management which implies a relevant reduction of
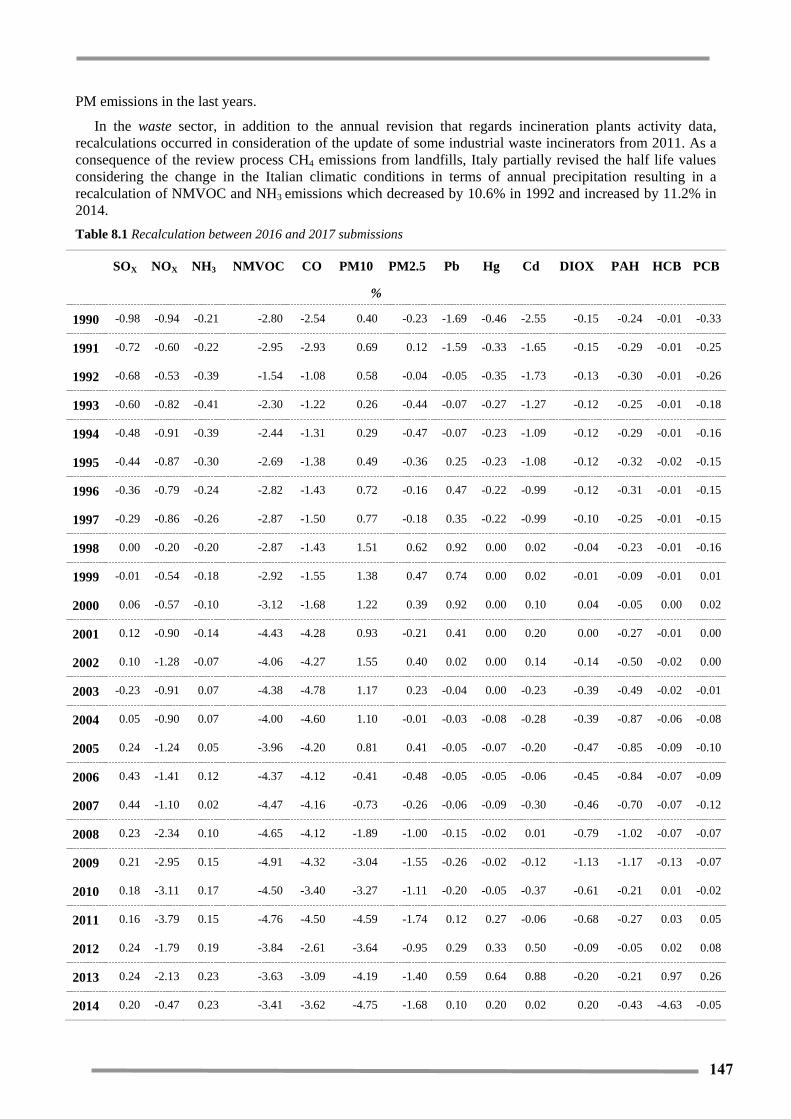
147 147
PM emissions in the last years.
In the waste sector, in addition to the annual revision that regards incineration plants activity data,
recalculations occurred in consideration of the update of some industrial waste incinerators from 2011. As a
consequence of the review process CH4 emissions from landfills, Italy partially revised the half life values
considering the change in the Italian climatic conditions in terms of annual precipitation resulting in a
recalculation of NMVOC and NH3 emissions which decreased by 10.6% in 1992 and increased by 11.2% in
2014.
Table 8.1 Recalculation between 2016 and 2017 submissions
SOX NOX NH3 NMVOC CO PM10 PM2.5 Pb Hg Cd DIOX PAH HCB PCB
%
1990 -0.98 -0.94 -0.21 -2.80 -2.54 0.40 -0.23 -1.69 -0.46 -2.55 -0.15 -0.24 -0.01 -0.33
1991 -0.72 -0.60 -0.22 -2.95 -2.93 0.69 0.12 -1.59 -0.33 -1.65 -0.15 -0.29 -0.01 -0.25
1992 -0.68 -0.53 -0.39 -1.54 -1.08 0.58 -0.04 -0.05 -0.35 -1.73 -0.13 -0.30 -0.01 -0.26
1993 -0.60 -0.82 -0.41 -2.30 -1.22 0.26 -0.44 -0.07 -0.27 -1.27 -0.12 -0.25 -0.01 -0.18
1994 -0.48 -0.91 -0.39 -2.44 -1.31 0.29 -0.47 -0.07 -0.23 -1.09 -0.12 -0.29 -0.01 -0.16
1995 -0.44 -0.87 -0.30 -2.69 -1.38 0.49 -0.36 0.25 -0.23 -1.08 -0.12 -0.32 -0.02 -0.15
1996 -0.36 -0.79 -0.24 -2.82 -1.43 0.72 -0.16 0.47 -0.22 -0.99 -0.12 -0.31 -0.01 -0.15
1997 -0.29 -0.86 -0.26 -2.87 -1.50 0.77 -0.18 0.35 -0.22 -0.99 -0.10 -0.25 -0.01 -0.15
1998 0.00 -0.20 -0.20 -2.87 -1.43 1.51 0.62 0.92 0.00 0.02 -0.04 -0.23 -0.01 -0.16
1999 -0.01 -0.54 -0.18 -2.92 -1.55 1.38 0.47 0.74 0.00 0.02 -0.01 -0.09 -0.01 0.01
2000 0.06 -0.57 -0.10 -3.12 -1.68 1.22 0.39 0.92 0.00 0.10 0.04 -0.05 0.00 0.02
2001 0.12 -0.90 -0.14 -4.43 -4.28 0.93 -0.21 0.41 0.00 0.20 0.00 -0.27 -0.01 0.00
2002 0.10 -1.28 -0.07 -4.06 -4.27 1.55 0.40 0.02 0.00 0.14 -0.14 -0.50 -0.02 0.00
2003 -0.23 -0.91 0.07 -4.38 -4.78 1.17 0.23 -0.04 0.00 -0.23 -0.39 -0.49 -0.02 -0.01
2004 0.05 -0.90 0.07 -4.00 -4.60 1.10 -0.01 -0.03 -0.08 -0.28 -0.39 -0.87 -0.06 -0.08
2005 0.24 -1.24 0.05 -3.96 -4.20 0.81 0.41 -0.05 -0.07 -0.20 -0.47 -0.85 -0.09 -0.10
2006 0.43 -1.41 0.12 -4.37 -4.12 -0.41 -0.48 -0.05 -0.05 -0.06 -0.45 -0.84 -0.07 -0.09
2007 0.44 -1.10 0.02 -4.47 -4.16 -0.73 -0.26 -0.06 -0.09 -0.30 -0.46 -0.70 -0.07 -0.12
2008 0.23 -2.34 0.10 -4.65 -4.12 -1.89 -1.00 -0.15 -0.02 0.01 -0.79 -1.02 -0.07 -0.07
2009 0.21 -2.95 0.15 -4.91 -4.32 -3.04 -1.55 -0.26 -0.02 -0.12 -1.13 -1.17 -0.13 -0.07
2010 0.18 -3.11 0.17 -4.50 -3.40 -3.27 -1.11 -0.20 -0.05 -0.37 -0.61 -0.21 0.01 -0.02
2011 0.16 -3.79 0.15 -4.76 -4.50 -4.59 -1.74 0.12 0.27 -0.06 -0.68 -0.27 0.03 0.05
2012 0.24 -1.79 0.19 -3.84 -2.61 -3.64 -0.95 0.29 0.33 0.50 -0.09 -0.05 0.02 0.08
2013 0.24 -2.13 0.23 -3.63 -3.09 -4.19 -1.40 0.59 0.64 0.88 -0.20 -0.21 0.97 0.26
2014 0.20 -0.47 0.23 -3.41 -3.62 -4.75 -1.68 0.10 0.20 0.02 0.20 -0.43 -4.63 -0.05

148 148
8.2 Planned improvements
Specific improvements are specified in the QA/QC plan (ISPRA, 2017[b]); they can be summarized as
follows.
For the energy and industrial processes sectors, a major progress regards the harmonisation of
information collected in the framework of different obligations, Large Combustion Plant, E-PRTR and
Emissions Trading, thus highlighting the main discrepancies in data and detecting potential errors, and for
POPs emissions the use of the results of a national research in the potential update of emission factors and
methodologies. For the agriculture and waste sectors, improvements will be related to the availability of new
information on emission factors, activity data as well as parameters necessary to carry out the estimates;
specifically, a study on the best available technologies used in agriculture practices and availability of
information on the landfill gas combustion in landfills flaring and emissions from the exceeding biogas
flared at wastewater treatment plants are under investigation.
The EMEP/EEA Guidebook 2016 chapters (EMEP/EEA, 2016) has started to be considered, for PM2.5
and BC, and update emission factors will be applied in the next year submission of the inventory with a
focus to PAH, dioxin and heavy metals estimates in order to improve the accuracy and reduce the
uncertainty.
The comparison between local inventories and national inventory and the meetings and exchange of
information with local environmental agencies will continue.
Further analyses will concern the collection of statistical data and information to estimate uncertainty in
specific sectors.

149 149
9 PROJECTIONS
9.1 The national framework
The emission scenarios have become increasingly important in the definition of international, European and
national policies on atmospheric pollution.
At national level, the Legislative Decree n. 155 of 2010, art. 22 paragraph 4 provides that ISPRA has to
develop the energy scenario and the scenario of national production activities (Caputo et al., 2015) and,
based on these scenarios, ENEA has to calculate the emission projections using the methodology developed
for these purposes at the European level.
In this framework, ENEA and ISPRA have jointly developed the new national baseline emission scenario
using the GAINS-Italy model (Ciucci et al., 2016; D’Elia et al., 2009). GAINS-Italy is part of the MINNI
model (National Integrated Model to support the International Negotiation on atmospheric pollution, Mircea
et al., 2014; www.minni.org), an ENEA project, funded by MATTM (the Italian Ministry for the
Environment, the Territory and the Sea), that reflects on a national scale the structure of the GAINS-Europe
model (Amann et al., 2011), developed by the International Institute for Applied Systems Analysis (IIASA),
but customizes the Italian case by adopting the division of the territory into regions and using a spatial
resolution of 20 km.
Figure 9.1 – The scheme of data used and produced by the GAINS-Italy model
The development of an emission scenario with the GAINS-Italy model requires the definition of
anthropogenic activity levels, both energy and non-energy, and of a control strategy with a 5-year interval for
the period 1990-2050 (Figure 9.1). Starting from these information, GAINS-Italy produces alternative future
emission and air quality scenarios and abatement costs at a 5-year interval starting from 1990 to 2050.
For the preparation of national emission scenarios an acceptable harmonization, at a given base year,
between the national emission inventory and the GAINS-Italy emissions (D’Elia and Peschi, 2013) has been
carried out. More details about the procedure to build an emission scenario could be found in D’Elia and
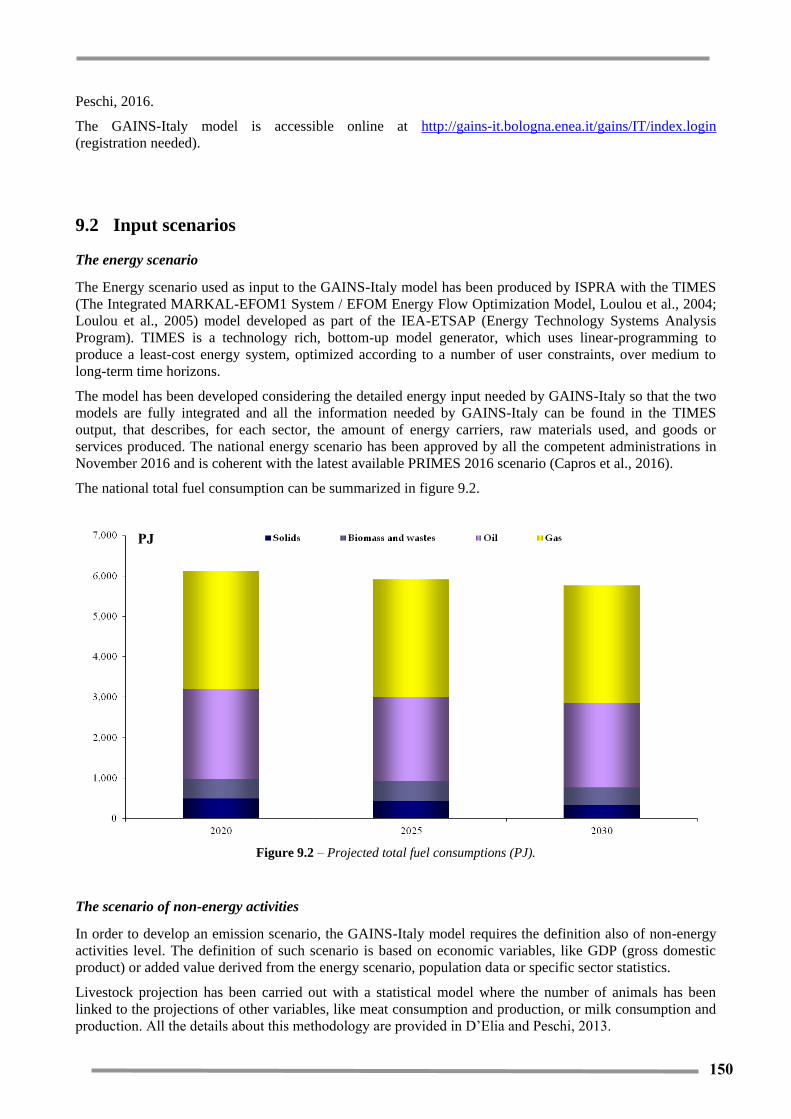
150 150
Peschi, 2016.
The GAINS-Italy model is accessible online at http://gains-it.bologna.enea.it/gains/IT/index.login
(registration needed).
9.2 Input scenarios
The energy scenario
The Energy scenario used as input to the GAINS-Italy model has been produced by ISPRA with the TIMES
(The Integrated MARKAL-EFOM1 System / EFOM Energy Flow Optimization Model, Loulou et al., 2004;
Loulou et al., 2005) model developed as part of the IEA-ETSAP (Energy Technology Systems Analysis
Program). TIMES is a technology rich, bottom-up model generator, which uses linear-programming to
produce a least-cost energy system, optimized according to a number of user constraints, over medium to
long-term time horizons.
The model has been developed considering the detailed energy input needed by GAINS-Italy so that the two
models are fully integrated and all the information needed by GAINS-Italy can be found in the TIMES
output, that describes, for each sector, the amount of energy carriers, raw materials used, and goods or
services produced. The national energy scenario has been approved by all the competent administrations in
November 2016 and is coherent with the latest available PRIMES 2016 scenario (Capros et al., 2016).
The national total fuel consumption can be summarized in figure 9.2.
Figure 9.2 – Projected total fuel consumptions (PJ).
The scenario of non-energy activities
In order to develop an emission scenario, the GAINS-Italy model requires the definition also of non-energy
activities level. The definition of such scenario is based on economic variables, like GDP (gross domestic
product) or added value derived from the energy scenario, population data or specific sector statistics.
Livestock projection has been carried out with a statistical model where the number of animals has been
linked to the projections of other variables, like meat consumption and production, or milk consumption and
production. All the details about this methodology are provided in D’Elia and Peschi, 2013.
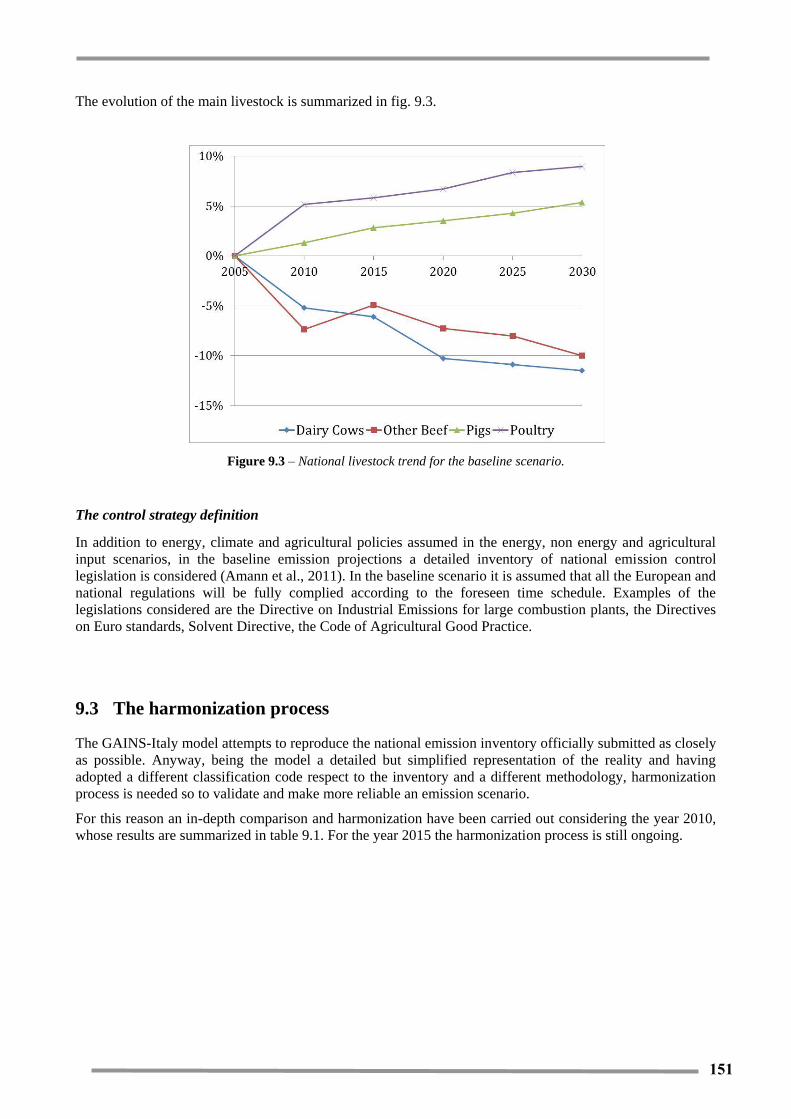
151 151
The evolution of the main livestock is summarized in fig. 9.3.
Figure 9.3 – National livestock trend for the baseline scenario.
The control strategy definition
In addition to energy, climate and agricultural policies assumed in the energy, non energy and agricultural
input scenarios, in the baseline emission projections a detailed inventory of national emission control
legislation is considered (Amann et al., 2011). In the baseline scenario it is assumed that all the European and
national regulations will be fully complied according to the foreseen time schedule. Examples of the
legislations considered are the Directive on Industrial Emissions for large combustion plants, the Directives
on Euro standards, Solvent Directive, the Code of Agricultural Good Practice.
9.3 The harmonization process
The GAINS-Italy model attempts to reproduce the national emission inventory officially submitted as closely
as possible. Anyway, being the model a detailed but simplified representation of the reality and having
adopted a different classification code respect to the inventory and a different methodology, harmonization
process is needed so to validate and make more reliable an emission scenario.
For this reason an in-depth comparison and harmonization have been carried out considering the year 2010,
whose results are summarized in table 9.1. For the year 2015 the harmonization process is still ongoing.
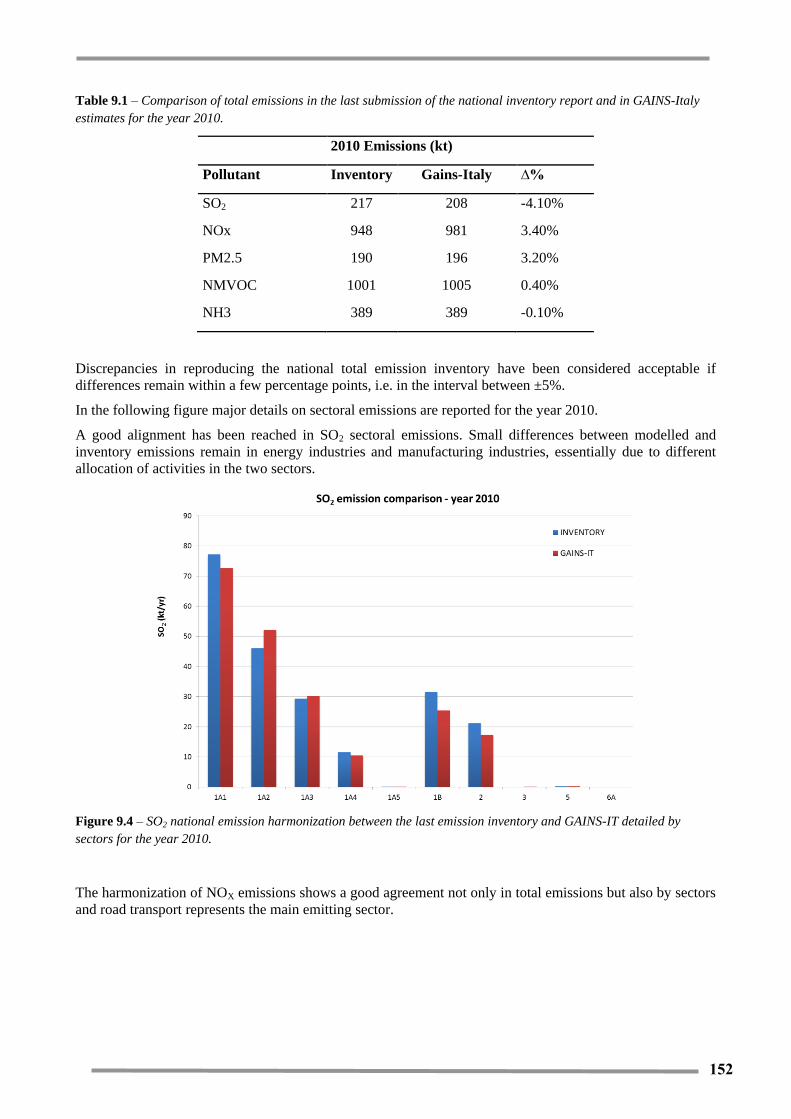
152 152
Table 9.1 – Comparison of total emissions in the last submission of the national inventory report and in GAINS-Italy
estimates for the year 2010.
2010 Emissions (kt)
Pollutant Inventory Gains-Italy ∆%
SO2 217 208 -4.10%
NOx 948 981 3.40%
PM2.5 190 196 3.20%
NMVOC 1001 1005 0.40%
NH3 389 389 -0.10%
Discrepancies in reproducing the national total emission inventory have been considered acceptable if
differences remain within a few percentage points, i.e. in the interval between ±5%.
In the following figure major details on sectoral emissions are reported for the year 2010.
A good alignment has been reached in SO2 sectoral emissions. Small differences between modelled and
inventory emissions remain in energy industries and manufacturing industries, essentially due to different
allocation of activities in the two sectors.
Figure 9.4 – SO2 national emission harmonization between the last emission inventory and GAINS-IT detailed by
sectors for the year 2010.
The harmonization of NOX emissions shows a good agreement not only in total emissions but also by sectors
and road transport represents the main emitting sector.

153 153
Figure 9.5 – NOx national emission harmonization between the last emission inventory and GAINS-IT detailed by
sectors for the year 2010.
PM2.5 emissions from GAINS-Italy are very close to those reported in the national emission inventory
where the civil sector (1A4) represents more than 60% of the total national PM2.5 emissions. The emissions
from barbecue and fireworks estimated by the model have been reported in sector 6A.
Figure 9.6 – PM2.5 national emission harmonization between the last emission inventory and GAINS-IT detailed by
sectors for the year 2010.
Also for NMVOC it is possible to observe a good sectoral agreement between emission modelled and
estimated in the inventory. The use of solvent (in domestic and industrial sector) remains the main emitting
sector.

154 154
Figure 9.7 – NMVOC national emission harmonization between the last emission inventory and GAINS-IT detailed by
sectors for the year 2010.
A good agreement also at a sectoral level is observed for NH3 emissions where the agriculture sector
represents the main source with more than 95% of total NH3 emissions.
Figure 9.8 – NH3 national emission harmonization between the last emission inventory and GAINS-IT detailed by
sectors for the year 2010.
9.4 The emission scenario
The result of the input scenarios and of the harmonization process is an emission scenario.
In Figures 9.9-9.13 the projections for the years 2020, 2025 and 2030 are presented.

155 155
A huge decrease in SO2 emissions from the energy and the maritime sector is projected for the year 2020 and
2030 while the industrial sector represents the main emitter (fig. 9.9).
Figure 9.9 – Projected emissions of SO2 for the year 2020, 2025 and 2030.
The road transport sector still represents the principle NOX source (fig. 9.10) even though a huge decrease is
estimated due to the diffusion of Euro 6 vehicles.
Figure 9.10 – Projected emissions of NOX for the year 2020, 2025 and 2030.

156 156
Figure 9.11 – Projected emissions of PM2.5 for the year 2020, 2025 and 2030.
The civil sector continues to represent the main emitting sector for PM2.5 emissions whose contribution
remains around 60% both for 2020 and 2030 (fig. 9.11). The main emitting sector for NMVOC is still
represented by domestic and industrial solvent use (fig. 9.12) whose emissions are not projected to decrease.
NH3 scenario does not present a significant variation in emissions where the contribution of the agricultural
sector to total NH3 emissions is around 95% (fig. 9.13). Cattle continue to be the most emitting sector
followed by the use of urea and pigs.
Figure 9.12 – Projected emissions of NMVOC for the year 2020, 2025 and 2030.

157 157
Figure 9.13 – Projected emissions of NH3 for the year 2020, 2025 and 2030.
In table 9.2 the national emission reductions in the year 2020 and 2030 respect to the base year 2005 and the
comparison with the new National Emission Ceilings Directive (NECD) targets (EC, 2016) are reported.
Table 9.2 – National emission reductions in the year 2020 and 2030 respect to the base year 2005 and comparison with
the new National Emission Ceilings Directive (NECD) targets.
Emission reductions from 2005
2020 2030
NECD target National emission
scenario
NECD target National emission
scenario
SO2 -35% -61% -71% -73%
NOx -40% -48% -65% -66%
PM2.5 -10% -17% -40% -33%
NMVOC -35% -35% -46% -43%
NH3 -5% -7% -16% -11%
According to the present emission projections, all the targets should be met in 2020 even though attention
should be paid to the NMVOC emission reduction, while for the 2030 targets additional measures should be
adopted to respect the PM2.5, NMVOC and NH3 targets.
158 158
10 REFERENCES
10.1 Introduction
EMEP/CORINAIR, 2007. Atmospheric Emission Inventory Guidebook. Technical report No 16/2007.
EMEP/EEA, 2009. Air Pollutant Emission Inventory Guidebook. EEA. Technical report No 9/2009.
EMEP/EEA, 2013. Air Pollutant Emission Inventory Guidebook. EEA. Technical report No 12/2013.
EMEP/EEA, 2016. Air Pollutant Emission Inventory Guidebook. EEA. Technical report No 21/2016.
IPCC, 1997. Revised 1996 IPCC Guidelines for National Greenhouse Gas Emission Inventories. Three
volumes: Reference Manual, Reporting Manual, Reporting Guidelines and Workbook. IPCC/OECD/IEA.
IPCC WG1 Technical Support Unit, Hadley Centre, Meteorological Centre, Meteorological Office,
Bracknell, UK.
IPCC, 2000. Good Practice Guidance and Uncertainty Management in National Greenhouse Gas Inventories.
IPCC National Greenhouse Gas Inventories Programme, Technical Support Unit, Hayama, Kanagawa,
Japan.
IPCC, 2006. 2006 IPCC Guidelines for National Greenhouse Gas Inventories, Prepared by the National
Greenhouse Gas Inventories Programme, Eggleston H.S., Buendia L., Miwa K., Ngara T. and Tanabe K.
(eds). Published: IGES, Japan.
ISPRA, 2009. La disaggregazione a livello provinciale dell’inventario nazionale delle emissioni. Anni 1990-
1995-2000-2005. ISPRA, 92/2009. URL: http://www.apat.gov.it/site/it-
IT/APAT/Pubblicazioni/Rapporti/Documento/rapporti_92_2009.html.
ISPRA, 2014. Quality Assurance/Quality Control plan for the Italian Emission Inventory. Procedures
Manual. Report 112/2014. http://www.sinanet.isprambiente.it/it/sinanet/serie_storiche_emissioni.
ISPRA, 2016. National Greenhouse Gas Inventory System in Italy. March 2016,
http://www.sinanet.isprambiente.it/it/sinanet/serie_storiche_emissioni.
ISPRA, 2017[a]. Italian Greenhouse Gas Inventory 1990-2015. National Inventory Report 2017. March
2017, http://www.sinanet.isprambiente.it/it/sinanet/serie_storiche_emissioni.
ISPRA, 2017[b]. Quality Assurance/Quality Control plan for the Italian Emission Inventory. Year 2017.
March 2017, http://www.sinanet.isprambiente.it/it/sinanet/serie_storiche_emissioni.
Romano D., Bernetti A., De Lauretis R., 2004. Different methodologies to quantify uncertainties of air
emissions. Environment International vol 30 pp 1099-1107.
UNECE, 2008. Guidelines for Reporting Emission Data under the Convention on Long-range
Transboundary Air Pollution, Emission Reporting Guidelines. ECE/EB.AIR/2008/4 23 September 2008.
UNECE, 2010. Report for the Stage 3 in-depth review of emission inventories submitted under the UNECE
LRTAP Convention and EU National Emissions Ceilings Directive for Italy. CEIP/S3.RR/2010/ITALY
(25/11/2010).
UNECE, 2013. Report for the Stage 3 in-depth review of emission inventories submitted under the UNECE
LRTAP Convention and EU National Emissions Ceilings Directive for Italy. CEIP/S3.RR/2013/ITALY
(20/08/2013)
UNECE, 2014. Guidelines for Reporting Emissions and Projections Data under the Convention on Long
Range Transboundary Air Pollution, ECE/EB.AIR/125 13 March 2014.
10.2 Analysis of key trends by pollutant
EC, 1975. Council Directive 75/716/EEC of 24 November 1975 on the approximation of the laws of the
Member States relating to the sulphur content of certain liquid fuels.

159 159
EC, 1988. Council Directive 88/609/EEC of 24 November 1988 on the limitation of emissions of certain
pollutants into the air from large combustion plants.
EC, 1991. Council Directive 91/441/EEC of 26 June 1991 amending Directive 70/220/EEC on the
approximation of the laws of the Member States relating to measures to be taken against air pollution by
emissions from motor vehicles.
EC, 1994. Directive 94/12/EC of the European Parliament and the Council of 23 March 1994 relating to
measures to be taken against air pollution by emissions from motor vehicles and amending Directive
70/220/EEC.
EC, 1996. Council directive 96/61/EC of 24 September 1996 concerning integrated pollution prevention and
control. Official Journal L 257 , 10/10/1996 P. 0026 – 0040.
EC, 1997 [a]. Directive 97/68/EC of the European Parliament and of the Council of 16 December 1997 on
the approximation of the laws of the Member States relating to measures against the emission of gaseous and
particulate pollutants from internal combustion engines to be installed in non-road mobile machinery.
EC, 1997 [b]. Directive 97/24/EC of the European Parliament and of the Council of 17 June 1997 on certain
components and characteristics of two or three-wheel motor vehicles.
EC, 1998. Directive 98/69/EC of the European Parliament and of the Council of 13 October 1998 relating to
measures to be taken against air pollution by emissions from motor vehicles and amending Council Directive
70/220/EEC.
EC, 1999. Council Directive 1999/13/EC of 11 March 1999 on the limitation of emissions of volatile organic
compounds due to the use of organic solvents in certain activities and installations.
EC, 2001. National Emission Ceilings Directive: Directive 2001/81/EC.
EC, 2004. Council Directive 2004/26/EC of 21 April 2004 amending Directive 97/68/EC on the
approximation of the laws of the Member States relating to measures against the emission of gaseous and
particulate pollutants from internal combustion engines to be installed in non-road mobile machinery.
Decree of President of the Republic 24 May 1988, n. 203. Attuazione delle direttive CEE numeri 80/779,
82/884, 84/360 e 85/203 concernenti norme in materia di qualità dell'aria, relativamente a specifici agenti
inquinanti, e di inquinamento prodotto dagli impianti industriali, ai sensi dell'art. 15 della L. 16 aprile 1987,
n. 183 (2) (2/a). Gazzetta Ufficiale del 16 giugno 1988, n. 140, S.O.
ISTAT, 2014. I consumi energetici delle famiglie, anno 2013. http://www.istat.it/it/archivio/142173
Ministerial Decree 8 May 1989. Limitazione delle emissioni in atmosfera di taluni inquinanti originati dai
grandi impianti di combustione. Gazzetta Ufficiale Italiana n. 124 del 30/05/1989.
Ministerial Decree 12 July 1990. Linee Guida per il contenimento delle emissioni inquinanti degli impianti
industriali e la fissazione dei valori minimi di emissione. G.U. 30 luglio 1990, n. 176.
Ministerial Decree 16 May 1996, n. 392. Regolamento recante norme tecniche relative alla eliminazione
degli olii usati. G. U. n. 173 del 25/07/1996.
Ministerial Decree 21 January 2000, n. 107. Regolamento recante norme tecniche per l'adeguamento degli
impianti di deposito di benzina ai fini del controllo delle emissioni dei vapori. G. U. 02/05/2000 n. 100.
MSE, several years [a]. Bilancio Energetico Nazionale (BEN). Ministero delle Attività Produttive, Direzione
Generale delle Fonti di Energia ed industrie di base. http://dgerm.sviluppoeconomico.gov.it/dgerm/ben.asp .
10.3 Energy (NRF sector 1)
ACI, several years. Annuario statistico. Automobile Club d’Italia, Roma. http://www.aci.it/index.php?id=54.
AISCAT, several years. Aiscat in cifre. Data and reports available on website at:
http://www.aiscat.it/pubb_cifre.htm?ck=1&sub=3&idl=4&nome=pubblicazioni&nome_sub=aiscat%20in%2
0cifre.

160 160
ANCMA, several years. Data available on website at: http://www.ancma.it/statistiche-/-statistics.
ANPA, 2001. Redazione di inventari nazionali delle emissioni in atmosfera nei settori del trasporto aereo e
marittimo e delle emissioni biogeniche. Rapporto finale. Gennaio 2001
ARPA, 2007 – Stima dei consumi di legna da ardere ed uso domestico in Italia. Ricerca commissionata da
APAT e ARPA Lombardia, Rapporto finale, marzo 2007.
ASSOTERMICA, several years. Studio Statistico, http://www.anima.it/contenuti/10670/studi-di-mercato.
CESI, 2005. Caratterizzazione delle emissioni di caldaie residenziali, CESI, 2005.
CONFETRA, several years. Il trasporto merci su strada in Italia. Data and reports available on website at:
http://www.confetra.it/it/centrostudi/statistiche.htm.
Decree of President of the Republic 24 May 1988, n. 203. Attuazione delle direttive CEE numeri 80/779,
82/884, 84/360 e 85/203 concernenti norme in materia di qualità dell'aria, relativamente a specifici agenti
inquinanti, e di inquinamento prodotto dagli impianti industriali, ai sensi dell'art. 15 della L. 16 aprile 1987,
n. 183 (2) (2/a). Gazzetta Ufficiale del 16 giugno 1988, n. 140, S.O.
EC, 2004. Council Directive 2004/26/EC of 21 April 2004 amending Directive 97/68/EC on the
approximation of the laws of the Member States relating to measures against the emission of gaseous and
particulate pollutants from internal combustion engines to be installed in non-road mobile machinery.
EEA, several years, Monitoring CO2 emissions from passenger cars and vans, EEA technical reports.
EMEP/CORINAIR, 2007. Atmospheric Emission Inventory Guidebook. Technical report No 16/2007.
EMEP/EEA, 2013. Air Pollutant Emission Inventory Guidebook. EEA. Technical report No 12/2013.
EMEP/EEA, 2016. Air Pollutant Emission Inventory Guidebook. EEA. Technical report No 21/2016.
EMISIA SA, 2016. COPERT 4 v 11.4, Computer programme to calculate emissions from road transport,
September 2016. http://www.emisia.com/copert/.
ENAC/MIT, several years. Annuario Statistico. Ente Nazionale per l’Aviazione Civile, Ministero delle
Infrastrutture e dei Trasporti.
ENEA, several years. Rapporto Energia Ambiente. Ente per le Nuove tecnologie, l’Energia e l’Ambiente, Roma.
ENEA-federAmbiente, 2012. Rapporto sul recupero energetico da rifiuti urbani in Italia. 3° ed.
EUROCONTROL, 2016. EUROCONTROL Fuel and Emissions Inventory. Personal Communication to
EU Member States. November 2016.
Fuel Experimental Station (Innovhub), several years, Report on the physico-chemical characterization of
fossil fuels used in Italy.
Gerardi V., Perrella G., 2001 - I consumi energetici di biomasse nel settore residenziale in Italia nel 1999.
ENEA, Ente Nazionale per l’Energia e l’Ambiente, 2001, ENEA RT/ERG/2001/07.
Giordano R., 2007. Trasporto merci: criticità attuali e potenziali sviluppi nel contesto europeo. National road
transporters central committee.
IPCC, 1997. Revised 1996 IPCC Guidelines for National Greenhouse Gas Emission Inventories. Three
volumes: Reference Manual, Reporting Manual, Reporting Guidelines and Workbook. IPCC/OECD/IEA.
IPCC WG1 Technical Support Unit, Hadley Centre, Meteorological Centre, Meteorological Office,
Bracknell, UK.
IPCC, 2000. Good Practice Guidance and Uncertainty Management in National Greenhouse Gas Inventories.
IPCC National Greenhouse Gas Inventories Programme, Technical Support Unit, Hayama, Kanagawa,
Japan.
IPCC, 2006. 2006 IPCC Guidelines for National Greenhouse Gas Inventories, Prepared by the National
Greenhouse Gas Inventories Programme, Eggleston H.S., Buendia L., Miwa K., Ngara T. and Tanabe K.
(eds). Published: IGES, Japan.
ISPRA, 2009. La disaggregazione a livello provinciale dell’inventario nazionale delle emissioni. Anni 1990-

161 161
1995-2000-2005. ISPRA, 92/2009. URL: http://www.apat.gov.it/site/it-
IT/APAT/Pubblicazioni/Rapporti/Documento/rapporti_92_2009.html.
ISPRA, 2016. Annuario dei dati ambientali 2016. Report 69/2016.
http://www.isprambiente.gov.it/it/pubblicazioni/stato-dellambiente/annuario-dei-dati-ambientali-edizione-
2016 .
ISPRA, 2017[a]. Italian Greenhouse Gas Inventory 1990-2015. National Inventory Report 2017. March
2017, http://www.sinanet.isprambiente.it/it/sinanet/serie_storiche_emissioni.
ISPRA, 2017[b]. Quality Assurance/Quality Control plan for the Italian Emission Inventory. Year 2017.
March 2017, http://www.sinanet.isprambiente.it/it/sinanet/serie_storiche_emissioni.
ISPRA, several years. Fuel Quality Monitoring Annual Report.
ISTAT, 2009. Personal communication.
ISTAT, 2014. I consumi energetici delle famiglie, 2013. Nota metodologica. Istituto Nazionale di Statistica
www.istat.it .
ISTAT, several years [a]. Annuario Statistico Italiano. Istituto Nazionale di Statistica
ISTAT, several years [b]. Trasporto merci su strada. Istituto Nazionale di Statistica.
http://www3.istat.it/dati/dataset/20110729_00/.
Katsis P., Mellios G., Ntziachristos L., 2012. Description of new elements in COPERT 4 v 10.0, December
2012.
Kouridis C., Gkatzoflias D., Kioutsioukis I., Ntziachristos L., Pastorello C., Dilara P., 2010. Uncertainty
Estimates and Guidance for Road Transport Emission Calculations, European Commission, Joint Research
Centre, Institute for Environment and Sustainability, 2010,
http://www.emisia.com/docs/COPERT%20uncertainty.pdf.
Ministerial Decree 12 July 1990. Linee Guida per il contenimento delle emissioni inquinanti degli impianti
industriali e la fissazione dei valori minimi di emissione. G.U. 30 luglio 1990, n. 176.
MIT, several years. Conto Nazionale delle Infrastrutture e dei Trasporti (CNT). Ministero delle Infrastrutture
e dei Trasporti. http://www.mit.gov.it/mit/site.php?o=vc&lm=2&id_cat=148.
MSE, several years [a]. Bilancio Energetico Nazionale (BEN). Ministero delle Attività Produttive, Direzione
Generale delle Fonti di Energia ed industrie di base. http://dgerm.sviluppoeconomico.gov.it/dgerm/ben.asp.
MSE, several years [b]. Bollettino Petrolifero Trimestrale (BPT). Ministero dello sviluppo economico.
http://dgerm.sviluppoeconomico.gov.it/dgerm/bollettino.asp .
Romano D., Gaudioso D., De Lauretis R., 1999. Aircraft Emissions: a comparison of methodologies based
on different data availability. Environmental Monitoring and Assessment. Vol. 56 pp. 51-74.
SCENARI/ISPRA, 2013. Indagine sull’uso e la disponibilità delle biomasse in Italia. 2013.
SSC, 2012. Final report on emissions from biomass combustion for heating. Stazione Sperimentale dei
Combustibili. Prot. ENEA/2009/34883/APU-UGA March 2012.
TECHNE, 2009. Stima delle emissioni in atmosfera nel settore del trasporto aereo e marittimo. Final report.
TECHNE Consulting, March 2009.
TERNA, several years. Dati statistici sugli impianti e la produzione di energia elettrica in Italia, Gestore Rete
Trasmissione Nazionale. www.terna.it.
Trozzi C., Vaccaro R., De Lauretis R., Romano D., 2002 [a]. Air pollutant emissions estimate from global air
traffic in airport and in cruise: methodology and case study. Presented at Transport and Air Pollution 2002.
Trozzi C., Vaccaro R., De Lauretis R., 2002 [b]. Air pollutant emissions estimate from global ship traffic in
port and in cruise: methodology and case study. Presented at Transport and Air Pollution 2002.
UCINA, several years. La nautica in cifre. Analisi annuale del mercato. Unione Nazionale Cantieri Industrie
162 162
Nautiche ed Affini.
UP, several years. Previsioni di domanda energetica e petrolifera in Italia. Unione Petrolifera.
10.4 IPPU - Industrial processes (NRF sector 2)
APAT, 2003. Il ciclo industriale dell’acciaio da forno elettrico. Agenzia per la Protezione dell’Ambiente e
per i servizi tecnici, Rapporti 38/2003.
AITEC, 2015. Relazione annuale 2015. Associazione italiana tecnico economica del cemento.
www.aitecweb.com .
CORINAIR, 1994. Default emission factors handbook. EUR 12586/2, Belgium.
EMEP/CORINAIR, 2006. Atmospheric Emission Inventory Guidebook. Technical report No 11/2006.
EMEP/CORINAIR, 2007. Atmospheric Emission Inventory Guidebook. Technical report No 16/2007.
EMEP/EEA, 2013. Air Pollutant Emission Inventory Guidebook. Technical report n. 12/2013.
ENEA-AIB-MATT, 2002. "Valutazione delle emissioni di inquinanti organici persistenti da parte
dell’industria metallurgica secondaria".
EUROCHLOR, 1998. Mercury process for making chlorine.
EUROCHLOR, 2001. Reduction of Mercury Emissions from the West European Chlor-Alkali Industry, June
2001 available on the web http://www.chem.unep.ch/mercury/2001-ngo-sub/eurochlor/sub1ngoatt8.pdf.
FEDERACCIAI, several years. La siderurgia in cifre. Federazione Imprese Siderurgiche Italiane.
ILVA, 1997. Personal communication.
IPCC, 1997. Revised 1996 IPCC Guidelines for National Greenhouse Gas Emission Inventories. Three
volumes: Reference Manual, Reporting Manual, Reporting Guidelines and Workbook.
IPCC, 2000. Good Practice Guidance and Uncertainty Management in National Greenhouse Gas Inventories.
IPCC National Greenhouse Gas Inventories Programme, Technical Support Unit, Hayama, Kanagawa,
Japan.
IPCC, 2006. 2006 IPCC Guidelines for National Greenhouse Gas Inventories, Prepared by the National
Greenhouse Gas Inventories Programme, Eggleston H.S., Buendia L., Miwa K., Ngara T. and Tanabe K.
(eds). Published: IGES, Japan.
IPPC, 2001. Best Available Techniques Reference Document on the Production of Iron and Steel. Integrated
Pollution Prevention and Control. European Commission. December 2001.
ISPRA, 2009. La disaggregazione a livello provinciale dell’inventario nazionale delle emissioni. Anni 1990-
1995-2000-2005. ISPRA, 92/2009. http://www.isprambiente.gov.it/it/pubblicazioni/rapporti/la-
disaggregazione-a-livello-provinciale .
ISTAT, several years. Annuario Statistico Italiano. Istituto Nazionale di Statistica.
Legambiente, 2007. Lo stato dell’arte sulle riconversioni degli impianti cloro soda in Italia, Ottobre 2007
available on the web:
http://risorse.legambiente.it/docs/Lo_stato_dell_arte_sulle_riconversioni_degli_impianti_cloro-
soda_in_Italia_ott_2007.0000001526.pdf
MATTM, 2011. Autorizzazione integrata ambientale per l’esercizio dello stabilimento siderurgico della
società ILVA s.p.a. ubicato nel comune di Taranto. IPPC permit.
MSE, several years.Statistiche produzione cementi. http://www.sviluppoeconomico.gov.it/index.php/it/per-i-
media/statistiche/2009708-statistiche-produzione-cementi.
TNO, 1992. Emission factors manual PARCOM – ATMOS. Emission factors for air pollutants 1992.

163 163
10.5 IPPU - Solvent and other product use (NRF sector 2)
ACI, several years. Annuario statistico. Automobile Club d’Italia, Roma. http://www.aci.it/index.php?id=54.
AIA, several years a. Personal Communication. Associazione Italiana Aerosol.
AIA, several years b. Relazioni annuali sulla produzione italiana aerosol. Associazione Italiana Aerosol.
Assocasa, several years. Personal Communication.
AVISA, several years. Personal Communication.
CEPE, 1999. European guidelines for car repairing.
EC, 1999. Council Directive 1999/13/EC of 11 March 1999 on the limitation of emissions of volatile organic
compounds due to the use of organic solvents in certain activities and installations.
EC, 2002. Screening study to identify reduction in VOC emissions due to the restrictions in the VOC content
of products. Final Report of the European Commission, February 2002.
EC, 2004. Directive 2004/42/ce of the european parliament and of the council of 21 April 2004 on the
limitation of emissions of volatile organic compounds due to the use of organic solvents in certain paints and
varnishes and vehicle refinishing products and amending Directive 1999/13/EC.
EMEP/CORINAIR, 2007. Atmospheric Emission Inventory Guidebook. Technical report No 16/2007.
EMEP/EEA, 2016. Air Pollutant Emission Inventory Guidebook. EEA. Technical report No 21/2016.
ENEA/USLRMA, 1995. Lavanderie a secco.
FAO, several years. Food balance. http://faostat.fao.org .
FIAT, several years. Rendiconto Ambientale. Gruppo Fiat.
GIADA, 2006. Progetto Giada and Personal Communication. ARPA Veneto – Provincia di Vicenza.
ISPRA, 2009. La disaggregazione a livello provinciale dell’inventario nazionale delle emissioni. Anni 1990-
1995-2000-2005. ISPRA, 92/2009. URL: http://www.apat.gov.it/site/it-
IT/APAT/Pubblicazioni/Rapporti/Documento/rapporti_92_2009.html
ISTAT, several years a. Annuario Statistico Italiano.
ISTAT, several years b. Bollettino mensile di statistica.
ISTAT, several years c. Statistica annuale della produzione industriale. http://www.istat.it/it/archivio/73150
MICA, 1999. L’industria Italiana delle vernici. Ministero dell’Industria del Commercio e dell’Artigianato.
Dicembre 1999.
Offredi P., several years. Professione Verniciatore del Legno. Personal communication.
Regione Campania, 2005. Inventario regionale delle emissioni di inquinanti dell’aria della Regione
Campania, marzo 2005.
Regione Toscana, 2001. Inventario regionale delle sorgenti di emissione in aria ambiente, febbraio 2001.
Techne, 1998. Personal communication.
Techne, 2004. Progetto MeditAiraneo. Rassegna dei fattori di emissione nazionali ed internazionali
relativamente al settore solventi. Rapporto Finale, novembre 2004.
Techne, 2008. Fattori di emissione per l’utilizzo di solventi. Rapporto Finale, marzo 2008.
UNIPRO, several years. Rapporto Annuale - Consumi cosmetici in Italia.
Vetrella G., 1994. Strategie ottimali per la riduzione delle emissioni di composti organici volatili. Thesis in
Statistics.

164 164
10.6 Agriculture (NRF sector 3)
APAT, 2005. Methodologies used in Italy for the estimation of air emission in the agriculture sector.
Technical report 64/2005. Rome - Italy. URL: http://www.isprambiente.gov.it/it/pubblicazioni/rapporti
Bassanino M., Sacco D., Zavattaro L., Grignania C., 2011. Nutrient balance as a sustainability indicator of
different agro-environments in Italy. Ecol Indic 11(2): 715-723
Bechini L., Castoldi N., 2009. On-farm monitoring of economic and environmental performances of
cropping systems: Results of a 2-year study at the field scale in northern Italy. Ecol Indic 9: 1096–1113
Berdowski J.J.M., Baas J, Bloos JP.J., Visschedijk A.J.H., Zandveld P.Y.J., 1997. The European
Atmospheric Emission Inventory for Heavy Metals and Persistent Organic Pollutants.
Umweltforschungsplan des Bundesministers fur Umwelt, Naturschutz und Reaktorsicherheit
Luftreinhaltung. Forschungbericht 104 02 672/03. TNO, Apeldoorn, The Netherlands
Cóndor R.D., De Lauretis R., 2007. Agriculture emission inventory in Italy: synergies among conventions
and directives. In: Ammonia emissions in Agriculture. Ed. G.J. Monteny, E. Hartung. Wageningen
Academic Publishers. 404 p. The Netherlands
Cóndor R.D., Di Cristofaro E., De Lauretis R., 2008. Agricoltura: inventario nazionale delle emissioni e
disaggregazione provinciale. Istituto superiore per la protezione e la ricerca ambientale, ISPRA Rapporto
tecnico 85/2008. Roma, Italia. URL: http://www.isprambiente.gov.it/it/pubblicazioni/rapporti
Cóndor R.D., 2011. Agricoltura: emissioni nazionali in atmosfera dal 1990 al 2009. Istituto superiore per la
protezione e la ricerca ambientale (ISPRA). Rapporto ISPRA 140/2011. Roma, Italia. URL:
http://www.isprambiente.gov.it/it/pubblicazioni/rapporti/agricoltura-emissioni-nazionali-in-atmosfera-dal
Cóndor R.D., Valli L., 2011. Emissioni nazionali di ammoniaca e scenari emissivi derivanti dalla fase di
spandimento agronomico e all’uso dei fertilizzanti azotati in Italia. e-book edited by the Centro Ricerche
Produzioni Animali (CRPA). URL: http://www.crpa.it/media/documents/crpa_www/Pubblicazi/E-
book/Ammoniaca2011/EmissioniAmmoniaca.pdf
CRPA, 2006[a]. Progetto MeditAIRaneo: settore Agricoltura. Relazione finale. Technical report on the
framework of the MeditAIRaneo project for the Agriculture sector, Reggio Emilia - Italy
CRPA, 2006[b]. Predisposizione di scenari di emissione finalizzati alla progettazione di interventi per la
riduzione delle emissioni nazionali di ammoniaca ed alla valutazione di misure e di progetti per la tutela
della qualità dell’aria a livello regionale. Final report. Reggio Emilia - Italy
CRPA, 2010[a]. Personal communication - experts Laura Valli and Maria Teresa Pacchioli from the
Research Centre on Animal Production (expert consultation on N excretion and national production
systems). Reggio Emilia, Italy
CRPA, 2010[b]. Valutazione dell’entità delle emissioni ammoniacali derivanti dall’applicazione al suolo dei
fertilizzanti, delle loro possibilità di riduzione e individuazione degli elementi per un monitoraggio statistico
delle tecniche di applicazione utilizzate. Report. Reggio Emilia – Italy
EC, 1986. Council Directive 86/278/EC. Council Directive 86/278/EC of 12 June 1986 on the protection of
the environment, and in particular of the soil, when sewage sludge is used in agriculture. Official Journal of
the European Communities 4 July 1986
EEA, 2016. Analysis of key trends and drivers in greenhouse gas emissions in the EU between 1990 and
2014. Technical paper, June 2016. http://www.eea.europa.eu/publications/analysis-of-key-trends-ghg/
EMEP/CORINAIR, 2006. Atmospheric Emission Inventory Guidebook. Technical report No 11/2006
EMEP/CORINAIR, 2007. Atmospheric Emission Inventory Guidebook. Technical report No 16/2007
EMEP/EEA, 2013. Air Pollutant Emission Inventory Guidebook. Technical report n. 12/2013
EMEP/EEA, 2016. Air Pollutant Emission Inventory Guidebook. Technical report n. 21/2016
ENEA, 2006. Valutazione della possibilità di sostituzione dell'urea con altri fertilizzanti azotati. Final report.
Rome, Italy

165 165
EPA, 1995. AP-42 Compilation of Air Emission Factors, 5th edition January 1995. https://www.epa.gov/air-
emissions-factors-and-quantification/ap-42-compilation-air-emission-factors
Giardini L., 1983. Agronomia Generale, Patron, Bologna
GU, Gazzetta Ufficiale della Repubblica Italiana, 2006. Criteri e norme tecniche generali per la disciplina
regionale dell’utilizzazione agronomica degli effluenti di allevamento e di acque reflue di cui all’articolo 38
del decreto legislativo 11 maggio 1999 N. 152. G.U. n. 109 del 12/05/06 - Suppl. Ordinario n.120. Ministero
delle Politiche Agricole e Forestali. Italy. http://www.gazzettaufficiale.it/
IPCC, 1997. Revised 1996 IPCC Guidelines for National Greenhouse Gas Emission Inventories. Three
volumes: Reference Manual, Reporting Manual, Reporting Guidelines and Workbook
IPCC, 2000. Good Practice Guidance and Uncertainty Management in National Greenhouse Gas Inventories
IPCC National Greenhouse Gas Inventories Programme, Technical Support Unit, Hayama, Kanagawa,
Japan
IPCC, 2006. 2006 IPCC Guidelines for National Greenhouse Gas Inventories, Prepared by the National
Greenhouse Gas Inventories Programme, Eggleston H.S., Buendia L., Miwa K., Ngara T. and Tanabe K.
(eds). Published: IGES, Japan
ISPRA, 2008. Database della disaggregazione a livello provinciale dell'Inventario nazionale delle
emissioni:1990-1995-2000-2005. Istituto Superiore per la Protezione e la Ricerca Ambientale, ISPRA. URL:
http://www.sinanet.isprambiente.it/it/inventaria/disaggregazione_prov2005/
ISPRA, 2009. La disaggregazione a livello provinciale dell’inventario nazionale delle emissioni. Anni 1990-
1995-2000-2005. ISPRA, 92/2009. URL: http://www.isprambiente.gov.it/it/pubblicazioni/rapporti
ISPRA, several years [a]. Italian Greenhouse Gas Inventory - National Inventory Report.
http://www.sinanet.isprambiente.it/it/sinanet/serie_storiche_emissioni
ISPRA, several years [b]. Quality Assurance/Quality Control plan for the Italian Emission Inventory,
http://www.sinanet.isprambiente.it/it/sinanet/serie_storiche_emissioni
ISPRA, several years [c]. Annuario dei dati ambientali. URL:http://annuario.isprambiente.it/
ISPRA, several years [d]. Serie storiche delle emissioni nazionali di inquinanti atmosferici, Rete del Sistema
Informativo Nazionale Ambientale - SINANET. URL:
http://www.sinanet.isprambiente.it/it/sinanet/serie_storiche_emissioni
Jenkins B.M. (1996a). ‘Atmospheric Pollutant Emission Factors from Open Burning of Agricultural and
Forest Biomass by Wind Tunnel Simulations’. Final report (3 Vols.). CARB Project A932-126, California
Air Resources Board, Sacramento, California.
MATTM, several years [b]. Personal communication: E-mail request for sewage sludge applied to
agricultural soils in Italy. Ministero dell'Ambiente e della Tutela del Territorio e del Mare, Roma –Italia
Perelli, M., 2007. Prezzi dei prodotti agricoli e fertilizzazione. Fertilizzanti Maggio 2007. Anno IX N3. 10-
13pp
Regione Emilia Romagna, 2004 L. R. 28/98 – P.S.A. 2001 - N. PROG. 3 TAB. B3 - Bilancio dell'azoto nelle
specie di interesse zootecnico, Relazione finale, a cura di C.R.P.A., September 2004, Reggio Emilia, Italy
Xiccato G., Schiavon S., Gallo L., Bailoni L., Bittante G., 2005. Nitrogen excretion in dairy cow, beef and
veal cattle, pig, and rabbit farms in Northern Italy. Ital. J.Anim.Sci. Vol. 4 (Suppl.), 103-111.
10.7 Waste (NRF sector 5)
AMA-Comune di Roma, 1996. Nuovo impianto per l’incenerimento dei rifiuti ospedalieri. Rapporto AMA.
ANPA, 1998. Il sistema ANPA di contabilità dei rifiuti, prime elaborazioni dei dati. Agenzia Nazionale per
la Protezione dell’Ambiente.
APAT-ONR, several years. Rapporto Rifiuti. Agenzia per la Protezione dell’Ambiente e per i servizi

166 166
Tecnici.
AUSITRA-Assoambiente, 1995. Impianti di trattamento dei rifiuti solidi urbani e assimilabili. Indagine a
cura di Merzagora W., Ferrari S.P.
Borgioli E., 1981. Nutrizione e alimentazione degli animali domestici. Ed Agricole, p. 464.
CESTAAT, 1988. Impieghi dei sottoprodotti agricoli ed agroindustriali, Vol. 1. Centro Studi
sull’Agricoltura, l’Ambiente e il Territorio, edizione fuori commercio, p. 311.
De Stefanis P., 1999. Personal communication.
De Stefanis P., 2012. Personal communication (mail 16 November 2012)
EMEP/CORINAIR, 2007. Atmospheric Emission Inventory Guidebook. Technical report No 16/2007.
EMEP/EEA, 2009. Air Pollutant Emission Inventory Guidebook. Technical report n. 9/2009.
EMEP/EEA, 2013. Air Pollutant Emission Inventory Guidebook. Technical report n. 12/2013.
ENEA-federAmbiente, 2012. Rapporto sul recupero energetico da rifiuti urbani in Italia. 3° ed.
Favoino E., Cortellini L., 2001. Composting and biological treatment in southern European countries: an
overview. Conference Proceedings Soil and Biowaste in Southern Europe. Rome 18-19 January, 2001.
Favoino E., Girò F., 2001. An assessment of effective, optimised schemes for source separation of organic
waste in Mediterranean districts. Conference Proceedings Soil and Biowaste in Southern Europe. Rome 18-
19 January, 2001.
FEDERAMBIENTE, 1998. Impianti di smaltimento: analisi sui termocombustori RSU – prima edizione.
Indagine a cura di Motawi A.
Finn L., Spencer R., 1997. Managing biofilters for consistent odor and VOC treatment. Biocycle, January
1997 Vol. 38 Iss.1.
Gaudioso et al., 1993. Emissioni in atmosfera dalle discariche di rifiuti in Italia. RS, Rifiuti Solidi vol. VII n.
5, Sept.-Oct. 1993.
IPCC, 1997. Revised 1996 IPCC Guidelines for National Greenhouse Gas Emission Inventories. Three
volumes: Reference Manual, Reporting Manual, Reporting Guidelines and Workbook. IPCC/OECD/IEA.
IPCC WG1 Technical Support Unit, Hadley Centre, Meteorological Centre, Meteorological Office,
Bracknell, UK.
IPCC, 2000. Good Practice Guidance and Uncertainty Management in National Greenhouse Gas Inventories.
IPCC National Greenhouse Gas Inventories Programme, Technical Support Unit, Hayama, Kanagawa,
Japan.
ISPRA, 2017[a]. Italian Greenhouse Gas Inventory 1990-2014. National Inventory Report 2016. March
2016, http://www.sinanet.isprambiente.it/it/sinanet/serie_storiche_emissioni .
ISPRA, several years [a]. Rapporto Rifiuti. Istituto Superiore per la Protezione e la Ricerca Ambientale.
http://www.isprambiente.gov.it/it/pubblicazioni/rapporti
ISPRA, several years [b]. Gli indicatori del clima in Italia nel 2015. Anno XI.
http://www.scia.isprambiente.it/Documentazione/RAPPORTOCLIMA2015.pdf
ISTAT, several years [a]. Statistiche dell’agricoltura, zootecnia e mezzi di produzione - Annuari (1990-
1993), Istituto Nazionale di Statistica.
ISTAT, several years [b]. Statistiche dell’agricoltura - Annuari (1994-2000), Istituto Nazionale di Statistica.
ISTAT, 2016[a]. Dati congiunturali sulle coltivazioni 2014. Istituto Nazionale di Statistica.
http://agri.istat.it/jsp/Introduzione.jsp.
ISTAT, 2016[b]. Personal communication with R. Moro: E-mail request for last updated information on
agricultural surface and production, year 2015. Istituto Nazionale di Statistica.
MATTM, several years [a]. RSA - Rapporto sullo stato dell’ambiente 1989, 1992, 1997, 2001. Ministero

167 167
dell’Ambiente e della Tutela del Territorio e del Mare.
Ministerial Decree 19 November 1997, n. 503. Regolamento recante norme per l’attuazione delle Direttive
89/369/CEE e 89/429/CEE concernenti la prevenzione dell’inquinamento atmosferico provocato dagli
impianti di incenerimento dei rifiuti urbani e la disciplina delle emissioni e delle condizioni di combustione
degli impianti di incenerimento di rifiuti urbani, di rifiuti speciali non pericolosi, nonché di taluni rifiuti
sanitari. G.U. 29 gennaio 1998, n. 23.
Ministerial Decree 12 July 1990. Linee Guida per il contenimento delle emissioni inquinanti degli impianti
industriali e la fissazione dei valori minimi di emissione. G.U. 30 luglio 1990, n. 176.
Pastorelli et al., 2001. Sviluppo di fattori di emissione da inceneritori di rifiuti urbani lombardi e loro
applicazione all’inventario nazionale delle diossine. Ingegneria Ambientale, ANNO XXX N.1 January 2001.
SEFIT, several years. Personal Communication with Daniele Fogli: E-mail request for activity data regarding
cremation of corpses in Italy.
Tchobanoglous G. et al., 1993. Tchobanoglous G., Theisen H., Vigil A. Integrated Waste Management,
McGraw-Hill, 1993.
TNO, 1995. Technical paper to the OSPARCOM-HELCOM UNECE. Emission inventory of Heavy
Metals and Persistent Organic Pollutants. TNO-MEP –R 95/247, 1995.
US EPA, 1990. Air Emissions Species Manual, vol. I: Volatile Organic Compound Species Profiles, Second
Edition. EPA-450/2-90-001a (United States Environmental Protection Agency – Office of Air Quality
Planning and Standards, Research Triangle Park, NC 27711), January 1990.
UWWTD, 2011. 6th UWWTD implementation report Technical assessment of information on the
implementation of Council Directive 91/271/EEC of 21 May 1991 concerning Urban Waste Water
Treatment, as amended by Commission Directive 98/15/EC of 27 February 1998 Situation as of 31
December 2007 or 31 December 2008. Final report as of 8 August 2011.
10.8 Recalculations and improvements
EMEP/EEA, 2016. Air Pollutant Emission Inventory Guidebook. EEA. Technical report No 21/2016.
EMISIA SA, 2016. COPERT 4 v 11.4, Computer programme to calculate emissions from road transport,
September 2016. http://www.emisia.com/copert/.
ISPRA, 2017[b]. Quality Assurance/Quality Control plan for the Italian Emission Inventory. Year 2017.
March 2017, http://www.sinanet.isprambiente.it/it/sinanet/serie_storiche_emissioni.
ISTAT, 2014. I consumi energetici delle famiglie, 2013. Nota metodologica. Istituto Nazionale di Statistica.
http://www.istat.it .
10.9 Projections
Amann, M., Bertok, I., Borken-Kleefeld, J., Cofala, J., Heyes, C., Höglund-Isaksson, L., Klimont, Z.,
Nguyen, B., Posch, M., Rafaj, P., Sandler, R., Schöpp, W., Wagner, F., Winiwarter, W., 2011. Cost-effective
control of air quality and greenhouse gases in Europe: Modeling and policy applications. Environmental
Modelling & Software 26, 1489-1501.
Capros P. et al., 2016. EU Reference Scenario 2016 - Energy, transport and GHG emissions - Trends to
2050. European Union, 2016. https://ec.europa.eu/energy/sites/ener/files/documents/ref2016_report_final-
web.pdf
168 168
Caputo A., Colaiezzi M., Contaldi M., Pantaleoni M., Peschi E., 2015. Scenari di consumi elettrici al 2050.
ISPRA Technical Report 213/2015.
Ciucci, A., D’Elia, I., Wagner, F., Sander, R., Ciancarella, L., Zanini, G., Schöpp, W., 2016. Cost-effective
reductions of PM2.5 concentrations and exposure in Italy. Atmospheric Environment, 140, 84-93.
D’Elia, I., Bencardino, M., Ciancarella, L., Contaldi, M., Vialetto, G., 2009. Technical and Non-technical
measures for air pollution emission reduction: The integrated assessment of the Regional Air Quality
Management Plans through the Italian national model. Atmospheric Environment, 43, 6182-6189.
D’Elia, I., Peschi, E., 2013. Lo scenario emissivo nazionale nella negoziazione internazionale. ENEA
Technical Report, RT/2013/10/ENEA (in Italian).
D’Elia, I., Peschi, E., 2016. How National integrated air quality models can be used in defining
environmental policies: the revision of the NEC directive. ENEA Technical Report, RT/2016/30/ENEA
EC, 2016. Directive (EU) 2016/2284 of the European Parliament and of the Council of 14 December 2016
on the reduction of national emissions of certain atmospheric pollutants, amending Directive 2003/35/EC
and repealing Directive 2001/81/EC. Official Journal of the European Union L. 344/1 of 17.12.2016.
Loulou, R., Goldstein, G., Noble, K., 2004. Documentation for the MARKAL Family of Models. ETSAP.
Loulou, R., Remne, U., Kanudia, A., Lehtila, A., Goldstein, G., 2005. Documentation for the TIMES Model
- PART I 1–78.
Mircea M., Ciancarella L., Briganti G., Calori G., Cappelletti A., Cionni I., Costa M., Cremona G., D’Isidoro
M., Finardi, S., Pace G., Piersanti A., Righini G., Silibello C., Vitali L., Zanini G., 2014. Assessment of the
AMS-MINNI system capabilities to simulate air quality over Italy for the calendar year 2005. Atmospheric
Environment 84, 178-188.