5. POTENTIAL FOR HUMAN EXPOSURE 5.1 OVERVIEW
25
157 JP-5, JP-8, AND JET A FUELS 5. PRODUCTION, IMPORT/EXPORT, USE, AND DISPOSAL 5.1 PRODUCTION No information is available in the TRI database on facilities that manufacture or process JP-5, JP-8, and Jet A fuels because these chemicals are not required to be reported under Section 313 of the Emergency Planning and Community Right-to-Know Act (Title III of the Superfund Amendments and Reauthorization Act of 1986) (EPA 2005). As discussed in Chapter 4, most jet fuels are derived from petroleum. During the 1970s and 1980s, shale oil had been used to manufacture jet fuels, but this is no longer economically feasible (Chevron 2006). Figure 4-1 provides a general schematic for the straight-run production of jet fuels from crude oil. Heated crude oil is introduced into an atmospheric pressure distillation unit and the liquefied petroleum gasses (propane and butane) are boiled off from the top of the distillation column and eventually recondensed by a condenser unit. Middle distillates such as kerosene and diesel are drawn off the distillation column and treated by various processes that remove or reduce undesirable components before becoming jet fuels (API 2010b; Chevron 2006). The sweetening process removes corrosive mercaptans from the kerosene fraction by the mercapton oxidation (Merox) process in which mercaptans are converted to disulfides using a catalyst and an alkaline solution. The disulfides are noncorrosive and may be left in the final product or removed by additional treatment to lower the sulfur content of the resultant jet fuel. Hydroprocessing employs hydrogen and an appropriate catalyst to remove olefins, sulfur, and nitrogen- containing compounds from the distilled kerosene. Jet fuel manufactured by a particular refinery may be derived exclusively from straight-run processing or it may be a blend of straight-run, hydroprocessed, and/or hydrocracked product (as depicted in Figure 4-1); however, the finished product must meet all of the performance and regulatory requirements of the specific fuel as discussed in Chapter 4. Concern that diminishing oil supplies could disrupt production of jet fuels from traditional petroleum sources has prompted research into alternative production methods. The Fischer-Tropsch process has been used to develop synthetic jet fuels from feedstocks other than petroleum (Chevron 2006; FAA 2009). In this process, Syngas (synthesis gas), a mixture of carbon monoxide and hydrogen, is reacted with catalysts to produce a variety of hydrocarbons. These hydrocarbons are then blended to produce a highly paraffinic synthetic jet fuel that contains virtually no sulfur, nitrogen, or aromatic compounds. The benefits and disadvantages of producing jet fuels using the Fischer-Tropsch process and other methods compared to traditional manufacturing methods using petroleum feedstock have been reviewed in a
Transcript of 5. POTENTIAL FOR HUMAN EXPOSURE 5.1 OVERVIEW

157 JP-5, JP-8, AND JET A FUELS
5. PRODUCTION, IMPORT/EXPORT, USE, AND DISPOSAL
5.1 PRODUCTION
No information is available in the TRI database on facilities that manufacture or process JP-5, JP-8, and
Jet A fuels because these chemicals are not required to be reported under Section 313 of the Emergency
Planning and Community Right-to-Know Act (Title III of the Superfund Amendments and
Reauthorization Act of 1986) (EPA 2005).
As discussed in Chapter 4, most jet fuels are derived from petroleum. During the 1970s and 1980s, shale
oil had been used to manufacture jet fuels, but this is no longer economically feasible (Chevron 2006).
Figure 4-1 provides a general schematic for the straight-run production of jet fuels from crude oil. Heated
crude oil is introduced into an atmospheric pressure distillation unit and the liquefied petroleum gasses
(propane and butane) are boiled off from the top of the distillation column and eventually recondensed by
a condenser unit. Middle distillates such as kerosene and diesel are drawn off the distillation column and
treated by various processes that remove or reduce undesirable components before becoming jet fuels
(API 2010b; Chevron 2006). The sweetening process removes corrosive mercaptans from the kerosene
fraction by the mercapton oxidation (Merox) process in which mercaptans are converted to disulfides
using a catalyst and an alkaline solution. The disulfides are noncorrosive and may be left in the final
product or removed by additional treatment to lower the sulfur content of the resultant jet fuel.
Hydroprocessing employs hydrogen and an appropriate catalyst to remove olefins, sulfur, and nitrogen-
containing compounds from the distilled kerosene. Jet fuel manufactured by a particular refinery may be
derived exclusively from straight-run processing or it may be a blend of straight-run, hydroprocessed,
and/or hydrocracked product (as depicted in Figure 4-1); however, the finished product must meet all of
the performance and regulatory requirements of the specific fuel as discussed in Chapter 4.
Concern that diminishing oil supplies could disrupt production of jet fuels from traditional petroleum
sources has prompted research into alternative production methods. The Fischer-Tropsch process has
been used to develop synthetic jet fuels from feedstocks other than petroleum (Chevron 2006; FAA
2009). In this process, Syngas (synthesis gas), a mixture of carbon monoxide and hydrogen, is reacted
with catalysts to produce a variety of hydrocarbons. These hydrocarbons are then blended to produce a
highly paraffinic synthetic jet fuel that contains virtually no sulfur, nitrogen, or aromatic compounds. The
benefits and disadvantages of producing jet fuels using the Fischer-Tropsch process and other methods
compared to traditional manufacturing methods using petroleum feedstock have been reviewed in a

158 JP-5, JP-8, AND JET A FUELS
5. PRODUCTION, IMPORT/EXPORT, USE, AND DISPOSAL
technical report produced by the Rand Corporation and the Massachusetts Institute of Technology (MIT)
(FAA 2009).
Domestic production, import, and export data for kerosene is summarized in Tables 5-1 and 5-2. These
data were derived from the EPA Inventory Update Reporting (IUR) system (EPA 2010) and the newly
developed Chemical Data Reporting (CDR) database (EPA 2012a). According to the CDR website
(http://www.epa.gov/oppt/cdr/), approximately 2.07x10¹¹ pounds (93,725,241 tonnes) of kerosene was
manufactured in 2012; however, several companies claimed this information as confidential business
information (CBI) and therefore, the actual production volume is expected to be greater than what is
indicated in Table 5-1 (EPA 2012a).
While the demand for kerosene has gradually declined over the previous 4 decades, demand for jet fuels
has steadily increased. As a result, many refiners have chosen to produce Jet A-1 as their basic product
and to simply divert a portion of the product for marketing as kerosene (IARC 1989). In the United
States, production of jet fuels, including both kerosene-type (JP-5 and JP-8) and wide-cut fuels, increased
from 37,636,000 tonnes (293,560,800 barrels) in 1970 to 56,939,000 tonnes (444,124,200 barrels) in 1985
(IARC 1989). In the countries of the Organisation for Economic Cooperation and Development (OECD),
production increased from 57,659,000 tonnes (449,740,200 barrels) to 90,280,000 tonnes (704,184,000
barrels) during the same time period (IARC 1989). According to the Department of Energy, the
consumption of jet fuels in the United States in 2010 and 2011 was 1.43 and 1.42 million barrels per day,
respectively, for an annual consumption rate of 521,950,000 barrels consumed in 2010 and 518,300,000
barrels consumed in 2011 (EIA 2013c). The consumption rate is projected to increase to 1.52 million
barrels per day (554,800,000 barrels annually) by 2020, 1.60 million barrels per day (584,000,000 barrels
annually) by 2030, and 1.66 million barrels per day (605,900,000 barrels annually) by 2040 (EIA 2013c).
Data regarding the weekly production of jet fuels by U.S. refineries since 2010 are provided in Tables 5-3
(commercial jet fuels) and 5-4 (military jet fuels) from the U.S. Energy Information Administration (EIA
2014a).
5.2 IMPORT/EXPORT
Imports of distillate fuels have varied from year to year since the 1970s. Since 1975, imports of distillate
jet fuels such as jet fuel no. 1 into the United States have been low compared to the amount of distillate jet
fuels produced in the United States (API 1991). Imports of kerosene fluctuated between 1975 and 1984

159 JP-5, JP-8, AND JET A FUELS
5. PRODUCTION, IMPORT/EXPORT, USE, AND DISPOSAL
Table 5-1. Domestic Production, Import, and Export Volumes of Kerosene in 2012a
Domestic manufacturing Imported Volume Parent (pounds) (pounds) Volume used exported Parent company name company city 2,400,000,000 0 0 Sunoco, Inc. Philadelphia 109,000,000,000 109,000,000,000 0 Sunoco, Inc. Philadelphia 2,530,000,000 0 0 ConocoPhillips Co. Linden 3,739,372,000 0 0 Motiva Enterprises LLC Houston 1,055,839,514 1,055,839,514 0 Equilon Enterprises LLC Houston 2,946,370,260 2,946,370,260 0 Shell Deer Park Refining Deer Park
Limited Partnership 6,442,919,000 0 0 Motiva Enterprises LLC Houston
2,945,948,325 N/A 0 Shell Trading US Co. Houston 1,185,666,446 1,185,666,446 0 Shell Chemical Company LP Houston 5,537,432,425 0 0 Motiva Enterprise LLC Houston 389,977,246 389,977,246 0 Hunt Consolidated, Inc. Dallas CBI CBI CBI CBI CBI CBI 1,600,000,000 400,000,000 0 Western Refining El Paso
Southwest, Inc. 490,030,931 N/A 0 Citgo Petroleum Corporation Houston 141,484 N/A 0 Equilon Enterprises LLC Houston
DBA Shell Oil 66,697,537 0 0 Calumet Specialty Products Princeton
Partners LP 405,477,132 0 0 Calumet Specialty Products Shreveport
Partners LP 25,920,768 0 0 Calumet Specialty Products Indianapolis
Partners LP 66,000,000 62,000,000 0 Citgo Petroleum Corporation Lemont 2,691,000,000 2,691,000,000 0 Marathon Oil Corporation Findlay 620,000,000 0 0 ConocoPhillips Co. Houston 42,000,000 42,000,000 0 Calumet Specialty Products Indianapolis
Partners LP 857,000,000 0 0 Alon USA LP Dallas
105,362 105,362 0 United Refining Co. Warren CBI CBI CBI CBI Lyondell Chemical Co. Houston 2,213,000,000 1,223,000,000 0 Marathon Oil Corporation Findlay 126,000,000 126,000,000 0 Murphy Oil USA, Inc. El Dorado 696,175,997 696,175,997 0 PPB Energy Parsippany 1,511,255,360 1,511,255,360 0 Total Petrochemicals and Houston
Refining USA, Inc. CBI CBI CBI Exxon Mobil Corporation Irving 2,698,292 2,698,292 0 Solvchem, Inc. Pearland CBI CBI CBI BASF Corporation Florham Park 2,830,000,000 2,830,000,000 0 Marathon Oil Corporation Findlay 97,754,939 97,754,939 0 ConocoPhillips Co. Anchorage 2,000,000,000 2,000,000,000 0 ConocoPhillips Co. Ferndale CBI CBI CBI Koch Industries, Inc. Wichita

160 JP-5, JP-8, AND JET A FUELS
5. PRODUCTION, IMPORT/EXPORT, USE, AND DISPOSAL
Table 5-1. Domestic Production, Import, and Export Volumes of Kerosene in 2012a
Domestic manufacturing Imported Volume Parent (pounds) (pounds) Volume used exported Parent company name company city 1,500,000,000 0 0 Tesoro Corporation Kapolei CBI CBI CBI Exxon Mobil Corporation Irving CBI CBI CBI Chalmette Refining LLC Chalmette
200,000,000 N/A 0 Chevron Corporation Houston CBI CBI CBI Exxon Mobil Corporation Irving 2,400,000,000 2,400,000,000 0 Chevron Corporation San Ramon 71,298,667 0 0 Nustar Energy LP Brooks City-
Base 1,359,000,000 1,359,000,000 0 Marathon Oil Corporation Findlay 410,000,000 77,000,000 0 Tesoro Corporation Mandan 1,500,000,000 590,000,000 910,000,000 Petrobras America, Inc. Pasadena 1,313,155,341 1,313,155,341 0 Valero Services, Inc. San Antonio 549,000,000 549,000,000 0 Marathon Oil Corporation Findlay CBI CBI CBI CBI Innospec, Inc. Littleton
1 N/A 0 ConocoPhillips Co. Houston CBI N/A 0 Ethyl Corporation Richmond
940,000,000 0 0 Tesoro Corporation Wilmington 330,000,000 N/A 0 Tesoro Corporation San Antonio
CBI CBI 0 Exxon Mobil Corporation Irving 2,809,664,659 2,809,664,659 0 Citgo Petroleum Corporation Corpus Christi 540,000,000 540,000,000 0 Hollyfrontier Corporation Dallas CBI CBI CBI CBI Valero Energy Corporation San Antonio 1,600,000,000 1,600,000,000 0 Hollyfrontier Corporation Dallas CBI CBI CBI CBI Valero Energy Corporation San Antonio CBI CBI 0 Alon USA LP Paramount CBI CBI CBI CBI Valero Energy Corporation Texas City 40,000,000 0 0 Marathon Oil Corporation Findlay 1,300,000,000 1,300,000,000 0 ConocoPhillips Co. Houston CBI CBI CBI CBI BP Products North America, Naperville
Inc. 1,200,000,000 1,200,000,000 0 Tesoro Corporation San Antonio 575,862,000 0 72,413,000 Astra West Coast Refining, Huntington
Inc. Beach 1,300,000,000 129,930,445 0 Tesoro Corporation Kenai 870,000,000 660,000,000 0 Tesoro Corporation San Antonio CBI CBI CBI Koch Industries Inc. Wichita 2,539,212,856 2,539,212,856 0 PBF Energy Paulsboro
CBI N/A CBI Dorf Ketal Chemicals LLC Stafford 1,700,000,000 1,700,000,000 0 ConocoPhillips Co. Houston 720,000,000 718,496,972 0 Delek Us Holdings Inc. Brentwood 1,356,000,000 1,356,000,000 0 Husky Energy, Inc. Wilmington CBI CBI CBI 0 Ocean Investments Corp. Portsmouth CBI CBI CBI CBI Premcor Refining Group San Antonio

161 JP-5, JP-8, AND JET A FUELS
5. PRODUCTION, IMPORT/EXPORT, USE, AND DISPOSAL
Table 5-1. Domestic Production, Import, and Export Volumes of Kerosene in 2012a
Domestic manufacturing Imported Volume Parent (pounds) (pounds) Volume used exported Parent company name company city 130,000,000 130,000,000 0 Hollyfrontier Corporation Dallas CBI CBI CBI CBI Valero Services, Inc. San Antonio 998,799,401 0 0 Suncor Energy USA, Inc. Commerce City 5,100,000,000 0 0 ConocoPhillips Co. Houston 500,000,000 500,000,000 0 Countrymark Indianapolis 220,000,000 0 0 Gary-Williams Energy Wynnewood
Corporation CBI CBI CBI CBI Hovensa LLC Christiansted
CBI N/A 0 3M Co. St. Paul 267,994,032 267,994,032 0 Alon USA LP Dallas 1,100,000,000 0 0 Hollyfrontier Corporation Dallas 320,000,000 220,000,000 0 Hollyfrontier Corporation Dallas CBI CBI CBI CBI Casey Co. Long Beach 770,000,000 9,500,000 0 Tesoro Corporation Salt Lake City
45,420,783 N/A 0 Lukoil Pan Americas LLC New York CBI CBI CBI CBI The Premcor Refining Memphis
Group, Inc. 2,464,937,141 2,464,937,141 0 PBF Energy Oregon 6,332,180,492 1,440,978 6,333,621,470 0 Citgo Petroleum Corporation Houston 1,925,000,000 1,925,000,000 0 Murphy Oil USA, Inc. El Dorado 66,000,000 36,000,000 0 Hollyfrontier Corporation Dallas 930,000,000 930,000,000 0 ConocoPhillips Co. Houston 19,000,000 18,000,000 0 American Refining Group Bradford CBI CBI CBI CBI Valero Services, Inc. Corpus Christi CBI CBI CBI CBI Sinclair Oil Corporation Salt Lake City CBI CBI CBI CBI CBI CBI 100,000,000 100,000,000 0 Montana Refining Co. Great Falls 927,477,168 0 0 Transworld Oil Lake Charles CBI CBI CBI CBI CBI CBI 3,082,443,279 805,012,637 2,277,430,642 ConocoPhillips Co. Houston 145,475,223 0 0 CVR Refining, LLC Coffeyville 390,000,000 390,000,000 0 Western Refining Gallup
Southwest, Inc. 120,000,000 120,000,000 0 WRB Refining LP Houston 162,100,000 0 162,100,000 Black Elk Refining, LLC Houston CBI CBI CBI CBI Valero Ultramar Holdings, Ardmore
Inc. 841,000,000 841,000,000 0 Northern Tier Energy LLC Ridgefield CBI CBI CBI CBI Valero Energy Corporation San Antonio 1,600,000,000 1600,000,000 0 National Cooperative McPherson
Refinery Association CBI CBI CBI Exxon Mobil Corporation Irving CBI CBI CBI CBI CBI CBI

162 JP-5, JP-8, AND JET A FUELS
5. PRODUCTION, IMPORT/EXPORT, USE, AND DISPOSAL
Table 5-1. Domestic Production, Import, and Export Volumes of Kerosene in 2012a
Domestic manufacturing Imported Volume Parent (pounds) (pounds) Volume used exported Parent company name company city CBI CBI CBI CBI Valero Energy Corporation San Antonio 480,000,000 240,000,000 0 CHS, Inc. Inver Grove
Heights
aData obtained from the EPA Chemical Data Reporting database (EPA 2012a).
CBI = confidential business information

163 JP-5, JP-8, AND JET A FUELS
5. PRODUCTION, IMPORT/EXPORT, USE, AND DISPOSAL
Table 5-2. Non-confidential 2006 Inventory Update Reporting Records by Chemical, Including Manufacturing, Processing, and Use Information for
Kerosene (Petroleum); CAS Registry No. 8008-20-6; Aggregated National Production Volume: ≥1 Billion Pounds
Company and site information Company Site City Statea Manufacture Import Site limited AGE Refining, Inc. San Antonio San Antonio TX Yes No Yes Alon USA LP Big Spring Big Spring TX Yes No Yes
Refinery American Refining American Refining Bradford PA Yes No No Group, Inc. Group, Inc. BP America, Inc. BP, Prudhoe Bay Prudhoe Bay AK Yes No No
Crude Oil Topping Plant
BP America, Inc. Los Angeles Carson CA Yes No No (Carson) Refinery
BP America, Inc. Texas City Texas City TX Yes No No Refinery
BP America, Inc. BP Products Warrenville IL No Yes N/A North America Inc., IST
BP America, Inc. Whiting Refinery Whiting IN Yes No No BP America, Inc. Toledo Refinery Oregon OH Yes No No Big West Oil, LLC North Salt Lake North Salt Lake UT
Refinery CHS, Inc. Laurel Refinery Laurel MT Yes No No CITGO Petroleum Corporate Office Houston TX No Yes N/A Corporation CITGO Petroleum CITGO Refining Corpus Christi TX Yes No No Corporation and Chemicals
Company East Plant
CITGO Petroleum PDV Midwest Lemont IL Yes No No Corporation Refining, L.L.C.,
Lemont Refinery (operated by CITGO Petroleum Corporation)
CITGO Petroleum Port Everglades Fort FL No Yes N/A Corporation Terminal Lauderdale CITGO Petroleum Tampa Terminal Tampa FL No Yes N/A Corporation CITGO Petroleum Lake Charles Lake Charles LA Yes No Yes Corporation Manufacturing
Complex CITGO Petroleum Linden Terminal Linden NJ No Yes N/A Corporation

164 JP-5, JP-8, AND JET A FUELS
5. PRODUCTION, IMPORT/EXPORT, USE, AND DISPOSAL
Table 5-2. Non-confidential 2006 Inventory Update Reporting Records by Chemical, Including Manufacturing, Processing, and Use Information for
Kerosene (Petroleum); CAS Registry No. 8008-20-6; Aggregated National Production Volume: ≥1 Billion Pounds
Company and site information Company Site City Statea Manufacture Import Site limited Calumet Lubricants Shreveport Shreveport LA Yes No No Co., L.P. Refinery Calumet Lubricants Princeton Refinery Princeton LA Yes No Yes Co., L.P. Calumet Lubricants Cotton Valley Cotton Valley LA Yes No Yes Co., L.P. Refinery Chalmette Refining Chalmette Chalmette LA Yes No No LLC Refining LLC Chevron U.S.A., Inc. Global Supply and Houston TX No Yes N/A
Trading Chevron U.S.A., Inc. El Segundo El Segundo CA Yes No Yes Coffeyville Coffeyville Coffeyville KS Yes No No Resources Refining Resources and Marketing, LLC Refining and
Marketing, LLC ConocoPhillips Ferndale Refinery Ferndale WA Yes No Yes Company ConocoPhillips Kaparuk River Anchorage AK Yes No No Company Unit ConocoPhillips Kaparuk River Anchorage AK Yes No Yes Company Unit ConocoPhillips Los Angeles Carson CA Yes No No Company Refinery Carson
Plant ConocoPhillips Ponca City Ponca City OK Yes No No Company Refinery ConocoPhillips Sweeny Refinery Old Ocean TX Yes No No Company ConocoPhillips Lake Charles Westlake LA Yes No No Company Refinery ConocoPhillips Ferndale Refinery Ferndale WA Yes No No Company ConocoPhillips Borger Refinery Borger TX Yes No No Company ConocoPhillips Bayway Refinery Linden NJ Yes No No Company ConocoPhillips Alliance Refinery Belle Chasse LA Yes No No Company Countrymark Refinery Mt. Vernon IN Yes No Yes Cooperative, LLP Diamond Shamrock Valero Three Three Rivers TX Yes No No Refining Co., L.P. Rivers Refinery

165 JP-5, JP-8, AND JET A FUELS
5. PRODUCTION, IMPORT/EXPORT, USE, AND DISPOSAL
Table 5-2. Non-confidential 2006 Inventory Update Reporting Records by Chemical, Including Manufacturing, Processing, and Use Information for
Kerosene (Petroleum); CAS Registry No. 8008-20-6; Aggregated National Production Volume: ≥1 Billion Pounds
Company and site information Company Site City Statea Manufacture Import Site limited Ethyl Corporation Houston Plant Pasadena TX Exxon Mobil Baton Rouge Baton Rouge LA Yes No No Corporation Refinery Exxon Mobil Baytown Refinery Baytown TX Yes No No Corporation Exxon Mobil Billings Refinery Billings MT Yes No Yes Corporation ExxonMobil Oil Fairfax Fairfax VA No Yes N/A Corporation ExxonMobil Oil Torrance Refinery Torrance CA Yes No No Corporation ExxonMobil Oil Beaumont Beaumont TX Yes No No Corporation Refinery ExxonMobil Oil Joliet Refinery Channahon IL Yes No Yes Corporation Flint Hills North Pole North Pole AK Yes No No Resources, Alaska Refinery LLC Flint Hills East Plant Corpus Christi TX Yes No No Resources, LP Flint Hills West Plant Corpus Christi TX Yes No No Resources, LP Frontier El Dorado Frontier El Dorado El Dorado KS Yes No No Refining Company Refining Company Giant Refining Ciniza Jamestown NM Yes No No Company Giant Yorktown, Inc. Refinery Grafton VA Yes No No Glencore Ltd. Glencore Ltd. Stamford CT Holly Refining & Woods Cross Woods Cross UT Yes No No Marketing Company Refinery Hunt Refining Tuscaloosa Tuscaloosa AL Yes No Yes Company Refinery Irving Oil, Inc. Irving Oil Portsmouth NH
Terminals Inc. PADD 1
Marathon Oil Catlettsburg Catlettsburg KY Yes No No Corporation Refining, LLC Marathon Oil Garyville Garyville LA Yes No No Corporation Marathon Petroleum Minnesota St. Paul Park MN Yes No No Company LLC Refining Division

166 JP-5, JP-8, AND JET A FUELS
5. PRODUCTION, IMPORT/EXPORT, USE, AND DISPOSAL
Table 5-2. Non-confidential 2006 Inventory Update Reporting Records by Chemical, Including Manufacturing, Processing, and Use Information for
Kerosene (Petroleum); CAS Registry No. 8008-20-6; Aggregated National Production Volume: ≥1 Billion Pounds
Company and site information Company Site City Statea Manufacture Import Site limited Marathon Petroleum Michigan Refining Detroit MI Yes No Yes Company LLC Division Marathon Petroleum Texas Refining Texas City TX Yes No No Company LLC Division Midland Asphalt Tonawanda Tonawanda NY Yes No No Materials Inc. Motiva Enterprises, Port Arthur Port Arthur TX Yes No No LLC Refinery Motiva Enterprises, Convent Refinery Convent LA Yes No No LLC Motiva Enterprises, Norco Refinery Norco LA Yes No No LLC Murphy Oil Meraux Refinery Meraux LA Yes No No Corporation Murphy Oil USA, Superior Refinery Superior WI Yes No No Inc. Navajo Refining Lovington Lovington NM Yes No No Company, L.P. Refinery Navajo Refining Artesia Refinery Artesia NM Yes No No Company, L.P. Paramount Paramount Paramount CA Yes No No Petroleum Corporation Paramount Wilibridge Asphalt Portland OR Yes No No Petroleum Facility Corporation Penreco Karns City Karns City PA Yes No No Premcor USA Inc. The Premcor Memphis TN Yes No No
Refining Group Inc. DBA Valero Memphis Refinery
Premcor USA Inc. Port Arthur Port Arthur TX Yes No No Refinery
Safety-Kleen Safety-Kleen Oil East Chicago IN Yes No No Systems, Inc. Recovery Co. San Juan Refining Giant Refining, Bloomfield NM Yes No No Company Bloomfield Shell Chemical LP Mobile Site Saraland AL Yes No No Shell Chemical LP St. Rose Site St. Rose LA Yes No No Shell Chemical LP Yabucoa, Inc. Yabucoa PR Yes No No Shell Deer Park Shell Deer Park Deer Park TX Yes No No Refining Company Refining Company

167 JP-5, JP-8, AND JET A FUELS
5. PRODUCTION, IMPORT/EXPORT, USE, AND DISPOSAL
Table 5-2. Non-confidential 2006 Inventory Update Reporting Records by Chemical, Including Manufacturing, Processing, and Use Information for
Kerosene (Petroleum); CAS Registry No. 8008-20-6; Aggregated National Production Volume: ≥1 Billion Pounds
Company and site information Company Site City Statea Manufacture Import Site limited Shell Oil Products Los Angeles Los Angeles CA Yes No No US Refinery Shell Oil Products Puget Sound Anacortes WA Yes No No US Refinery Shell Trading (US) Main office Houston TX No Yes N/A Company Sigmor Corporation Diamond Sunray TX Yes No No
Shamrock Refining, L.P., Valero McKee Refinery
Sinclair Refining Casper Refinery Casper WY Yes No Yes Company Sinclair Refining Tulsa Refining Tulsa OK Yes No No Company Company Sinclair Wyoming Sinclair Wyoming Sinclair WY Yes No No Refining Company Refining Company Suncor Energy Commerce City Commerce City CO Yes No No (U.S.A.) Inc. Refinery Sunoco, Inc. Tulsa Refinery Tulsa OK Yes No No Tesoro Corporation Tesoro Alaska Kenai AK Yes No No
Company - Kenai Refinery
Tesoro Petroleum Hawaii Refinery Kapolei HI Yes No No Corporation Tesoro Refining and Anacortes Anacortes WA Yes No No Marketing Company Tesoro Refining and Golden Eagle Martinez CA Yes No Yes Marketing Company Refinery Tesoro Refining and Mandan Refinery Mandan ND Yes No No Marketing Company Tesoro Refining and Salt Lake City Salt Lake City UT Yes No No Marketing Company Refinery Texaco Fuel and Marine San Ramon CA No Yes N/A Downstream LLC Marketing LLC The Dow Chemical Headquarters Midland MI No Yes N/A Company Tremco Beachwood Beachwood OH No Yes N/A Incorporated U.S. Oil and Tacoma Tacoma WA Yes No No Refining Co.

168 JP-5, JP-8, AND JET A FUELS
5. PRODUCTION, IMPORT/EXPORT, USE, AND DISPOSAL
Table 5-2. Non-confidential 2006 Inventory Update Reporting Records by Chemical, Including Manufacturing, Processing, and Use Information for
Kerosene (Petroleum); CAS Registry No. 8008-20-6; Aggregated National Production Volume: ≥1 Billion Pounds
Company and site information Company Site City Statea Manufacture Import Site limited Valero Energy Premcor Refining Delaware City DE Yes No Yes Corporation Group Inc. Valero Refining Valero Marketing San Antonio TX No Yes N/A Company and Supply
Company Valero Refining Paulsboro Paulsboro NJ Yes No No Company Refinery Valero Refining Benicia Refinery Benicia CA Yes No Yes Company and Asphalt Plant Valero Refining Wilmington Wilmington CA Yes No Yes Company Valero Refining St. Charles Norco LA Yes No No Company Refinery Valero Unit Houston Refinery Houston TX Yes No No Investments, LLC Valero Unit Texas City Texas City TX Yes No No Investments, LLC Refinery Western Refining Western Refining El Paso TX Yes No No Company Company Wynnewood Wynnewood Wynnewood OK Yes No No Refining Company Refining Company Wyoming Refining Newcastle Newcastle WY Yes No Yes Company Refinery
aPost Office abbreviations used.
CAS = Chemical Abstracts Service; N/A = not applicable
Source: EPA 2010

169 JP-5, JP-8, AND JET A FUELS
5. PRODUCTION, IMPORT/EXPORT, USE, AND DISPOSAL
Table 5-3. Weekly U.S. Production of Commercial Kerosene-Type Jet Fuel (Thousand Barrels per Day) Since 2010a
Week 1 Week 2 Week 3 Week 4 Week 5 End End End End End
Year-month date Value date Value date Value date Value date Value 2010-January 01/01 1,335 01/08 1,354 01/15 1,334 01/22 1,264 01/29 1,215 2010-February 02/05 1,157 02/12 1,134 02/19 1,159 02/26 1,141 2010-March 03/05 1,160 03/12 1,171 03/19 1,147 03/26 1,170 2010-April 04/02 1,190 04/09 1,209 04/16 1,244 04/23 1,289 04/30 1,319 2010-May 05/07 1,328 05/14 1,342 05/21 1,323 05/28 1,296 2010-June 06/04 1,290 06/11 1,280 06/18 1,279 06/25 1,291 2010-July 07/02 1,329 07/09 1,353 07/16 1,381 07/23 1,399 07/30 1,382 2010-August 08/06 1,357 08/13 1,339 08/20 1,308 08/27 1,287 2010-September 09/03 1,285 09/10 1,281 09/17 1,299 09/24 1,282 2010-October 10/01 1,269 10/08 1,251 10/15 1,223 10/22 1,219 10/29 1,216 2010-November 11/05 1,199 11/12 1,217 11/19 1,249 11/26 1,248 2010-December 12/03 1,280 12/10 1,270 12/17 1,266 12/24 1,278 12/31 1,287 2011-January 01/07 1,313 01/14 1,297 01/21 1,288 01/28 1,270 2011-February 02/04 1,243 02/11 1,215 02/18 1,225 02/25 1,217 2011-March 03/04 1,223 03/11 1,255 03/18 1,243 03/25 1,262 2011-April 04/01 1,272 04/08 1,277 04/15 1,293 04/22 1,270 04/29 1,272 2011-May 05/06 1,253 05/13 1,250 05/20 1,278 05/27 1,288 2011-June 06/03 1,331 06/10 1,347 06/17 1,363 06/24 1,396 2011-July 07/01 1,381 07/08 1,400 07/15 1,415 07/22 1,394 07/29 1,413 2011-August 08/05 1,389 08/12 1,363 08/19 1,346 08/26 1,362 2011-September 09/02 1,381 09/09 1,389 09/16 1,415 09/23 1,401 09/30 1,419 2011-October 10/07 1,417 10/14 1,372 10/21 1,342 10/28 1,282 2011-November 11/04 1,238 11/11 1,228 11/18 1,223 11/25 1,217 2011-December 12/02 1,250 12/09 1,276 12/16 1,290 12/23 1,309 12/30 1,293 2012-January 01/06 1,310 01/13 1,311 01/20 1,324 01/27 1,319 2012-February 02/03 1,302 02/10 1,292 02/17 1,296 02/24 1,307 2012-March 03/02 1,293 03/09 1,279 03/16 1,265 03/23 1,247 03/30 1,257 2012-April 04/06 1,271 04/13 1,263 04/20 1,292 04/27 1,291 2012-May 05/04 1,280 05/11 1,280 05/18 1,270 05/25 1,280 2012-June 06/01 1,339 06/08 1,378 06/15 1,425 06/22 1,456 06/29 1,456 2012-July 07/06 1,485 07/13 1,460 07/20 1,447 07/27 1,471 2012-August 08/03 1,486 08/10 1,502 08/17 1,528 08/24 1,504 08/31 1,448 2012-September 09/07 1,404 09/14 1,367 09/21 1,339 09/28 1,357 2012-October 10/05 1,358 10/12 1,340 10/19 1,326 10/26 1,313 2012-November 11/02 1,319 11/09 1,302 11/16 1,297 11/23 1,260 11/30 1,244 2012-December 12/07 1,290 12/14 1,308 12/21 1,339 12/28 1,378 2013-January 01/04 1,374 01/11 1,381 01/18 1,357 01/25 1,318 2013-February 02/01 1,299 02/08 1,290 02/15 1,302 02/22 1,305

170 JP-5, JP-8, AND JET A FUELS
5. PRODUCTION, IMPORT/EXPORT, USE, AND DISPOSAL
Table 5-3. Weekly U.S. Production of Commercial Kerosene-Type Jet Fuel (Thousand Barrels per Day) Since 2010a
Week 1 Week 2 Week 3 Week 4 Week 5 End End End End End
Year-month date Value date Value date Value date Value date Value 2013-March 03/01 1,312 03/08 1,293 03/15 1,300 03/22 1,347 03/29 1,387 2013-April 04/05 1,423 04/12 1,443 04/19 1,429 04/26 1,389 2013-May 05/03 1,405 05/10 1,408 05/17 1,373 05/24 1,370 05/31 1,350 2013-June 06/07 1,344 06/14 1,385 06/21 1,416 06/28 1,437 2013-July 07/05 1,461 07/12 1,460 07/19 1,470 07/26 1,479 2013-August 08/02 1,482 08/09 1,475 08/16 1,478 08/23 1,475 08/30 1,483 2013-September 09/06 1,516 09/13 1,512 09/20 1,489 09/27 1,451 2013-October 10/04 1,405 10/11 1,371 10/18 1,364 10/25 1,362 2013-November 11/01 1,368 11/08 1,380 11/15 1,374 11/22 1,385 11/29 1,401 2013-December 12/06 1,436 12/13 1,475 12/20 1,501 12/27 1,527 2014-January 01/03 1,543 01/10 1,527 01/17 1,495 01/24 1,444 01/31 1,384 2014-February 02/07 1,375 02/14 1,360 02/21 1,369 02/28 1,384 2014-March 03/07 1,375 03/14 1,365 03/21 1,362 03/28 1,361 2014-April 04/04 1,378 04/11 1,395 04/18 1,404 04/25 1,418 2014-May 05/02 1,416 05/09 1,430 05/16 1,429 05/23 1,413 05/30 1,419 2014-June 06/06 1,417 06/13 1,440 06/20 1,433 06/27 1,419 2014-July 07/04 1,440 07/11 1,457 07/18 1,510 1,548
aData obtained from EIA (2014a).

171 JP-5, JP-8, AND JET A FUELS
5. PRODUCTION, IMPORT/EXPORT, USE, AND DISPOSAL
Table 5-4. Weekly U.S. Production of Military Kerosene-Type Jet Fuel (Thousand Barrels per Day) Since 2010a
Week 1 Week 2 Week 3 Week 4 Week 5 End End End End End
Year-month date Value date Value date Value date Value date Value 2010-January 01/01 128 01/08 105 01/15 109 01/22 134 01/29 148 2010-February 02/05 154 02/12 153 02/19 128 02/26 137 2010-March 03/05 127 03/12 139 03/19 161 03/26 157 2010-April 04/02 175 04/09 162 04/16 152 04/23 148 04/30 142 2010-May 05/07 144 05/14 136 05/21 143 05/28 147 2010-June 06/04 142 06/11 147 06/18 143 06/25 142 2010-July 07/02 149 07/09 143 07/16 151 07/23 153 07/30 153 2010-August 08/06 153 08/13 138 08/20 140 08/27 141 2010-September 09/03 147 09/10 161 09/17 144 09/24 132 2010-October 10/01 124 10/08 108 10/15 105 10/22 118 10/29 109 2010-November 11/05 123 11/12 125 11/19 111 11/26 116 2010-December 12/03 100 12/10 112 12/17 116 12/24 126 12/31 121 2011-January 01/07 117 01/14 107 01/21 102 01/28 114 2011-February 02/04 113 02/11 122 02/18 116 02/25 110 2011-March 03/04 118 03/11 121 03/18 139 03/25 154 2011-April 04/01 147 04/08 159 04/15 147 04/22 135 04/29 146 2011-May 05/06 144 05/13 140 05/20 138 05/27 131 2011-June 06/03 126 06/10 137 06/17 142 06/24 135 2011-July 07/01 148 07/08 143 07/15 149 07/22 160 07/29 137 2011-August 08/05 147 08/12 149 08/19 163 08/26 165 2011-September 09/02 165 09/09 151 09/16 135 09/23 139 09/30 134 2011-October 10/07 136 10/14 132 10/21 134 10/28 136 2011-November 11/04 136 11/11 135 11/18 132 11/25 133 2011-December 12/02 129 12/09 128 12/16 127 12/23 122 12/30 134 2012-January 01/06 130 01/13 129 01/20 125 01/27 118 2012-February 02/03 110 02/10 110 02/17 103 02/24 98 2012-March 03/02 103 03/09 106 03/16 102 03/23 118 03/30 129 2012-April 04/06 125 04/13 139 04/20 122 04/27 123 2012-May 05/04 133 05/11 119 05/18 128 05/25 128 2012-June 06/01 128 06/08 149 06/15 141 06/22 137 06/29 124 2012-July 07/06 121 07/13 139 07/20 132 07/27 140 2012-August 08/03 127 08/10 126 08/17 126 08/24 115 08/31 113 2012-September 09/07 110 09/14 120 09/21 130 09/28 131 2012-October 10/05 131 10/12 132 10/19 142 10/26 142 2012-November 11/02 134 11/09 135 11/16 117 11/23 117 11/30 134 2012-December 12/07 123 12/14 134 12/21 134 12/28 117 2013-January 01/04 125 01/11 125 01/18 130 01/25 134 2013-February 02/01 123 02/08 112 02/15 115 02/22 112

172 JP-5, JP-8, AND JET A FUELS
5. PRODUCTION, IMPORT/EXPORT, USE, AND DISPOSAL
Table 5-4. Weekly U.S. Production of Military Kerosene-Type Jet Fuel (Thousand Barrels per Day) Since 2010a
Week 1 Week 2 Week 3 Week 4 Week 5 End End End End End
Year-month date Value date Value date Value date Value date Value 2013-March 03/01 108 03/08 110 03/15 92 03/22 81 03/29 82 2013-April 04/05 86 04/12 87 04/19 93 04/26 112 2013-May 05/03 113 05/10 118 05/17 139 05/24 136 05/31 134 2013-June 06/07 138 06/14 117 06/21 103 06/28 105 2013-July 07/05 108 07/12 109 07/19 109 07/26 98 2013-August 08/02 89 08/09 99 08/16 101 08/23 104 08/30 116 2013-September 09/06 104 09/13 105 09/20 108 09/27 103 2013-October 10/04 106 10/11 102 10/18 93 10/25 81 2013-November 11/01 81 11/08 89 11/15 94 11/22 98 11/29 102 2013-December 12/06 98 12/13 96 12/20 98 12/27 93 2014-January 01/03 89 01/10 89 01/17 91 01/24 99 01/31 97 2014-February 02/07 96 02/14 92 02/21 85 02/28 89 2014-March 03/07 97 03/14 100 03/21 98 03/28 95 2014-April 04/04 89 04/11 90 04/18 88 04/25 86 2014-May 05/02 87 05/09 88 05/16 90 05/23 98 05/30 94 2014-June 06/06 82 06/13 82 06/20 81 06/27 91 2014-July 07/04 100 07/11 99 07/18 94 99
aData obtained from EIA (2014b).

173 JP-5, JP-8, AND JET A FUELS
5. PRODUCTION, IMPORT/EXPORT, USE, AND DISPOSAL
and then showed a steady increase from 1985 to 1987, attaining an annual maximum of 6,935,000 barrels
in 1987. Between 1988 and 1990, imports of kerosene decreased to a low of 1,825,000 barrels (API
1991). Table 5-1 shows that approximately 2,399,093 tonnes of kerosene (18,712,925 barrels) were
imported into the United States in 2012; however, several companies claimed these data as CBI and did
not report any import volumes publically. Table 5-5 shows the weekly import volume of kerosene-type
jet fuels since 2000 as reported by the U.S. Energy Information Administration (EIA 2014b).
Kerosene exportation between 1987 and 1989 remained relatively constant with a yearly export average of
approximately 547,500 barrels. However, by 1990, the annual export of kerosene was 2,190,000 barrels
(API 1991), an increase of approximately 400%. Table 5-1 shows that approximately 1,609,977 tonnes
(12,557,821 barrels) of kerosene were exported from the United States in 2012; however, several companies
claimed these data as CBI and did not report any export volumes publically. Table 5-6 provides the U.S.
exports of kerosene-type jet fuels since 1981 as reported by EIA (2014c).
5.3 USE
Aviation turbine fuels were not used until the 1930s when the first turbojet engine was developed.
Jet-powered aircraft had only limited use in World War II, but further military and commercial
developments allowed jet engines to dominate as power sources for aircraft by the 1960s. JP-1 was the
first U.S. specification for jet fuel (AN-F-32A, 1944). JP-1 was a kerosene fuel with a maximum freeze
point of -60°C and a minimum flash point of 43°C established for operability and safety (Air Force 1987).
The flash and freeze points establish boundaries on the minimum and maximum size, respectively, of the
hydrocarbon molecules in jet fuel. As fuel specifications evolved, trading off producibility and cost
versus performance and safety, the U.S. Air Force settled on JP-4 (MIL-F-5624A, a gasoline-kerosene
mix) in the 1950s–1970s, the Navy has used JP-5 (a minimum 60°C flash point kerosene also listed in
MIL-F-5624) shipboard since the 1950s, and commercial aviation has used Jet A/Jet A-1 (ASTM D1655,
minimum 38°C flash point) since its rapid growth in the 1960s (Air Force 1987b; Dukek and Winans
1969; Edwards 2003). Heavier losses in JP-4 fueled aircraft in Vietnam (versus JP-5) caused the U.S. Air
Force to convert to JP-8 in 1980s. As discussed in Chapter 4, JP-8 is the military equivalent to Jet A-1,
but contains additive packages that may not be required for commercial jet fuels. Recent studies in the
United States have indicated that use of Jet A with its -40°C maximum freeze point was an acceptable and
cost-effective alternative to JP-8, so the Air Force is scheduled to complete the conversion to F-24
(Jet A + the additive package) in 2014 for use in the continental United States (Air Force 2013). Thus,
setting aside the military additive package, jet fuels world-wide consist almost entirely of the very similar

174 JP-5, JP-8, AND JET A FUELS
5. PRODUCTION, IMPORT/EXPORT, USE, AND DISPOSAL
Table 5-5. Weekly U.S. Imports of Kerosene-Type Jet Fuel (Thousand Barrels per Day) Since 2000
Week 1 Week 2 Week 3 Week 4 Week 5 End End End End End
Year-month date Value date Value date Value date Value date Value 2000-January 01/07 53 01/14 68 01/21 95 01/28 189 2000-February 02/04 120 02/11 162 02/18 109 02/25 100 2000-March 03/03 165 03/10 127 03/17 126 03/24 90 03/31 79 2000-April 04/07 77 04/14 113 04/21 109 04/28 106 2000-May 05/05 149 05/12 76 05/19 103 05/26 163 2000-June 06/02 134 06/09 141 06/16 131 06/23 104 06/30 142 2000-July 07/07 118 07/14 115 07/21 152 07/28 76 2000-August 08/04 177 08/11 121 08/18 174 08/25 52 2000-September 09/01 125 09/08 122 09/15 76 09/22 140 09/29 190 2000-October 10/06 128 10/13 177 10/20 183 10/27 173 2000-November 11/03 145 11/10 205 11/17 89 11/24 125 2000-December 12/01 100 12/08 162 12/15 82 12/22 225 12/29 181 2001-January 01/05 250 01/12 133 01/19 250 01/26 220 2001-February 02/02 238 02/09 192 02/16 231 02/23 221 2001-March 03/02 116 03/09 237 03/16 188 03/23 155 03/30 91 2001-April 04/06 148 04/13 156 04/20 148 04/27 165 2001-May 05/04 175 05/11 318 05/18 97 05/25 167 2001-June 06/01 144 06/08 151 06/15 137 06/22 94 06/29 147 2001-July 07/06 168 07/13 50 07/20 240 07/27 241 2001-August 08/03 133 08/10 176 08/17 111 08/24 168 08/31 120 2001-September 09/07 117 09/14 212 09/21 69 09/28 120 2001-October 10/05 42 10/12 155 10/19 130 10/26 49 2001-November 11/02 36 11/09 174 11/16 88 11/23 71 11/30 57 2001-December 12/07 85 12/14 104 12/21 131 12/28 68 2002-January 01/04 88 01/11 105 01/18 39 01/25 193 2002-February 02/01 113 02/08 77 02/15 146 02/22 76 2002-March 03/01 105 03/08 28 03/15 48 03/22 135 03/29 116 2002-April 04/05 106 04/12 192 04/19 105 04/26 87 2002-May 05/03 144 05/10 78 05/17 99 05/24 89 05/31 59 2002-June 06/07 153 06/14 127 06/21 105 06/28 104 2002-July 07/05 73 07/12 89 07/19 53 07/26 104 2002-August 08/02 69 08/09 124 08/16 29 08/23 166 08/30 59 2002-September 09/06 145 09/13 93 09/20 166 09/27 86 2002-October 10/04 156 10/11 143 10/18 160 10/25 243 2002-November 11/01 192 11/08 86 11/15 123 11/22 101 11/29 218 2002-December 12/06 188 12/13 108 12/20 68 12/27 84 2003-January 01/03 192 01/10 115 01/17 224 01/24 75 01/31 111 2003-February 02/07 82 02/14 48 02/21 110 02/28 107

175 JP-5, JP-8, AND JET A FUELS
5. PRODUCTION, IMPORT/EXPORT, USE, AND DISPOSAL
Table 5-5. Weekly U.S. Imports of Kerosene-Type Jet Fuel (Thousand Barrels per Day) Since 2000
Week 1 Week 2 Week 3 Week 4 Week 5 End End End End End
Year-month date Value date Value date Value date Value date Value 2003-March 03/07 67 03/14 164 03/21 118 03/28 35 2003-April 04/04 100 04/11 70 04/18 97 04/25 105 2003-May 05/02 143 05/09 118 05/16 154 05/23 99 05/30 128 2003-June 06/06 165 06/13 53 06/20 128 06/27 216 2003-July 07/04 174 07/11 168 07/18 175 07/25 187 2003-August 08/01 156 08/08 216 08/15 118 08/22 68 08/29 153 2003-September 09/05 122 09/12 122 09/19 149 09/26 48 2003-October 10/03 108 10/10 298 10/17 49 10/24 90 10/31 91 2003-November 11/07 86 11/14 54 11/21 57 11/28 69 2003-December 12/05 82 12/12 128 12/19 53 12/26 146 2004-January 01/02 139 01/09 100 01/16 108 01/23 86 01/30 77 2004-February 02/06 65 02/13 136 02/20 86 02/27 57 2004-March 03/05 101 03/12 131 03/19 37 03/26 68 2004-April 04/02 30 04/09 59 04/16 81 04/23 121 04/30 59 2004-May 05/07 102 05/14 173 05/21 159 05/28 166 2004-June 06/04 172 06/11 211 06/18 80 06/25 234 2004-July 07/02 160 07/09 86 07/16 81 07/23 67 07/30 136 2004-August 08/06 179 08/13 98 08/20 257 08/27 103 2004-September 09/03 76 09/10 95 09/17 60 09/24 77 2004-October 10/01 56 10/08 157 10/15 153 10/22 94 10/29 164 2004-November 11/05 51 11/12 235 11/19 163 11/26 105 2004-December 12/03 110 12/10 121 12/17 119 12/24 85 12/31 198 2005-January 01/07 30 01/14 107 01/21 134 01/28 76 2005-February 02/04 57 02/11 143 02/18 66 02/25 127 2005-March 03/04 63 03/11 77 03/18 88 03/25 145 2005-April 04/01 200 04/08 51 04/15 111 04/22 49 04/29 75 2005-May 05/06 170 05/13 100 05/20 116 05/27 39 2005-June 06/03 48 06/10 75 06/17 86 06/24 107 2005-July 07/01 56 07/08 22 07/15 165 07/22 81 07/29 68 2005-August 08/05 80 08/12 39 08/19 31 08/26 165 2005-September 09/02 105 09/09 143 09/16 185 09/23 191 09/30 159 2005-October 10/07 179 10/14 221 10/21 319 10/28 301 2005-November 11/04 444 11/11 249 11/18 139 11/25 183 2005-December 12/02 183 12/09 400 12/16 138 12/23 258 12/30 167 2006-January 01/06 122 01/13 154 01/20 182 01/27 42 2006-February 02/03 174 02/10 66 02/17 143 02/24 87 2006-March 03/03 104 03/10 106 03/17 102 03/24 161 03/31 123 2006-April 04/07 70 04/14 254 04/21 190 04/28 262

176 JP-5, JP-8, AND JET A FUELS
5. PRODUCTION, IMPORT/EXPORT, USE, AND DISPOSAL
Table 5-5. Weekly U.S. Imports of Kerosene-Type Jet Fuel (Thousand Barrels per Day) Since 2000
Week 1 Week 2 Week 3 Week 4 Week 5 End End End End End
Year-month date Value date Value date Value date Value date Value 2006-May 05/05 209 05/12 112 05/19 256 05/26 345 2006-June 06/02 221 06/09 100 06/16 183 06/23 188 06/30 263 2006-July 07/07 225 07/14 172 07/21 167 07/28 224 2006-August 08/04 205 08/11 300 08/18 399 08/25 266 2006-September 09/01 119 09/08 124 09/15 292 09/22 158 09/29 200 2006-October 10/06 215 10/13 399 10/20 182 10/27 201 2006-November 11/03 186 11/10 78 11/17 127 11/24 96 2006-December 12/01 141 12/08 247 12/15 107 12/22 163 12/29 249 2007-January 01/05 270 01/12 137 01/19 196 01/26 261 2007-February 02/02 203 02/09 232 02/16 221 02/23 286 2007-March 03/02 188 03/09 372 03/16 238 03/23 263 03/30 165 2007-April 04/06 294 04/13 336 04/20 297 04/27 233 2007-May 05/04 324 05/11 264 05/18 162 05/25 294 2007-June 06/01 237 06/08 312 06/15 191 06/22 230 06/29 293 2007-July 07/06 305 07/13 194 07/20 189 07/27 265 2007-August 08/03 247 08/10 231 08/17 283 08/24 203 08/31 224 2007-September 09/07 194 09/14 200 09/21 268 09/28 112 2007-October 10/05 246 10/12 191 10/19 235 10/26 174 2007-November 11/02 191 11/09 152 11/16 196 11/23 220 11/30 240 2007-December 12/07 146 12/14 190 12/21 153 12/28 135 2008-January 01/04 166 01/11 85 01/18 56 01/25 182 2008-February 02/01 209 02/08 157 02/15 71 02/22 132 02/29 87 2008-March 03/07 258 03/14 298 03/21 41 03/28 111 2008-April 04/04 203 04/11 318 04/18 178 04/25 114 2008-May 05/02 131 05/09 300 05/16 161 05/23 116 05/30 162 2008-June 06/06 109 06/13 86 06/20 114 06/27 66 2008-July 07/04 34 07/11 98 07/18 63 07/25 119 2008-August 08/01 59 08/08 74 08/15 95 08/22 67 08/29 50 2008-September 09/05 26 09/12 79 09/19 68 09/26 145 2008-October 10/03 151 10/10 73 10/17 85 10/24 38 10/31 136 2008-November 11/07 36 11/14 88 11/21 77 11/28 45 2008-December 12/05 26 12/12 45 12/19 111 12/26 54 2009-January 01/02 56 01/09 10 01/16 69 01/23 101 01/30 16 2009-February 02/06 111 02/13 23 02/20 60 02/27 59 2009-March 03/06 47 03/13 155 03/20 56 03/27 150 2009-April 04/03 29 04/10 76 04/17 115 04/24 56 2009-May 05/01 123 05/08 58 05/15 170 05/22 73 05/29 102 2009-June 06/05 67 06/12 51 06/19 98 06/26 61
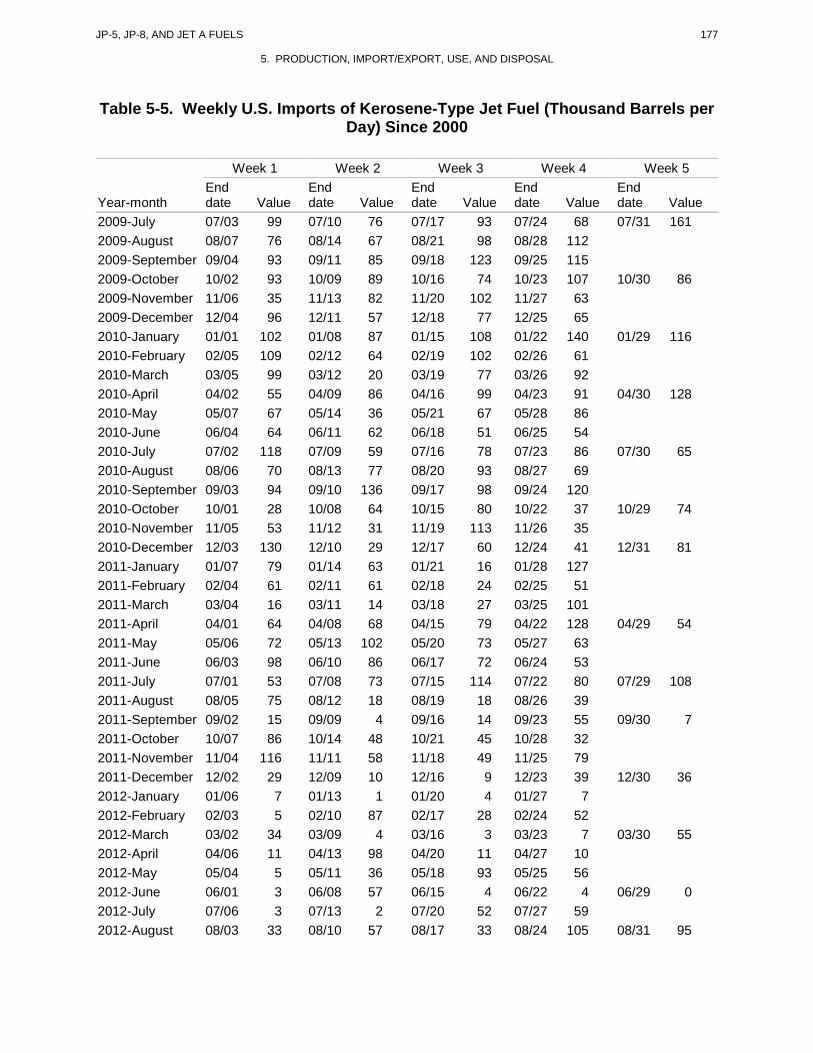
177 JP-5, JP-8, AND JET A FUELS
5. PRODUCTION, IMPORT/EXPORT, USE, AND DISPOSAL
Table 5-5. Weekly U.S. Imports of Kerosene-Type Jet Fuel (Thousand Barrels per Day) Since 2000
Week 1 Week 2 Week 3 Week 4 Week 5 End End End End End
Year-month date Value date Value date Value date Value date Value 2009-July 07/03 99 07/10 76 07/17 93 07/24 68 07/31 161 2009-August 08/07 76 08/14 67 08/21 98 08/28 112 2009-September 09/04 93 09/11 85 09/18 123 09/25 115 2009-October 10/02 93 10/09 89 10/16 74 10/23 107 10/30 86 2009-November 11/06 35 11/13 82 11/20 102 11/27 63 2009-December 12/04 96 12/11 57 12/18 77 12/25 65 2010-January 01/01 102 01/08 87 01/15 108 01/22 140 01/29 116 2010-February 02/05 109 02/12 64 02/19 102 02/26 61 2010-March 03/05 99 03/12 20 03/19 77 03/26 92 2010-April 04/02 55 04/09 86 04/16 99 04/23 91 04/30 128 2010-May 05/07 67 05/14 36 05/21 67 05/28 86 2010-June 06/04 64 06/11 62 06/18 51 06/25 54 2010-July 07/02 118 07/09 59 07/16 78 07/23 86 07/30 65 2010-August 08/06 70 08/13 77 08/20 93 08/27 69 2010-September 09/03 94 09/10 136 09/17 98 09/24 120 2010-October 10/01 28 10/08 64 10/15 80 10/22 37 10/29 74 2010-November 11/05 53 11/12 31 11/19 113 11/26 35 2010-December 12/03 130 12/10 29 12/17 60 12/24 41 12/31 81 2011-January 01/07 79 01/14 63 01/21 16 01/28 127 2011-February 02/04 61 02/11 61 02/18 24 02/25 51 2011-March 03/04 16 03/11 14 03/18 27 03/25 101 2011-April 04/01 64 04/08 68 04/15 79 04/22 128 04/29 54 2011-May 05/06 72 05/13 102 05/20 73 05/27 63 2011-June 06/03 98 06/10 86 06/17 72 06/24 53 2011-July 07/01 53 07/08 73 07/15 114 07/22 80 07/29 108 2011-August 08/05 75 08/12 18 08/19 18 08/26 39 2011-September 09/02 15 09/09 4 09/16 14 09/23 55 09/30 7 2011-October 10/07 86 10/14 48 10/21 45 10/28 32 2011-November 11/04 116 11/11 58 11/18 49 11/25 79 2011-December 12/02 29 12/09 10 12/16 9 12/23 39 12/30 36 2012-January 01/06 7 01/13 1 01/20 4 01/27 7 2012-February 02/03 5 02/10 87 02/17 28 02/24 52 2012-March 03/02 34 03/09 4 03/16 3 03/23 7 03/30 55 2012-April 04/06 11 04/13 98 04/20 11 04/27 10 2012-May 05/04 5 05/11 36 05/18 93 05/25 56 2012-June 06/01 3 06/08 57 06/15 4 06/22 4 06/29 0 2012-July 07/06 3 07/13 2 07/20 52 07/27 59 2012-August 08/03 33 08/10 57 08/17 33 08/24 105 08/31 95

178 JP-5, JP-8, AND JET A FUELS
5. PRODUCTION, IMPORT/EXPORT, USE, AND DISPOSAL
Table 5-5. Weekly U.S. Imports of Kerosene-Type Jet Fuel (Thousand Barrels per Day) Since 2000
Week 1 Week 2 Week 3 Week 4 Week 5 End End End End End
Year-month date Value date Value date Value date Value date Value 2012-September 09/07 73 09/14 142 09/21 35 09/28 113 2012-October 10/05 16 10/12 111 10/19 153 10/26 136 2012-November 11/02 16 11/09 51 11/16 5 11/23 25 11/30 26 2012-December 12/07 53 12/14 25 12/21 0 12/28 0 2013-January 01/04 63 01/11 0 01/18 2 01/25 96 2013-February 02/01 54 02/08 47 02/15 45 02/22 77 2013-March 03/01 23 03/08 34 03/15 44 03/22 4 03/29 0 2013-April 04/05 0 04/12 83 04/19 37 04/26 0 2013-May 05/03 21 05/10 35 05/17 35 05/24 46 05/31 136 2013-June 06/07 76 06/14 70 06/21 108 06/28 73 2013-July 07/05 47 07/12 99 07/19 46 07/26 6 2013-August 08/02 63 08/09 193 08/16 55 08/23 117 08/30 148 2013-September 09/06 85 09/13 67 09/20 96 09/27 73 2013-October 10/04 45 10/11 50 10/18 52 10/25 80 2013-November 11/01 53 11/08 55 11/15 77 11/22 123 11/29 18 2013-December 12/06 25 12/13 63 12/20 46 12/27 31 2014-January 01/03 61 01/10 48 01/17 59 01/24 77 01/31 16 2014-February 02/07 98 02/14 94 02/21 58 02/28 10 2014-March 03/07 84 03/14 8 03/21 96 03/28 107 2014-April 04/04 129 04/11 218 04/18 130 04/25 15 2014-May 05/02 124 05/09 73 05/16 78 05/23 137 05/30 34 2014-June 06/06 92 06/13 28 06/20 196 06/27 154 2014-July 07/04 103 07/11 71 07/18 122
aData obtained from EIA (2014b).

179 JP-5, JP-8, AND JET A FUELS
5. PRODUCTION, IMPORT/EXPORT, USE, AND DISPOSAL
Table 5-6. Monthly U.S. Exports of Kerosene-Type Jet Fuel (Thousand Barrels per Month) Since 1981a
Year January February March April May June July August September October November December 1981 28 21 10 18 16 12 19 22 20 14 23 222 1982 255 245 80 44 27 38 32 32 41 35 269 692 1983 272 223 27 17 40 21 37 193 270 24 373 458 1984 318 68 21 148 22 191 306 52 27 158 329 738 1985 79 624 182 149 147 102 106 660 133 773 848 559 1986 1,188 429 333 371 428 184 300 138 420 778 668 626 1987 1,404 565 214 121 117 146 139 74 1,029 1,086 1,336 2,287 1988 2,524 974 1,624 392 119 463 107 440 265 54 271 2,470 1989 2,297 566 19 477 36 35 287 467 1,018 849 1,183 1,309 1990 668 1,393 515 331 238 207 302 927 1,349 2,246 4,218 1,854 1991 2,265 4,393 1,197 758 1,047 391 840 326 295 1,342 137 1,273 1992 1,375 1,168 194 368 202 583 1,623 500 333 1,266 1,125 3,439 1993 2,976 451 2,575 1,833 1,460 1,035 1,799 1,017 414 396 765 1,063 1994 561 722 445 71 282 305 340 311 784 541 524 1,002 1995 766 545 528 138 221 311 572 535 587 1,774 387 1,940 1996 3,443 1,929 1,543 333 414 325 837 1,040 1,525 821 1,340 3,418 1997 2,407 635 342 621 275 1,146 1,004 819 471 1,214 1,325 2,429 1998 1,137 710 899 957 702 737 796 225 751 663 722 506 1999 785 225 697 736 997 792 1,073 246 995 800 1,825 1,585 2000 408 503 1,030 1,111 1,095 798 641 583 1,008 1,289 1,902 1,221 2001 839 437 1,262 506 513 544 722 743 620 966 1,917 1,426 2002 264 1,130 62 38 94 29 67 50 424 39 351 447 2003 1,125 519 1,067 1,018 603 200 373 214 588 883 295 549 2004 678 556 1,211 571 916 850 318 1,600 2,314 1,566 1,641 2,579 2005 878 1,875 2,235 2,927 3,575 2,040 1,428 1,706 469 351 1,068 651 2006 742 712 1,105 1,263 1,005 1,005 1,050 1,518 1,789 1,724 1,481 1,477 2007 1,213 870 1,631 1,024 602 754 1,641 826 1,257 1,017 2,750 1,427 2008 1,836 1,956 1,984 959 2,346 2,590 2,899 1,910 860 1,876 1,547 1,627 2009 2,379 1,171 1,899 1,981 2,656 1,270 1,505 1,688 1,901 2,949 2,226 3,605 2010 3,514 1,852 2,173 2,281 2,441 1,701 2,539 2,630 2,426 1,973 3,082 4,141 2011 3,906 2,786 2,715 3,059 1,733 2,221 3,390 2,806 3,089 2,419 3,173 4,027 2012 3,562 3,650 3,090 2,697 3,864 4,562 4,390 3,410 3,920 4,637 4,801 5,874 2013 5,014 3,188 4,093 4,129 4,150 5,407 4,938 6,020 4,217 4,304 6,419 6,262 2014 4,268 4,058 4,322 3,414
aData obtained from EIA (2014c).

180 JP-5, JP-8, AND JET A FUELS
5. PRODUCTION, IMPORT/EXPORT, USE, AND DISPOSAL
Jet A and Jet A-1, which essentially only differ in freeze point. The composition of these two fuels is
very similar, as can be seen in fuel property collections such as the World Fuel Sampling Program
(Hadaller and Johnson 2006) and the annual Petroleum Quality Information Service (PQIS) reports by
DLA-Energy. For example, in 2012, the PQIS database reported on thousands of samples of Jet A, JP-8,
and Jet A-1. The weighted mean freeze points of Jet A/JP-8/Jet A-1 were -49.8, -51.3, and -52.7°C,
respectively—much smaller variations than those present within each class of itself. The weighted mean
aromatic content of the three fuels were 17.3, 17.1, and 17.6 vol%, respectively—again, much smaller
variations than seen within each fuel. Thus, for all intents and purposes, Jet A, JP-8, F-24, and Jet A-1
can be treated as the same fuel in terms of composition and fuel properties, aside from the presence of the
military additive package in JP-8 and F-24.
5.4 DISPOSAL
Vapors generated in tank truck loading of jet fuels can be disposed of by the installation of a vapor
recovery system (NIOSH 1989). Runoff of jet fuels from loading and unloading aircraft operations can
be separated by an on-site oil/water separation system.
Several methods have been investigated for the disposal of jet fuels spilled onto soil from normal aircraft
operations or from accidental spills. One method, in situ soil venting, involves using vacuum blowers to
pull large amounts of air through soil contaminated with jet fuels (Elliot and DePaoli 1990). The vacuum
pulls out the soil gas, and the jet fuel contaminants volatilize as a result of disrupted equilibrium.
Incineration of free-product extracted from contaminated media is another method of disposal proposed
for soils and water contaminated with jet fuels (OHM/TADS 1985). Incineration of soils contaminated
with jet fuels has also been investigated (OHM/TADS 1985). Other methods include absorption (straw,
polyurethane foam, activated carbon, and peat have been used as absorbents), gelling agents, combustion
promoters, dispersants, and mechanical systems (OHM/TADS 1985). Biodegradation has also been
suggested as a means of disposal for spills onto soil (OHM/TADS 1985). Hydrocarbon-degrading
bacteria have been shown to degrade petroleum products into smaller units and eventually into
nonseparable particles (Butt et al. 1988). Soil contaminated with jet fuel no. 1 was found to have a
growth response of 106 colony-forming units per mL in 7 out of 21 types of bacteria isolated for sample
study (Butt et al. 1988). For more information on biodegradation, refer to Chapter 5.
Wastes containing Jet A, JP-5, and JP-8 are considered hazardous if they meet certain criteria specified by
law. Hazardous wastes are subject to the handling, transport, treatment, storage, and disposal regulations

181 JP-5, JP-8, AND JET A FUELS
5. PRODUCTION, IMPORT/EXPORT, USE, AND DISPOSAL
as promulgated under the Resource Conservation and Recovery Act (IRPTC 1985). Regulations
governing the treatment and disposal of wastes containing JP-5, JP-8, and Jet A fuels are detailed in
Chapter 7.