5. LIQUID ASSETS: Our Water Resources
34
LPBF/UNO 5. LIQUID ASSETS: Our Water Resources
Transcript of 5. LIQUID ASSETS: Our Water Resources

LPBF/UNO
5. LIQUID ASSETS: Our Water Resources

LPBF/UNO
Ch
apte
r
???W HY IS WATER NECESSARY F O R LIFE?
DO I USE TOO M U C H WATER?
HO W C A N I PREVENT WATER POLLUTION?
Essential Questions:
W HAT IS THE SOURCE OF O U R LOCALWATER SUPPLY?
W HY DO W E NEED T O CONSERVE
WATER?
5
HO W DO I M E A S U R E WATER QUALITY?
SHOULD I DRINK BOTTLED WATER?

LIQUID ASSETS:Our Water Resources
OBJECTIVES:• To understand the relationships among water quality, water pollution, personal
lifestyle, and the ecological health of the Lake Pontchartrain Basin.
• To develop an awareness of water resources and water quality.
• To understand the differences between point and nonpoint source pollution.
MULTIPLE INTELLIGENCES LEARNING ACTIVITIES:
Verbal/Linguistic: Write reflective journal entries on the impact of your personal lifestyles on the Lake Pontchartrain Basin. Write an essay or a poem about the water cycle.
Logical/Mathematical: Calculate the amount of water used by your families per day and complete a chart on agricultural runoff.
Visual/Spatial: Design posters of ways in which water is wasted and conserved.
Construct signs for the “Water Cycle Walk”.
Bodily/Kinesthetic & Step through the paces of the water cycle to musical Musical/Rhythmic: accompaniment, stopping to explain the processes and
products along the way. Make a “thunderstorm”.
Interpersonal: Brainstorm lists of ways in which water is wasted or conserved.
Construct lists of things that affect water quality in the Lake Pontchartrain Basin.
Intrapersonal: Write reflective journal entries on your personal impact on water quality in the Lake Pontchartrain Basin.
Develop your own mini action plan.
Naturalist: Perform water quality testing; use water quality testing kits and nets; collect and analyze water quality data; make observations and inferences based on water quality testing; participate in avolunteer litter cleanup. 105LPBF/UNO

Water is the most important substance on Earth. It’s thebasis of life on our planet. It cycles through Earth’s various sys-tems just like blood cycles through our bodies.
Do you remember how the water cycle works? The sun’s energy causes waterto evaporate from the earth’s surface. This process forms water vapor in theatmosphere. As water vapor rises, it cools and becomes a liquid again. This iscalled condensation. The condensed liquid returns to the earth as precipitation.If you’ve ever watched those huge cumulonimbus clouds gather over LakePontchartrain on a summer day, you probably weren’t surprised by the after-noon showers that followed!
Rain showers like that are commonin a large watershed like the LakePontchartrain Basin.
WHAT HAPPENS
TO ALL THAT
PRECIPITATION?Some of it is used by plantsand animals in the Basin.....
Some soaks into the groundand becomes part of the watertable or an aquifer.....
Some enters lakes, streams,and rivers as runoff.....
Evaporation occurs again ~and the cycle is complete.
106 LPBF/UNO
SUN
Condensation
Precipitation
RunOffInfiltration
Evaporation
Groundwater
The water cycle, then, recycles Earth’swater supply over and over.
Rain showers like that are common in a large watershed like the Lake Pontchartrain Basin.

107
To demonstrate the water cycle, each person in your group orclass can play the role of a water molecule passing through thecycle. Try this activity:
WaLkOn poster or butcher paper, make a sign for each stage of the water cycle: sun,cloud, precipitation (rain, hail, snow, sleet), surface water (lake, river, stream), andgroundwater. Make signs to represent water use by plants and animals in transpiration also. Place each in an open space in the center of theclassroom (see diagram next page).
On poster or butcher paper, make directional arrows to represent each process ofthe water cycle: evaporation, condensation, runoff, infiltration, andtranspiration (one each for plant and animal use). Place each arrow in its appropriate spot on the floor between two water cycle stages (see diagram).
Have students represent water molecules (perhaps wearing ballcaps with the brimtilted up, labeled H20) and have them do the “Water Cycle Walk” in small groups.
Play a tape of music with sounds of a stream, thunderstorm or ocean. After 10-15seconds, stop the music as a signal for students to stand still. Each student caneither explain the stage of the water cycle on which he/she is standing, or canrespond to questions about the water cycle.
Repeat with remaining groups of students.
seesee diagram
LPBF/UNO
1.
2.
3.
4.
5.

CONDENSATION
PRECIPITATION
EVAPORATIO
N
INFILTRATIONTR
ANSP
IRAT
ION
plan
ts
TRAN
SPIR
ATIO
Nan
imal
s
RUNOFF
Water Cycle Walk
108 LPBF/UNO
LPBF/UNO
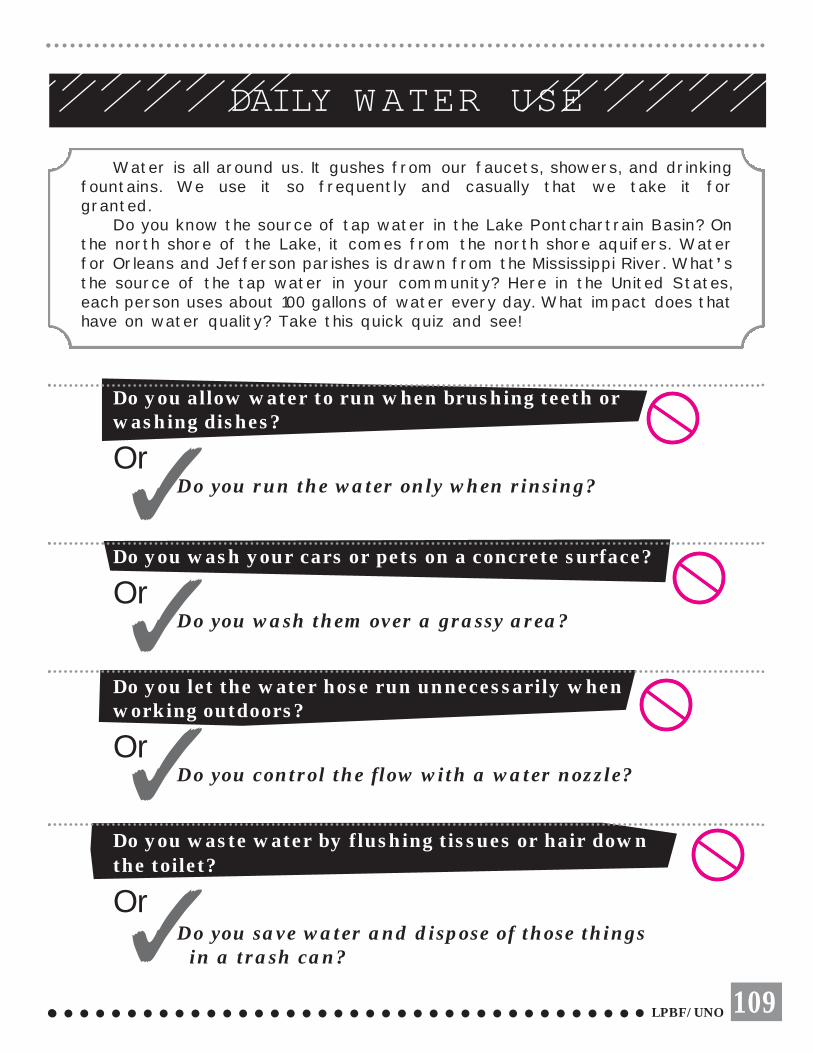
DAILY WATER USE
Water is all around us. It gushes from our faucets, showers, and drinkingfountains. We use it so frequently and casually that we take it for granted.
Do you know the source of tap water in the Lake Pontchartrain Basin? Onthe north shore of the Lake, it comes from the north shore aquifers. Waterfor Orleans and Jefferson parishes is drawn from the Mississippi River. What’sthe source of the tap water in your community? Here in the United States,each person uses about 100 gallons of water every day. What impact does thathave on water quality? Take this quick quiz and see!
Do you allow water to run when brushing teeth or washing dishes?
OrDo you run the water only when rinsing?
Do you wash your cars or pets on a concrete surface?
OrDo you wash them over a grassy area?
Do you let the water hose run unnecessarily when working outdoors?
OrDo you control the flow with a water nozzle?
Do you waste water by flushing tissues or hair down the toilet?
OrDo you save water and dispose of those things
in a trash can?
109
✓
✓
✓
✓
Based on these examples, try to estimate your family’s water use for a day:
DAILY WATER USE CHARTWATER USE AVERAGE AMOUNT USED FAMILY WATER USE
drinking water 6-8 ounces per glass
making beverages 32 ounces per quart
flushing toilets 3-5 gallons per flush
taking a shower 5 gallons per minute
taking a bath 35-40 gallons
washing dishes 10-15 gallons
doing laundry 19-45 gallons
washing hands 32 ounces
brushing teeth 1 gallon
washing car 20-30 gallons
watering lawn 240 gallons/half hour
How do you think you and your family measure up? Let’s check!
To calculate the amount of water your family uses daily, weekly, monthly, and annually,complete one of the following activities:
110 LPBF/UNO
1. The simplest way to measure water use is to readyour family’s water meter at the start and end of a24-hour period. Subtract the first reading you takefrom the reading made 24 hours later. That’s howmuch water your family uses in one day. Multiply thenumber of gallons used in one day times seven to findout how much water your family will use in a week.How would you predict your family’s water use for amonth? a year?
2 . If reading the water meter is not possible, measureyour family’s water use by the following method.The chart provided above will be useful.
Keep track of each glass of water used, whether the person drank or discarded it. Count 6-8 ounces of water per glass.
Record the amount of water used to make coffee, tea, juice, or drink mixes. Each quart uses 32 ounces of water.
Record the amount of water used for cooking, if any.When possible, measure it before use.
Keep track of the number of times household toilets are flushed. Each flush uses 3-5 gallons of water.
Keep track of water use during baths and showers. Each shower requires about 5 gallons of water per minute. A tub bath uses about 35 gallons of water.
Record the amount of water used for washing dishes.Washing dishes by hand requires about 10 gallons of water, while a dishwasher uses about 15 gallons.
Record the amount of water used for laundry. Washing clothes on the low cycle uses about 19 gallons of water; the high cycle, 45 gallons.
Keep track of any other water uses, such as washing cars or pets or watering the lawn.
Now total all the figures and determineyour family’s water use for a day, a week, amonth, and a year. Amazing, isn’t it?
■
■
■
■
■
■
■
■
? ? ? ? ? ? ? ? ? ? ? ? ? ? ? ? ? ?

LPBF/UNO 111
? ? ? ? ? ? ? ? ? ? ? ? ? ? ? ? ? ? ? ?
HO W DO THE CHOICES W E M A K E, GOOD AND BAD, AFFECT O U R WATER QUALITY?
HO W C A N YOU IMPROVE THE CHOICES
YOU M A K E CONCERNING YOUR USE OF O U RPRECIOUS WATER RESOURCES?
Put your heads together as a class and brainstorm:
(a) List ways that water is wasted.
(b) List ways to conserve water.
Make posters to share your knowledge with others.
No matter where we live,the water that meets all
our needs for drinking andbathing and recreation comesfrom rivers, lakes, streams,or underground aquifers.
WHICH BODIES OF WATER IN THE LAKE PONTCHARTRAINBASIN M E E T YOUR WATER NEEDS?
H O W DO YOU THINK YOUR USE OF WATER AFFECTSWATER QUALITY IN THE BASIN?
? ? ? ? ? ? ? ? ? ? ? ? ? ? ? ? ? ? ? ?

? ? ? ? ? ? ? ? ? ? ? ? ? ? ? ? ? ? ?
?
?
?
?
?
?
?
?
WATER QUALITY
How do we measure water quality?
What is clean water?
What is polluted water?
In order to protect human health and aquatic life, governmentagencies set water quality standards that are measured in milligrams per liter (mg/L) — or parts per million (ppm). Some pollutants are measured in parts per thousand (ppt), while others are measured in parts per billion (ppb).
These concepts can be difficult to grasp, so consider such minute amounts of pollutants
in more familiar terms:
unit 1 ppt 1 ppm 1 ppb
LENGTH 1 inch/28 yards 1 inch/16 miles 1 in/16,000 mi
TIME 1 sec/17 min 1 minute/2 years 1 second/32 years
MONEY 1 cent/$10 1 cent/$10,000 1 cent/$10,000,000
This is how the water quality measurements areexpressed mathematically:
ppt ppm ppb
FRACTION 1/1000 1/1,000,000 1/1,000,000,000
DECIMAL .001 .000001 .000000001
There are many outstanding activities that you can do to explore water quality. You may even choose to take on water quality issues in theLake Pontchartrain Basin as an action plan. Refer to Pages 119-121.
112 LPBF/UNO

Factors that affect water quality generally fall into three major categories: biological, chemical, and physical. These factors must meetwater quality standards set by the state of Louisiana. Here is a chart ofthe major water quality factors found in the Lake Pontchartrain Basin.
LAKE PONTCHARTRAIN BASIN WATER QUALITY FACTORS
FACTOR TYPE SOURCE(S) PROBLEM
fecal coliform biological human sewage; possible presence ofbacteria livestock pathogenic (disease-
wastes causing) organisms
dissolved oxygen chemical air; low levels can kill(DO) aquatic plants aquatic organisms
nitrogen and chemical fertilizers and excessive algae growthphosphorus detergents can lead to low DO and
from lawns and eutrophicationurban runoff
zinc, arsenic, chemical landfills; genetic mutations orlead, mercury, industrial death in fish andcadmium, nickel discharges; wildlife; human health
runoff threats
salt chemical saltwater kills freshwaterintrusion from species of plants andthe Gulf of animalsMexico
mud, sand, other physical erosion and reduces photosynthesissolid particles runoff from in aquatic vegetation;(turbidity) development; interferes with
agriculture respiration in aquaticanimals
These are only some of the factorsthat affect the Basin’s water quality.
Which others can you investigate?
Which factors are problems in your area? 113LPBF/UNO
? ? ? ? ? ? ? ? ? ? ? ? ? ? ? ? ? ?

????
????
Do you ever wonder why you can’t swim in LakePontchartrain and other bodies of water in the Basin?
The Basin covers a large area, so there are many natural and human activities that depend on our waterresources —- cities and towns, farms and ranches, busi-ness and industry, and recreation.
Using the SOURCES column of the Lake Pontchartrain Basin WaterQuality Factors chart (Page 113), work with a partner and brainstorma list of places and things in the Lake Pontchartrain Basin that use waterand affect its quality. You might want to refer to a map of the area forsome ideas. Compare and contrast your list with the rest of the class.
How did your list match up with those of your classmates?
As you can see, water use in the Basin is extensive, so water qual-ity is always a concern. If a family of four uses about 300 gallons ofwater in their home each day, just think of how many additional gal-lons are needed for growing food and for industrial use.
We must wrestle with ways to make the most efficientuse of water, our liquid asset. We must gain an awarenessfor conservation of water and develop a willingness to doall we can to conserve it.
? ? ? ? ? ? ? ? ? ? ? ? ? ? ? ? ? ? ? ?
? ? ? ? ? ? ? ? ? ? ? ? ? ? ? ? ? ? ? ?
114 LPBF/UNO

This diagram illustrates some of the primary sources of water pollution.
H02POLLUTION
POINT SOURCE
INDIRECT DISCHARGE INTO HH200
NONPOINT SOURCE
DIRECT DISCHARGE INTO HH200
“Everything is connected to everything else.”
&&&&“Nothing goes away.”
By now you are probably realizing the truth of these two basicenvironmental tenets, especially when it comes to water pollution.
Simply put, water quality in the Lake Pontchartrain Basin is affected by everything and everybody!
Refer to the Lake Pontchartrain Basin Water Pollution Map in Appendix A.
Water pollution comes from either a POINT or a NONPOINT SOURCE.
Let’s look at some similarities and differences between the two types.
115
2
LPBF/UNO
DUMPINGTOXINS
INDUSTRIALFACILITIES
SEWAGETREATMENTPLANTS
URBANRUNOFF
AGRICULTURALRUNOFF

Point source pollution because it enters the water directly, can be easily traced from sources such as factories and chemical plants. But nonpoint source pollution, harder to trace and totreat, can cause long-term damage before the problem is handled. It can come frommany different sources and travel long distances through a watershed before it isnoticed.
Nonpoint source pollution provides a greater chance for chemicals to mix and react together. This isknown as the synergistic effect. A combination of two or more contaminantscan be even more harmful than the original pollutants—-and harder to treat.
In fact, nonpoint source pollution is the major cause of water pollution in the Lake Pontchartrain Basin.
Do you realize that most nonpoint source pollution comes from runoff?Rainwater or wastewater carries various pollutants along as it flows into our lakes,streams, and rivers. Urban runoff from the southshore of Lake Pontchartrain and agri-cultural/sewage runoff from the northshore are causing serious water pollution prob-lems in the waterways of the Basin.
Here is a chart to help you understand some of the key nonpoint sources:
NONPOINT SOURCE POLLUTION CHART: URBAN RUNOFFPOLLUTANT SOURCES PROBLEMSsediment construction; tree removal increases turbidity;
affects aquatic organisms;can contain toxins
phosphates/ fertilizers; detergents; algae blooms; eutrophicationnitrates organic debris
toxins; heavy metals; pesticides; disrupt food chain;carcinogens herbicides carcinogenic; cause fish kills
organic debris animal wastes; raw sewage; deplete oxygen; disrupt food grass/leaves chain; cause fish kills
petroleum motor oil; gasoline; disrupt food chain;products axle grease deplete oxygen; harms birds &
mammals
pathogens animal wastes; health hazardsraw sewage
litter plastic debris; unsightly;tires; others harms organisms
UR
BA
N R
UN
OF
F
(chart adapted from Urban Stormwater Runoff: How to Stem the Toxic Tide)116 LPBF/UNO
Some of the same pollutants in urban runoff can also be found in agricultural runoff. Which ones are they? How do they differ?
Are there any pollutants unique to agricultural runoff?
COMPLETE THE FOLLOWING CHART:
NONPOINT SOURCE POLLUTION CHART:AGRICULTURAL RUNOFF
POLLUTANT SOURCES PROBLEMS
After a rain, all these pollutants — urban and agricultural — flow or arepumped into a lake, bayou, or river in the Lake Pontchartrain Basin. While wecannot clean up all forms of nonpoint source pollution as individuals, it is theresponsibility of each of us to do what we can to help stem this toxic tideknown as runoff.
PROJECT F.U.R. (Fight Urban Runoff), started by a group of students atHoly Cross School in New Orleans in 1990, has been battling this seri-ous problem. They aim to educate the public about the causes of urbanrunoff in the Basin, so that individuals will be able to take appropriateaction. Project F. U. R. is featured in the video Pontchartrain Stories.Following is a profile of this award-winning project.
117LPBF/UNO
AGRIC
ULTURAL R
UNOFF

Project F.U.R.(Fight Urban Runoff)
Holy Cross School New Orleans, LA
PROJECT F.U.R. (Fight Urban Runoff) is an ongoing environmental service project ofstudents at Holy Cross School since 1990. PROJECT F.U.R. raises public awareness about aused oil recycling program that benefits the Lake Pontchartrain Basin and the nation throughenergy conservation and the reduction of hazardous waste. If used motor oil is not recycled andis discarded improperly, it can present a serious hazard to our environment. Parish recyclingcenters, service stations and quick-change oil franchises are serving as collection centers. Theoil collected at these sites is reprocessed and prepared for future marketing. With the donationof a “Crusher 1” used motor oil filter compactor, PROJECT F.U.R. members are able to collectused motor oil filters and recycle them. Thus, the filter and the used oil inside are reclaimedand recycled, preventing them from posing a hazard to the Lake Pontchartrain Basin ecosys-tem.
PROJECT F.U.R.’s speaker program focuses public attention on urban runoff and itseffects on Lake Pontchartrain. Flyers and brochures explain what residents can do to helpstem this toxic tide. Knowledge without action is sterile. Other civic action projects by PRO-JECT F.U.R. include the “STENCIL - A - CANAL” project. A network of high school studentsand teachers joins forces with civic organizations and local residents to stencil the logo “DumpNo Waste—Drains to Lake” on storm drain covers throughout the area. This serves to remindresidents that hazardous materials dumped in storm drains have a negative impact on theLake Pontchartrain ecosystem.
PROJECT F.U.R. conducts water quality testing in the Lake Pontchartrain Basin at sev-eral sites. Data is collected and evaluated for evidence of a decrease in runoff pollutants, allow-ing PROJECT F.U.R. students to fully participate in the scientific process. In addition, week-ly water testing of the Industrial Canal is contributing to a comparative research of drainagecanals in New Orleans, currently under assessment by the Lake Pontchartrain BasinFoundation.
“Wetlands Ecology: A Service-Learning Project” is the latest phase of PROJECT F.U.R.Student team leaders learn wetlands ecology firsthand by participating in field camps atselected wetlands sites and participate in volunteer projects to restore wetlands. They serve aspeer instructors to other students in environmental science classes on a series of field trips.
A healthy lake is a major recreational and economic asset to New Orleans and the sur-rounding parishes. Achieving that goal through public education and civic action is the intentof PROJECT F.U.R. The dimensions of the challenge are enormous, but with its efforts sup-ported by the Lake Pontchartrain Basin Foundation and the Louisiana Department ofEnvironmental Quality, PROJECT F.U.R. has been very successful. While rendering signifi-cant service to the community, these students are experiencing the scientific, social, and polit-ical components of environmental issues.
For their efforts, PROJECT F.U.R. has been the subject of magazine and television cover-age and has won local, state, and national awards, including the President’s Environmental
Youth Award for EPA Region 6.118 LPBF/UNO

While remarkable strides have been made to reduce water pollution inthe Lake Pontchartrain Basin, there is still much work to be done — andit will take the efforts of all of us. Solving the Basin’s pollution problemswill not be easy, but you’ll find that there is something you can do.
In this next activity, you will design a project of your own. Here are someproposed solutions to current problems. Research one and develop a mini actionplan to get you started.
PPooll lluutt iioonn PPrroobblleemmss PPrrooppoosseedd SSoolluutt iioonnss
■ DUMPING USED MOTOR OIL ……………stencil storm drains; recycle……………………………………………………used motor oil and filters
■ TRASH AND LITTER ………………………litter clean-up campaigns
■ HABITAT LOSS ………………………………plant aquatic grass beds
■ DEFORESTATION ……………………………plant cypress trees
■ SHORELINE EROSION ……………………plant trees and other vegetation
MINI ACTION PLAN:Lake Pontchartrain Basin Pollution Solution
THINKING AHEAD
Which area of the Lake Pontchartrain Basin do you want to target? e.g., north shore, south shore, coastal marshes
Which Lake Pontchartrain Basin pollution problem would you like to help solve?
What questions do you have about that pollution problem?
Where can you get information about that pollution problem?
Which people in your school or community can help you understand thenature of the pollution problem? Which resources are available to you?
Which obstacles or potential problems might affect your plan?
Brainstorm a list of possible solutions to the problem. Ask others for their ideas about your proposed solutions.
Can you do the project alone or will you need volunteer help?
Make any necessary changes to your plan.
119LPBF/UNO
1.
2.
3.
4.
5.
6.
7.
8.9.
GETTING DOWN TO WORK
The pollution problem I most want to solve is: _______________________________________.
_______________________________________________________________________________________
This pollution project is needed because: _____________________________________________.
My proposed solutions include: _______________________________________________________
______________________________________________________________________________________.
Steps I will take to tackle the pollution problem are: _________________________________
_______________________________________________________________________________________
______________________________________________________________________________________.
I will recruit volunteer help from: ____________________________________________________
______________________________________________________________________________________.
I will need to get permission for my project from these people and/or agencies:
______________________________________________________________________________________.
______________________________________________________________________________________.
The Lake Pontchartrain Basin will benefit from my project because: _________________
_______________________________________________________________________________________
_______________________________________________________________________________________
______________________________________________________________________________________.
JOB CHART
The following jobs are to be completed on or before the due date by the person(s) assigned:
JOB TARGET DATE PERSON IN CHARGE
120 LPBF/UNO

MATERIALS AND SUPPLIES
I WILL NEED THE FOLLOWING ITEMS T O COMPLETE M Y PROJECT:
FINANCES
IF I NEED T O FINANCE M Y PROJECT, I WILL EARN O R RAISE FUNDS BY:
PUBLICITY
I WILL PUBLICIZE M Y EFFORTS THROUGH:
121LPBF/UNO
JOURNALING“An environmental journal is one of the best ways to learn issues and keep up with current topics.”
– Darren Westfall, student
“It helps to write down your point of view to form where you stand on an issue.”
– Mixalis Petikas, student
“I learned about important topics that should be taught to everyone.” – T.J. Willis, student
Journal writing is an effective way for students
To reflect on information they are learning
To express their thoughts and feelings on an issue
To develop and enhance their writing skills
The purpose of this lesson is to offer ways to proceed from personal journal writing to critical journal writing as students examine their present or future placein society.
Traditional journal entries encompass questions such as “What do you knowabout the topic?” and “What do you think or feel about the topic?” Critical journalwriting can require the student to proceed from thoughts or feelings on an issue toformulating a plan of action. An appropriate question to ask would be, “What canyou do about the topic?” Students will still be able to write about their feelings andexperiences, but their expression will be thoughtful and focused.
Examples of questions for critical journal entries include:■ How do the choices I make, good and bad, affect our water quality?
■ How can I improve the choices I make concerning my use of our precious water resources?
■ How does my personal use of water affect water quality in the Lake Pontchartrain Basin?
■ If I could swim or boat along the shores of waterways in the Lake Pontchartrain Basin, what kinds of pollution would I find?
■ How do those pollutants affect living organisms in the Basin?122 LPBF/UNO

You are a dairy cow in a herd of 300. Theamount of waste generated by the herd andentering a nearby stream distresses you. As arepresentative of the herd, what would YOU say to the dairy farmer?
You work at Bun ‘n’ Burger, a local fast foodrestaurant. You found out that the grease trap isbeing emptied by a company that dumps thegrease into the LaBranche Wetlands bordering LakePontchartrain. What would you do?
You are a tomato plant on a large
farm in a rural parish. You’re worriedthat the pesticides and fertilizers run-
ning off the land will cause fish kills in a nearby water-way. Here comes the farmer again, ready to spray.You tell him, ““SSTTOOPP !! PPPP_____________________________________.”(Finish the story.)
A traditional journal entry, once written, can be a springboard for criticaljournal writing. Have students take an entry, expand upon it, analyze it, anduse it as a basis for a formal essay.
Some strategies for this type of journal entry/essay combination include:Developing one’s perspective; formulating/exploring beliefs, theories, arguments
Assessing consequences of actions
Proposing solutions, citing similarities and differences in thoughts or feelings
Analyzing actions or examining policies
This can even be accomplished in small groups, with some students responsible forwriting the essay and other students responsible for making a class presentation.
123LPBF/UNO
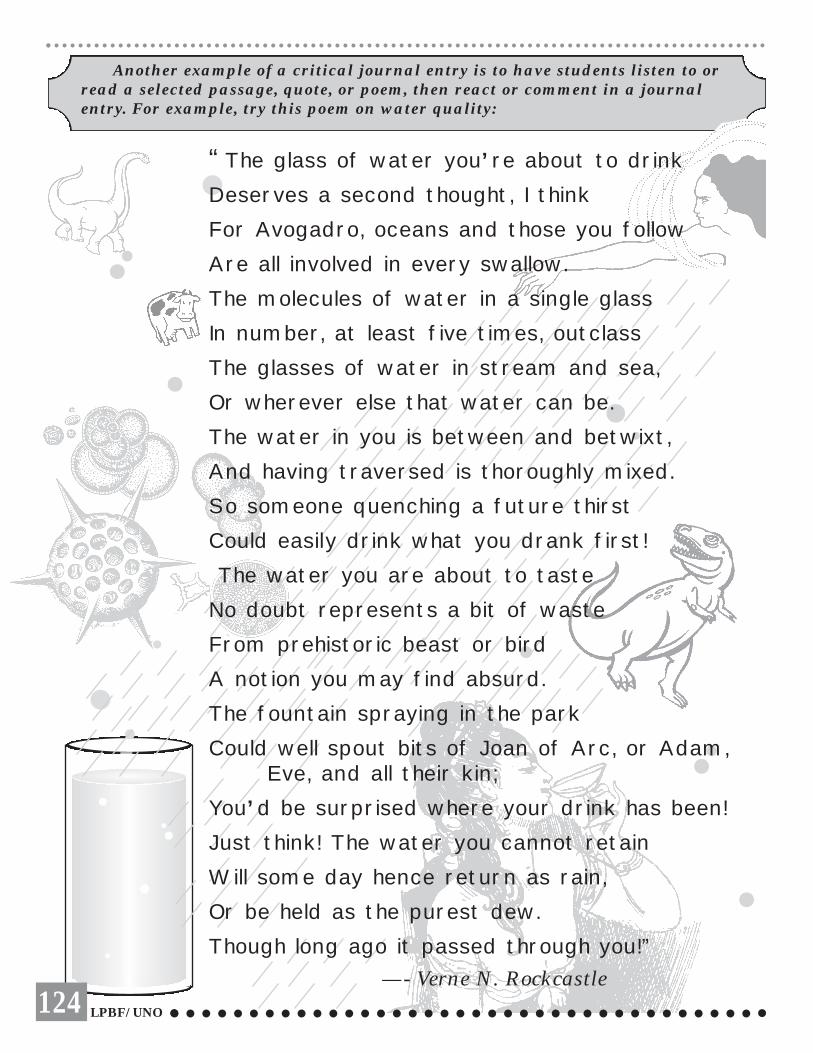
Another example of a critical journal entry is to have students listen to orread a selected passage, quote, or poem, then react or comment in a journalentry. For example, try this poem on water quality:
“The glass of water you’re about to drink
Deserves a second thought, I think
For Avogadro, oceans and those you follow
Are all involved in every swallow.
The molecules of water in a single glass
In number, at least five times, outclass
The glasses of water in stream and sea,
Or wherever else that water can be.
The water in you is between and betwixt,
And having traversed is thoroughly mixed.
So someone quenching a future thirst
Could easily drink what you drank first!
The water you are about to taste
No doubt represents a bit of waste
From prehistoric beast or bird
A notion you may find absurd.
The fountain spraying in the park
Could well spout bits of Joan of Arc, or Adam, Eve, and all their kin;
You’d be surprised where your drink has been!
Just think! The water you cannot retain
Will some day hence return as rain,
Or be held as the purest dew.
Though long ago it passed through you!”
—- Verne N. Rockcastle124 LPBF/UNO

?
125LPBF/UNO
???
Write a critical journal entry on the poem prompted by such questions as:
What do you think or feel about the poetry selec-tion?
Why do you feel that way?
What is the author trying to tell you about water quality?
Why do we have a responsibility to not waste or pollute water resources?
You are a molecule of water who has spent thelast 10,000 years making your way through thewater cycle. Trace your family tree. Where doesyour genealogical search take you?
Write the dialogue you have with three other water drops, discussing your travels throughspace and time.
Write an essay based on your responses, or write a poem of your own!
1.
2.
3.
4.
5.
6.
7.

Objectives:Perform simple water monitoring experiments.
Collect and analyze water quality data.
Make observations and inferences about water quality.
Communicate collected findings about water quality.
Teaching Materials: Water quality testing materials and equipment per student team:
Water testing kit
Secchi disk
Distilled water
Copies of handout “What Do We Test?” (Page 128)
Copies of handout “Factors Affecting Lake Pontchartrain” (Page 129)
Copies of handout “How Do We Organize Data?” (Pages 130-133)
Copies of handout “Monitoring Water Quality” (Page 134)
Copies of handout “Water Quality Monitoring Worksheet” (Pages 135-136)
Getting Ready:Obtain water quality testing materials and equipment far enough in advance to become familiar with the techniques and procedures.
Familiarize yourself with a local water testing site, if necessary.
Prepare for field trip.
Discuss water quality parameters with the class.
Review mathematics skills necessary for the lesson.
Demonstrate use of water quality testing materials and equipment to students.
1.
2.
3.
4.
5.
6.
❶
❷
❸
❹
ACTIVITY: How’s the Water?
Water Quality Monitoring and Reporting
126 LPBF/UNO

127LPBF/UNO
Assessment Procedures:
PointValue Use of Materials Knowledge Team Skills Problem Solving
4
3
2
1
Makes outstandinguse of testing materials and
resources.
Makes good use oftesting materialsand resources.
Makes an effort to use testing materials and
resources.
Makes little/no useof OR misuses
testing materialsand resources.
Shows lack ofunderstanding of
water quality issues.
Team works uncooperatively attimes; some teammembers don’t
contribute.
Shows partialunderstanding of
water quality issues.
Shows adequateunderstanding of
water quality issues.
Team works cooperatively;
members contributenearly equally
to group.
Team works cooperatively attimes; member
contributions areunequal.
Displays adequate
problem-solvingskills.
Displays weak problem-solving
skills.
Displays a lack of problem-solving
skills.
Shows completeunderstanding of
water quality issues.
Team works verycooperatively;all members
contribute equally to group.
Displays strong problem-solving
skills.
TOTAL POSSIBLE POINTS: 16
TOTAL SCORE: __________
*This lesson is adapted from “How’s theWater?” by Andrea Bourgeois-Calvin, LPBF Program Coordinator.
❶❷
❸
❹
Procedure:Working as part of a team, complete handouts: “What Do We Test?”, “Factors AffectingLake Pontchartrain,” and “How Do We Organize Data?”
Conduct water quality monitoring tests in the field, or get data from the website given.
Complete handout “Water Quality Monitoring Worksheet.”
ExtensionsConduct a litter clean-up of the area around the water testing site.
Have students develop a “news conference” to inform the public about their water quality testing results. Compare EPA volunteer monitoring data stan-dards to Volunteer Stream Monitoring: A Methods Manual (EPA 841-B-97-003) or www.epa.gov.
Explain to the public what they can do to preserve or improve the Lake’s water quality.
Have students design an informative brochure to inform the public about the water quality of Lake Pontchartrain.
Use the following rubric to evaluate each student’s cooperative work in water quality monitoring and reporting.
“How’s The Water?” W ATER Q UALITY TESTING TE A M R UBRICMark the comments that best describe this team’s performance of the water quality monitoring assignment.
1.
2.
3.

Name _____________________________________________ Date_______________
What Do We Test?
Scientists perform a variety of tests on water. These tests fall into three broad categories:
PHYSICAL, CHEMICAL, and BIOLOGICALYou will conduct research to find what tests are used and what the results mean. These websites have valuable information on water quality testing: http://www.saveourlake.organd http://www.globe.gov. Consult them as well as others in Appendix D. Take carefulnotes on informative details that can be used in your news conference or brochure.
Complete the following charts on the three categories of water pollution. Thethree kinds of factors are each related to the other. For instance, the physicalfactors can affect the chemical factors and/or the biological factors. Be able toexplain these relationships in your news conference.
Physical Chemical Biological
P HYSICAL FACTORS
AFFECTING THE WATER
QUALITY A R E:
_______________________
_______________________
_______________________
_______________________
C HEMICAL FACTORS
AFFECTING THE WATER
QUALITY A R E:
_______________________
_______________________
_______________________
_______________________
BIOLOGICAL FACTORS
AFFECTING THE WATER
QUALITY A R E:
_______________________
_______________________
_______________________
_______________________
Water QualityExplain: Good water quality is a balance among the
PHYSICAL, CHEMICAL, and BIOLOGICAL factors.
________________________________________________________________________________________
________________________________________________________________________________________
________________________________________________________________________________________
____________________________________________________________________________________128 LPBF/UNO
LPBF/UNO
NAME _______________________________________________ DATE____________________________
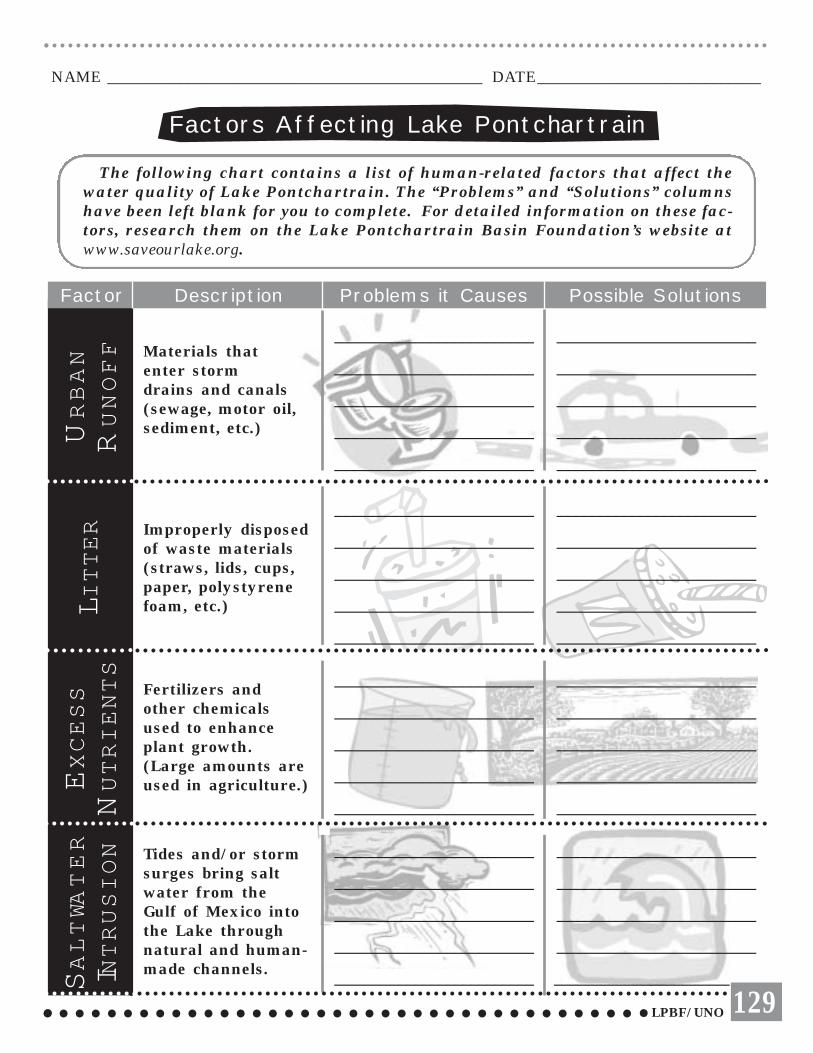
Factors Affecting Lake Pontchartrain
The following chart contains a list of human-related factors that affect thewater quality of Lake Pontchartrain. The “Problems” and “Solutions” columnshave been left blank for you to complete. For detailed information on these fac-tors, research them on the Lake Pontchartrain Basin Foundation’s website atwww.saveourlake.org.
Factor Description Problems it Causes Possible Solutions
URBAN
RUNOFF
LITTER
EXCESS
NUTRIENTS
SALTWA
TER
INTRUSION
Materials that enter storm drains and canals(sewage, motor oil,sediment, etc.)
Improperly disposedof waste materials(straws, lids, cups,paper, polystyrenefoam, etc.)
Fertilizers and other chemicalsused to enhanceplant growth.(Large amounts areused in agriculture.)
Tides and/or stormsurges bring saltwater from the Gulf of Mexico intothe Lake throughnatural and human-made channels.
_________________________
_________________________
_________________________
_________________________
_________________________
_________________________
_________________________
_________________________
_________________________
_________________________
_________________________
_________________________
_________________________
_________________________
_________________________
_________________________
_________________________
_________________________
_________________________
_________________________
_________________________
_________________________
_________________________
_________________________
_________________________
_________________________
_________________________
_________________________
_________________________
_________________________
_________________________
_________________________
_________________________
_________________________
_________________________
_________________________
_________________________
_________________________
_________________________
______________________
129

NAME _______________________________________________ DATE____________________________
How Do We Organize Data?
Before we can organize data, we have to collect it. In order to collect data, we need toknow what to collect and why.
For water quality monitoring, we measure several parameters. A parameter is a charac-teristic. The parameters or characteristics of water quality that we monitor are temperature, dissolved oxygen, salinity, pH, turbidity (visibility), and fecal coliform.Each of these parameters has ranges that tell us whether or not the water quality isacceptable or not acceptable. The measurements that we obtain from these parametersare our data.
The following chart (see next page) is an example of data collected weeklyfrom the south shore of Lake Pontchartrain. Visit www.saveourlake.org for
current water quality data for both north and south shore sampling sites.
LPBF/UNO130

Water Quality Monitoring Data
131LPBF/UNO
Location Salinity(ppt)
pH Turbidity(feet)
FecalColiform
(MPN)
Temp(°C)
DissolvedOxygen(mg/L)
24.124.124.1avg.=
6.166.166.16avg.=
11.011.511.5avg.=
7.247.197.16avg.=
2.50*2.502.50avg.=
197199198avg.=
24.524.524.2avg.=
6.056.206.05avg.=
12.812.812.8avg.=
7.047.217.35avg.=
2.50*2.502.50avg.=
205208206avg.=
24.224.224.2avg.=
6.586.506.19avg.=
13.013.013.0avg.=
7.617.807.82avg.=
1.25*1.251.25avg.=
195193196avg.=
24.624.224.3avg.=
6.205.796.18avg.=
13.313.313.1avg.=
6.957.347.46avg.=
3.002.752.75avg.=
180176172avg.=
24.524.224.1avg.=
4.854.764.38avg.=
14.614.614.6avg.=
6.546.746.83avg.=
2.00*2.002.00avg.=
110109106avg.=
1.Laketown
2.Bonnabel
Boat Launch
4.Pontchartrain
Beach
3.Old Beach
5.Lincoln Beach
* The bottom of the Lake was visible.
Calculate the mean for each of the above parameters measured at each location. To calculate the mean:
a. Add the number of measurements together.b. Divide by the number of measurements you have.
Example:At Laketown, three measurements were taken for temperature. First, add the temperature measurements together:
24.1 °C24.1 °C
+ 24.1 °C72.3 °C
Divide the sum of the measurements by the number of measurements. There arethree measurements, so: 72.3 °C / 3 = 24.1°C
1.

LPBF/UNO
3 3III
Notice that the salinity increases as you go from Laketown to Lincoln Beach (refer to map in Activity 1). Why?
_____________________________________________________________________________________
_____________________________________________________________________________________
** Notice that three measurements are taken for each parameter at eachlocation. Those three measurements are then averaged. Three measure-ments are taken because we have to make sure that our results arebelievable. If we take multiple measurements and get the same numberor almost the same number each time, then we know that our equipmentis working properly and we are doing the procedure properly; therefore,we can believe our results. That is why we take several measurementsand calculate the average. **
You have to report your data so people will understand it. You will report your averagemeasurement for each parameter at each location and compare your average with the standard.
Complete the following chart:
Notice that the temperature measurements were taken in “degrees Celsius.” Though“degrees Celsius” is the normal measurement for scientists, the general public is morefamiliar with Fahrenheit measurement. Therefore, you will have to convert the “Celsius”measurements to “Fahrenheit.”
To convert “degrees Celsius” to “degrees Fahrenheit”:°F = (1.8 x °C) + 32
What factor do you feel is most important to consider when analyzing water quality data?Why?
_____________________________________________________________________________________
____________________________________________________________________________________
2.
3.
4.
5.
132
Dissolved oxygen
Salinity
pH
Turbidity (visibility)
Fecal Coliform
Parameter Your Average Standard Standard vs. Average
Above 4 ppm or mg/L is okay
Canal/0 ppt,Lake/2-15 ppt
6-9 range is good
Greater than 1 foot is good
Below 200 colonies/ 100 ml water to swim

Based on the data, would you go swimming in Lake Pontchartrain? Why or why not?
_____________________________________________________________________________________
_____________________________________________________________________________________
Are there any other observations that could have been recorded that day? If so, whichone(s)?
_____________________________________________________________________________________
_____________________________________________________________________________________
_____________________________________________________________________________________
_____________________________________________________________________________________
133LPBF/UNO
6.
7.
SALINITY?
DISSOLVEDOXYGEN?
PH?
TURBIDITY?
FECAL COLIFORM?
★★
134 LPBF/UNO
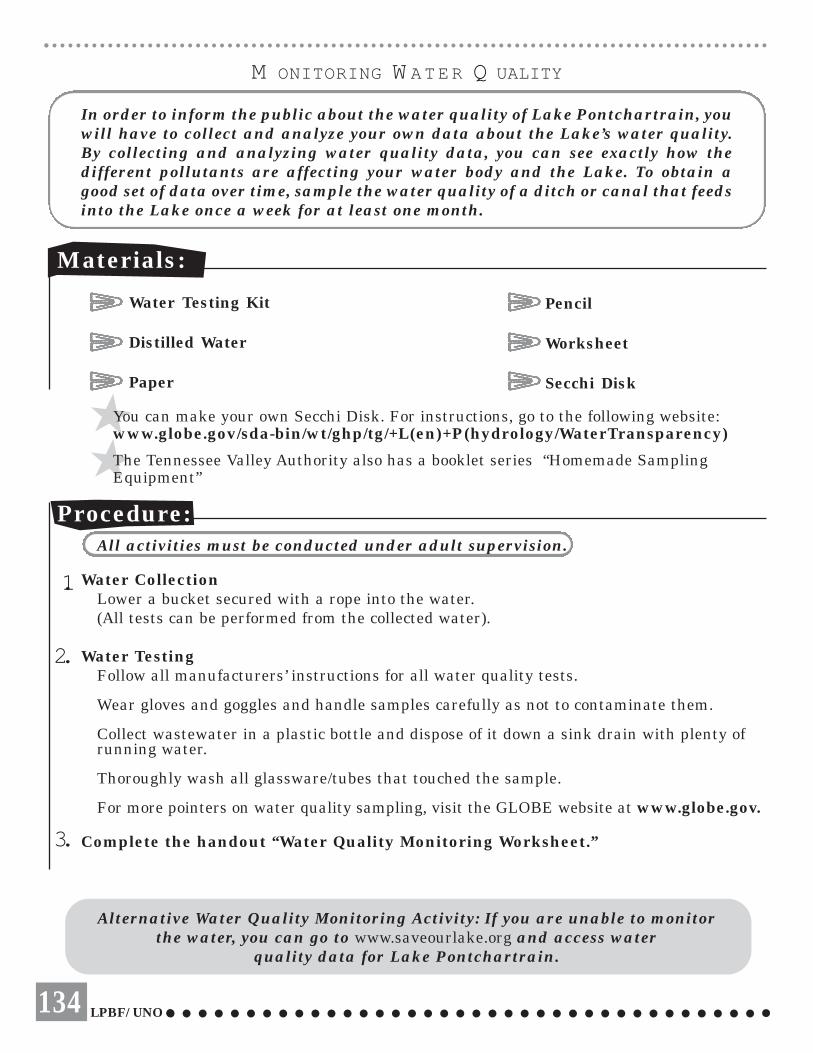
M ONITORING W ATER Q UALITY
In order to inform the public about the water quality of Lake Pontchartrain, youwill have to collect and analyze your own data about the Lake’s water quality.By collecting and analyzing water quality data, you can see exactly how the different pollutants are affecting your water body and the Lake. To obtain agood set of data over time, sample the water quality of a ditch or canal that feedsinto the Lake once a week for at least one month.
Materials:
Water Testing Kit
Distilled Water
Paper
You can make your own Secchi Disk. For instructions, go to the following website: www.globe.gov/sda-bin/wt/ghp/tg/+L(en)+P(hydrology/WaterTransparency)
The Tennessee Valley Authority also has a booklet series “Homemade Sampling Equipment”
Procedure:All activities must be conducted under adult supervision.
Water CollectionLower a bucket secured with a rope into the water.(All tests can be performed from the collected water).
Water TestingFollow all manufacturers’ instructions for all water quality tests.
Wear gloves and goggles and handle samples carefully as not to contaminate them.
Collect wastewater in a plastic bottle and dispose of it down a sink drain with plenty of running water.
Thoroughly wash all glassware/tubes that touched the sample.
For more pointers on water quality sampling, visit the GLOBE website at www.globe.gov.
Complete the handout “Water Quality Monitoring Worksheet.”
Alternative Water Quality Monitoring Activity: If you are unable to monitor the water, you can go to www.saveourlake.org and access water
quality data for Lake Pontchartrain.
Pencil
Worksheet
Secchi Disk
1.
2.
3.

Water Quality Monitoring Worksheet
Name:_____________________________________________ Date ______________________________
Sampling Location: ________________________________________
Time:_______________
Describe the weather conditions.
____________________________________________________________________________________
____________________________________________________________________________________
Describe the physical appearance of the water. (Does it have trash floating in it? Does itsmell? What color is it?)
____________________________________________________________________________________
_________________________________________________________________________________
135LPBF/UNO
1.
2.
Parameter1st
Measurement2nd
Measurement3rd
Measurement Average
Temperature(°C or °F)
DissolvedOxygen (mg/L)
Salinity(ppt)
pH
Turbidity(Visibility)
(feet)
Fecal Coliform(colonies)
How do your measurements compare with the standard ranges?
136 LPBF/UNO
3.
4. Other Comments
_____________________________________________________________________________________
_____________________________________________________________________________________
_____________________________________________________________________________________
_____________________________________________________________________________________
_____________________________________________________________________________________
_____________________________________________________________________________________
_____________________________________________________________________________________
_____________________________________________________________________________________
Parameter Your Average Standard Standard vs. Average
Dissolved oxygen Above 4 ppm or mg/L is okay
Salinity Canal/0 ppt,Lake/2-15 ppt
pH 6-9 range is good
Turbidity (visibility) Greater than 1 foot is good
Fecal Coliform Below 200 colonies/100 ml water to swim