'5 4UBUF &YQPSU 1FSTQFDUJWF o
30
Transcript of '5 4UBUF &YQPSU 1FSTQFDUJWF o


NAFTA:A State Export Perspective,1993–2003
International Trade AdministrationTrade DevelopmentOffice of Trade and Economic AnalysisJuly 2004

2 NAFTA: A State Export Perspective, 1993–2003

NAFTA: A State Export Perspective, 1993–2003 3
IntroductionThis report explores the impact of the North American Free TradeAgreement (NAFTA) on the export performance of the United States.While most discussions of NAFTA address the overall impact of NAFTAat the national level, this report differs in that it focuses on developmentsat the state level. For most Americans, the effects of NAFTA on the statein which they reside have more immediate, practical relevance thangeneralized statistics cited for the U.S. economy as a whole.
The scope of this paper is limited to an examination of export trendsfrom 1993 (the year prior to NAFTA’s implementation) to 2003. Al-though exports represent just one dimension of the complex economicrelationship between the United States and its NAFTA partners, it isnonetheless an important dimension.
Due to limitations on U.S. export statistics, this report addresses only U.S.exports of goods (i.e., merchandise) to Canada and Mexico. Data areunavailable for state exports of services, as well as state imports of bothgoods and services. The lack of state import data means that state-leveltrade balances cannot be calculated.
In this report the terms “NAFTA,” “NAFTA region,” “NAFTA partners,”“NAFTA markets,” “NAFTA countries,” “NAFTA nations,” and “NAFTAdestinations” are used interchangeably, and all refer exclusively to Mexicoand Canada as export destinations. The terms do not refer to the NAFTAagreement itself.
All state export statistics cited here are from the Census Bureau’s Originof Movement (OM) series, which allocates exports to states based ontransportation origin (not production origin). These statistics have certainstrengths and limitations which are explained in the data notes appendedto this report. A careful reading of these notes is strongly recommended.
The Origin of Movement state export series is compiled from officialexport declarations filed by businesses for goods leaving the UnitedStates. All statistics in the OM series are on a free-alongside-ship (f.a.s.)basis and include both domestic exports and re-exports.
State export figures in this study refer to direct exports only. Directexports are final goods shipped to a customer outside the United States.So-called “indirect” exports—e.g., domestic U.S. shipments of parts thatare ultimately incorporated in final goods for export—are excluded.
Technical questions regarding the data in this report should be e-mailedto the author, Kate McCurdy, at [email protected].
Questions about NAFTA issues should be directed to the Office ofNAFTA at (202) 482-0393.

4 NAFTA: A State Export Perspective, 1993–2003
NAFTAMarketsGrow MoreImportant
Export shipments of U.S. goods to NAFTA partners (Canada andMexico) totaled $266.9 billion in 2003, up 88 percent from the 1993total of $141.8 billion. Exports to the NAFTA countries rose faster thantotal exports to the world, which grew 56 percent from $464.9 billion in1993 to $723.7 billion in 2003.
NAFTA markets are therefore increasingly important to U.S. companies.The NAFTA share of U.S. merchandise exports rose from 31 percent in1993 to 37 percent in 2003—a gain of six percentage points over theten-year period.
Mexico and Canada have contributed nearly equally to the growingsignificance of NAFTA.
• U.S. exports of goods to Mexico in 2003 were $56 billion higherthan in 1993—an increase of 134 percent, or more than double the1993 value of $41.6 billion.
• From 1993 to 2003, Mexico was the third-fastest growing majorexport market for the United States, after China and Ireland.
• During the same period, merchandise exports to Canada expandedby $69 billion, which represents a 69 percent increase over the1993 base value of $100.2 billion.
The increasing importance of NAFTA is reflected broadly at the statelevel. From 1993 to 2003, the share of merchandise exports destined forNAFTA markets rose in 36 of the 50 states.
• Wyoming boosted the share of its exports going to Canada andMexico from 12 percent to 34 percent, the biggest such shareincrease among the states. Wyoming was followed by South Dakota(up from 46 percent to 61 percent), and West Virginia (up from 20percent to 35 percent).
• As of 2003, the number of states relying on NAFTA markets for atleast 40 percent of their merchandise exports stood at 18—upfrom 12 in 1993.
Some of the large traditional manufacturing states are among those mostreliant on exports to NAFTA destinations.
• For example, 72 percent of Michigan’s total goods exports in 2003went to Canada and Mexico, as did 64 percent of Ohio’s, 58 per-cent of Indiana’s, and 53 percent of Missouri’s.
• Exports from traditional industrial states to NAFTA countries arebeing fueled by the completion of Mexico’s phase-down on autoparts tariffs, and the resulting continued integration of the NorthAmerican automotive industry. For example, “motor vehicle parts”was the largest export product category from Michigan to NAFTAnations in 2003, accounting for 39 percent of the state’s totalexports to Canada and Mexico. Comparable shares for Indiana andOhio were 28 percent and 25 percent, respectively.
Other states that shipped a high percentage of their exports to Canadaand Mexico in 2003 were Montana (64 percent of exports shipped toNAFTA markets), South Dakota (61 percent), North Dakota (59 per-cent), and Texas (53 percent).

NAFTA: A State Export Perspective, 1993–2003 5
Six of theTop 10Exporters toNAFTAPartners AreNorthernManufacturingStates
Texas was by far the top state exporter to NAFTA destinations in 2003,posting $52.4 billion in merchandise exports to Canada and Mexicocombined. Texas alone accounted for one-fifth of total U.S. merchandiseexports to NAFTA countries.
Seventy-nine percent of Texas’ exports to NAFTA nations in 2003 went toMexico. This figure is likely driven, in part, by supply needs of maquiladoramanufacturing plants located across the state’s border with Mexico.(Mexico’s maquila program facilitates foreign investment, in part by enablingfactories to import supplies that are largely free of duties.)
The second biggest state exporter to NAFTA markets in 2003 wasCalifornia, which recorded shipments to the region of $26.1 billion.Mexico accounted for 57 percent of California’s NAFTA exports in 2003,up from a 46 percent share in 1993.
Six of the remaining top ten state exporters to NAFTA countries in 2003were traditional manufacturing states. These were Michigan ($23.8 billionof exports to the NAFTA region), Ohio ($19.0 billion), New York ($10.7billion), Illinois ($10.7 billion), Indiana ($9.6 billion), and Pennsylvania ($7.0billion).
Rounding out the top ten were Tennessee ($5.7 billion) and North Caro-lina ($5.4 billion), both states with diversifying manufacturing sectors.
Together, the top ten states accounted for 64 percent—nearly two-thirds—of total U.S. merchandise exports to NAFTA partners in 2003.
• This concentration notwithstanding, many other states throughoutthe country are benefiting significantly from exports to NAFTAmarkets.
• Thirty-four states—more than two-thirds—posted export ship-ments to NAFTA destinations worth more than $1 billion in 2003.This was up from 27 states in 1993, despite general weakness in U.S.export prices since the mid-1990s.

6 NAFTA: A State Export Perspective, 1993–2003
Most StatesAre BoostingExports toNAFTAPartners
Forty-seven of the 50 states increased exports of merchandise toNAFTA markets from 1993 to 2003.
• Twenty-five increased exports to the NAFTA region by more than$1 billion.
• Twenty-four states more than doubled exports to NAFTA coun-tries over the ten-year period.
In 2003, Texas’ merchandise exports to NAFTA partners were $29.3billion above the 1993 level—an increase of roughly 127 percent and thebiggest dollar gain among the states.
California recorded the second-largest dollar increase with a $13.2billion gain, followed by Ohio (up $10.3 billion), Michigan (up $5.8 bil-lion), Indiana (up $5.7 billion), Illinois (up $4.4 billion), Tennessee (up $3.3billion), Georgia (up $3.2 billion), Pennsylvania (up $2.7 billion), and NewYork (up $2.7 billion).
Some of the fastest export growth to NAFTA markets from 1993 to2003 was recorded by states that are not traditional export power-houses or are growing exports from relatively small base values.
• For example, Wyoming posted the most rapid export growth toNAFTA partners, boosting shipments to these markets by 400percent over the period.
• Other states with similar export profiles included Alaska (exportsto the NAFTA region up 284 percent), Nevada (up 268 percent),South Dakota (up 237 percent), and West Virginia (up 187 percent).
Among the larger exporting states, those with rapid increases in ship-ments to NAFTA nations included Louisiana (up 253 percent from 1993to 2003), New Mexico (up 215 percent), South Carolina (up 187 per-cent), Nebraska (up 176 percent), and Georgia (up 169 percent).

NAFTA: A State Export Perspective, 1993–2003 7
UUUUU.S..S..S..S..S. Mer Mer Mer Mer Merchandise Exporchandise Exporchandise Exporchandise Exporchandise Exports to NAFTts to NAFTts to NAFTts to NAFTts to NAFTA ParA ParA ParA ParA Partners in 2003tners in 2003tners in 2003tners in 2003tners in 2003WWWWWererererere 88 Pe 88 Pe 88 Pe 88 Pe 88 Pererererercentcentcentcentcent AboAboAboAboAbovvvvveeeee 11111993993993993993
U.S. Merchandise Exports to Canada and Mexico Combined
Total U.S. goods exports in 2003 were$723.7 billion, of which $266.9 billionwent to the NAFTA countries.
Source: U.S. Census Bureau, Origin ofMovement Series.
Prepared by the Office of Trade andEconomic Analysis, International TradeAdministration, U.S. Department ofCommerce.
Since NAFTSince NAFTSince NAFTSince NAFTSince NAFTAAAAA WWWWWas Enacted,as Enacted,as Enacted,as Enacted,as Enacted, Expor Expor Expor Expor Exports to Canada and Mexicots to Canada and Mexicots to Canada and Mexicots to Canada and Mexicots to Canada and MexicoHaHaHaHaHavvvvve Gre Gre Gre Gre Grooooown Faster wn Faster wn Faster wn Faster wn Faster ThanThanThanThanThan TTTTTotal Exporotal Exporotal Exporotal Exporotal Exportststststs
Growth in U.S. Merchandise Exports (1993=100)
Total U.S. goods exports in 2003 were$723.7 billion, of which $266.9 billionwent to the NAFTA countries.
Source: U.S. Census Bureau, Origin ofMovement Series.
Prepared by the Office of Trade andEconomic Analysis, International TradeAdministration, U.S. Department ofCommerce.

8 NAFTA: A State Export Perspective, 1993–2003
TTTTTwwwwwelvelvelvelvelve States Expore States Expore States Expore States Expore States Exported $5 Billion or Morted $5 Billion or Morted $5 Billion or Morted $5 Billion or Morted $5 Billion or Moreeeeeto NAFTto NAFTto NAFTto NAFTto NAFTA MarkA MarkA MarkA MarkA Markets in 2003ets in 2003ets in 2003ets in 2003ets in 2003
Dollar Value of State Merchandise Exports to Canada and Mexico
WhileWhileWhileWhileWhile TTTTTexas and Califexas and Califexas and Califexas and Califexas and California Lead,ornia Lead,ornia Lead,ornia Lead,ornia Lead, Six of the Six of the Six of the Six of the Six of the TTTTTopopopopop TTTTTen State Exporen State Exporen State Exporen State Exporen State Exportersterstersterstersto NAFTto NAFTto NAFTto NAFTto NAFTA MarkA MarkA MarkA MarkA Marketsetsetsetsets ArArArArAre Nore Nore Nore Nore Northern Industrial Statesthern Industrial Statesthern Industrial Statesthern Industrial Statesthern Industrial States
Total State Merchandise Exports to Canada and Mexico Combined,Top Ten States, 2003
Total U.S. goods exports in 2003 were$723.7 billion, of which $266.9 billionwent to the NAFTA countries. Exportvalues, as represented by map shadings,are on an Origin of Movement basis,defined as the location from which exportmerchandise starts its journey to thepoint of exit from the United States.
Source: U.S. Census Bureau, Origin ofMovement Series.
Prepared by the Office of Trade andEconomic Analysis, International TradeAdministration, U.S. Department ofCommerce.
Total U.S. goods exports in 2003 were$723.7 billion, of which $266.9 billionwent to the NAFTA countries. Figuresreflect location from which exportmerchandise starts its journey to thepoint of exit from the United States.
Source: U.S. Census Bureau, Origin ofMovement Series.
Prepared by the Office of Trade andEconomic Analysis, International TradeAdministration, U.S. Department ofCommerce.

NAFTA: A State Export Perspective, 1993–2003 9
Half the States IncrHalf the States IncrHalf the States IncrHalf the States IncrHalf the States Increased Exporeased Exporeased Exporeased Exporeased Exports to NAFTts to NAFTts to NAFTts to NAFTts to NAFTA MarkA MarkA MarkA MarkA Marketsetsetsetsetsbbbbby Mory Mory Mory Mory Moreeeee Than $1 Billion frThan $1 Billion frThan $1 Billion frThan $1 Billion frThan $1 Billion fromomomomom 11111993 to 2003993 to 2003993 to 2003993 to 2003993 to 2003
Dollar Change in State Merchandise Exports to Canada and Mexico
Total U.S. goods exports in 2003 were$723.7 billion, of which $266.9 billionwent to the NAFTA countries. Exportvalues, as represented by map shadings,are on an Origin of Movement basis,defined as the location from which exportmerchandise starts its journey to thepoint of exit from the United States.
Source: U.S. Census Bureau, Origin ofMovement Series.
Prepared by the Office of Trade andEconomic Analysis, International TradeAdministration, U.S. Department ofCommerce.
24 S24 S24 S24 S24 States Mortates Mortates Mortates Mortates Moreeeee Than Doubled Than Doubled Than Doubled Than Doubled Than Doubled Their ExporTheir ExporTheir ExporTheir ExporTheir Exports to NAFTts to NAFTts to NAFTts to NAFTts to NAFTA MarkA MarkA MarkA MarkA Marketsetsetsetsetsfrfrfrfrfromomomomom 11111993 to 2003993 to 2003993 to 2003993 to 2003993 to 2003
Percentage Change in State Merchandise Exports to Canada and Mexico
Total U.S. goods exports in 2003 were$723.7 billion, of which $266.9 billionwent to the NAFTA countries. Exportvalues, as represented by map shadings,are on an Origin of Movement basis,defined as the location from which exportmerchandise starts its journey to thepoint of exit from the United States.
Source: U.S. Census Bureau, Origin ofMovement Series.
Prepared by the Office of Trade andEconomic Analysis, International TradeAdministration, U.S. Department ofCommerce.

10 NAFTA: A State Export Perspective, 1993–2003
The SharThe SharThe SharThe SharThe Share of e of e of e of e of TTTTTotal Uotal Uotal Uotal Uotal U.S..S..S..S..S. Mer Mer Mer Mer Merchandise Exporchandise Exporchandise Exporchandise Exporchandise Exports Going tots Going tots Going tots Going tots Going toCanada and Mexico IncrCanada and Mexico IncrCanada and Mexico IncrCanada and Mexico IncrCanada and Mexico Increased Significantleased Significantleased Significantleased Significantleased Significantlyyyyy
frfrfrfrfromomomomom 11111993 to 2003993 to 2003993 to 2003993 to 2003993 to 2003
The RelativThe RelativThe RelativThe RelativThe Relative Impore Impore Impore Impore Importance of NAFTtance of NAFTtance of NAFTtance of NAFTtance of NAFTA MarkA MarkA MarkA MarkA Markets Has Grets Has Grets Has Grets Has Grets Has Grooooown inwn inwn inwn inwn inMMMMMananananany Statesy Statesy Statesy Statesy States
State Merchandise Exports to Canada and Mexico as a Percentage ofTotal State Merchandise Exports
Total U.S. goods exports in 2003 were$723.7 billion, of which $266.9 billionwent to the NAFTA countries. Exportvalues, as represented by map shadings,are on an Origin of Movement basis,defined as the location from which exportmerchandise starts its journey to thepoint of exit from the United States.
Source: U.S. Census Bureau, Origin ofMovement Series.
Prepared by the Office of Trade andEconomic Analysis, International TradeAdministration, U.S. Department ofCommerce.
Total U.S. goods exports in 2003 were$723.7 billion, of which $266.9 billionwent to the NAFTA countries.
Source: U.S. Census Bureau, Origin ofMovement Series.
Prepared by the Office of Trade andEconomic Analysis, International TradeAdministration, U.S. Department ofCommerce.

NAFTA: A State Export Perspective, 1993–2003 11
Major Industrial States Major Industrial States Major Industrial States Major Industrial States Major Industrial States ArArArArAreeeee Among the Most Reliant onAmong the Most Reliant onAmong the Most Reliant onAmong the Most Reliant onAmong the Most Reliant onNAFTNAFTNAFTNAFTNAFTA MarkA MarkA MarkA MarkA Marketsetsetsetsets
Percentage of State Merchandise Exports Shipped to Canada and Mexico,Top 25 States, 2003
Total U.S. goods exports in 2003 were$723.7 billion, of which $266.9 billionwent to the NAFTA countries. Figuresreflect location from which exportmerchandise starts its journey to thepoint of exit from the United States.
Source: U.S. Census Bureau, Origin ofMovement Series.
Prepared by the Office of Trade andEconomic Analysis, International TradeAdministration, U.S. Department ofCommerce.

12 NAFTA: A State Export Perspective, 1993–2003
State MerState MerState MerState MerState Merchandise Exporchandise Exporchandise Exporchandise Exporchandise Exporttttt TTTTTotals to NAFTotals to NAFTotals to NAFTotals to NAFTotals to NAFTA MarkA MarkA MarkA MarkA Markets,ets,ets,ets,ets, 11111993–2003993–2003993–2003993–2003993–2003(Thousands of Dollars)
1993–2003Dollar Percent
State 1993 1994 1997 2000 2001 2002 2003 Change ChangeAlabama 944,738 1,138,185 2,309,986 2,335,566 2,252,795 2,349,622 2,298,789 1,354,051 143.3Alaska 78,616 132,969 278,549 202,017 270,459 218,251 302,206 223,589 284.4Arizona 2,411,399 2,997,447 3,274,034 6,142,438 4,917,070 4,211,522 4,360,491 1,949,092 80.8Arkansas 554,053 718,510 1,068,356 1,049,391 1,116,148 1,060,448 1,052,317 498,263 89.9California 12,921,908 14,810,650 21,892,326 31,591,423 28,159,057 26,151,628 26,103,403 13,181,496 102.0Colorado 776,580 810,187 1,000,975 1,389,698 1,481,487 1,795,840 2,002,142 1,225,562 157.8Connecticut 1,678,401 1,865,466 2,070,090 2,236,142 2,055,341 1,894,352 1,830,300 151,900 9.1Delaware 888,070 1,028,773 1,025,307 1,186,867 959,594 914,533 787,299 -100,771 -11.3Florida 2,202,741 2,222,683 2,688,647 4,222,606 4,282,400 3,770,980 4,182,985 1,980,244 89.9Georgia 1,905,936 2,304,776 3,494,242 4,678,357 4,698,751 4,729,122 5,124,868 3,218,933 168.9Hawaii 21,148 29,765 19,963 32,713 26,200 21,831 20,158 -990 -4.7Idaho 199,899 247,784 349,446 524,801 416,175 355,459 417,505 217,605 108.9Illinois 6,352,165 7,821,346 10,597,373 14,628,323 13,695,807 10,277,903 10,711,544 4,359,379 68.6Indiana 3,843,948 4,547,334 6,401,576 9,137,309 7,971,122 8,761,729 9,563,691 5,719,743 148.8Iowa 1,104,621 1,443,443 2,021,526 1,928,190 1,954,030 2,072,132 2,540,607 1,435,986 130.0Kansas 887,752 1,123,302 1,602,892 1,926,153 1,764,384 1,935,113 1,622,888 735,136 82.8Kentucky 1,473,178 2,280,191 3,480,944 3,954,373 3,387,452 4,120,730 3,942,487 2,469,309 167.6Louisiana 856,344 1,263,185 1,806,895 2,736,345 2,552,433 2,668,425 3,022,986 2,166,642 253.0Maine 384,127 447,090 625,865 875,824 880,554 820,305 845,176 461,049 120.0Maryland 1,151,996 1,276,794 1,040,220 993,942 999,098 1,065,790 1,243,967 91,971 8.0Massachusetts 2,860,389 3,287,163 3,941,748 4,290,118 3,415,421 3,274,284 3,353,228 492,839 17.2Michigan 18,025,629 20,073,628 24,188,380 23,993,086 22,352,713 24,040,283 23,805,479 5,779,850 32.1Minnesota 2,059,675 2,467,386 2,625,670 2,976,548 3,070,498 3,245,429 3,294,909 1,235,233 60.0Mississippi 417,050 499,188 568,827 931,991 1,339,571 953,300 840,539 423,489 101.5Missouri 1,903,251 1,916,589 3,737,805 3,389,108 3,190,516 3,809,874 3,828,852 1,925,601 101.2Montana 172,061 173,540 267,482 352,841 336,708 250,050 232,688 60,627 35.2Nebraska 424,274 560,967 752,460 825,220 1,020,920 1,026,082 1,172,935 748,661 176.5Nevada 155,491 173,627 287,912 705,156 705,619 450,900 572,008 416,517 267.9New Hampshire 408,268 421,773 582,848 825,299 675,660 578,006 590,785 182,517 44.7New Jersey 2,929,896 3,455,996 4,497,076 5,270,667 5,020,887 4,567,000 4,587,330 1,657,433 56.6New Mexico 114,093 139,265 137,593 260,596 208,116 214,787 359,939 245,845 215.5New York 8,061,345 9,065,203 12,023,766 13,003,700 11,611,948 11,119,069 10,746,154 2,684,809 33.3North Carolina 2,955,564 3,702,971 5,369,716 6,915,731 5,711,293 5,068,160 5,360,045 2,404,481 81.4North Dakota 288,045 289,851 475,588 357,241 431,877 478,689 507,776 219,731 76.3Ohio 8,697,068 9,495,559 13,494,158 16,050,345 15,951,465 17,529,659 18,996,283 10,299,215 118.4Oklahoma 809,506 862,849 1,092,361 1,479,111 1,112,873 1,125,536 1,275,325 465,819 57.5Oregon 1,007,110 1,170,206 1,524,550 2,076,588 1,548,942 1,769,549 1,960,893 953,783 94.7Pennsylvania 4,243,608 4,858,303 6,682,349 8,502,621 7,094,661 6,793,423 6,961,473 2,717,865 64.0Rhode Island 328,696 303,848 397,901 483,279 421,518 449,909 474,981 146,285 44.5South Carolina 1,168,024 1,479,259 2,350,814 3,188,437 3,083,059 3,193,051 3,349,864 2,181,840 186.8South Dakota 122,562 154,394 225,592 341,449 326,824 364,986 412,745 290,183 236.8Tennessee 2,405,980 2,874,347 4,018,530 5,786,031 5,497,684 5,366,606 5,689,859 3,283,879 136.5Texas 23,045,593 27,154,298 37,817,234 58,892,290 52,202,549 51,563,014 52,370,010 29,324,417 127.2Utah 392,359 449,802 584,324 707,904 656,747 647,496 655,466 263,108 67.1Vermont 2,104,599 2,089,015 2,327,229 2,254,907 1,408,187 1,083,987 1,113,255 -991,343 -47.1Virginia 1,227,615 1,528,661 1,953,922 2,750,128 2,542,995 2,288,304 2,505,014 1,277,399 104.1Washington 2,114,931 2,421,424 3,062,223 3,343,062 3,598,798 3,376,133 3,921,297 1,806,366 85.4West Virginia 292,308 330,918 551,170 677,693 820,519 814,386 840,041 547,734 187.4Wisconsin 2,604,112 3,182,204 3,985,304 4,810,115 4,441,453 4,640,148 5,137,359 2,533,247 97.3Wyoming 39,923 60,086 143,779 155,737 165,413 197,930 199,766 159,843 400.4
District of Columbia 26,090 120,462 41,165 44,471 40,370 38,603 24,503 -1,586 -6.1Puerto Rico 528,814 835,555 915,839 1,385,931 1,193,206 1,256,459 1,431,473 902,659 170.7Virgin Islands 17,125 23,036 7,075 19,609 70,857 68,473 5,682 -11,443 -66.8Unallocated 9,237,174 10,963,725 13,820,975 19,331,022 20,123,312 17,490,544 18,384,591 9,147,416 99.0UNITED STATES 141,825,850 165,094,982 221,502,581 288,150,510 265,233,537 258,329,827 266,938,356 125,112,506 88.2
Source: U.S. Census Bureau, Origin of Movement Series.Prepared by the Office of Trade and Economic Analysis, International Trade Administration, U.S. Department of Commerce.

NAFTA: A State Export Perspective, 1993–2003 13
State MerState MerState MerState MerState Merchandise Exporchandise Exporchandise Exporchandise Exporchandise Exportststststs TTTTTotals to NAFTotals to NAFTotals to NAFTotals to NAFTotals to NAFTA MarkA MarkA MarkA MarkA Markets,ets,ets,ets,ets, 11111993–2003993–2003993–2003993–2003993–2003(Ranked by 2003 Export Values; Thousands of Dollars)
1993–2003Dollar Percent
Rank State 1993 1994 1997 2000 2001 2002 2003 Change Change1 Texas 23,045,593 27,154,298 37,817,234 58,892,290 52,202,549 51,563,014 52,370,010 29,324,417 127.22 California 12,921,908 14,810,650 21,892,326 31,591,423 28,159,057 26,151,628 26,103,403 13,181,496 102.03 Michigan 18,025,629 20,073,628 24,188,380 23,993,086 22,352,713 24,040,283 23,805,479 5,779,850 32.14 Ohio 8,697,068 9,495,559 13,494,158 16,050,345 15,951,465 17,529,659 18,996,283 10,299,215 118.45 New York 8,061,345 9,065,203 12,023,766 13,003,700 11,611,948 11,119,069 10,746,154 2,684,809 33.36 Illinois 6,352,165 7,821,346 10,597,373 14,628,323 13,695,807 10,277,903 10,711,544 4,359,379 68.67 Indiana 3,843,948 4,547,334 6,401,576 9,137,309 7,971,122 8,761,729 9,563,691 5,719,743 148.88 Pennsylvania 4,243,608 4,858,303 6,682,349 8,502,621 7,094,661 6,793,423 6,961,473 2,717,865 64.09 Tennessee 2,405,980 2,874,347 4,018,530 5,786,031 5,497,684 5,366,606 5,689,859 3,283,879 136.5
10 North Carolina 2,955,564 3,702,971 5,369,716 6,915,731 5,711,293 5,068,160 5,360,045 2,404,481 81.411 Wisconsin 2,604,112 3,182,204 3,985,304 4,810,115 4,441,453 4,640,148 5,137,359 2,533,247 97.312 Georgia 1,905,936 2,304,776 3,494,242 4,678,357 4,698,751 4,729,122 5,124,868 3,218,933 168.913 New Jersey 2,929,896 3,455,996 4,497,076 5,270,667 5,020,887 4,567,000 4,587,330 1,657,433 56.614 Arizona 2,411,399 2,997,447 3,274,034 6,142,438 4,917,070 4,211,522 4,360,491 1,949,092 80.815 Florida 2,202,741 2,222,683 2,688,647 4,222,606 4,282,400 3,770,980 4,182,985 1,980,244 89.916 Kentucky 1,473,178 2,280,191 3,480,944 3,954,373 3,387,452 4,120,730 3,942,487 2,469,309 167.617 Washington 2,114,931 2,421,424 3,062,223 3,343,062 3,598,798 3,376,133 3,921,297 1,806,366 85.418 Missouri 1,903,251 1,916,589 3,737,805 3,389,108 3,190,516 3,809,874 3,828,852 1,925,601 101.219 Massachusetts 2,860,389 3,287,163 3,941,748 4,290,118 3,415,421 3,274,284 3,353,228 492,839 17.220 South Carolina 1,168,024 1,479,259 2,350,814 3,188,437 3,083,059 3,193,051 3,349,864 2,181,840 186.821 Minnesota 2,059,675 2,467,386 2,625,670 2,976,548 3,070,498 3,245,429 3,294,909 1,235,233 60.022 Louisiana 856,344 1,263,185 1,806,895 2,736,345 2,552,433 2,668,425 3,022,986 2,166,642 253.023 Iowa 1,104,621 1,443,443 2,021,526 1,928,190 1,954,030 2,072,132 2,540,607 1,435,986 130.024 Virginia 1,227,615 1,528,661 1,953,922 2,750,128 2,542,995 2,288,304 2,505,014 1,277,399 104.125 Alabama 944,738 1,138,185 2,309,986 2,335,566 2,252,795 2,349,622 2,298,789 1,354,051 143.326 Colorado 776,580 810,187 1,000,975 1,389,698 1,481,487 1,795,840 2,002,142 1,225,562 157.827 Oregon 1,007,110 1,170,206 1,524,550 2,076,588 1,548,942 1,769,549 1,960,893 953,783 94.728 Connecticut 1,678,401 1,865,466 2,070,090 2,236,142 2,055,341 1,894,352 1,830,300 151,900 9.129 Kansas 887,752 1,123,302 1,602,892 1,926,153 1,764,384 1,935,113 1,622,888 735,136 82.830 Oklahoma 809,506 862,849 1,092,361 1,479,111 1,112,873 1,125,536 1,275,325 465,819 57.531 Maryland 1,151,996 1,276,794 1,040,220 993,942 999,098 1,065,790 1,243,967 91,971 8.032 Nebraska 424,274 560,967 752,460 825,220 1,020,920 1,026,082 1,172,935 748,661 176.533 Vermont 2,104,599 2,089,015 2,327,229 2,254,907 1,408,187 1,083,987 1,113,255 -991,343 -47.134 Arkansas 554,053 718,510 1,068,356 1,049,391 1,116,148 1,060,448 1,052,317 498,263 89.935 Maine 384,127 447,090 625,865 875,824 880,554 820,305 845,176 461,049 120.036 Mississippi 417,050 499,188 568,827 931,991 1,339,571 953,300 840,539 423,489 101.537 West Virginia 292,308 330,918 551,170 677,693 820,519 814,386 840,041 547,734 187.438 Delaware 888,070 1,028,773 1,025,307 1,186,867 959,594 914,533 787,299 -100,771 -11.339 Utah 392,359 449,802 584,324 707,904 656,747 647,496 655,466 263,108 67.140 New Hampshire 408,268 421,773 582,848 825,299 675,660 578,006 590,785 182,517 44.741 Nevada 155,491 173,627 287,912 705,156 705,619 450,900 572,008 416,517 267.942 North Dakota 288,045 289,851 475,588 357,241 431,877 478,689 507,776 219,731 76.343 Rhode Island 328,696 303,848 397,901 483,279 421,518 449,909 474,981 146,285 44.544 Idaho 199,899 247,784 349,446 524,801 416,175 355,459 417,505 217,605 108.945 South Dakota 122,562 154,394 225,592 341,449 326,824 364,986 412,745 290,183 236.846 New Mexico 114,093 139,265 137,593 260,596 208,116 214,787 359,939 245,845 215.547 Alaska 78,616 132,969 278,549 202,017 270,459 218,251 302,206 223,589 284.448 Montana 172,061 173,540 267,482 352,841 336,708 250,050 232,688 60,627 35.249 Wyoming 39,923 60,086 143,779 155,737 165,413 197,930 199,766 159,843 400.450 Hawaii 21,148 29,765 19,963 32,713 26,200 21,831 20,158 -990 -4.7
District of Columbia 26,090 120,462 41,165 44,471 40,370 38,603 24,503 -1,586 -6.1Puerto Rico 528,814 835,555 915,839 1,385,931 1,193,206 1,256,459 1,431,473 902,659 170.7Virgin Islands 17,125 23,036 7,075 19,609 70,857 68,473 5,682 -11,443 -66.8Unallocated 9,237,174 10,963,725 13,820,975 19,331,022 20,123,312 17,490,544 18,384,591 9,147,416 99.0UNITED STATES 141,825,850 165,094,982 221,502,581 288,150,510 265,233,537 258,329,827 266,938,356 125,112,506 88.2
Source: U.S. Census Bureau, Origin of Movement Series.Prepared by the Office of Trade and Economic Analysis, International Trade Administration, U.S. Department of Commerce.

14 NAFTA: A State Export Perspective, 1993–2003
State MerState MerState MerState MerState Merchandise Exporchandise Exporchandise Exporchandise Exporchandise Exporttttt TTTTTotals to NAFTotals to NAFTotals to NAFTotals to NAFTotals to NAFTA MarkA MarkA MarkA MarkA Markets,ets,ets,ets,ets, 11111993–2003993–2003993–2003993–2003993–2003(Ranked by 1993–2003 Dollar Change; Thousands of Dollars)
1993–2003Dollar Percent
Rank State 1993 1994 1997 2000 2001 2002 2003 Change Change1 Texas 23,045,593 27,154,298 37,817,234 58,892,290 52,202,549 51,563,014 52,370,010 29,324,417 127.22 California 12,921,908 14,810,650 21,892,326 31,591,423 28,159,057 26,151,628 26,103,403 13,181,496 102.03 Ohio 8,697,068 9,495,559 13,494,158 16,050,345 15,951,465 17,529,659 18,996,283 10,299,215 118.44 Michigan 18,025,629 20,073,628 24,188,380 23,993,086 22,352,713 24,040,283 23,805,479 5,779,850 32.15 Indiana 3,843,948 4,547,334 6,401,576 9,137,309 7,971,122 8,761,729 9,563,691 5,719,743 148.86 Illinois 6,352,165 7,821,346 10,597,373 14,628,323 13,695,807 10,277,903 10,711,544 4,359,379 68.67 Tennessee 2,405,980 2,874,347 4,018,530 5,786,031 5,497,684 5,366,606 5,689,859 3,283,879 136.58 Georgia 1,905,936 2,304,776 3,494,242 4,678,357 4,698,751 4,729,122 5,124,868 3,218,933 168.99 Pennsylvania 4,243,608 4,858,303 6,682,349 8,502,621 7,094,661 6,793,423 6,961,473 2,717,865 64.0
10 New York 8,061,345 9,065,203 12,023,766 13,003,700 11,611,948 11,119,069 10,746,154 2,684,809 33.311 Wisconsin 2,604,112 3,182,204 3,985,304 4,810,115 4,441,453 4,640,148 5,137,359 2,533,247 97.312 Kentucky 1,473,178 2,280,191 3,480,944 3,954,373 3,387,452 4,120,730 3,942,487 2,469,309 167.613 North Carolina 2,955,564 3,702,971 5,369,716 6,915,731 5,711,293 5,068,160 5,360,045 2,404,481 81.414 South Carolina 1,168,024 1,479,259 2,350,814 3,188,437 3,083,059 3,193,051 3,349,864 2,181,840 186.815 Louisiana 856,344 1,263,185 1,806,895 2,736,345 2,552,433 2,668,425 3,022,986 2,166,642 253.016 Florida 2,202,741 2,222,683 2,688,647 4,222,606 4,282,400 3,770,980 4,182,985 1,980,244 89.917 Arizona 2,411,399 2,997,447 3,274,034 6,142,438 4,917,070 4,211,522 4,360,491 1,949,092 80.818 Missouri 1,903,251 1,916,589 3,737,805 3,389,108 3,190,516 3,809,874 3,828,852 1,925,601 101.219 Washington 2,114,931 2,421,424 3,062,223 3,343,062 3,598,798 3,376,133 3,921,297 1,806,366 85.420 New Jersey 2,929,896 3,455,996 4,497,076 5,270,667 5,020,887 4,567,000 4,587,330 1,657,433 56.621 Iowa 1,104,621 1,443,443 2,021,526 1,928,190 1,954,030 2,072,132 2,540,607 1,435,986 130.022 Alabama 944,738 1,138,185 2,309,986 2,335,566 2,252,795 2,349,622 2,298,789 1,354,051 143.323 Virginia 1,227,615 1,528,661 1,953,922 2,750,128 2,542,995 2,288,304 2,505,014 1,277,399 104.124 Minnesota 2,059,675 2,467,386 2,625,670 2,976,548 3,070,498 3,245,429 3,294,909 1,235,233 60.025 Colorado 776,580 810,187 1,000,975 1,389,698 1,481,487 1,795,840 2,002,142 1,225,562 157.826 Oregon 1,007,110 1,170,206 1,524,550 2,076,588 1,548,942 1,769,549 1,960,893 953,783 94.727 Nebraska 424,274 560,967 752,460 825,220 1,020,920 1,026,082 1,172,935 748,661 176.528 Kansas 887,752 1,123,302 1,602,892 1,926,153 1,764,384 1,935,113 1,622,888 735,136 82.829 West Virginia 292,308 330,918 551,170 677,693 820,519 814,386 840,041 547,734 187.430 Arkansas 554,053 718,510 1,068,356 1,049,391 1,116,148 1,060,448 1,052,317 498,263 89.931 Massachusetts 2,860,389 3,287,163 3,941,748 4,290,118 3,415,421 3,274,284 3,353,228 492,839 17.232 Oklahoma 809,506 862,849 1,092,361 1,479,111 1,112,873 1,125,536 1,275,325 465,819 57.533 Maine 384,127 447,090 625,865 875,824 880,554 820,305 845,176 461,049 120.034 Mississippi 417,050 499,188 568,827 931,991 1,339,571 953,300 840,539 423,489 101.535 Nevada 155,491 173,627 287,912 705,156 705,619 450,900 572,008 416,517 267.936 South Dakota 122,562 154,394 225,592 341,449 326,824 364,986 412,745 290,183 236.837 Utah 392,359 449,802 584,324 707,904 656,747 647,496 655,466 263,108 67.138 New Mexico 114,093 139,265 137,593 260,596 208,116 214,787 359,939 245,845 215.539 Alaska 78,616 132,969 278,549 202,017 270,459 218,251 302,206 223,589 284.440 North Dakota 288,045 289,851 475,588 357,241 431,877 478,689 507,776 219,731 76.341 Idaho 199,899 247,784 349,446 524,801 416,175 355,459 417,505 217,605 108.942 New Hampshire 408,268 421,773 582,848 825,299 675,660 578,006 590,785 182,517 44.743 Wyoming 39,923 60,086 143,779 155,737 165,413 197,930 199,766 159,843 400.444 Connecticut 1,678,401 1,865,466 2,070,090 2,236,142 2,055,341 1,894,352 1,830,300 151,900 9.145 Rhode Island 328,696 303,848 397,901 483,279 421,518 449,909 474,981 146,285 44.546 Maryland 1,151,996 1,276,794 1,040,220 993,942 999,098 1,065,790 1,243,967 91,971 8.047 Montana 172,061 173,540 267,482 352,841 336,708 250,050 232,688 60,627 35.248 Hawaii 21,148 29,765 19,963 32,713 26,200 21,831 20,158 -990 -4.749 Delaware 888,070 1,028,773 1,025,307 1,186,867 959,594 914,533 787,299 -100,771 -11.350 Vermont 2,104,599 2,089,015 2,327,229 2,254,907 1,408,187 1,083,987 1,113,255 -991,343 -47.1
District of Columbia 26,090 120,462 41,165 44,471 40,370 38,603 24,503 -1,586 -6.1Puerto Rico 528,814 835,555 915,839 1,385,931 1,193,206 1,256,459 1,431,473 902,659 170.7Virgin Islands 17,125 23,036 7,075 19,609 70,857 68,473 5,682 -11,443 -66.8Unallocated 9,237,174 10,963,725 13,820,975 19,331,022 20,123,312 17,490,544 18,384,591 9,147,416 99.0UNITED STATES 141,825,850 165,094,982 221,502,581 288,150,510 265,233,537 258,329,827 266,938,356 125,112,506 88.2
Source: U.S. Census Bureau, Origin of Movement Series.Prepared by the Office of Trade and Economic Analysis, International Trade Administration, U.S. Department of Commerce.

NAFTA: A State Export Perspective, 1993–2003 15
State MerState MerState MerState MerState Merchandise Exporchandise Exporchandise Exporchandise Exporchandise Exporttttt TTTTTotals to NAFTotals to NAFTotals to NAFTotals to NAFTotals to NAFTA MarkA MarkA MarkA MarkA Markets,ets,ets,ets,ets, 11111993–2003993–2003993–2003993–2003993–2003(Ranked by 1993–2003 Percentage Change; Thousands of Dollars)
1993–2003Dollar Percent
Rank State 1993 1994 1997 2000 2001 2002 2003 Change Change1 Wyoming 39,923 60,086 143,779 155,737 165,413 197,930 199,766 159,843 400.42 Alaska 78,616 132,969 278,549 202,017 270,459 218,251 302,206 223,589 284.43 Nevada 155,491 173,627 287,912 705,156 705,619 450,900 572,008 416,517 267.94 Louisiana 856,344 1,263,185 1,806,895 2,736,345 2,552,433 2,668,425 3,022,986 2,166,642 253.05 South Dakota 122,562 154,394 225,592 341,449 326,824 364,986 412,745 290,183 236.86 New Mexico 114,093 139,265 137,593 260,596 208,116 214,787 359,939 245,845 215.57 West Virginia 292,308 330,918 551,170 677,693 820,519 814,386 840,041 547,734 187.48 South Carolina 1,168,024 1,479,259 2,350,814 3,188,437 3,083,059 3,193,051 3,349,864 2,181,840 186.89 Nebraska 424,274 560,967 752,460 825,220 1,020,920 1,026,082 1,172,935 748,661 176.5
10 Georgia 1,905,936 2,304,776 3,494,242 4,678,357 4,698,751 4,729,122 5,124,868 3,218,933 168.911 Kentucky 1,473,178 2,280,191 3,480,944 3,954,373 3,387,452 4,120,730 3,942,487 2,469,309 167.612 Colorado 776,580 810,187 1,000,975 1,389,698 1,481,487 1,795,840 2,002,142 1,225,562 157.813 Indiana 3,843,948 4,547,334 6,401,576 9,137,309 7,971,122 8,761,729 9,563,691 5,719,743 148.814 Alabama 944,738 1,138,185 2,309,986 2,335,566 2,252,795 2,349,622 2,298,789 1,354,051 143.315 Tennessee 2,405,980 2,874,347 4,018,530 5,786,031 5,497,684 5,366,606 5,689,859 3,283,879 136.516 Iowa 1,104,621 1,443,443 2,021,526 1,928,190 1,954,030 2,072,132 2,540,607 1,435,986 130.017 Texas 23,045,593 27,154,298 37,817,234 58,892,290 52,202,549 51,563,014 52,370,010 29,324,417 127.218 Maine 384,127 447,090 625,865 875,824 880,554 820,305 845,176 461,049 120.019 Ohio 8,697,068 9,495,559 13,494,158 16,050,345 15,951,465 17,529,659 18,996,283 10,299,215 118.420 Idaho 199,899 247,784 349,446 524,801 416,175 355,459 417,505 217,605 108.921 Virginia 1,227,615 1,528,661 1,953,922 2,750,128 2,542,995 2,288,304 2,505,014 1,277,399 104.122 California 12,921,908 14,810,650 21,892,326 31,591,423 28,159,057 26,151,628 26,103,403 13,181,496 102.023 Mississippi 417,050 499,188 568,827 931,991 1,339,571 953,300 840,539 423,489 101.524 Missouri 1,903,251 1,916,589 3,737,805 3,389,108 3,190,516 3,809,874 3,828,852 1,925,601 101.225 Wisconsin 2,604,112 3,182,204 3,985,304 4,810,115 4,441,453 4,640,148 5,137,359 2,533,247 97.326 Oregon 1,007,110 1,170,206 1,524,550 2,076,588 1,548,942 1,769,549 1,960,893 953,783 94.727 Arkansas 554,053 718,510 1,068,356 1,049,391 1,116,148 1,060,448 1,052,317 498,263 89.928 Florida 2,202,741 2,222,683 2,688,647 4,222,606 4,282,400 3,770,980 4,182,985 1,980,244 89.929 Washington 2,114,931 2,421,424 3,062,223 3,343,062 3,598,798 3,376,133 3,921,297 1,806,366 85.430 Kansas 887,752 1,123,302 1,602,892 1,926,153 1,764,384 1,935,113 1,622,888 735,136 82.831 North Carolina 2,955,564 3,702,971 5,369,716 6,915,731 5,711,293 5,068,160 5,360,045 2,404,481 81.432 Arizona 2,411,399 2,997,447 3,274,034 6,142,438 4,917,070 4,211,522 4,360,491 1,949,092 80.833 North Dakota 288,045 289,851 475,588 357,241 431,877 478,689 507,776 219,731 76.334 Illinois 6,352,165 7,821,346 10,597,373 14,628,323 13,695,807 10,277,903 10,711,544 4,359,379 68.635 Utah 392,359 449,802 584,324 707,904 656,747 647,496 655,466 263,108 67.136 Pennsylvania 4,243,608 4,858,303 6,682,349 8,502,621 7,094,661 6,793,423 6,961,473 2,717,865 64.037 Minnesota 2,059,675 2,467,386 2,625,670 2,976,548 3,070,498 3,245,429 3,294,909 1,235,233 60.038 Oklahoma 809,506 862,849 1,092,361 1,479,111 1,112,873 1,125,536 1,275,325 465,819 57.539 New Jersey 2,929,896 3,455,996 4,497,076 5,270,667 5,020,887 4,567,000 4,587,330 1,657,433 56.640 New Hampshire 408,268 421,773 582,848 825,299 675,660 578,006 590,785 182,517 44.741 Rhode Island 328,696 303,848 397,901 483,279 421,518 449,909 474,981 146,285 44.542 Montana 172,061 173,540 267,482 352,841 336,708 250,050 232,688 60,627 35.243 New York 8,061,345 9,065,203 12,023,766 13,003,700 11,611,948 11,119,069 10,746,154 2,684,809 33.344 Michigan 18,025,629 20,073,628 24,188,380 23,993,086 22,352,713 24,040,283 23,805,479 5,779,850 32.145 Massachusetts 2,860,389 3,287,163 3,941,748 4,290,118 3,415,421 3,274,284 3,353,228 492,839 17.246 Connecticut 1,678,401 1,865,466 2,070,090 2,236,142 2,055,341 1,894,352 1,830,300 151,900 9.147 Maryland 1,151,996 1,276,794 1,040,220 993,942 999,098 1,065,790 1,243,967 91,971 8.048 Hawaii 21,148 29,765 19,963 32,713 26,200 21,831 20,158 -990 -4.749 Delaware 888,070 1,028,773 1,025,307 1,186,867 959,594 914,533 787,299 -100,771 -11.350 Vermont 2,104,599 2,089,015 2,327,229 2,254,907 1,408,187 1,083,987 1,113,255 -991,343 -47.1
District of Columbia 26,090 120,462 41,165 44,471 40,370 38,603 24,503 -1,586 -6.1Puerto Rico 528,814 835,555 915,839 1,385,931 1,193,206 1,256,459 1,431,473 902,659 170.7Virgin Islands 17,125 23,036 7,075 19,609 70,857 68,473 5,682 -11,443 -66.8Unallocated 9,237,174 10,963,725 13,820,975 19,331,022 20,123,312 17,490,544 18,384,591 9,147,416 99.0UNITED STATES 141,825,850 165,094,982 221,502,581 288,150,510 265,233,537 258,329,827 266,938,356 125,112,506 88.2
Source: U.S. Census Bureau, Origin of Movement Series.Prepared by the Office of Trade and Economic Analysis, International Trade Administration, U.S. Department of Commerce.

16 NAFTA: A State Export Perspective, 1993–2003
State MerState MerState MerState MerState Merchandise Exporchandise Exporchandise Exporchandise Exporchandise Exporttttt TTTTTotals to NAFTotals to NAFTotals to NAFTotals to NAFTotals to NAFTA MarkA MarkA MarkA MarkA Marketsetsetsetsetsand the and the and the and the and the WWWWWorld,orld,orld,orld,orld, 11111993–2003993–2003993–2003993–2003993–2003
(Thousands of Dollars)
NAFTA Share, NAFTA Share,State NAFTA 1993 World 1993 Percent NAFTA 2003 World 2003 PercentAlabama 944,738 3,599,371 26.2 2,298,789 8,340,387 27.6Alaska 78,616 2,580,888 3.0 302,206 2,738,558 11.0Arizona 2,411,399 7,079,029 34.1 4,360,491 13,323,392 32.7Arkansas 554,053 1,420,754 39.0 1,052,317 2,962,153 35.5California 12,921,908 62,803,817 20.6 26,103,403 93,994,882 27.8Colorado 776,580 3,253,284 23.9 2,002,142 6,109,121 32.8Connecticut 1,678,401 5,755,346 29.2 1,830,300 8,136,443 22.5Delaware 888,070 1,515,116 58.6 787,299 1,886,118 41.7Florida 2,202,741 15,302,863 14.4 4,182,985 24,953,414 16.8Georgia 1,905,936 7,167,606 26.6 5,124,868 16,286,235 31.5Hawaii 21,148 289,099 7.3 20,158 368,227 5.5Idaho 199,899 1,168,514 17.1 417,505 2,095,799 19.9Illinois 6,352,165 17,041,210 37.3 10,711,544 26,472,902 40.5Indiana 3,843,948 7,331,010 52.4 9,563,691 16,402,279 58.3Iowa 1,104,621 2,796,413 39.5 2,540,607 5,236,296 48.5Kansas 887,752 2,739,576 32.4 1,622,888 4,553,334 35.6Kentucky 1,473,178 4,318,212 34.1 3,942,487 10,733,781 36.7Louisiana 856,344 14,443,285 5.9 3,022,986 18,390,130 16.4Maine 384,127 1,047,043 36.7 845,176 2,188,413 38.6Maryland 1,151,996 4,697,254 24.5 1,243,967 4,940,631 25.2Massachusetts 2,860,389 10,978,380 26.1 3,353,228 18,662,575 18.0Michigan 18,025,629 23,811,558 75.7 23,805,479 32,941,109 72.3Minnesota 2,059,675 6,752,998 30.5 3,294,909 11,265,660 29.2Mississippi 417,050 1,694,992 24.6 840,539 2,558,259 32.9Missouri 1,903,251 3,620,852 52.6 3,828,852 7,233,937 52.9Montana 172,061 275,890 62.4 232,688 361,416 64.4Nebraska 424,274 1,370,208 31.0 1,172,935 2,723,670 43.1Nevada 155,491 561,969 27.7 572,008 2,032,599 28.1New Hampshire 408,268 999,063 40.9 590,785 1,931,412 30.6New Jersey 2,929,896 10,063,411 29.1 4,587,330 16,817,673 27.3New Mexico 114,093 443,003 25.8 359,939 2,325,609 15.5New York 8,061,345 32,548,394 24.8 10,746,154 39,180,708 27.4North Carolina 2,955,564 10,244,540 28.9 5,360,045 16,198,733 33.1North Dakota 288,045 427,637 67.4 507,776 854,072 59.5Ohio 8,697,068 17,803,583 48.9 18,996,283 29,764,418 63.8Oklahoma 809,506 2,173,466 37.2 1,275,325 2,659,603 48.0Oregon 1,007,110 5,511,446 18.3 1,960,893 10,357,199 18.9Pennsylvania 4,243,608 10,903,985 38.9 6,961,473 16,299,212 42.7Rhode Island 328,696 934,567 35.2 474,981 1,177,475 40.3South Carolina 1,168,024 4,614,242 25.3 3,349,864 11,772,894 28.5South Dakota 122,562 265,476 46.2 412,745 672,268 61.4Tennessee 2,405,980 5,800,043 41.5 5,689,859 12,611,793 45.1Texas 23,045,593 47,220,215 48.8 52,370,010 98,846,083 53.0Utah 392,359 2,382,054 16.5 655,466 4,114,540 15.9Vermont 2,104,599 2,551,513 82.5 1,113,255 2,626,922 42.4Virginia 1,227,615 9,307,109 13.2 2,505,014 10,852,981 23.1Washington 2,114,931 27,004,713 7.8 3,921,297 34,172,826 11.5West Virginia 292,308 1,440,399 20.3 840,041 2,379,808 35.3Wisconsin 2,604,112 6,931,352 37.6 5,137,359 11,509,835 44.6Wyoming 39,923 339,456 11.8 199,766 581,636 34.3
District of Columbia 26,090 565,990 4.6 24,503 809,220 3.0Puerto Rico 528,814 4,242,878 12.5 1,431,473 11,913,947 12.0Virgin Islands 17,125 152,022 11.3 5,682 252,719 2.2Unallocated 9,237,174 44,571,234 20.7 18,384,591 35,167,868 52.3UNITED STATES 141,825,850 464,858,327 30.5 266,938,356 723,743,177 36.9
Source: U.S. Census Bureau, Origin of Movement Series.Prepared by the Office of Trade and Economic Analysis, International Trade Administration, U.S. Department of Commerce.

NAFTA: A State Export Perspective, 1993–2003 17
State MerState MerState MerState MerState Merchandise Exporchandise Exporchandise Exporchandise Exporchandise Exporttttt TTTTTotals tootals tootals tootals tootals to NAFT NAFT NAFT NAFT NAFTA MarkA MarkA MarkA MarkA Marketsetsetsetsetsand the and the and the and the and the WWWWWorld,orld,orld,orld,orld, 11111993–2003993–2003993–2003993–2003993–2003
(Ranked by 2003 Exports to NAFTA Region; Thousands of Dollars)
NAFTA Share, NAFTA Share,Rank State NAFTA 1993 World 1993 Percent NAFTA 2003 World 2003 Percent
1 Texas 23,045,593 47,220,215 48.8 52,370,010 98,846,083 53.02 California 12,921,908 62,803,817 20.6 26,103,403 93,994,882 27.83 Michigan 18,025,629 23,811,558 75.7 23,805,479 32,941,109 72.34 Ohio 8,697,068 17,803,583 48.9 18,996,283 29,764,418 63.85 New York 8,061,345 32,548,394 24.8 10,746,154 39,180,708 27.46 Illinois 6,352,165 17,041,210 37.3 10,711,544 26,472,902 40.57 Indiana 3,843,948 7,331,010 52.4 9,563,691 16,402,279 58.38 Pennsylvania 4,243,608 10,903,985 38.9 6,961,473 16,299,212 42.79 Tennessee 2,405,980 5,800,043 41.5 5,689,859 12,611,793 45.1
10 North Carolina 2,955,564 10,244,540 28.9 5,360,045 16,198,733 33.111 Wisconsin 2,604,112 6,931,352 37.6 5,137,359 11,509,835 44.612 Georgia 1,905,936 7,167,606 26.6 5,124,868 16,286,235 31.513 New Jersey 2,929,896 10,063,411 29.1 4,587,330 16,817,673 27.314 Arizona 2,411,399 7,079,029 34.1 4,360,491 13,323,392 32.715 Florida 2,202,741 15,302,863 14.4 4,182,985 24,953,414 16.816 Kentucky 1,473,178 4,318,212 34.1 3,942,487 10,733,781 36.717 Washington 2,114,931 27,004,713 7.8 3,921,297 34,172,826 11.518 Missouri 1,903,251 3,620,852 52.6 3,828,852 7,233,937 52.919 Massachusetts 2,860,389 10,978,380 26.1 3,353,228 18,662,575 18.020 South Carolina 1,168,024 4,614,242 25.3 3,349,864 11,772,894 28.521 Minnesota 2,059,675 6,752,998 30.5 3,294,909 11,265,660 29.222 Louisiana 856,344 14,443,285 5.9 3,022,986 18,390,130 16.423 Iowa 1,104,621 2,796,413 39.5 2,540,607 5,236,296 48.524 Virginia 1,227,615 9,307,109 13.2 2,505,014 10,852,981 23.125 Alabama 944,738 3,599,371 26.2 2,298,789 8,340,387 27.626 Colorado 776,580 3,253,284 23.9 2,002,142 6,109,121 32.827 Oregon 1,007,110 5,511,446 18.3 1,960,893 10,357,199 18.928 Connecticut 1,678,401 5,755,346 29.2 1,830,300 8,136,443 22.529 Kansas 887,752 2,739,576 32.4 1,622,888 4,553,334 35.630 Oklahoma 809,506 2,173,466 37.2 1,275,325 2,659,603 48.031 Maryland 1,151,996 4,697,254 24.5 1,243,967 4,940,631 25.232 Nebraska 424,274 1,370,208 31.0 1,172,935 2,723,670 43.133 Vermont 2,104,599 2,551,513 82.5 1,113,255 2,626,922 42.434 Arkansas 554,053 1,420,754 39.0 1,052,317 2,962,153 35.535 Maine 384,127 1,047,043 36.7 845,176 2,188,413 38.636 Mississippi 417,050 1,694,992 24.6 840,539 2,558,259 32.937 West Virginia 292,308 1,440,399 20.3 840,041 2,379,808 35.338 Delaware 888,070 1,515,116 58.6 787,299 1,886,118 41.739 Utah 392,359 2,382,054 16.5 655,466 4,114,540 15.940 New Hampshire 408,268 999,063 40.9 590,785 1,931,412 30.641 Nevada 155,491 561,969 27.7 572,008 2,032,599 28.142 North Dakota 288,045 427,637 67.4 507,776 854,072 59.543 Rhode Island 328,696 934,567 35.2 474,981 1,177,475 40.344 Idaho 199,899 1,168,514 17.1 417,505 2,095,799 19.945 South Dakota 122,562 265,476 46.2 412,745 672,268 61.446 New Mexico 114,093 443,003 25.8 359,939 2,325,609 15.547 Alaska 78,616 2,580,888 3.0 302,206 2,738,558 11.048 Montana 172,061 275,890 62.4 232,688 361,416 64.449 Wyoming 39,923 339,456 11.8 199,766 581,636 34.350 Hawaii 21,148 289,099 7.3 20,158 368,227 5.5
District of Columbia 26,090 565,990 4.6 24,503 809,220 3.0Puerto Rico 528,814 4,242,878 12.5 1,431,473 11,913,947 12.0Virgin Islands 17,125 152,022 11.3 5,682 252,719 2.2Unallocated 9,237,174 44,571,234 20.7 18,384,591 35,167,868 52.3UNITED STATES 141,825,850 464,858,327 30.5 266,938,356 723,743,177 36.9
Source: U.S. Census Bureau, Origin of Movement Series.Prepared by the Office of Trade and Economic Analysis, International Trade Administration, U.S. Department of Commerce.

18 NAFTA: A State Export Perspective, 1993–2003
State MerState MerState MerState MerState Merchandise Exporchandise Exporchandise Exporchandise Exporchandise Exporttttt TTTTTotals to NAFTotals to NAFTotals to NAFTotals to NAFTotals to NAFTA MarkA MarkA MarkA MarkA Markets and the ets and the ets and the ets and the ets and the WWWWWorld,orld,orld,orld,orld, 11111993–2003993–2003993–2003993–2003993–2003(Ranked by NAFTA Region’s Share of Total Exports, 2003; Thousands of Dollars)
NAFTA Share, NAFTA Share,Rank State NAFTA 1993 World 1993 Percent NAFTA 2003 World 2003 Percent
1 Michigan 18,025,629 23,811,558 75.7 23,805,479 32,941,109 72.32 Montana 172,061 275,890 62.4 232,688 361,416 64.43 Ohio 8,697,068 17,803,583 48.9 18,996,283 29,764,418 63.84 South Dakota 122,562 265,476 46.2 412,745 672,268 61.45 North Dakota 288,045 427,637 67.4 507,776 854,072 59.56 Indiana 3,843,948 7,331,010 52.4 9,563,691 16,402,279 58.37 Texas 23,045,593 47,220,215 48.8 52,370,010 98,846,083 53.08 Missouri 1,903,251 3,620,852 52.6 3,828,852 7,233,937 52.99 Iowa 1,104,621 2,796,413 39.5 2,540,607 5,236,296 48.5
10 Oklahoma 809,506 2,173,466 37.2 1,275,325 2,659,603 48.011 Tennessee 2,405,980 5,800,043 41.5 5,689,859 12,611,793 45.112 Wisconsin 2,604,112 6,931,352 37.6 5,137,359 11,509,835 44.613 Nebraska 424,274 1,370,208 31.0 1,172,935 2,723,670 43.114 Pennsylvania 4,243,608 10,903,985 38.9 6,961,473 16,299,212 42.715 Vermont 2,104,599 2,551,513 82.5 1,113,255 2,626,922 42.416 Delaware 888,070 1,515,116 58.6 787,299 1,886,118 41.717 Illinois 6,352,165 17,041,210 37.3 10,711,544 26,472,902 40.518 Rhode Island 328,696 934,567 35.2 474,981 1,177,475 40.319 Maine 384,127 1,047,043 36.7 845,176 2,188,413 38.620 Kentucky 1,473,178 4,318,212 34.1 3,942,487 10,733,781 36.721 Kansas 887,752 2,739,576 32.4 1,622,888 4,553,334 35.622 Arkansas 554,053 1,420,754 39.0 1,052,317 2,962,153 35.523 West Virginia 292,308 1,440,399 20.3 840,041 2,379,808 35.324 Wyoming 39,923 339,456 11.8 199,766 581,636 34.325 North Carolina 2,955,564 10,244,540 28.9 5,360,045 16,198,733 33.126 Mississippi 417,050 1,694,992 24.6 840,539 2,558,259 32.927 Colorado 776,580 3,253,284 23.9 2,002,142 6,109,121 32.828 Arizona 2,411,399 7,079,029 34.1 4,360,491 13,323,392 32.729 Georgia 1,905,936 7,167,606 26.6 5,124,868 16,286,235 31.530 New Hampshire 408,268 999,063 40.9 590,785 1,931,412 30.631 Minnesota 2,059,675 6,752,998 30.5 3,294,909 11,265,660 29.232 South Carolina 1,168,024 4,614,242 25.3 3,349,864 11,772,894 28.533 Nevada 155,491 561,969 27.7 572,008 2,032,599 28.134 California 12,921,908 62,803,817 20.6 26,103,403 93,994,882 27.835 Alabama 944,738 3,599,371 26.2 2,298,789 8,340,387 27.636 New York 8,061,345 32,548,394 24.8 10,746,154 39,180,708 27.437 New Jersey 2,929,896 10,063,411 29.1 4,587,330 16,817,673 27.338 Maryland 1,151,996 4,697,254 24.5 1,243,967 4,940,631 25.239 Virginia 1,227,615 9,307,109 13.2 2,505,014 10,852,981 23.140 Connecticut 1,678,401 5,755,346 29.2 1,830,300 8,136,443 22.541 Idaho 199,899 1,168,514 17.1 417,505 2,095,799 19.942 Oregon 1,007,110 5,511,446 18.3 1,960,893 10,357,199 18.943 Massachusetts 2,860,389 10,978,380 26.1 3,353,228 18,662,575 18.044 Florida 2,202,741 15,302,863 14.4 4,182,985 24,953,414 16.845 Louisiana 856,344 14,443,285 5.9 3,022,986 18,390,130 16.446 Utah 392,359 2,382,054 16.5 655,466 4,114,540 15.947 New Mexico 114,093 443,003 25.8 359,939 2,325,609 15.548 Washington 2,114,931 27,004,713 7.8 3,921,297 34,172,826 11.549 Alaska 78,616 2,580,888 3.0 302,206 2,738,558 11.050 Hawaii 21,148 289,099 7.3 20,158 368,227 5.5
District of Columbia 26,090 565,990 4.6 24,503 809,220 3.0Puerto Rico 528,814 4,242,878 12.5 1,431,473 11,913,947 12.0Virgin Islands 17,125 152,022 11.3 5,682 252,719 2.2Unallocated 9,237,174 44,571,234 20.7 18,384,591 35,167,868 52.3UNITED STATES 141,825,850 464,858,327 30.5 266,938,356 723,743,177 36.9
Source: U.S. Census Bureau, Origin of Movement Series.Prepared by the Office of Trade and Economic Analysis, International Trade Administration, U.S. Department of Commerce.

NAFTA: A State Export Perspective, 1993–2003 19
State MerState MerState MerState MerState Merchandise Exporchandise Exporchandise Exporchandise Exporchandise Exporttttt TTTTTotals to Mexico andotals to Mexico andotals to Mexico andotals to Mexico andotals to Mexico and the NAFT the NAFT the NAFT the NAFT the NAFTA Region as a A Region as a A Region as a A Region as a A Region as a WholeWholeWholeWholeWhole,,,,, 11111993–2003993–2003993–2003993–2003993–2003
(Thousands of Dollars)
State Mexico 1993 NAFTA 1993 Mexico Share Mexico 2003 NAFTA 2003 Mexico ShareAlabama 187,637 944,738 19.9 751,402 2,298,789 32.7Alaska 4,775 78,616 6.1 71,682 302,206 23.7Arizona 1,898,896 2,411,399 78.7 3,229,462 4,360,491 74.1Arkansas 99,699 554,053 18.0 244,903 1,052,317 23.3California 5,943,980 12,921,908 46.0 14,871,836 26,103,403 57.0Colorado 147,188 776,580 19.0 570,428 2,002,142 28.5Connecticut 304,052 1,678,401 18.1 478,003 1,830,300 26.1Delaware 131,861 888,070 14.8 254,317 787,299 32.3Florida 646,817 2,202,741 29.4 1,814,458 4,182,985 43.4Georgia 376,425 1,905,936 19.8 1,163,241 5,124,868 22.7Hawaii 1,384 21,148 6.5 515 20,158 2.6Idaho 36,500 199,899 18.3 55,649 417,505 13.3Illinois 1,090,603 6,352,165 17.2 2,152,722 10,711,544 20.1Indiana 349,802 3,843,948 9.1 2,105,233 9,563,691 22.0Iowa 144,414 1,104,621 13.1 669,932 2,540,607 26.4Kansas 268,274 887,752 30.2 602,032 1,622,888 37.1Kentucky 184,737 1,473,178 12.5 518,087 3,942,487 13.1Louisiana 446,119 856,344 52.1 1,776,102 3,022,986 58.8Maine 17,862 384,127 4.7 24,135 845,176 2.9Maryland 67,572 1,151,996 5.9 300,782 1,243,967 24.2Massachusetts 288,322 2,860,389 10.1 711,767 3,353,228 21.2Michigan 1,254,781 18,025,629 7.0 4,006,426 23,805,479 16.8Minnesota 223,330 2,059,675 10.8 393,394 3,294,909 11.9Mississippi 84,434 417,050 20.2 256,252 840,539 30.5Missouri 367,323 1,903,251 19.3 748,317 3,828,852 19.5Montana 12,412 172,061 7.2 11,205 232,688 4.8Nebraska 103,571 424,274 24.4 472,448 1,172,935 40.3Nevada 24,670 155,491 15.9 104,465 572,008 18.3New Hampshire 37,344 408,268 9.1 84,803 590,785 14.4New Jersey 460,441 2,929,896 15.7 830,801 4,587,330 18.1New Mexico 74,349 114,093 65.2 242,018 359,939 67.2New York 816,052 8,061,345 10.1 1,704,740 10,746,154 15.9North Carolina 470,682 2,955,564 15.9 1,463,759 5,360,045 27.3North Dakota 15,308 288,045 5.3 32,216 507,776 6.3Ohio 695,738 8,697,068 8.0 2,101,867 18,996,283 11.1Oklahoma 164,751 809,506 20.4 221,105 1,275,325 17.3Oregon 121,034 1,007,110 12.0 393,618 1,960,893 20.1Pennsylvania 614,535 4,243,608 14.5 1,112,059 6,961,473 16.0Rhode Island 31,128 328,696 9.5 66,879 474,981 14.1South Carolina 138,206 1,168,024 11.8 751,857 3,349,864 22.4South Dakota 4,610 122,562 3.8 123,932 412,745 30.0Tennessee 439,734 2,405,980 18.3 1,475,631 5,689,859 25.9Texas 18,973,381 23,045,593 82.3 41,561,359 52,370,010 79.4Utah 50,393 392,359 12.8 111,216 655,466 17.0Vermont 21,561 2,104,599 1.0 34,180 1,113,255 3.1Virginia 176,229 1,227,615 14.4 398,995 2,505,014 15.9Washington 298,768 2,114,931 14.1 607,417 3,921,297 15.5West Virginia 34,155 292,308 11.7 80,579 840,041 9.6Wisconsin 274,035 2,604,112 10.5 788,033 5,137,359 15.3Wyoming 6,912 39,923 17.3 62,644 199,766 31.4
District of Columbia 5,730 26,090 22.0 7,983 24,503 32.6Puerto Rico 122,155 528,814 23.1 218,744 1,431,473 15.3Virgin Islands 2,694 17,125 15.7 5,392 5,682 94.9Unallocated 2,878,131 9,237,174 31.2 4,616,396 18,384,591 25.1UNITED STATES 41,635,494 141,825,850 29.4 97,457,420 266,938,356 36.5
Source: U.S. Census Bureau, Origin of Movement Series.Prepared by the Office of Trade and Economic Analysis, International Trade Administration, U.S. Department of Commerce.

20 NAFTA: A State Export Perspective, 1993–2003
State MerState MerState MerState MerState Merchandise Exporchandise Exporchandise Exporchandise Exporchandise Exporttttt TTTTTotals to Mexico andotals to Mexico andotals to Mexico andotals to Mexico andotals to Mexico andthe NAFTthe NAFTthe NAFTthe NAFTthe NAFTA Region as a A Region as a A Region as a A Region as a A Region as a WholeWholeWholeWholeWhole,,,,, 11111993–2003993–2003993–2003993–2003993–2003
(Ranked by 2003 Mexico Share of Total Exports to NAFTA; Thousands of Dollars)
Mexico Share, Mexico Share,Rank State Mexico 1993 NAFTA 1993 Percent Mexico 2003 NAFTA 2003 Percent
1 Texas 18,973,381 23,045,593 82.3 41,561,359 52,370,010 79.42 Arizona 1,898,896 2,411,399 78.7 3,229,462 4,360,491 74.13 New Mexico 74,349 114,093 65.2 242,018 359,939 67.24 Louisiana 446,119 856,344 52.1 1,776,102 3,022,986 58.85 California 5,943,980 12,921,908 46.0 14,871,836 26,103,403 57.06 Florida 646,817 2,202,741 29.4 1,814,458 4,182,985 43.47 Nebraska 103,571 424,274 24.4 472,448 1,172,935 40.38 Kansas 268,274 887,752 30.2 602,032 1,622,888 37.19 Alabama 187,637 944,738 19.9 751,402 2,298,789 32.7
10 Delaware 131,861 888,070 14.8 254,317 787,299 32.311 Wyoming 6,912 39,923 17.3 62,644 199,766 31.412 Mississippi 84,434 417,050 20.2 256,252 840,539 30.513 South Dakota 4,610 122,562 3.8 123,932 412,745 30.014 Colorado 147,188 776,580 19.0 570,428 2,002,142 28.515 North Carolina 470,682 2,955,564 15.9 1,463,759 5,360,045 27.316 Iowa 144,414 1,104,621 13.1 669,932 2,540,607 26.417 Connecticut 304,052 1,678,401 18.1 478,003 1,830,300 26.118 Tennessee 439,734 2,405,980 18.3 1,475,631 5,689,859 25.919 Maryland 67,572 1,151,996 5.9 300,782 1,243,967 24.220 Alaska 4,775 78,616 6.1 71,682 302,206 23.721 Arkansas 99,699 554,053 18.0 244,903 1,052,317 23.322 Georgia 376,425 1,905,936 19.8 1,163,241 5,124,868 22.723 South Carolina 138,206 1,168,024 11.8 751,857 3,349,864 22.424 Indiana 349,802 3,843,948 9.1 2,105,233 9,563,691 22.025 Massachusetts 288,322 2,860,389 10.1 711,767 3,353,228 21.226 Illinois 1,090,603 6,352,165 17.2 2,152,722 10,711,544 20.127 Oregon 121,034 1,007,110 12.0 393,618 1,960,893 20.128 Missouri 367,323 1,903,251 19.3 748,317 3,828,852 19.529 Nevada 24,670 155,491 15.9 104,465 572,008 18.330 New Jersey 460,441 2,929,896 15.7 830,801 4,587,330 18.131 Oklahoma 164,751 809,506 20.4 221,105 1,275,325 17.332 Utah 50,393 392,359 12.8 111,216 655,466 17.033 Michigan 1,254,781 18,025,629 7.0 4,006,426 23,805,479 16.834 Pennsylvania 614,535 4,243,608 14.5 1,112,059 6,961,473 16.035 Virginia 176,229 1,227,615 14.4 398,995 2,505,014 15.936 New York 816,052 8,061,345 10.1 1,704,740 10,746,154 15.937 Washington 298,768 2,114,931 14.1 607,417 3,921,297 15.538 Wisconsin 274,035 2,604,112 10.5 788,033 5,137,359 15.339 New Hampshire 37,344 408,268 9.1 84,803 590,785 14.440 Rhode Island 31,128 328,696 9.5 66,879 474,981 14.141 Idaho 36,500 199,899 18.3 55,649 417,505 13.342 Kentucky 184,737 1,473,178 12.5 518,087 3,942,487 13.143 Minnesota 223,330 2,059,675 10.8 393,394 3,294,909 11.944 Ohio 695,738 8,697,068 8.0 2,101,867 18,996,283 11.145 West Virginia 34,155 292,308 11.7 80,579 840,041 9.646 North Dakota 15,308 288,045 5.3 32,216 507,776 6.347 Montana 12,412 172,061 7.2 11,205 232,688 4.848 Vermont 21,561 2,104,599 1.0 34,180 1,113,255 3.149 Maine 17,862 384,127 4.7 24,135 845,176 2.950 Hawaii 1,384 21,148 6.5 515 20,158 2.6
District of Columbia 5,730 26,090 22.0 7,983 24,503 32.6Puerto Rico 122,155 528,814 23.1 218,744 1,431,473 15.3Virgin Islands 2,694 17,125 15.7 5,392 5,682 94.9Unallocated 2,878,131 9,237,174 31.2 4,616,396 18,384,591 25.1UNITED STATES 41,635,494 141,825,850 29.4 97,457,420 266,938,356 36.5
Source: U.S. Census Bureau, Origin of Movement Series.Prepared by the Office of Trade and Economic Analysis, International Trade Administration, U.S. Department of Commerce.
NAFTA: A State Export Perspective, 1993–2003 21
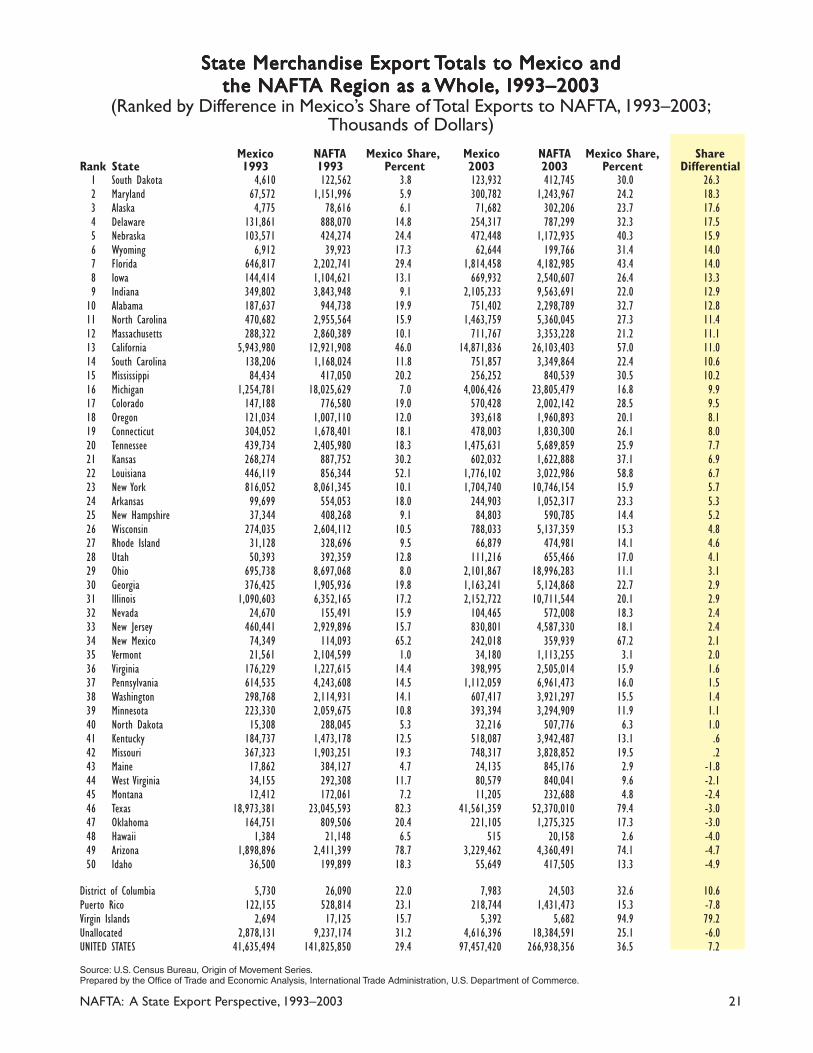
State MerState MerState MerState MerState Merchandise Exporchandise Exporchandise Exporchandise Exporchandise Exporttttt TTTTTotals to Mexico andotals to Mexico andotals to Mexico andotals to Mexico andotals to Mexico andthe NAFTthe NAFTthe NAFTthe NAFTthe NAFTA Region as a A Region as a A Region as a A Region as a A Region as a WholeWholeWholeWholeWhole,,,,, 11111993–2003993–2003993–2003993–2003993–2003
(Ranked by Difference in Mexico’s Share of Total Exports to NAFTA, 1993–2003;Thousands of Dollars)
Mexico NAFTA Mexico Share, Mexico NAFTA Mexico Share, ShareRank State 1993 1993 Percent 2003 2003 Percent Differential
1 South Dakota 4,610 122,562 3.8 123,932 412,745 30.0 26.32 Maryland 67,572 1,151,996 5.9 300,782 1,243,967 24.2 18.33 Alaska 4,775 78,616 6.1 71,682 302,206 23.7 17.64 Delaware 131,861 888,070 14.8 254,317 787,299 32.3 17.55 Nebraska 103,571 424,274 24.4 472,448 1,172,935 40.3 15.96 Wyoming 6,912 39,923 17.3 62,644 199,766 31.4 14.07 Florida 646,817 2,202,741 29.4 1,814,458 4,182,985 43.4 14.08 Iowa 144,414 1,104,621 13.1 669,932 2,540,607 26.4 13.39 Indiana 349,802 3,843,948 9.1 2,105,233 9,563,691 22.0 12.9
10 Alabama 187,637 944,738 19.9 751,402 2,298,789 32.7 12.811 North Carolina 470,682 2,955,564 15.9 1,463,759 5,360,045 27.3 11.412 Massachusetts 288,322 2,860,389 10.1 711,767 3,353,228 21.2 11.113 California 5,943,980 12,921,908 46.0 14,871,836 26,103,403 57.0 11.014 South Carolina 138,206 1,168,024 11.8 751,857 3,349,864 22.4 10.615 Mississippi 84,434 417,050 20.2 256,252 840,539 30.5 10.216 Michigan 1,254,781 18,025,629 7.0 4,006,426 23,805,479 16.8 9.917 Colorado 147,188 776,580 19.0 570,428 2,002,142 28.5 9.518 Oregon 121,034 1,007,110 12.0 393,618 1,960,893 20.1 8.119 Connecticut 304,052 1,678,401 18.1 478,003 1,830,300 26.1 8.020 Tennessee 439,734 2,405,980 18.3 1,475,631 5,689,859 25.9 7.721 Kansas 268,274 887,752 30.2 602,032 1,622,888 37.1 6.922 Louisiana 446,119 856,344 52.1 1,776,102 3,022,986 58.8 6.723 New York 816,052 8,061,345 10.1 1,704,740 10,746,154 15.9 5.724 Arkansas 99,699 554,053 18.0 244,903 1,052,317 23.3 5.325 New Hampshire 37,344 408,268 9.1 84,803 590,785 14.4 5.226 Wisconsin 274,035 2,604,112 10.5 788,033 5,137,359 15.3 4.827 Rhode Island 31,128 328,696 9.5 66,879 474,981 14.1 4.628 Utah 50,393 392,359 12.8 111,216 655,466 17.0 4.129 Ohio 695,738 8,697,068 8.0 2,101,867 18,996,283 11.1 3.130 Georgia 376,425 1,905,936 19.8 1,163,241 5,124,868 22.7 2.931 Illinois 1,090,603 6,352,165 17.2 2,152,722 10,711,544 20.1 2.932 Nevada 24,670 155,491 15.9 104,465 572,008 18.3 2.433 New Jersey 460,441 2,929,896 15.7 830,801 4,587,330 18.1 2.434 New Mexico 74,349 114,093 65.2 242,018 359,939 67.2 2.135 Vermont 21,561 2,104,599 1.0 34,180 1,113,255 3.1 2.036 Virginia 176,229 1,227,615 14.4 398,995 2,505,014 15.9 1.637 Pennsylvania 614,535 4,243,608 14.5 1,112,059 6,961,473 16.0 1.538 Washington 298,768 2,114,931 14.1 607,417 3,921,297 15.5 1.439 Minnesota 223,330 2,059,675 10.8 393,394 3,294,909 11.9 1.140 North Dakota 15,308 288,045 5.3 32,216 507,776 6.3 1.041 Kentucky 184,737 1,473,178 12.5 518,087 3,942,487 13.1 .642 Missouri 367,323 1,903,251 19.3 748,317 3,828,852 19.5 .243 Maine 17,862 384,127 4.7 24,135 845,176 2.9 -1.844 West Virginia 34,155 292,308 11.7 80,579 840,041 9.6 -2.145 Montana 12,412 172,061 7.2 11,205 232,688 4.8 -2.446 Texas 18,973,381 23,045,593 82.3 41,561,359 52,370,010 79.4 -3.047 Oklahoma 164,751 809,506 20.4 221,105 1,275,325 17.3 -3.048 Hawaii 1,384 21,148 6.5 515 20,158 2.6 -4.049 Arizona 1,898,896 2,411,399 78.7 3,229,462 4,360,491 74.1 -4.750 Idaho 36,500 199,899 18.3 55,649 417,505 13.3 -4.9
District of Columbia 5,730 26,090 22.0 7,983 24,503 32.6 10.6Puerto Rico 122,155 528,814 23.1 218,744 1,431,473 15.3 -7.8Virgin Islands 2,694 17,125 15.7 5,392 5,682 94.9 79.2Unallocated 2,878,131 9,237,174 31.2 4,616,396 18,384,591 25.1 -6.0UNITED STATES 41,635,494 141,825,850 29.4 97,457,420 266,938,356 36.5 7.2
Source: U.S. Census Bureau, Origin of Movement Series.Prepared by the Office of Trade and Economic Analysis, International Trade Administration, U.S. Department of Commerce.

22 NAFTA: A State Export Perspective, 1993–2003
State MerState MerState MerState MerState Merchandise Exporchandise Exporchandise Exporchandise Exporchandise Exporttttt TTTTTotals to Canada and Mexicootals to Canada and Mexicootals to Canada and Mexicootals to Canada and Mexicootals to Canada and Mexico,,,,, 11111993–2003993–2003993–2003993–2003993–2003(Thousands of Dollars)
Canada Canada Dollar Percent Mexico Mexico Dollar PercentState 1993 2003 Change Change 1993 2003 Change ChangeAlabama 757,101 1,547,388 790,286 104.4 187,637 751,402 563,765 300.5Alaska 73,842 230,523 156,682 212.2 4,775 71,682 66,908 1,401.3Arizona 512,503 1,131,030 618,526 120.7 1,898,896 3,229,462 1,330,566 70.1Arkansas 454,355 807,413 353,059 77.7 99,699 244,903 145,205 145.6California 6,977,927 11,231,567 4,253,639 61.0 5,943,980 14,871,836 8,927,856 150.2Colorado 629,391 1,431,714 802,322 127.5 147,188 570,428 423,240 287.6Connecticut 1,374,349 1,352,298 -22,051 -1.6 304,052 478,003 173,951 57.2Delaware 756,209 532,982 -223,227 -29.5 131,861 254,317 122,456 92.9Florida 1,555,924 2,368,527 812,603 52.2 646,817 1,814,458 1,167,641 180.5Georgia 1,529,511 3,961,627 2,432,116 159.0 376,425 1,163,241 786,816 209.0Hawaii 19,764 19,643 -121 -.6 1,384 515 -869 -62.8Idaho 163,399 361,855 198,456 121.5 36,500 55,649 19,149 52.5Illinois 5,261,562 8,558,822 3,297,260 62.7 1,090,603 2,152,722 1,062,119 97.4Indiana 3,494,146 7,458,458 3,964,312 113.5 349,802 2,105,233 1,755,431 501.8Iowa 960,208 1,870,676 910,468 94.8 144,414 669,932 525,518 363.9Kansas 619,478 1,020,855 401,377 64.8 268,274 602,032 333,758 124.4Kentucky 1,288,442 3,424,399 2,135,958 165.8 184,737 518,087 333,351 180.4Louisiana 410,224 1,246,884 836,659 204.0 446,119 1,776,102 1,329,983 298.1Maine 366,265 821,041 454,776 124.2 17,862 24,135 6,273 35.1Maryland 1,084,425 943,185 -141,240 -13.0 67,572 300,782 233,210 345.1Massachusetts 2,572,066 2,641,461 69,394 2.7 288,322 711,767 423,445 146.9Michigan 16,770,849 19,799,054 3,028,205 18.1 1,254,781 4,006,426 2,751,645 219.3Minnesota 1,836,345 2,901,515 1,065,170 58.0 223,330 393,394 170,064 76.1Mississippi 332,616 584,287 251,672 75.7 84,434 256,252 171,817 203.5Missouri 1,535,929 3,080,535 1,544,607 100.6 367,323 748,317 380,994 103.7Montana 159,649 221,483 61,834 38.7 12,412 11,205 -1,207 -9.7Nebraska 320,703 700,487 379,784 118.4 103,571 472,448 368,877 356.2Nevada 130,821 467,543 336,722 257.4 24,670 104,465 79,795 323.4New Hampshire 370,924 505,982 135,058 36.4 37,344 84,803 47,459 127.1New Jersey 2,469,455 3,756,529 1,287,073 52.1 460,441 830,801 370,360 80.4New Mexico 39,744 117,921 78,176 196.7 74,349 242,018 167,669 225.5New York 7,245,293 9,041,414 1,796,121 24.8 816,052 1,704,740 888,687 108.9North Carolina 2,484,882 3,896,286 1,411,404 56.8 470,682 1,463,759 993,078 211.0North Dakota 272,737 475,560 202,823 74.4 15,308 32,216 16,908 110.5Ohio 8,001,330 16,894,415 8,893,086 111.1 695,738 2,101,867 1,406,129 202.1Oklahoma 644,755 1,054,221 409,465 63.5 164,751 221,105 56,354 34.2Oregon 886,076 1,567,275 681,199 76.9 121,034 393,618 272,585 225.2Pennsylvania 3,629,073 5,849,414 2,220,341 61.2 614,535 1,112,059 497,524 81.0Rhode Island 297,569 408,102 110,533 37.1 31,128 66,879 35,752 114.9South Carolina 1,029,818 2,598,006 1,568,189 152.3 138,206 751,857 613,651 444.0South Dakota 117,952 288,812 170,860 144.9 4,610 123,932 119,323 2,588.6Tennessee 1,966,246 4,214,228 2,247,981 114.3 439,734 1,475,631 1,035,897 235.6Texas 4,072,212 10,808,651 6,736,439 165.4 18,973,381 41,561,359 22,587,978 119.1Utah 341,965 544,251 202,285 59.2 50,393 111,216 60,823 120.7Vermont 2,083,038 1,079,076 -1,003,962 -48.2 21,561 34,180 12,619 58.5Virginia 1,051,386 2,106,019 1,054,633 100.3 176,229 398,995 222,766 126.4Washington 1,816,163 3,313,881 1,497,718 82.5 298,768 607,417 308,648 103.3West Virginia 258,152 759,463 501,311 194.2 34,155 80,579 46,423 135.9Wisconsin 2,330,077 4,349,326 2,019,250 86.7 274,035 788,033 513,997 187.6Wyoming 33,011 137,122 104,111 315.4 6,912 62,644 55,732 806.3
District of Columbia 20,360 16,520 -3,840 -18.9 5,730 7,983 2,253 39.3Puerto Rico 406,659 1,212,729 806,070 198.2 122,155 218,744 96,589 79.1Virgin Islands 14,431 290 -14,141 -98.0 2,694 5,392 2,698 100.1Unallocated 6,359,044 13,768,194 7,409,150 116.5 2,878,131 4,616,396 1,738,266 60.4UNITED STATES 100,190,356 169,480,937 69,290,581 69.2 41,635,494 97,457,420 55,821,925 134.1
Source: U.S. Census Bureau, Origin of Movement Series.Prepared by the Office of Trade and Economic Analysis, International Trade Administration, U.S. Department of Commerce.

NAFTA: A State Export Perspective, 1993–2003 23
State MerState MerState MerState MerState Merchandise Exporchandise Exporchandise Exporchandise Exporchandise Exporttttt TTTTTotals to Canada and Mexicootals to Canada and Mexicootals to Canada and Mexicootals to Canada and Mexicootals to Canada and Mexico,,,,, 1993–2003 1993–2003 1993–2003 1993–2003 1993–2003(Ranked by 2003 Exports to Canada; Thousands of Dollars)
Canada Canada Dollar Percent Mexico Mexico Dollar PercentRank State 1993 2003 Change Change 1993 2003 Change Change
1 Michigan 16,770,849 19,799,054 3,028,205 18.1 1,254,781 4,006,426 2,751,645 219.32 Ohio 8,001,330 16,894,415 8,893,086 111.1 695,738 2,101,867 1,406,129 202.13 California 6,977,927 11,231,567 4,253,639 61.0 5,943,980 14,871,836 8,927,856 150.24 Texas 4,072,212 10,808,651 6,736,439 165.4 18,973,381 41,561,359 22,587,978 119.15 New York 7,245,293 9,041,414 1,796,121 24.8 816,052 1,704,740 888,687 108.96 Illinois 5,261,562 8,558,822 3,297,260 62.7 1,090,603 2,152,722 1,062,119 97.47 Indiana 3,494,146 7,458,458 3,964,312 113.5 349,802 2,105,233 1,755,431 501.88 Pennsylvania 3,629,073 5,849,414 2,220,341 61.2 614,535 1,112,059 497,524 81.09 Wisconsin 2,330,077 4,349,326 2,019,250 86.7 274,035 788,033 513,997 187.6
10 Tennessee 1,966,246 4,214,228 2,247,981 114.3 439,734 1,475,631 1,035,897 235.611 Georgia 1,529,511 3,961,627 2,432,116 159.0 376,425 1,163,241 786,816 209.012 North Carolina 2,484,882 3,896,286 1,411,404 56.8 470,682 1,463,759 993,078 211.013 New Jersey 2,469,455 3,756,529 1,287,073 52.1 460,441 830,801 370,360 80.414 Kentucky 1,288,442 3,424,399 2,135,958 165.8 184,737 518,087 333,351 180.415 Washington 1,816,163 3,313,881 1,497,718 82.5 298,768 607,417 308,648 103.316 Missouri 1,535,929 3,080,535 1,544,607 100.6 367,323 748,317 380,994 103.717 Minnesota 1,836,345 2,901,515 1,065,170 58.0 223,330 393,394 170,064 76.118 Massachusetts 2,572,066 2,641,461 69,394 2.7 288,322 711,767 423,445 146.919 South Carolina 1,029,818 2,598,006 1,568,189 152.3 138,206 751,857 613,651 444.020 Florida 1,555,924 2,368,527 812,603 52.2 646,817 1,814,458 1,167,641 180.521 Virginia 1,051,386 2,106,019 1,054,633 100.3 176,229 398,995 222,766 126.422 Iowa 960,208 1,870,676 910,468 94.8 144,414 669,932 525,518 363.923 Oregon 886,076 1,567,275 681,199 76.9 121,034 393,618 272,585 225.224 Alabama 757,101 1,547,388 790,286 104.4 187,637 751,402 563,765 300.525 Colorado 629,391 1,431,714 802,322 127.5 147,188 570,428 423,240 287.626 Connecticut 1,374,349 1,352,298 -22,051 -1.6 304,052 478,003 173,951 57.227 Louisiana 410,224 1,246,884 836,659 204.0 446,119 1,776,102 1,329,983 298.128 Arizona 512,503 1,131,030 618,526 120.7 1,898,896 3,229,462 1,330,566 70.129 Vermont 2,083,038 1,079,076 -1,003,962 -48.2 21,561 34,180 12,619 58.530 Oklahoma 644,755 1,054,221 409,465 63.5 164,751 221,105 56,354 34.231 Kansas 619,478 1,020,855 401,377 64.8 268,274 602,032 333,758 124.432 Maryland 1,084,425 943,185 -141,240 -13.0 67,572 300,782 233,210 345.133 Maine 366,265 821,041 454,776 124.2 17,862 24,135 6,273 35.134 Arkansas 454,355 807,413 353,059 77.7 99,699 244,903 145,205 145.635 West Virginia 258,152 759,463 501,311 194.2 34,155 80,579 46,423 135.936 Nebraska 320,703 700,487 379,784 118.4 103,571 472,448 368,877 356.237 Mississippi 332,616 584,287 251,672 75.7 84,434 256,252 171,817 203.538 Utah 341,965 544,251 202,285 59.2 50,393 111,216 60,823 120.739 Delaware 756,209 532,982 -223,227 -29.5 131,861 254,317 122,456 92.940 New Hampshire 370,924 505,982 135,058 36.4 37,344 84,803 47,459 127.141 North Dakota 272,737 475,560 202,823 74.4 15,308 32,216 16,908 110.542 Nevada 130,821 467,543 336,722 257.4 24,670 104,465 79,795 323.443 Rhode Island 297,569 408,102 110,533 37.1 31,128 66,879 35,752 114.944 Idaho 163,399 361,855 198,456 121.5 36,500 55,649 19,149 52.545 South Dakota 117,952 288,812 170,860 144.9 4,610 123,932 119,323 2,588.646 Alaska 73,842 230,523 156,682 212.2 4,775 71,682 66,908 1,401.347 Montana 159,649 221,483 61,834 38.7 12,412 11,205 -1,207 -9.748 Wyoming 33,011 137,122 104,111 315.4 6,912 62,644 55,732 806.349 New Mexico 39,744 117,921 78,176 196.7 74,349 242,018 167,669 225.550 Hawaii 19,764 19,643 -121 -.6 1,384 515 -869 -62.8
District of Columbia 20,360 16,520 -3,840 -18.9 5,730 7,983 2,253 39.3Puerto Rico 406,659 1,212,729 806,070 198.2 122,155 218,744 96,589 79.1Virgin Islands 14,431 290 -14,141 -98.0 2,694 5,392 2,698 100.1Unallocated 6,359,044 13,768,194 7,409,150 116.5 2,878,131 4,616,396 1,738,266 60.4UNITED STATES 100,190,356 169,480,937 69,290,581 69.2 41,635,494 97,457,420 55,821,925 134.1
Source: U.S. Census Bureau, Origin of Movement Series.Prepared by the Office of Trade and Economic Analysis, International Trade Administration, U.S. Department of Commerce.

24 NAFTA: A State Export Perspective, 1993–2003
State MerState MerState MerState MerState Merchandise Exporchandise Exporchandise Exporchandise Exporchandise Exporttttt TTTTTotals to Canada and Mexicootals to Canada and Mexicootals to Canada and Mexicootals to Canada and Mexicootals to Canada and Mexico,,,,, 11111993–2003993–2003993–2003993–2003993–2003(Ranked by 2003 Exports to Mexico; Thousands of Dollars)
Canada Canada Dollar Percent Mexico Mexico Dollar PercentRank State 1993 2003 Change Change 1993 2003 Change Change1 Texas 4,072,212 10,808,651 6,736,439 165.4 18,973,381 41,561,359 22,587,978 119.12 California 6,977,927 11,231,567 4,253,639 61.0 5,943,980 14,871,836 8,927,856 150.23 Michigan 16,770,849 19,799,054 3,028,205 18.1 1,254,781 4,006,426 2,751,645 219.34 Arizona 512,503 1,131,030 618,526 120.7 1,898,896 3,229,462 1,330,566 70.15 Illinois 5,261,562 8,558,822 3,297,260 62.7 1,090,603 2,152,722 1,062,119 97.46 Indiana 3,494,146 7,458,458 3,964,312 113.5 349,802 2,105,233 1,755,431 501.87 Ohio 8,001,330 16,894,415 8,893,086 111.1 695,738 2,101,867 1,406,129 202.18 Florida 1,555,924 2,368,527 812,603 52.2 646,817 1,814,458 1,167,641 180.59 Louisiana 410,224 1,246,884 836,659 204.0 446,119 1,776,102 1,329,983 298.1
10 New York 7,245,293 9,041,414 1,796,121 24.8 816,052 1,704,740 888,687 108.911 Tennessee 1,966,246 4,214,228 2,247,981 114.3 439,734 1,475,631 1,035,897 235.612 North Carolina 2,484,882 3,896,286 1,411,404 56.8 470,682 1,463,759 993,078 211.013 Georgia 1,529,511 3,961,627 2,432,116 159.0 376,425 1,163,241 786,816 209.014 Pennsylvania 3,629,073 5,849,414 2,220,341 61.2 614,535 1,112,059 497,524 81.015 New Jersey 2,469,455 3,756,529 1,287,073 52.1 460,441 830,801 370,360 80.416 Wisconsin 2,330,077 4,349,326 2,019,250 86.7 274,035 788,033 513,997 187.617 South Carolina 1,029,818 2,598,006 1,568,189 152.3 138,206 751,857 613,651 444.018 Alabama 757,101 1,547,388 790,286 104.4 187,637 751,402 563,765 300.519 Missouri 1,535,929 3,080,535 1,544,607 100.6 367,323 748,317 380,994 103.720 Massachusetts 2,572,066 2,641,461 69,394 2.7 288,322 711,767 423,445 146.921 Iowa 960,208 1,870,676 910,468 94.8 144,414 669,932 525,518 363.922 Washington 1,816,163 3,313,881 1,497,718 82.5 298,768 607,417 308,648 103.323 Kansas 619,478 1,020,855 401,377 64.8 268,274 602,032 333,758 124.424 Colorado 629,391 1,431,714 802,322 127.5 147,188 570,428 423,240 287.625 Kentucky 1,288,442 3,424,399 2,135,958 165.8 184,737 518,087 333,351 180.426 Connecticut 1,374,349 1,352,298 -22,051 -1.6 304,052 478,003 173,951 57.227 Nebraska 320,703 700,487 379,784 118.4 103,571 472,448 368,877 356.228 Virginia 1,051,386 2,106,019 1,054,633 100.3 176,229 398,995 222,766 126.429 Oregon 886,076 1,567,275 681,199 76.9 121,034 393,618 272,585 225.230 Minnesota 1,836,345 2,901,515 1,065,170 58.0 223,330 393,394 170,064 76.131 Maryland 1,084,425 943,185 -141,240 -13.0 67,572 300,782 233,210 345.132 Mississippi 332,616 584,287 251,672 75.7 84,434 256,252 171,817 203.533 Delaware 756,209 532,982 -223,227 -29.5 131,861 254,317 122,456 92.934 Arkansas 454,355 807,413 353,059 77.7 99,699 244,903 145,205 145.635 New Mexico 39,744 117,921 78,176 196.7 74,349 242,018 167,669 225.536 Oklahoma 644,755 1,054,221 409,465 63.5 164,751 221,105 56,354 34.237 South Dakota 117,952 288,812 170,860 144.9 4,610 123,932 119,323 2,588.638 Utah 341,965 544,251 202,285 59.2 50,393 111,216 60,823 120.739 Nevada 130,821 467,543 336,722 257.4 24,670 104,465 79,795 323.440 New Hampshire 370,924 505,982 135,058 36.4 37,344 84,803 47,459 127.141 West Virginia 258,152 759,463 501,311 194.2 34,155 80,579 46,423 135.942 Alaska 73,842 230,523 156,682 212.2 4,775 71,682 66,908 1,401.343 Rhode Island 297,569 408,102 110,533 37.1 31,128 66,879 35,752 114.944 Wyoming 33,011 137,122 104,111 315.4 6,912 62,644 55,732 806.345 Idaho 163,399 361,855 198,456 121.5 36,500 55,649 19,149 52.546 Vermont 2,083,038 1,079,076 -1,003,962 -48.2 21,561 34,180 12,619 58.547 North Dakota 272,737 475,560 202,823 74.4 15,308 32,216 16,908 110.548 Maine 366,265 821,041 454,776 124.2 17,862 24,135 6,273 35.149 Montana 159,649 221,483 61,834 38.7 12,412 11,205 -1,207 -9.750 Hawaii 19,764 19,643 -121 -.6 1,384 515 -869 -62.8
District of Columbia 20,360 16,520 -3,840 -18.9 5,730 7,983 2,253 39.3Puerto Rico 406,659 1,212,729 806,070 198.2 122,155 218,744 96,589 79.1Virgin Islands 14,431 290 -14,141 -98.0 2,694 5,392 2,698 100.1Unallocated 6,359,044 13,768,194 7,409,150 116.5 2,878,131 4,616,396 1,738,266 60.4UNITED STATES 100,190,356 169,480,937 69,290,581 69.2 41,635,494 97,457,420 55,821,925 134.1
Source: U.S. Census Bureau, Origin of Movement Series.Prepared by the Office of Trade and Economic Analysis, International Trade Administration, U.S. Department of Commerce.

NAFTA: A State Export Perspective, 1993–2003 25
Data NotesAll state export statistics in this report are drawn from the CensusBureau’s Origin of Movement (OM) state export series. The OM series isbased on information supplied by U.S. exporters on official ShippersExport Declarations (SEDs) for goods leaving the United States. Allstatistics in the OM series are on a free-alongside-ship (f.a.s.) basis andinclude both domestic exports and re-exports.
The OM series seeks to measure state exports on the basis of transpor-tation origin—i.e., the location from which exports begin their journey tothe port (or other point) of exit from the United States.
The OM series covers exports of merchandise only. Exports of servicesare excluded from the data. Also, OM statistics are available only at thestate level. There are currently no equivalent figures for exports bymetropolitan areas, counties, zip codes, or other sub-state areas.
Similarly, no OM statistics are available for state-level imports. The collec-tion of state import data presents enormous technical challenges, since itwould require tracking foreign goods through the U.S. wholesale and retaildistribution systems. Consequently, it is not currently possible—using OMdata or any other U.S. trade data—to calculate state trade balances.
The Origin of Movement series covers direct exports only. A directexport is one consisting of final goods shipped to a destination outsidethe United States. So-called indirect exports are excluded from the data.Indirect exports are typically intermediate goods, parts, or other inputsthat are shipped within the United States, and subsequently incorporatedin final export goods. Such shipments represent domestic transactions—they are not considered exports in U.S. trade statistics.
Also, cross-border shipments made by foreign affiliates of U.S. companies(e.g., a shipment from a French subsidiary to a German customer) are notU.S. exports. These transactions may affect the finances of U.S. firms andreflect a global business strategy, but they are not exports. Exports in-clude only goods and services that are outbound from the United Statesand which transit its borders.
The OM series was not designed to measure the state distribution of U.S.export production or export-related jobs. The focus is transportationorigin, not manufacturing origin.
There are nonetheless many cases when the state origin of movementand the state of production happen to be the same. The origin of move-ment and origin of production often coincide because many manufactur-ers ship exports directly from the factory gate, or from a nearbydistribution facility.
There is no listing of states for which the Origin of Movement series is agood proxy for export production. Additional research is needed in this area.As a general rule, however, it appears that the OM series is indicative ofexport production when (1) intermediaries are minor exporters in a state,(2) manufacturers—especially single-establishment firms—dominate exports,and (3) the state is a known producer of the goods being exported.
The OM series in some cases will show considerable manufacturedexports from states known to have little manufacturing capability. This ispartly attributable to export marketing by in-state intermediaries. These

26 NAFTA: A State Export Perspective, 1993–2003
exporters frequently ship manufactures produced by out-of-state suppli-ers from in-state distribution centers. Another factor is shipments ofmanufactures from in-state warehouses and other distribution centersthat are arranged by exporters located out-of-state. In both cases,manufactured exports from the non-industrial state are magnified on anorigin-of-movement basis.
Another limitation of the OM series is that, in certain cases, it falls shortof its goal of measuring transportation origin. The problem stems fromthe fact that many intermediaries have traditionally listed the state inwhich they are located—which is not necessarily the origin of move-ment—as the "state of origin" on SEDs. For many other transactions,intermediaries specify the state location of the port of exit—which veryoften is not the state where goods began their export journey.
The result is significant inconsistencies in the state-level allocation ofexports sold by intermediaries. The primary impact is on the statedistribution of non-manufactured exports—where intermediaries areoverwhelmingly dominant. Most affected is the allocation of exports offarm products, minerals, and other bulk commodities—virtually all ofwhich are sold abroad by intermediaries. The impact on manufacturedexports is much more limited, due to the fact that intermediaries ac-count for only about one-third of U.S. exports of manufactures.
The most visible result of the problem is a tendency to understateexports from agricultural states and inflate exports from states havingports that handle high-value shipments of farm products (e.g., Louisiana).
Yet another data issue is that some shippers fail to fill in the "state oforigin" block on the SED, or furnish invalid or illegible entries. Conse-quently, the Census Bureau is presently unable to determine the stateorigin of movement for about five percent of the value of U.S. exports.
For additional information on the Origin of Movement series, visit theCensus Bureau’s website athttp://www.census.gov/foreign-trade/aip/elom.html .
Data Notes

NAFTA: A State Export Perspective, 1993–2003 27

28 NAFTA: A State Export Perspective, 1993–2003


![y S ; ]I 0yÑD Ë ³ P Ê „고체 리튬 이차... · y S ; ] I 0 y Ñ D Ë ³ P Ê Ý ì d  y S I 0 y Ñ y S I 0 y Ñ "MM 4PMJE 4UBUF #BUUFSZ × I À ² ¸ z à y Ñ D ³ ¿](https://static.fdocuments.net/doc/165x107/605c1655c590b0369f51c55c/y-s-i-0yd-p-e-e-y-s-i-0-y-d-p.jpg)