5-13_Satisfaction Level of the First Thai-Laos Friendship Bridge and Cross-Border Transportation...
12
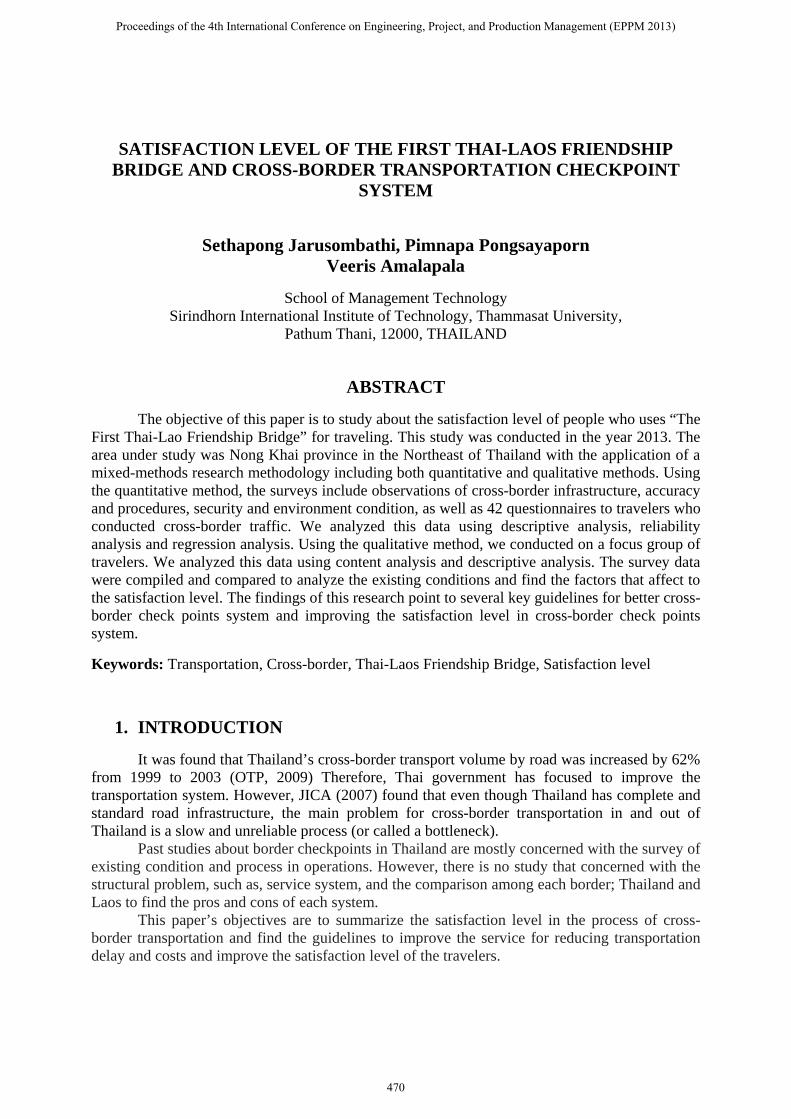
SATISFACTION LEVEL OF THE FIRST THAI-LAOS FRIENDSHIP BRIDGE AND CROSS-BORDER TRANSPORTATION CHECKPOINT SYSTEM Sethapong Jarusombathi, Pimnapa Pongsayaporn Veeris Amalapala School of Management Technology Sirindhorn International Institute of Technology, Thammasat University, Pathum Thani, 12000, THAILAND ABSTRACT The objective of this paper is to study about the satisfaction level of people who uses “The First Thai-Lao Friendship Bridge” for traveling. This study was conducted in the year 2013. The area under study was Nong Khai province in the Northeast of Thailand with the application of a mixed-methods research methodology including both quantitative and qualitative methods. Using the quantitative method, the surveys include observations of cross-border infrastructure, accuracy and procedures, security and environment condition, as well as 42 questionnaires to travelers who conducted cross-border traffic. We analyzed this data using descriptive analysis, reliability analysis and regression analysis. Using the qualitative method, we conducted on a focus group of travelers. We analyzed this data using content analysis and descriptive analysis. The survey data were compiled and compared to analyze the existing conditions and find the factors that affect to the satisfaction level. The findings of this research point to several key guidelines for better cross- border check points system and improving the satisfaction level in cross-border check points system. Keywords: Transportation, Cross-border, Thai-Laos Friendship Bridge, Satisfaction level 1. INTRODUCTION It was found that Thailand’s cross-border transport volume by road was increased by 62% from 1999 to 2003 (OTP, 2009) Therefore, Thai government has focused to improve the transportation system. However, JICA (2007) found that even though Thailand has complete and standard road infrastructure, the main problem for cross-border transportation in and out of Thailand is a slow and unreliable process (or called a bottleneck). Past studies about border checkpoints in Thailand are mostly concerned with the survey of existing condition and process in operations. However, there is no study that concerned with the structural problem, such as, service system, and the comparison among each border; Thailand and Laos to find the pros and cons of each system. This paper’s objectives are to summarize the satisfaction level in the process of cross- border transportation and find the guidelines to improve the service for reducing transportation delay and costs and improve the satisfaction level of the travelers. Proceedings of the 4th International Conference on Engineering, Project, and Production Management (EPPM 2013) 470
-
Upload
sethapong-jarusombathi -
Category
Documents
-
view
116 -
download
4
Transcript of 5-13_Satisfaction Level of the First Thai-Laos Friendship Bridge and Cross-Border Transportation...
SATISFACTION LEVEL OF THE FIRST THAI-LAOS FRIENDSHIP BRIDGE AND CROSS-BORDER TRANSPORTATION CHECKPOINT
SYSTEM
Sethapong Jarusombathi, Pimnapa Pongsayaporn
Veeris Amalapala
School of Management Technology Sirindhorn International Institute of Technology, Thammasat University,
Pathum Thani, 12000, THAILAND
ABSTRACT
The objective of this paper is to study about the satisfaction level of people who uses “The First Thai-Lao Friendship Bridge” for traveling. This study was conducted in the year 2013. The area under study was Nong Khai province in the Northeast of Thailand with the application of a mixed-methods research methodology including both quantitative and qualitative methods. Using the quantitative method, the surveys include observations of cross-border infrastructure, accuracy and procedures, security and environment condition, as well as 42 questionnaires to travelers who conducted cross-border traffic. We analyzed this data using descriptive analysis, reliability analysis and regression analysis. Using the qualitative method, we conducted on a focus group of travelers. We analyzed this data using content analysis and descriptive analysis. The survey data were compiled and compared to analyze the existing conditions and find the factors that affect to the satisfaction level. The findings of this research point to several key guidelines for better cross-border check points system and improving the satisfaction level in cross-border check points system.
Keywords: Transportation, Cross-border, Thai-Laos Friendship Bridge, Satisfaction level
1. INTRODUCTION
It was found that Thailand’s cross-border transport volume by road was increased by 62% from 1999 to 2003 (OTP, 2009) Therefore, Thai government has focused to improve the transportation system. However, JICA (2007) found that even though Thailand has complete and standard road infrastructure, the main problem for cross-border transportation in and out of Thailand is a slow and unreliable process (or called a bottleneck).
Past studies about border checkpoints in Thailand are mostly concerned with the survey of existing condition and process in operations. However, there is no study that concerned with the structural problem, such as, service system, and the comparison among each border; Thailand and Laos to find the pros and cons of each system.
This paper’s objectives are to summarize the satisfaction level in the process of cross-border transportation and find the guidelines to improve the service for reducing transportation delay and costs and improve the satisfaction level of the travelers.
Proceedings of the 4th International Conference on Engineering, Project, and Production Management (EPPM 2013)
470
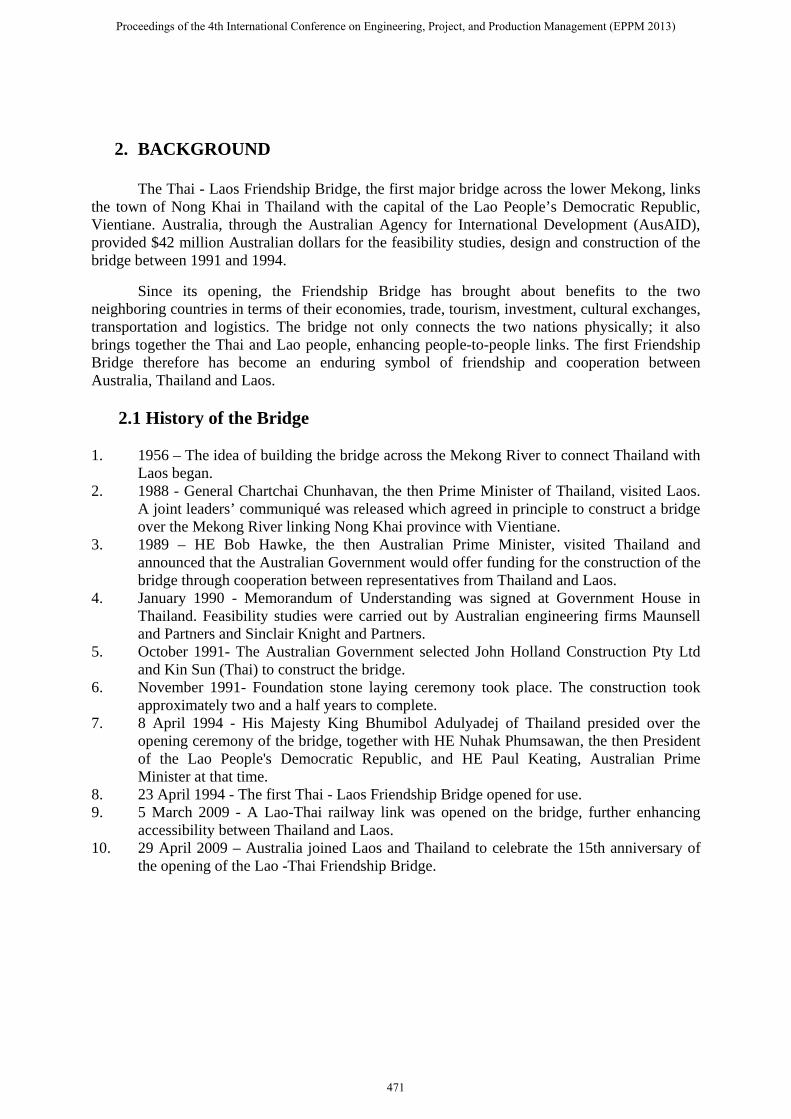
2. BACKGROUND The Thai - Laos Friendship Bridge, the first major bridge across the lower Mekong, links the town of Nong Khai in Thailand with the capital of the Lao People’s Democratic Republic, Vientiane. Australia, through the Australian Agency for International Development (AusAID), provided $42 million Australian dollars for the feasibility studies, design and construction of the bridge between 1991 and 1994.
Since its opening, the Friendship Bridge has brought about benefits to the two neighboring countries in terms of their economies, trade, tourism, investment, cultural exchanges, transportation and logistics. The bridge not only connects the two nations physically; it also brings together the Thai and Lao people, enhancing people-to-people links. The first Friendship Bridge therefore has become an enduring symbol of friendship and cooperation between Australia, Thailand and Laos.
2.1 History of the Bridge
1. 1956 – The idea of building the bridge across the Mekong River to connect Thailand with Laos began.
2. 1988 - General Chartchai Chunhavan, the then Prime Minister of Thailand, visited Laos. A joint leaders’ communiqué was released which agreed in principle to construct a bridge over the Mekong River linking Nong Khai province with Vientiane.
3. 1989 – HE Bob Hawke, the then Australian Prime Minister, visited Thailand and announced that the Australian Government would offer funding for the construction of the bridge through cooperation between representatives from Thailand and Laos.
4. January 1990 - Memorandum of Understanding was signed at Government House in Thailand. Feasibility studies were carried out by Australian engineering firms Maunsell and Partners and Sinclair Knight and Partners.
5. October 1991- The Australian Government selected John Holland Construction Pty Ltd and Kin Sun (Thai) to construct the bridge.
6. November 1991- Foundation stone laying ceremony took place. The construction took approximately two and a half years to complete.
7. 8 April 1994 - His Majesty King Bhumibol Adulyadej of Thailand presided over the opening ceremony of the bridge, together with HE Nuhak Phumsawan, the then President of the Lao People's Democratic Republic, and HE Paul Keating, Australian Prime Minister at that time.
8. 23 April 1994 - The first Thai - Laos Friendship Bridge opened for use. 9. 5 March 2009 - A Lao-Thai railway link was opened on the bridge, further enhancing
accessibility between Thailand and Laos. 10. 29 April 2009 – Australia joined Laos and Thailand to celebrate the 15th anniversary of
the opening of the Lao -Thai Friendship Bridge.
Proceedings of the 4th International Conference on Engineering, Project, and Production Management (EPPM 2013)
471
2.2 Construction Details
With a length of 1170 metres, the bridge has two 3.5 metre wide road lanes, two 1.5 metre wide footpaths and a single metre gauge railway line running down the centre. The bridge is supported by six foundations in the river bed, each 105 metres apart. Two additional foundations support the bridge at either end. Fifteen columns provide support along the edge of both sides of the bridge, eight on the Thai side and seven on the Lao side.
Traffic on the Thailand-side of the bridge drives on the left, while traffic in Laos drives on the right. The changeover at the Lao end of the bridge, just before the border post, is controlled by traffic lights. Architectural elements and lighting were key features of the design, which also addressed an extreme 43 foot (13 meter) seasonal variation in river level together with significant ship impact forces.
2.3 Economic Contributions
The first Thai - Laos Friendship Bridge is significant in fostering the economic development of and strengthening good relations between the two countries. It facilitates the transport of commodities which previously depended on a ferry system and provides access to a deep sea port for Laos in Thailand. The bridge remains a focal point for trade and a symbol of Australian commitment to the development in the region.
Before the opening of the bridge, total value of imports and exports (fiscal year 1993) through Nong Khai Customs House, was 3.6 billion baht. A year later, the value had increased by 34 per cent to 4.8 billion baht and to 5.3 billion baht in the following year. The latest statistics for fiscal year 2011 show the value of the imports and exports at 43 billion baht.
In terms of transport, there were 13,518 vehicles arriving and 13455 departing via Thai-Laos Friendship Bridge Boundary Post in fiscal year 1994. The number increased dramatically in 1995 after the bridge was opened with 47,293 vehicles arriving and 48,658 vehicles departing. In fiscal year 2011, 419,659 vehicles arrived and 424,841 vehicles departed via the boundary post.
In relation to people, in the fiscal year 1994, there were 55,085 people crossing the border through Nong Khai Boundary Post into Thailand and 50,100 crossing out. In 1995, the number rose to 293,126 arrivals and 292,462 departures. In 2011, there were 2,713,495 arrivals and 2,657,100 departures.
Proceedings of the 4th International Conference on Engineering, Project, and Production Management (EPPM 2013)
472
3. LITERATURE REVIEW
There are several researches about cross-border transportation; however, these researches were regarding transportation of goods in a macro picture. None of previous research has done a detailed study of the whole process as a specific system for evaluate the satisfaction level of the travelers. The past studies regarding this issue are as follows:
GIGA (2011) studied the physical setting of Thai-Lao border facilities, and explores the actual local effects on traders’ activities, highlighting changes in gender roles and perceptions of entrepreneurial competition participated in by women in the two research sites.
WCJ (2010) introduced the Greater Mekong Subregion (GMS) cooperation program and its effort to facilitate the movement of goods, people and vehicles across borders to enhance economic integration between member countries.
The Clue Institute (2012) studied the management strategies being used in the Thai–Laotian border trade regarding satisfaction with the border-trade management strategy of the Thai government by using factor analysis to analyze the variables that affect Thai–Laotian border trade.
ESCAP (2012) analyzed the solutions available for efficient cross-border transport in terms of improving operations, lowering operating costs and reducing the time spent at the border. It provides both suggestions for private sector operators, and recommendations for the public sector on how private business arrangements can be supported to provide models for efficient border crossing which do not replace international facilitation agreements, but rather offers a way to develop trade and transport while the countries work towards reducing non-physical barriers.
As a result, these papers are thus used as a guideline for data collection and methodology in this research.
Proceedings of the 4th International Conference on Engineering, Project, and Production Management (EPPM 2013)
473

CROSS BORDER PROCEDURE
For Departure
Step 1: Immigration document validation
Passengers with passport, passengers filled up the immigration form and present it to the passport’s check point.
Passengers without passport, passengers go to make a temporary passport at the tourist information center. Then, filled up the immigration form and present it to the passport’s check point.
Passengers with/without passport with car, driver and passengers present the necessary document in the immigration booth for vehicle. Moreover, Lao’s car needs to sign the custom clearance form and give to the custom officer
Step 2: Crossing method
Passengers without car, passengers buy the bus ticket (located after immigration check point) for cross to Lao.
Passengers with car, passenger drive to the toll fee booth and pay for the bridge fee.
For Arrival
Step 1: Immigration document validation
Passengers without car, passenger receives Thai’s immigration form at the passport’s check point (Process 1). After filled the form, bring passport and form to the immigration’s check point (Process 2).
Passengers with car, passenger parks the car at the parking lot and do the process as passenger without car. Then, passenger declares the car documents at customs check point (Process 3).
4. SURVEY METHODOLOGY
Attitudinal survey is the survey’s method that we apply for this study. Linkert scale (0 to 5) has been used to measure the satisfaction in each question. The survey can break down into five factors, which are, “Convenience and fastness of the officers”, “Security in/around the service area”, “Environmental of the service area” and “Accuracy and efficiently of the payment system”. The survey included of 24 questions and 2 opinion questions.
4.1 Data Collection
Most of the participants in the survey are Laos. Since we have an opportunity to conduct the interview for only two days (Saturday and Sunday), the most crowded area is the arrival’s immigration check point before noon. There are two steps for collecting the survey:
1. Explain the rights of participant and ask for their permission. 2. Explain the survey question by question.
Proceedings of the 4th International Conference on Engineering, Project, and Production Management (EPPM 2013)
474
After fin
4.2 Dat
4.2.1 DOtmvaiu
4.2.2 RRcydics
4.2.3 LLbgpaY
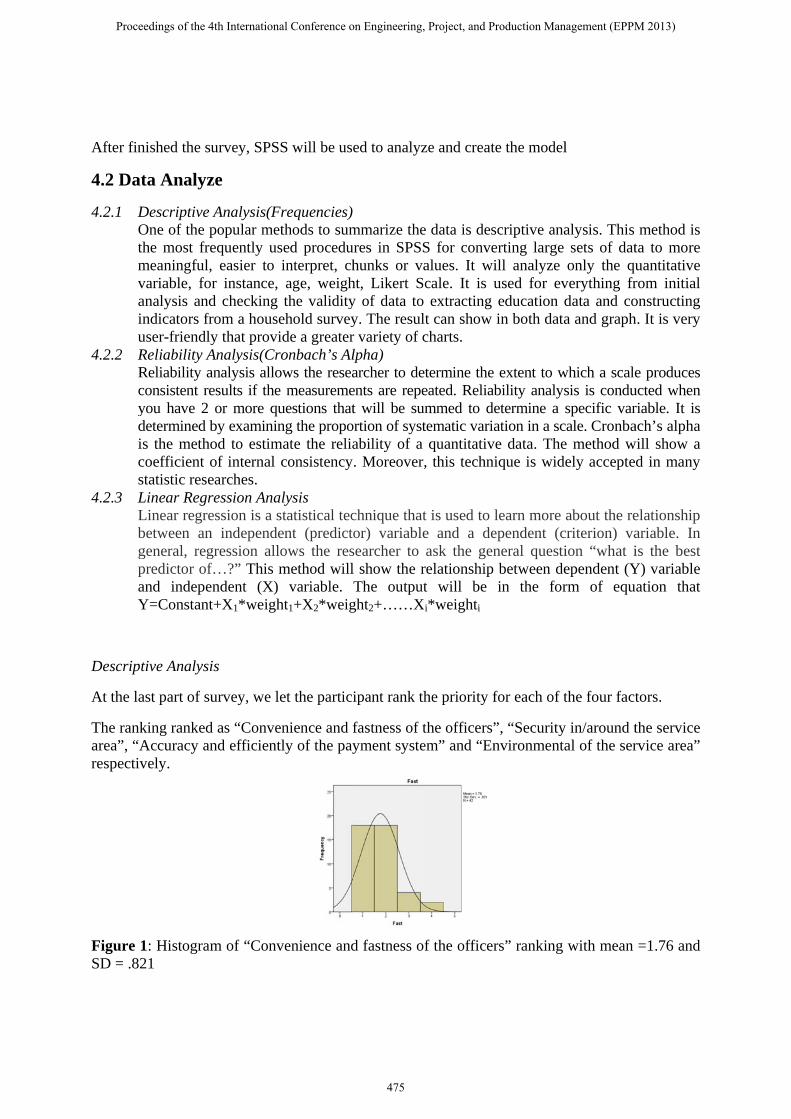
Descript
At the la
The rankarea”, “Arespectiv
Figure 1SD = .82
nished the su
ta Analyz
Descriptive One of the pthe most fremeaningful,variable, foranalysis andindicators fruser-friendlyReliability AReliability aconsistent reyou have 2 determined bis the methocoefficient ostatistic reseLinear RegrLinear regrebetween angeneral, regpredictor ofand indepeY=Constant
tive Analysi
ast part of su
king rankedAccuracy anvely.
1: Histogram21
urvey, SPSS
ze
Analysis(Frpopular metequently us easier to ir instance, d checking rom a housey that providAnalysis(Croanalysis allowesults if the or more qu
by examininod to estimof internal cearches. ression Analession is a stn independegression allof…?” This mndent (X) t+X1*weigh
is
urvey, we le
d as “Convennd efficientl
m of “Conv
S will be us
requencies) thods to sumed proceduinterpret, chage, weighthe validity
ehold surveyde a greateronbach’s Alws the reseameasureme
uestions thatng the propoate the reliaconsistency
lysis tatistical tec
ent (predictows the resmethod will
variable. ht1+X2*weig
et the partici
nience and fly of the pay
venience and
ed to analyz
mmarize theures in SPSShunks or vaht, Likert Sy of data toy. The resulr variety of clpha) archer to deents are repet will be su
ortion of systability of a . Moreover
chnique thator) variable
searcher to l show the rThe output
ght2+……X
ipant rank th
fastness of tyment syste
d fastness o
ze and creat
e data is desS for convealues. It wicale. It is u extracting lt can show charts.
etermine the eated. Reliab
ummed to detematic variaquantitativ
, this techni
t is used to e and a deask the gen
relationship t will be
Xi*weighti
he priority f
the officers”em” and “En
f the officer
te the model
scriptive anaerting large ill analyze used for eveducation din both data
extent to wbility analysetermine a ation in a sc
ve data. Theique is wid
learn more ependent (cneral questibetween dein the for
for each of t
”, “Securitynvironmenta
rs” ranking
l
alysis. This sets of datonly the qu
verything frdata and coa and graph
which a scalesis is conduspecific var
cale. Cronbae method wely accepte
about the recriterion) vaion “what iependent (Yrm of equ
the four fact
y in/around tal of the ser
with mean
method is ta to more uantitative rom initial onstructing h. It is very
e produces ucted when riable. It is ach’s alpha
will show a d in many
elationship ariable. In is the best Y) variable ation that
tors.
the service rvice area”
=1.76 and
Proceedings of the 4th International Conference on Engineering, Project, and Production Management (EPPM 2013)
475
.
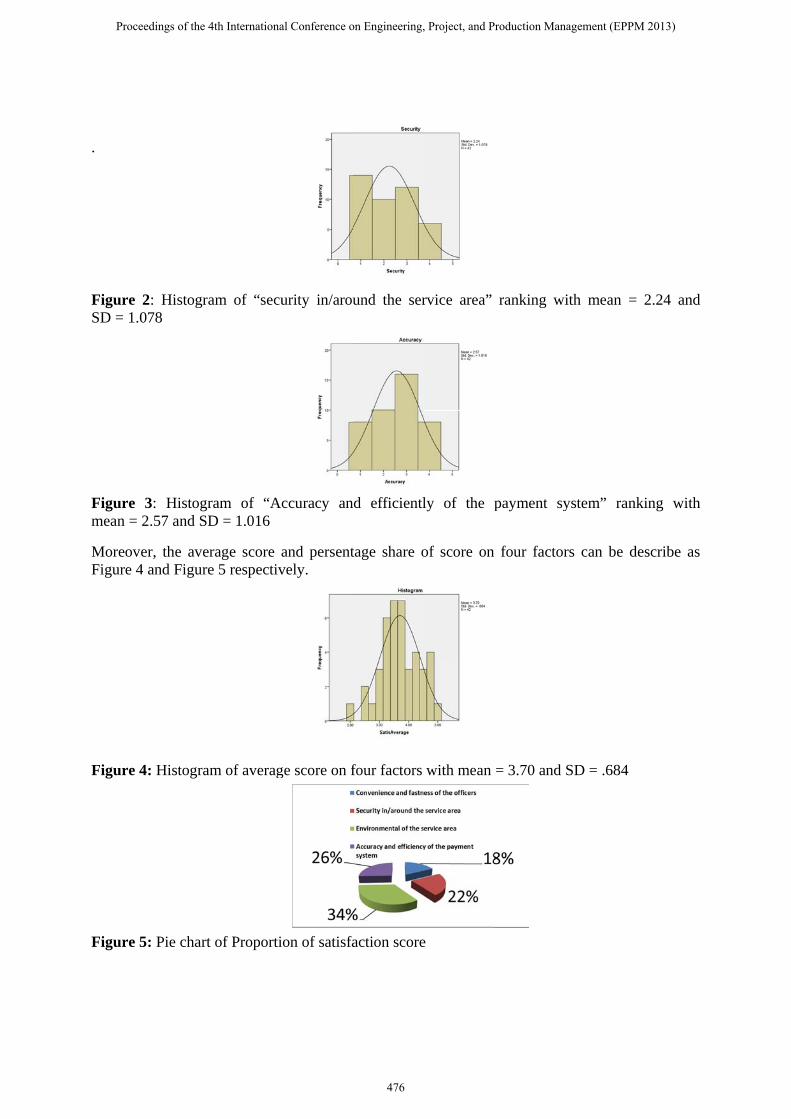
Figure SD = 1.0
Figure mean =
MoreoveFigure 4
Figure 4
Figure 5
2: Histogra078
3: Histogr2.57 and SD
er, the aver4 and Figure
4: Histogram
5: Pie chart
am of “secu
ram of “AcD = 1.016
rage score ae 5 respectiv
m of averag
of Proporti
urity in/arou
ccuracy an
and persentvely.
ge score on f
on of satisfa
und the ser
nd efficientl
tage share o
four factors
action score
rvice area”
ly of the p
of score on
with mean
e
ranking wi
payment sy
four factor
= 3.70 and
ith mean =
ystem” ran
rs can be d
SD = .684
= 2.24 and
nking with
describe as
Proceedings of the 4th International Conference on Engineering, Project, and Production Management (EPPM 2013)
476
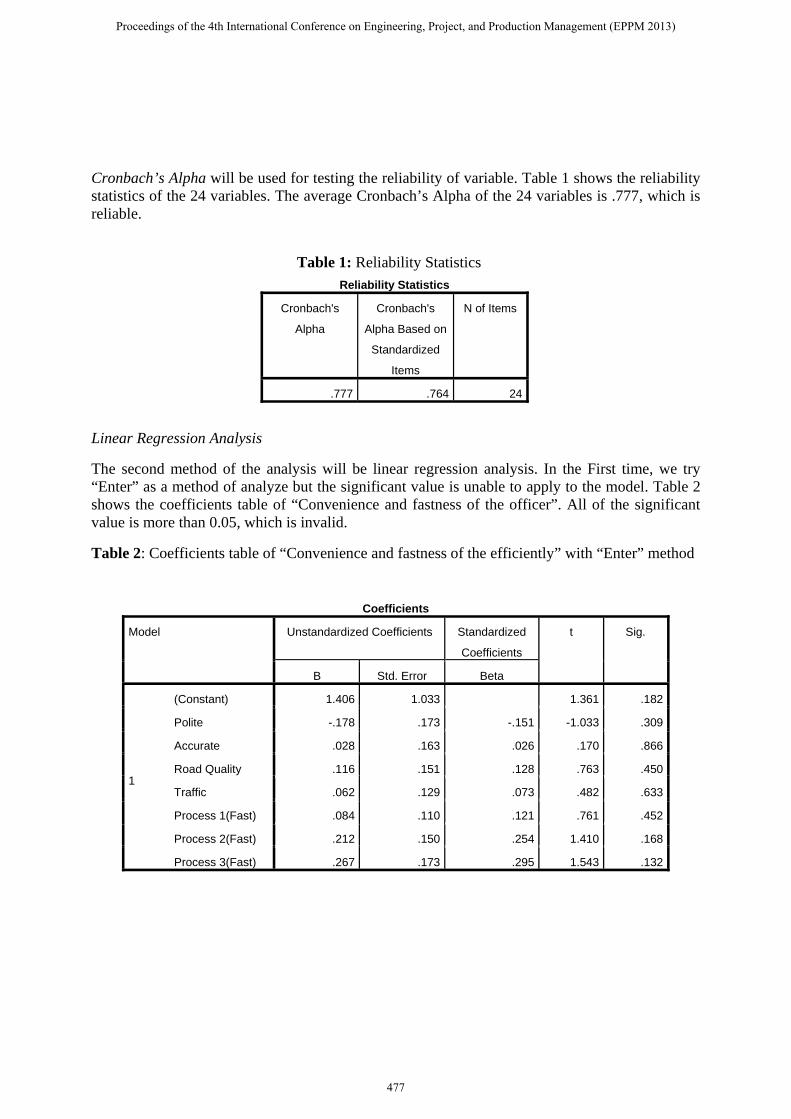
Cronbach’s Alpha will be used for testing the reliability of variable. Table 1 shows the reliability statistics of the 24 variables. The average Cronbach’s Alpha of the 24 variables is .777, which is reliable.
Table 1: Reliability Statistics
Reliability Statistics
Cronbach's
Alpha
Cronbach's
Alpha Based on
Standardized
Items
N of Items
.777 .764 24
Linear Regression Analysis
The second method of the analysis will be linear regression analysis. In the First time, we try “Enter” as a method of analyze but the significant value is unable to apply to the model. Table 2 shows the coefficients table of “Convenience and fastness of the officer”. All of the significant value is more than 0.05, which is invalid.
Table 2: Coefficients table of “Convenience and fastness of the efficiently” with “Enter” method
Coefficients
Model Unstandardized Coefficients Standardized
Coefficients
t Sig.
B Std. Error Beta
1
(Constant) 1.406 1.033 1.361 .182
Polite -.178 .173 -.151 -1.033 .309
Accurate .028 .163 .026 .170 .866
Road Quality .116 .151 .128 .763 .450
Traffic .062 .129 .073 .482 .633
Process 1(Fast) .084 .110 .121 .761 .452
Process 2(Fast) .212 .150 .254 1.410 .168
Process 3(Fast) .267 .173 .295 1.543 .132
Proceedings of the 4th International Conference on Engineering, Project, and Production Management (EPPM 2013)
477
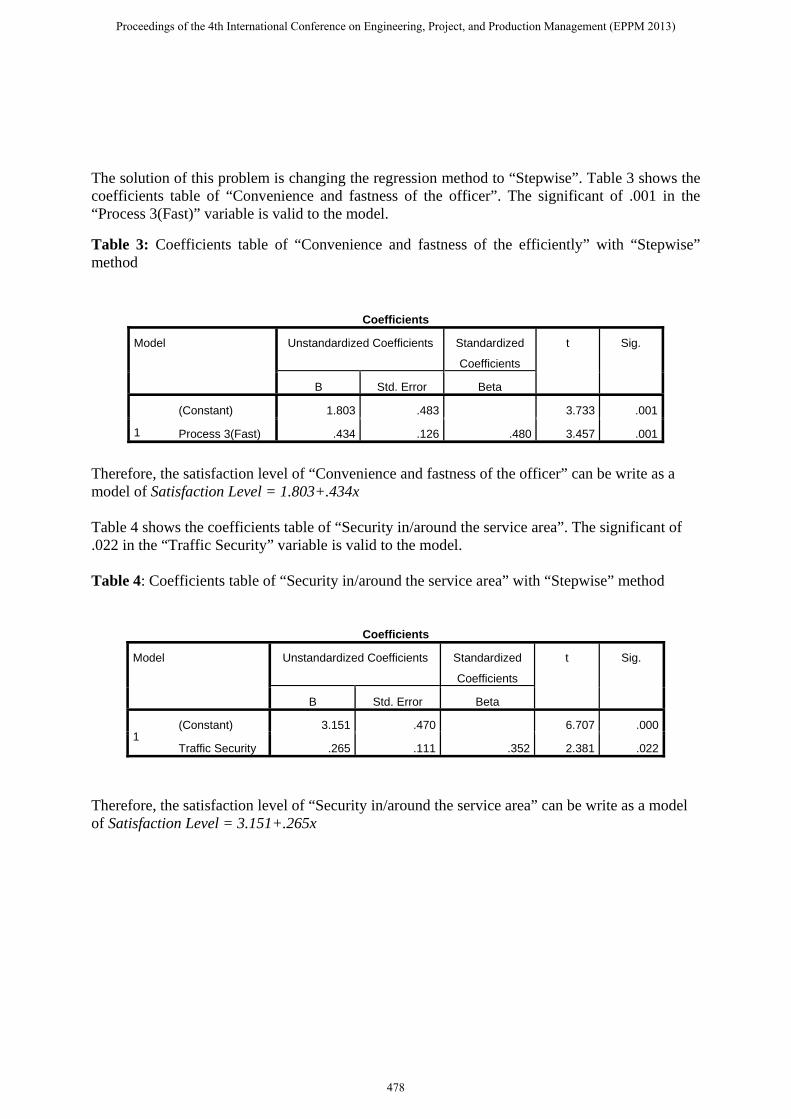
The solution of this problem is changing the regression method to “Stepwise”. Table 3 shows the coefficients table of “Convenience and fastness of the officer”. The significant of .001 in the “Process 3(Fast)” variable is valid to the model.
Table 3: Coefficients table of “Convenience and fastness of the efficiently” with “Stepwise” method
Therefore, the satisfaction level of “Convenience and fastness of the officer” can be write as a model of Satisfaction Level = 1.803+.434x Table 4 shows the coefficients table of “Security in/around the service area”. The significant of .022 in the “Traffic Security” variable is valid to the model. Table 4: Coefficients table of “Security in/around the service area” with “Stepwise” method
Therefore, the satisfaction level of “Security in/around the service area” can be write as a model of Satisfaction Level = 3.151+.265x
Coefficients
Model Unstandardized Coefficients Standardized
Coefficients
t Sig.
B Std. Error Beta
1
(Constant) 1.803 .483 3.733 .001
Process 3(Fast) .434 .126 .480 3.457 .001
Coefficients
Model Unstandardized Coefficients Standardized
Coefficients
t Sig.
B Std. Error Beta
1 (Constant) 3.151 .470 6.707 .000
Traffic Security .265 .111 .352 2.381 .022
Proceedings of the 4th International Conference on Engineering, Project, and Production Management (EPPM 2013)
478
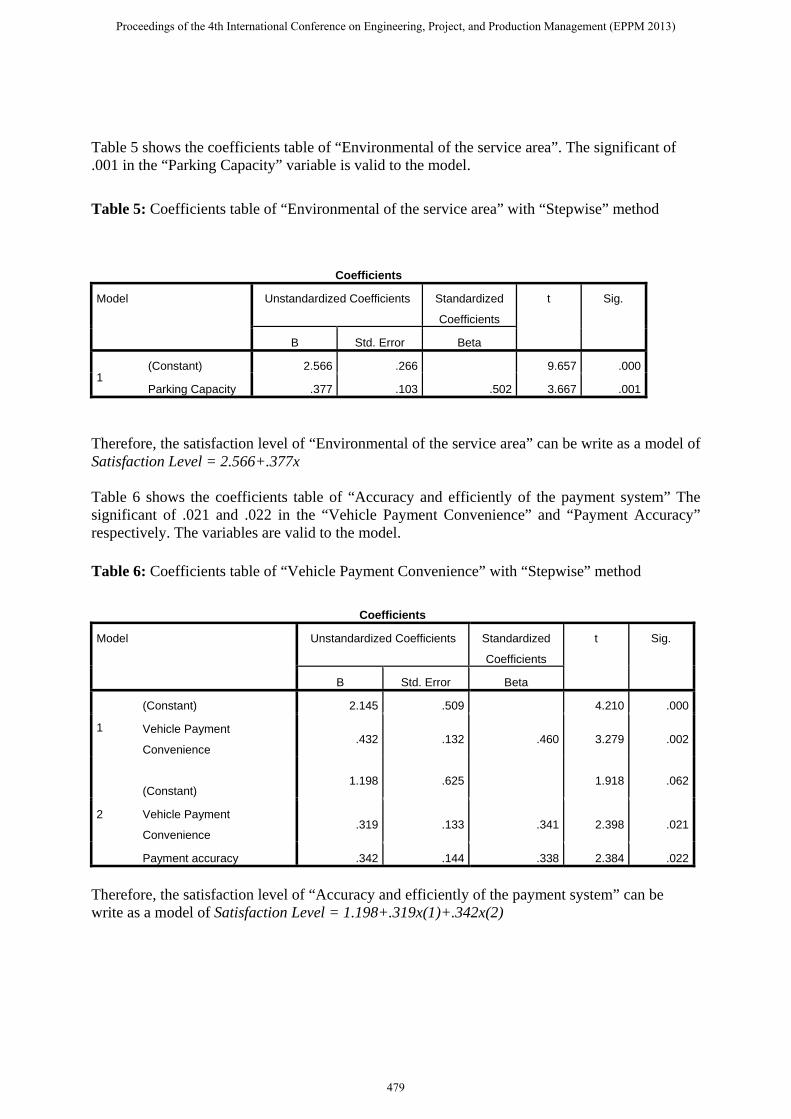
Table 5 shows the coefficients table of “Environmental of the service area”. The significant of .001 in the “Parking Capacity” variable is valid to the model.
Table 5: Coefficients table of “Environmental of the service area” with “Stepwise” method
Therefore, the satisfaction level of “Environmental of the service area” can be write as a model of Satisfaction Level = 2.566+.377x Table 6 shows the coefficients table of “Accuracy and efficiently of the payment system” The significant of .021 and .022 in the “Vehicle Payment Convenience” and “Payment Accuracy” respectively. The variables are valid to the model.
Table 6: Coefficients table of “Vehicle Payment Convenience” with “Stepwise” method
Coefficients
Model Unstandardized Coefficients Standardized
Coefficients
t Sig.
B Std. Error Beta
1 (Constant) 2.566 .266 9.657 .000
Parking Capacity .377 .103 .502 3.667 .001
Coefficients
Model Unstandardized Coefficients Standardized
Coefficients
t Sig.
B Std. Error Beta
1
(Constant) 2.145 .509 4.210 .000
Vehicle Payment
Convenience .432 .132 .460 3.279 .002
2
(Constant) 1.198 .625
1.918 .062
Vehicle Payment
Convenience .319 .133 .341 2.398 .021
Payment accuracy .342 .144 .338 2.384 .022
Therefore, the satisfaction level of “Accuracy and efficiently of the payment system” can be write as a model of Satisfaction Level = 1.198+.319x(1)+.342x(2)
Proceedings of the 4th International Conference on Engineering, Project, and Production Management (EPPM 2013)
479
5. CONCLUSIONS AND DISCUSSIONS From the survey results and interviews, the main concerned is on the speed of each process. Moreover, the ambiguous of payment method and unorganized process decrease the efficiency of the checkpoints. Regarding the survey interpretation results, we reach the following suggestion:
Steps of the checkpoints should be decreasing along with more clearly explained procedures.
Integration of technology can significantly increase the productivity of a whole system. Thai and Laos should have a coordinate in improving the satisfaction level together to
prevent the occurrence of bottle neck. More parking spaces should be provided due to the chaos of vehicles waiting for custom
clearances.
ISSUE
Limitation of time is the main issue of this observation. Due to classes from Monday to Friday, we have only two days to collect the data. Therefore, the sampling is much less than our estimation. Moreover, the complexity of questionnaire leads to time consuming in interview. Obviously, participants in the age between 20 to 25 understand the questions easier than elder.
ACKNOWLEDGMENTS This project will not succeed without greatly support by Transportation Research Center of SIIT and Department of Highways.
REFERENCES
Pilan Praithongyeam (2010) Comparison Of Cross-Border Transportation Facilitation For
Exports At Thailand’s Strategic Border Checkpoints. Technical Report, Department of
Civil Engineering, Faculty of Engineering, Chulalongkorn University.
Gomez, Jr., José Edgardo, Nittana Southiseng, John Walsh, and Samuel Sapuay, (2011),
Reaching across the Mekong: Local Socioeconomic and Gender Effects of Lao-Thai
Crossborder Linkages, in: Journal of Current Southeast Asian Affairs, 30, 3, 3-25.
Sr. Col. Somchart Nanudorn, et al, (2012) The Effectiveness Of Thailand–Laos Border Trade
Strategic Management. International Business & Economics Research Journal, The Clute
Institute.
Ruth Banomyong (2010) Benchmarking Economic Corridors logistics performance: a GMS
Proceedings of the 4th International Conference on Engineering, Project, and Production Management (EPPM 2013)
480
border crossing observation. World Customs Journal, International Network of Customs
Universities.
Heini Suominen (2012) Efficient Cross-Border Transport Models. Research Journal, United
Nations Economic and Social Commission for Asia and the Pacific.
The Australian Department of Foreign Affairs and Trade; The Australian Embassy in Laos; The
first Thai - Laos Friendship Bridge report by Thai Embassy in Vientiane; Ministry of
Commerce, Thailand; Nong Khai Customs House.
Proceedings of the 4th International Conference on Engineering, Project, and Production Management (EPPM 2013)
481