4th QUARTER FY 2015 EARNINGS PRESENTATION · 4th Quarter FY 2015 Earnings Presentation May 19, 2015...
26
1 May 19, 2015 4th Quarter FY 2015 Earnings Presentation 4th QUARTER FY 2015 EARNINGS PRESENTATION May 19, 2015
Transcript of 4th QUARTER FY 2015 EARNINGS PRESENTATION · 4th Quarter FY 2015 Earnings Presentation May 19, 2015...

1May 19, 20154th Quarter FY 2015 Earnings Presentation
4th QUARTER FY 2015 EARNINGS PRESENTATIONMay 19, 2015
2May 19, 20154th Quarter FY 2015 Earnings Presentation
Forward-Looking Statements
All written or oral statements made by CSC at this meeting or in these presentation materials that do not directly and exclusively relate to historical facts constitute “forward-looking statements” within the meaning of the Private Securities Litigation Reform Act of 1995. These statements represent CSC’s expectations and beliefs, and no assurance can be
given that the results described in such statements will be achieved. These statements are subject to risks, uncertainties, and other factors, many outside of CSC’s control, that could cause actual results to differ materially from the results described in such statements. For a
description of these factors, please see CSC’s most recent Annual Report on Form 10-K and Quarterly Reports on Form 10-Q.

3May 19, 20154th Quarter FY 2015 Earnings Presentation
Non-GAAP Reconciliations
This presentation includes certain non-GAAP financial measures such as operating income, operating margin, earnings before interest and taxes (EBIT), EBIT margin, free cash flow and
capital expenditures. Also included are certain non-GAAP results such as non-GAAP income from continuing operations and non-GAAP EPS. These non-GAAP financial measures are not meant to
be considered in isolation or as a substitute for results prepared in accordance with accounting principles generally accepted in the United States (GAAP). A reconciliation of non-GAAP financial
measures included in this presentation to the most directly comparable financial measures calculated and presented in accordance with GAAP accompanies this presentation and is on our website at www.csc.com. CSC management believes that these non-GAAP financial measures
provide useful information to investors regarding the Company’s financial condition and results of operations as they provide another measure of the Company’s profitability and ability to service its
debt, and are considered important measures by financial analysts covering CSC and its peers.
Selected references are made on a “constant currency basis” (cc) so that certain financial results can be viewed without the impact of fluctuations in foreign currency rates, thereby providing
comparisons of operating performance from period to period. Financial results on a “constant currency basis” are non-GAAP measures calculated by translating current period activity into U.S. dollars using the comparable prior period’s currency conversion rates. This approach is used for all
results where the functional currency is not the U.S. dollar.
4May 19, 20154th Quarter FY 2015 Earnings Presentation
Basis of Presentation
During the first quarter of fiscal year 2015, CSC changed its pension accounting policy. Under the new policy, actuarial gains and losses and changes in fair value of plan assets are recorded in the year in which they occur. Additionally, actuarial and settlement gains and losses are excluded from the Company’s definition of operating income. Also during
the first fiscal quarter of 2015, CSC changed its inter-company accounting policy. Previously, inter-company transactions between segments were generally reflected as
inter-company revenue. Under the new policy, inter-company transactions are now generally treated as cost transfers.
The Company has recast its financial statements for the prior fiscal years to reflect both these accounting policy changes.

5May 19, 20154th Quarter FY 2015 Earnings Presentation
4th QUARTER FY 2015 EARNINGS PRESENTATION
Mike LawrieChief Executive Officer

6May 19, 20154th Quarter FY 2015 Earnings Presentation
Key Messages
Commercial revenue up sequentially, good book-to-bill
FY15 non-GAAP EPS* of $4.64 up 9%, driven by higher margins
Continue to return significant capital to shareholders
NPS revenue flat; strong operating margin
Investments to optimize global workforce
*Non-GAAP EPS from continuing operations excludes net pension and OPEB actuarial & settlement gains/losses, charges related to the proposed SEC settlement & Other, Q4 FY15 tax valuation allowance benefit, Q4 FY15 special restructuring costs, and the Q4 FY14 benefit from
the reversal of contingent consideration related to the ServiceMesh acquisition (see slides 18 – 24 for non-GAAP reconciliations)

7May 19, 20154th Quarter FY 2015 Earnings Presentation
4th QUARTER FY 2015 EARNINGS PRESENTATION
Paul SalehChief Financial Officer

8May 19, 20154th Quarter FY 2015 Earnings Presentation
Reconciliation of Non-GAAP ResultsQ4 FY15 and FY15
*EPS from continuing operations and per-share values of certain items may not add to non-GAAP EPS due to rounding
$M Except EPS GAAP Tax valuation allowance benefit
Special restructuring
costs
SEC Settlement related charges &
Other
Pension & OPEB actuarial &
settlement losses
Non-GAAP results
(Loss) income from continuing operations, before taxes (317) - (246) (5) (319) 253
Income tax (benefit) expense (330) (264) (63) (2) (70) 69
Income from continuing operations 13 264 (183) (3) (249) 184
Diluted EPS from continuing operations* $ 0.06 1.85 (1.28) (0.02) (1.74) $ 1.26
Q4 FY15
$M Except EPS GAAP Tax valuation allowance benefit
Special restructuring
costs
SEC Settlement related charges &
Other
Pension & OPEB actuarial &
settlement losses
Non-GAAP results
(Loss) income from continuing operations, before taxes (276) - (246) (200) (782) 952
Income tax (benefit) expense (312) (264) (63) (3) (241) 259
Income from continuing operations 36 264 (183) (197) (541) 693
Diluted EPS from continuing operations* $ 0.15 1.81 (1.26) (1.35) (3.70) $ 4.64
FY15

9May 19, 20154th Quarter FY 2015 Earnings Presentation
4th Quarter and Full Year Results*
*Non-GAAP and Adjusted results exclude net pension and OPEB actuarial & settlement gains/losses, charges related to the proposed SEC settlement & Other, Q4 FY15 tax valuation allowance benefit, Q4 FY15 special restructuring costs, and
the Q4 FY14 benefit from the reversal of contingent consideration related to the ServiceMesh acquisition, as applicable (see slides 18 – 24 for non-GAAP reconciliations)
FY15 FY14 FY15 FY14
Revenue ($M) $ 2,909 $ 3,329 $ 12,173 $ 12,998
YoY Growth – GAAP (12.6%) (6.3%)
YoY Growth – cc (8.0%) (5.2%)
QtQ Growth – cc 1.4%
Adjusted Operating Income ($M)* 349 364 1,334 1,395
Adjusted Operating Margin (%)* 12.0% 10.9% 11.0% 10.7%
Adjusted EBIT ($M)* 283 296 1,080 1,114
Adjusted EBIT Margin (%)* 9.7% 8.9% 8.9% 8.6%
Non-GAAP Income from Continuing Operations ($M)* 184 174 693 664
Non-GAAP EPS from Continuing Operations* $ 1.26 $ 1.15 $ 4.64 $ 4.27
Bookings ($B) $ 3.4 $ 4.3 $ 11.7 $ 14.5
Q4 Full Year

10May 19, 20154th Quarter FY 2015 Earnings Presentation
NPS 34%
GIS32%
GBS34%
Global Business Services (GBS)
$6.1 $4.7
$0.1**
FY14 FY15
$4,321 $4,036
FY14 FY15
OI Margin %Revenue ($M) Bookings ($B)FY 2015
13.3% 13.1%*
FY14 FY15
Decline in cc of 4.7%
*Adjusted operating income excludes the impact of Q4 FY15 special restructuring costs**Impact from contract awarded in Q4 FY15 but signed after quarter end
Q4 FY15 Q4 FY14
Revenue ($M) $ 980 $ 1,152 – YoY growth (14.9%)
– YoY growth cc (7.6%)
– QtQ growth cc 6.1%
Operating Income ($M)– As reported 39 201 – Adjusted* 164 201
Operating Margin (%) – As reported 4.0% 17.4%– Adjusted* 16.7% 17.4%
Bookings ($B) $ 1.1 $ 1.5

11May 19, 20154th Quarter FY 2015 Earnings Presentation
Global Infrastructure Services (GIS)
NPS 34%
GIS32%
GBS34%
$4.1 $4.1
$0.6**
FY14 FY15
$4,578 $4,080
FY14 FY15
7.9% 6.7%
FY14 FY15
Adjusted OI Margin %*Revenue ($M) Bookings ($B)FY 2015Decline in cc of 9.4%
*Adjusted operating income excludes the impact of Q4 FY15 special restructuring costs and theQ4 FY14 benefit from the reversal of contingent consideration related to the ServiceMesh acquisition
**Impact from contract awarded in Q4 FY15 but signed after quarter end
Q4 FY15 Q4 FY14
Revenue ($M) $ 929 $ 1,173 – YoY growth (20.8%)
– YoY growth cc (14.8%)
– QtQ growth cc (1.9%)
Operating Income ($M)– As reported (49) 92 – Adjusted* 63 71
Operating Margin (%) – As reported (5.3%) 7.8%– Adjusted* 6.8% 6.1%
Bookings ($B) $ 1.2 $ 1.8

12May 19, 20154th Quarter FY 2015 Earnings Presentation
North American Public Sector (NPS)
DoD 54%Civil 38%Other 8%
NPS 34%
GBS34%
GIS32%
$3.3** $2.9
FY14 FY15
$4,099 $4,057
FY14 FY15
12.8%14.7%*
FY14 FY15
Large Renewal
$4.3
OI Margin %Revenue ($M) Bookings ($B)FY 2015Decline of 1%
*Adjusted operating income excludes the impact of Q4 FY15 special restructuring costs**Adjusted for one large NPS renewal
Q4 FY15 Q4 FY14
Revenue ($M) $ 1,000 $ 1,004 – YoY growth (0.4%)
Operating Income ($M)– As reported 135 112 – Adjusted* 140 112
Operating Margin (%) – As reported 13.5% 11.2%– Adjusted* 14.0% 11.2%
Bookings ($B) $ 1.0 $ 1.0

13May 19, 20154th Quarter FY 2015 Earnings Presentation
Q4 FY15 FY 2015
Free Cash Flow $118M $717M
Cap Ex — Including Capital Leases $170M $735M
Cap Ex as a % of Revenue 5.8% 6.0%
Cash Flow Performance
Financial Highlights
Q4 FY15 Q4 FY14
Cash and Equivalents $2.1B $2.4B
Net Debt to Capital Ratio 10.2% 6.5%
Capital Structure
Q4 FY15 FY 2015
Dividends $33M $131M
Share Repurchases3.2M shares
$224M11.7M shares
$736M
Capital to Shareholders

14May 19, 20154th Quarter FY 2015 Earnings Presentation
Cost Takeout and Reinvestment Update
COST TAKEOUT• Continued G&A efficiency• Real estate consolidation• Workforce optimization• Supply chain management
REINVESTMENTS• Next-generation offerings• Strategic partnerships• Sales• Finance and HR systems• Customer-committed savings
$350M – $400M
$450M – $500M
FY15 Targets
~$360M
~$480M
FY15

15May 19, 20154th Quarter FY 2015 Earnings Presentation
FY 2016 Targets
Free Cash Flow** $750 – $800 million
RevenueFlat to slightly down (cc)• NPS slightly up• Commercial flat to slightly down in cc
Non-GAAP EPS from Continuing Operations* $4.75 – $5.05
*Non-GAAP EPS from continuing operations excludes net actuarial pension and OPEB gains/losses**Excludes cash impact from Q4 FY15 special restructuring payments, proposed SEC settlement, and other related separation costs

16May 19, 20154th Quarter FY 2015 Earnings Presentation
4th QUARTER FY 2015 EARNINGS PRESENTATION
Supplemental Information

17May 19, 20154th Quarter FY 2015 Earnings Presentation
Q4 FY15 Non-GAAP ReconciliationOperating Income ($M) Q4 FY15 Q4 FY14
Adjusted operating income 349$ 364$ Special restructuring costs (246) - Reversal of contingent consideration - 21 Operating income 103$ 385$ Corporate G&A (60) (66) Pension & OPEB actuarial & settlement (losses) gains (319) 145 SEC settlement related charges and Other (5) - Interest expense (36) (35) Interest income 6 5 Other expense, net (6) (2) (Loss) income from continuing operations, before taxes (317)$ 432$
Earnings Before Interest and Taxes ($M) Q4 FY15 Q4 FY14
Adjusted EBIT 283$ 296$ Pension & OPEB actuarial & settlement (losses) gains (319) 145 SEC settlement related charges and Other (5) - Special restructuring costs (246) - Reversal of contingent consideration - 21 EBIT (287)$ 462$ Interest expense (36) (35) Interest income 6 5 Income tax benefit (expense) 330 (156) Income from continuing operations 13$ 276$
Margin % Q4 FY15 Q4 FY14
Revenue ($M) 2,909$ 3,329$ Adjusted operating margin 12.0% 10.9%Operating margin 3.5% 11.6%Adjusted EBIT margin 9.7% 8.9%EBIT margin (9.9%) 13.9%

18May 19, 20154th Quarter FY 2015 Earnings Presentation
FY15 Non-GAAP ReconciliationOperating Income ($M) FY15 FY14
Adjusted operating income 1,334$ 1,395$ Special restructuring costs (246) - Reversal of contingent consideration - 21 Operating income 1,088$ 1,416$ Corporate G&A (242) (263) Pension & OPEB actuarial & settlement (losses) gains (782) 259 SEC settlement related charges and Other (200) - Interest expense (148) (147) Interest income 20 16 Other expense, net (12) (18) (Loss) income from continuing operations, before taxes (276)$ 1,263$
Earnings Before Interest and Taxes ($M) FY15 FY14
Adjusted EBIT 1,080$ 1,114$ Pension & OPEB actuarial & settlement (losses) gains (782) 259 SEC settlement related charges and Other (200) - Special restructuring costs (246) - Reversal of contingent consideration - 21 EBIT (148)$ 1,394$ Interest expense (148) (147) Interest income 20 16 Income tax benefit (expense) 312 (383) Income from continuing operations 36$ 880$
Margin % FY15 FY14
Revenue ($M) 12,173$ 12,998$ Adjusted operating margin 11.0% 10.7%Operating margin 8.9% 10.9%Adjusted EBIT margin 8.9% 8.6%EBIT margin (1.2%) 10.7%

19May 19, 20154th Quarter FY 2015 Earnings Presentation
Q4 FY15 Non-GAAP Results*
$M Except EPS As reportedPension & OPEB
actuarial & settlement losses
SEC Settlement related charges
& Other
Special restructuring
costs
Tax valuation allowance benefit
Non-GAAP results*
Costs of services (excludes depreciation and amortization and restructuring costs) 2,433$ (302)$ -$ -$ -$ 2,131$
Selling, general and administrative (excludes SEC settlement related charges and restructuring costs) 294$ (17)$ (3)$ -$ -$ 274$
(Loss) income from continuing operations, before taxes (317)$ (319)$ (5)$ (246)$ -$ 253$
Income tax (benefit) expense (330) (70) (2) (63) (264) 69
Income from continuing operations 13$ (249)$ (3)$ (183)$ 264$ 184$
Net income 13$ (249)$ (3)$ (183)$ 264$ 184$
Less: net income attributable to noncontrolling interest, net of tax 4 - - - - 4
Net (loss) income attributable to CSC common stockholders 9$ (249)$ (3)$ (183)$ 264$ 180$
Effective tax rate 104.1% 21.9% 40.0% 25.6% - 27.3%
Basic EPS from continuing operations** 0.06$ (1.77)$ (0.02)$ (1.30)$ 1.88$ 1.28$
Diluted EPS from continuing operations** 0.06$ (1.74)$ (0.02)$ (1.28)$ 1.85$ 1.26$
Weighted average common shares outstanding for:
Basic EPS 140.760 140.760 140.760 140.760 140.760 140.760
Diluted EPS 142.812 142.812 142.812 142.812 142.812 142.812
*Non-GAAP results exclude net pension and OPEB actuarial & settlement gains/losses, charges related to theproposed SEC settlement & Other, Q4 FY15 tax valuation allowance benefit, and Q4 FY15 special restructuring costs
**EPS from continuing operations and per-share values of certain items may not add to non-GAAP EPS due to rounding
20May 19, 20154th Quarter FY 2015 Earnings Presentation
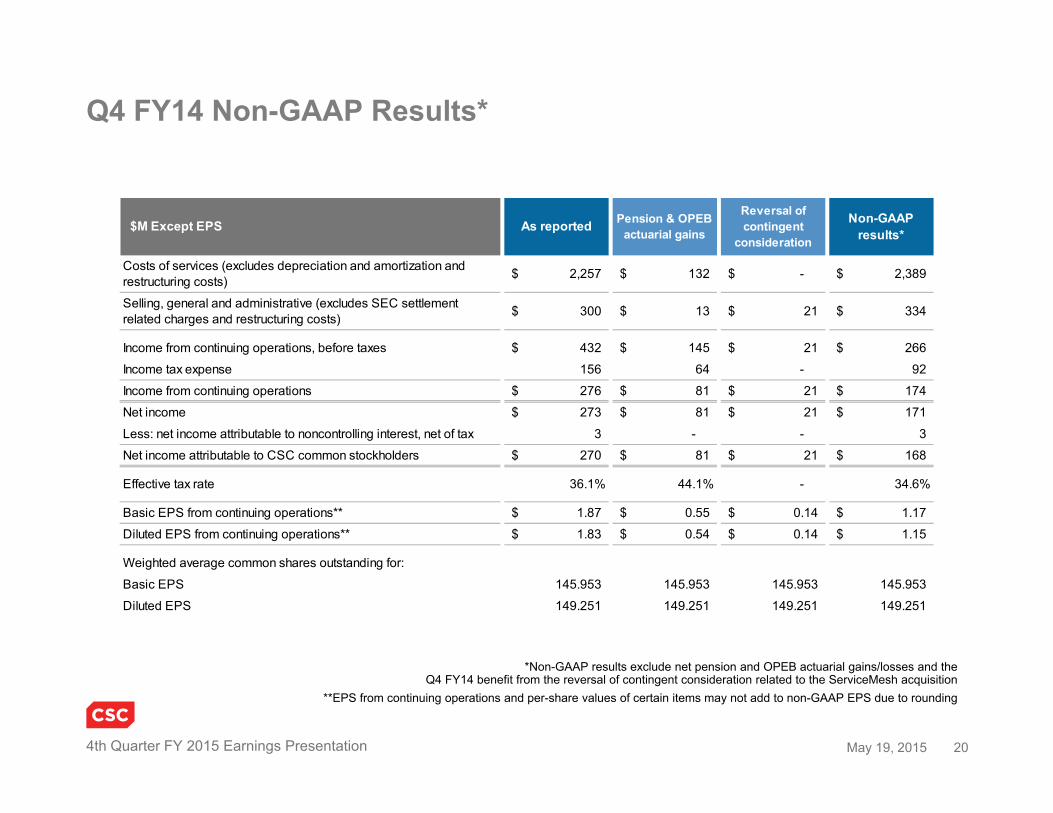
Q4 FY14 Non-GAAP Results*
*Non-GAAP results exclude net pension and OPEB actuarial gains/losses and theQ4 FY14 benefit from the reversal of contingent consideration related to the ServiceMesh acquisition
**EPS from continuing operations and per-share values of certain items may not add to non-GAAP EPS due to rounding
$M Except EPS As reported Pension & OPEB actuarial gains
Reversal of contingent
consideration
Non-GAAP results*
Costs of services (excludes depreciation and amortization and restructuring costs) 2,257$ 132$ -$ 2,389$
Selling, general and administrative (excludes SEC settlement related charges and restructuring costs) 300$ 13$ 21$ 334$
Income from continuing operations, before taxes 432$ 145$ 21$ 266$
Income tax expense 156 64 - 92
Income from continuing operations 276$ 81$ 21$ 174$
Net income 273$ 81$ 21$ 171$
Less: net income attributable to noncontrolling interest, net of tax 3 - - 3
Net income attributable to CSC common stockholders 270$ 81$ 21$ 168$
Effective tax rate 36.1% 44.1% - 34.6%
Basic EPS from continuing operations** 1.87$ 0.55$ 0.14$ 1.17$
Diluted EPS from continuing operations** 1.83$ 0.54$ 0.14$ 1.15$
Weighted average common shares outstanding for:
Basic EPS 145.953 145.953 145.953 145.953
Diluted EPS 149.251 149.251 149.251 149.251

21May 19, 20154th Quarter FY 2015 Earnings Presentation
FY15 Non-GAAP Results*
$M Except EPS As reportedPension & OPEB
actuarial & settlement losses
SEC Settlement related charges
& Other
Special restructuring
costs
Tax valuation allowance benefit
Non-GAAP results*
Costs of services (excludes depreciation and amortization and restructuring costs) 9,534$ (720)$ -$ -$ -$ 8,814$
Selling, general and administrative (excludes SEC settlement related charges and restructuring costs) 1,340$ (62)$ (3)$ -$ -$ 1,275$
(Loss) income from continuing operations, before taxes (276)$ (782)$ (200)$ (246)$ -$ 952$
Income tax (benefit) expense (312) (241) (3) (63) (264) 259
Income from continuing operations 36$ (541)$ (197)$ (183)$ 264$ 693$
Net income 7$ (541)$ (197)$ (183)$ 264$ 664$
Less: net income attributable to noncontrolling interest, net of tax 15 (2) - - - 17
Net (loss) income attributable to CSC common stockholders (8)$ (539)$ (197)$ (183)$ 264$ 647$
Effective tax rate 113.0% 30.8% 1.5% 25.6% - 27.2%
Basic EPS from continuing operations** 0.15$ (3.78)$ (1.38)$ (1.28)$ 1.85$ 4.74$
Diluted EPS from continuing operations** 0.15$ (3.70)$ (1.35)$ (1.26)$ 1.81$ 4.64$
Weighted average common shares outstanding for:
Basic EPS 142.557 142.557 142.557 142.557 142.557 142.557
Diluted EPS 145.780 145.780 145.780 145.780 145.780 145.780
*Non-GAAP results exclude net pension and OPEB actuarial & settlement gains/losses, charges related to theproposed SEC settlement & Other, Q4 FY15 tax valuation allowance benefit, and Q4 FY15 special restructuring costs
**EPS from continuing operations and per-share values of certain items may not add to non-GAAP EPS due to rounding

22May 19, 20154th Quarter FY 2015 Earnings Presentation
FY14 Non-GAAP Results*
$M Except EPS As reported Pension & OPEB actuarial gains
Reversal of contingent
consideration
Non-GAAP results*
Costs of services (excludes depreciation and amortization and restructuring costs) 9,272$ 212$ -$ 9,484$
Selling, general and administrative (excludes SEC settlement related charges and restructuring costs) 1,220$ 47$ 21$ 1,288$
Income from continuing operations, before taxes 1,263$ 259$ 21$ 983$
Income tax expense 383 64 - 319
Income from continuing operations 880$ 195$ 21$ 664$
Net income 968$ 195$ 21$ 752$
Less: net income attributable to noncontrolling interest, net of tax 21 - - 21
Net income attributable to CSC common stockholders 947$ 195$ 21$ 731$
Effective tax rate 30.3% 24.7% - 32.5%
Basic EPS from continuing operations** 5.81$ 1.32$ 0.14$ 4.35$
Diluted EPS from continuing operations** 5.70$ 1.29$ 0.14$ 4.27$
Weighted average common shares outstanding for:
Basic EPS 147.647 147.647 147.647 147.647
Diluted EPS 150.761 150.761 150.761 150.761
*Non-GAAP results exclude net pension and OPEB actuarial gains/losses and theQ4 FY14 benefit from the reversal of contingent consideration related to the ServiceMesh acquisition
**EPS from continuing operations and per-share values of certain items may not add to non-GAAP EPS due to rounding

23May 19, 20154th Quarter FY 2015 Earnings Presentation
Selected Cash Flow Items and Non-GAAP Reconciliation
*Includes accrual related to SEC settlement related charges**Capital lease payments, repayments of obligations related to assets acquired under long-term financing arrangements,
and proceeds from the sale of assets (included in investing activities) are included in the calculation of free cash flow
$MNet income $ 13 $ 273 $ 7 $ 968 Pension & OPEB actuarial & settlement losses (gains) 319 (145) 782 (259) Depreciation and amortization 215 265 977 1,018 Change in assets and liabilities* 175 (50) 60 (341) Loss (gain) on dispositions - 10 (22) (85) Other (432) 195 (371) 259 Operating Cash Flow 290 548 1,433 1,560
Capital expenditures, net (121) (191) (493) (650) Business dispositions - 3 (13) 248 Acquisitions (14) - (49) (190) Other (2) (1) 19 26 Investing Cash Flow (137) (189) (536) (566)
Business dispositions - (3) 13 (248) Acquisitions 14 - 49 190 Other - - - (5) Capital leases and other asset financing (49) (68) (242) (242)
Free Cash Flow** $ 118 $ 288 $ 717 $ 689
FY14Q4 FY15 Q4 FY14 FY15

24May 19, 20154th Quarter FY 2015 Earnings Presentation
$B FY14 FY15
North American Public SectorNPSGlobal Business ServicesGBS Global Infrastructure ServicesGIS
Bookings*
*Segment bookings may not add to total due to rounding

25May 19, 20154th Quarter FY 2015 Earnings Presentation
• Operating cost: Equal to the sum of (1) cost of services, (2) segment SG&A, excluding Corporate G&A, (3) depreciation and amortization, and (4) restructuring costs
• Operating income: Revenue less costs of services, segment selling, general and administrative (G&A) expenses, depreciation and amortization expense, and restructuring costs. Operating income excludes corporate G&A, actuarial and settlement charges related to CSC’s pension and other post-employment benefit (OPEB) plans, and the SEC settlement related charges and Other
• Adjusted operating income: Operating income excluding the impact of the fourth quarter fiscal 2015 special restructuring costs, and the impact of the fourth quarter fiscal 2014 reversal of the excess ServiceMesh contingent consideration payable
• Operating income margin: Operating income as a percentage of revenue
• Earnings before interest and taxes: Income from continuing operations less interest expense, interest income and income tax benefit (expense)
• Adjusted earnings before interest and taxes: Earnings before interest and taxes excluding the impact of the (1) actuarial gains (losses) and settlement charges related to CSC’s pension & other post-employment benefit (OPEB) plans, (2) proposed SEC settlement related charges and Other, (3) fourth quarter fiscal 2015 special restructuring costs, and (4) the fourth quarter fiscal 2014 reversal of the excess ServiceMesh (SMI) contingent consideration payable
• Earnings before interest and taxes margin: Earnings before interest and taxes as a percentage of revenue
• Free cash flow: Equal to the sum of (1) operating cash flows, (2) investing cash flows, excluding business acquisitions and dispositions, and investments (including short-term investments and purchase or sale of available-for-sale securities), and (3) payments on capital leases and other long-term asset financings
• Capital expenditures: Equal to sum of purchases of property, equipment, and software, and payments on outsourcing contracts, less proceeds from sales of assets
• Net debt: Calculated as the sum of long-term and short-term debt, less cash and cash equivalents
• Net debt to capital: Calculated as the ratio of net debt to capital (total debt plus equity)
Non-GAAP and Other Definitions
26May 19, 20154th Quarter FY 2015 Earnings Presentation
4th QUARTER FY 2015 EARNINGS PRESENTATION
Thank You