4Q14 Basel III Pillar 3 Final - Morgan Stanley... the U.S. banking regulators issued a final ......
29
Basel III Pillar 3 Disclosures Report For the Quarterly Period Ended December 31, 2014
-
Upload
phamkhuong -
Category
Documents
-
view
226 -
download
3
Transcript of 4Q14 Basel III Pillar 3 Final - Morgan Stanley... the U.S. banking regulators issued a final ......
Basel III Pillar 3 Disclosures Report
For the Quarterly Period Ended December 31, 2014
BASEL III PILLAR 3 DISCLOSURES REPORT For the quarterly period ended December 31, 2014
Table of Contents Page
1 Morgan Stanley ..................................................................................................................................................... 1
2 Capital Framework ............................................................................................................................................... 1
3 Capital Structure ................................................................................................................................................... 2
4 Capital Adequacy .................................................................................................................................................. 2
5 Credit Risk ............................................................................................................................................................ 4
5.1 Credit Risk: General Disclosures .......................................................................................................................... 4
5.2 Credit Risk: General Disclosure for Impaired Loans ............................................................................................ 6
5.3 Portfolios Subject to Internal Ratings-Based Risk-Based Capital Formulas ........................................................ 7
5.4 General Disclosure for Wholesale Counterparty Credit Risk of Derivative Contracts, Repo-Style Transactions and Margin Lending ........................................................................................................................ 10
5.5 Credit Risk Mitigation .......................................................................................................................................... 13
6 Equities Not Subject to Market Risk Capital Rule ................................................................................................ 14
7 Securitization Exposures ....................................................................................................................................... 15
7.1 Accounting and Valuation .................................................................................................................................... 16
7.2 Securitization and Resecuritization Exposures in the Banking Book ................................................................... 16
7.3 Securitization and Resecuritization Exposures in the Trading Book .................................................................... 19
8 Interest Rate Risk for Non-trading Activities ....................................................................................................... 20
9 Market Risk........................................................................................................................................................... 20
9.1 Model Methodology, Assumptions and Exposure Measures ................................................................................ 21
9.2 Model Limitations ................................................................................................................................................. 24
9.3 Model Validation .................................................................................................................................................. 24
9.4 Regulatory VaR Backtesting ................................................................................................................................ 24
9.5 Covered Positions ................................................................................................................................................. 25
9.6 Stress Testing of Covered Positions ...................................................................................................................... 25
10 Operational Risk ................................................................................................................................................... 26
11 Disclosure Map ..................................................................................................................................................... 27
MORGAN STANLEY
Basel III Pillar 3 Disclosures Report
For the Quarterly Period Ended December 31, 2014
1
1 Morgan Stanley
Morgan Stanley is a global financial services firm that, through its subsidiaries and affiliates, provides a wide variety of products and services to a large and diversified group of clients and customers, including corporations, governments, financial institutions and individuals. Unless the context otherwise requires, the terms “Morgan Stanley” or the “Company” mean Morgan Stanley (the “Parent”) together with its consolidated subsidiaries. Morgan Stanley was originally incorporated under the laws of the State of Delaware in 1981, and its predecessor companies date back to 1924. The Company is a financial holding company under the Bank Holding Company Act of 1956, as amended (the “BHC Act”), and is subject to the regulation and oversight of the Board of Governors of the Federal Reserve System (the “Federal Reserve”). The Company conducts its business from its headquarters in and around New York City, its regional offices and branches throughout the United States of America (“U.S.”) and its principal offices in London, Tokyo, Hong Kong and other world financial centers. The basis of consolidation for accounting and regulatory purposes is materially the same. The Federal Reserve establishes capital requirements for the Company, including well-capitalized standards, and evaluates the Company’s compliance with such capital requirements. The Office of the Comptroller of the Currency (the “OCC”) establishes similar capital requirements and standards for the Company’s U.S. bank operating subsidiaries Morgan Stanley Bank, N.A. and Morgan Stanley Private Bank, National Association (“U.S. Subsidiary Banks”). At December 31, 2014, the Company’s insurance subsidiaries surplus capital included in the total capital of the consolidated group was $25 million. At December 31, 2014, none of the Company’s subsidiaries had capital less than the minimum required capital amount. For descriptions of the Company’s business, see “Business” in Part I, Item 1 of the Company’s Annual Report on Form 10-K for the year ended December 31, 2014 (“2014 Form 10-K”).
2 Capital Framework
In December 2010, the Basel Committee on Banking Supervision (“Basel Committee”) established a new risk-based capital, leverage ratio and liquidity framework, known as “Basel III.” In July 2013, the U.S. banking regulators issued a final rule to implement many aspects of Basel III (“U.S. Basel III”). Although the Company and its U.S. Subsidiary Banks became subject to U.S. Basel III beginning on January 1, 2014, certain requirements of U.S. Basel III will be phased in over several years. On February 21, 2014, the Federal Reserve and the OCC approved the Company’s and its U.S. Subsidiary Banks’ respective use of the U.S. Basel III advanced internal ratings-based approach for determining credit risk capital requirements and advanced measurement approaches for determining operational risk capital requirements to calculate and publicly disclose their risk-based capital ratios beginning with the second quarter of 2014, subject to the “capital floor” discussed below (the “Advanced Approach”). As an Advanced Approach banking organization, the Company is required to compute risk-based capital ratios using both (i) standardized approaches for calculating credit risk-weighted assets (“RWAs”) and market risk RWAs (the “Standardized Approach”); and (ii) Advanced Approach comprised of an advanced internal ratings-based approach for calculating credit risk RWAs, an advanced measurement approach for calculating operational risk RWAs, and an advanced approach for calculating market risk RWAs under U.S. Basel III. For a further discussion of the regulatory capital framework applicable to the Company, see “Management’s Discussion and Analysis of Financial Condition and Results of Operations (“MD&A”)—Liquidity and Capital Resources—Regulatory Requirements” in Part II, Item 7 of the 2014 Form 10-K.
U.S. Basel III requires banking organizations that calculate risk-based capital ratios using the Advanced Approach, including the Company, to make qualitative and quantitative disclosures regarding their capital and RWAs on a quarterly basis (“Pillar 3 Disclosures”). This report contains the Company’s Pillar 3 Disclosures for its credit, market and operational risks for the quarter ended December 31, 2014, in accordance with the U.S. Basel III, 12 C.F.R. § 217.171 through 217.173 and 217.212.
The Company’s Pillar 3 Disclosures are not required to be, and have not been, audited by the Company’s independent registered public accounting firm. The Company’s Pillar 3 Disclosures were based on its current understanding of U.S. Basel III and other factors, which may be subject to change as the Company receives additional clarification and implementation guidance from regulators relating to U.S. Basel III, and as the interpretation of the final rule evolves over time. Some measures of exposures contained in this report may not be consistent with accounting principles generally accepted in the U.S. (“U.S. GAAP”), and may not be comparable with measures reported in the 2014 Form 10-K.
MORGAN STANLEY
Basel III Pillar 3 Disclosures Report
For the Quarterly Period Ended December 31, 2014
2
3 Capital Structure
The Company has issued a variety of capital instruments to meet its regulatory capital requirements and to maintain a strong capital base. These capital instruments include common stock that qualifies as Common Equity Tier 1 capital, non-cumulative perpetual preferred stock that qualifies as Additional Tier 1 capital and subordinated debt that qualifies as Tier 2 capital, each under U.S. Basel III. For a discussion of the Company’s capital instruments, see Note 11 (Borrowings and Other Secured Financings) and Note 15 (Total Equity) to the consolidated financial statements in Part II, Item 8, as well as “MD&A—Liquidity and Capital Resources—Regulatory Requirements—Implementation of U.S. Basel III—Regulatory Capital Ratios” in Part II, Item 7 of the 2014 Form 10-K.1
4 Capital Adequacy
Capital strength is fundamental to the Company’s operation as a credible and viable market participant. To assess the amount of capital necessary to support the Company’s current and prospective risk profile, which ultimately informs the Company’s capital distribution capacity, the Company determines its overall capital requirement under normal and stressed operating environments, both on a current and forward-looking basis. For a further discussion on the Company’s required capital framework, see “MD&A—Liquidity and Capital Resources—Regulatory Requirements—Required Capital” in Part II, Item 7 of the 2014 Form 10-K.
In determining its overall capital requirement, the Company classifies its exposures as either “banking book” or “trading book.” Banking book positions, which may be accounted for at amortized cost, lower of cost or market, fair value or under the equity method, are subject to credit risk capital requirements which are discussed in Section 5 “Credit Risk” included herein. Trading book positions represent positions the Company holds as part of its market-making and underwriting businesses. These positions, which reflect assets or liabilities that are accounted for at fair value, and certain banking book positions which are subject to both credit risk and market risk charges, (collectively, “covered positions”) are risk managed using Value-at-Risk (“VaR”) which are discussed in Section 9 “Market Risk” included herein. Some trading book positions, such as derivatives, are also subject to counterparty credit risk capital requirements. Credit and market risks related to securitization exposures are discussed in Section 7 “Securitization Exposures” included herein.
1 Regulatory requirements, including capital requirements and certain covenants contained in various agreements governing indebtedness of the Company may restrict the Company’s ability to access capital from its subsidiaries. For discussions of restrictions and other major impediments to transfer of funds or capital, see “Risk Factors—Liquidity and Funding Risk” in Part I, Item 1A and Note 14 (Regulatory Requirements) to the consolidated financial statements in Part II, Item 8 of the 2014 Form 10-K. For further information on the Company’s capital structure in accordance with U.S. Basel III, see “MD&A—Liquidity and Capital Resources—Regulatory Requirements” in Part II, Item 7 of the 2014 Form 10-K.
MORGAN STANLEY
Basel III Pillar 3 Disclosures Report
For the Quarterly Period Ended December 31, 2014
3
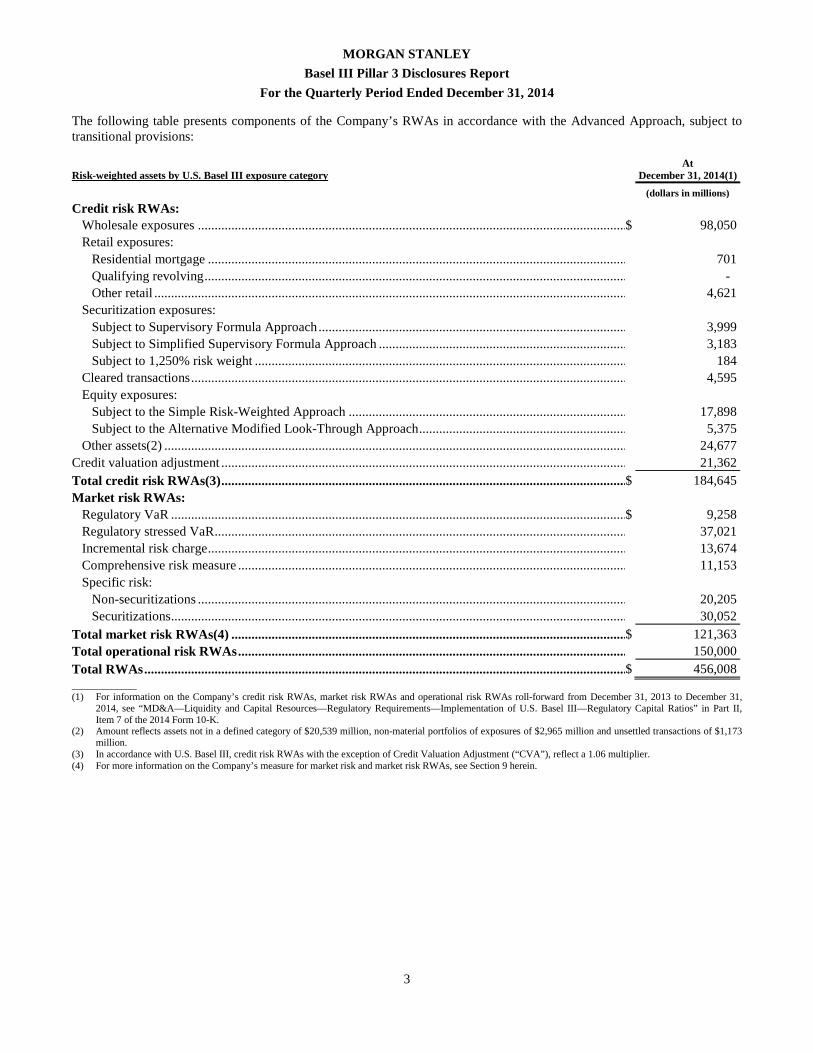
The following table presents components of the Company’s RWAs in accordance with the Advanced Approach, subject to transitional provisions:
Risk-weighted assets by U.S. Basel III exposure category At
December 31, 2014(1)
(dollars in millions)
Credit risk RWAs:
Wholesale exposures ................................................................................................................................$ 98,050 Retail exposures: Residential mortgage ................................................................................................................................ 701 Qualifying revolving ................................................................................................................................ - Other retail ................................................................................................................................................................ 4,621 Securitization exposures: Subject to Supervisory Formula Approach ................................................................................................ 3,999 Subject to Simplified Supervisory Formula Approach ................................................................................................ 3,183 Subject to 1,250% risk weight ................................................................................................................................ 184 Cleared transactions ................................................................................................................................................................ 4,595 Equity exposures: Subject to the Simple Risk-Weighted Approach ................................................................................................ 17,898 Subject to the Alternative Modified Look-Through Approach ................................................................ 5,375 Other assets(2) ................................................................................................................................................................ 24,677 Credit valuation adjustment ................................................................................................................................ 21,362 Total credit risk RWAs(3) ................................................................................................................................$ 184,645 Market risk RWAs: Regulatory VaR ................................................................................................................................................................$ 9,258 Regulatory stressed VaR ................................................................................................................................ 37,021 Incremental risk charge ................................................................................................................................ 13,674 Comprehensive risk measure ................................................................................................................................ 11,153 Specific risk: Non-securitizations ................................................................................................................................ 20,205 Securitizations ................................................................................................................................................................ 30,052 Total market risk RWAs(4) ................................................................................................................................$ 121,363 Total operational risk RWAs ................................................................................................................................ 150,000 Total RWAs ................................................................................................................................................................$ 456,008 _____________ (1) For information on the Company’s credit risk RWAs, market risk RWAs and operational risk RWAs roll-forward from December 31, 2013 to December 31,
2014, see “MD&A—Liquidity and Capital Resources—Regulatory Requirements—Implementation of U.S. Basel III—Regulatory Capital Ratios” in Part II, Item 7 of the 2014 Form 10-K.
(2) Amount reflects assets not in a defined category of $20,539 million, non-material portfolios of exposures of $2,965 million and unsettled transactions of $1,173 million.
(3) In accordance with U.S. Basel III, credit risk RWAs with the exception of Credit Valuation Adjustment (“CVA”), reflect a 1.06 multiplier. (4) For more information on the Company’s measure for market risk and market risk RWAs, see Section 9 herein.
MORGAN STANLEY
Basel III Pillar 3 Disclosures Report
For the Quarterly Period Ended December 31, 2014
4
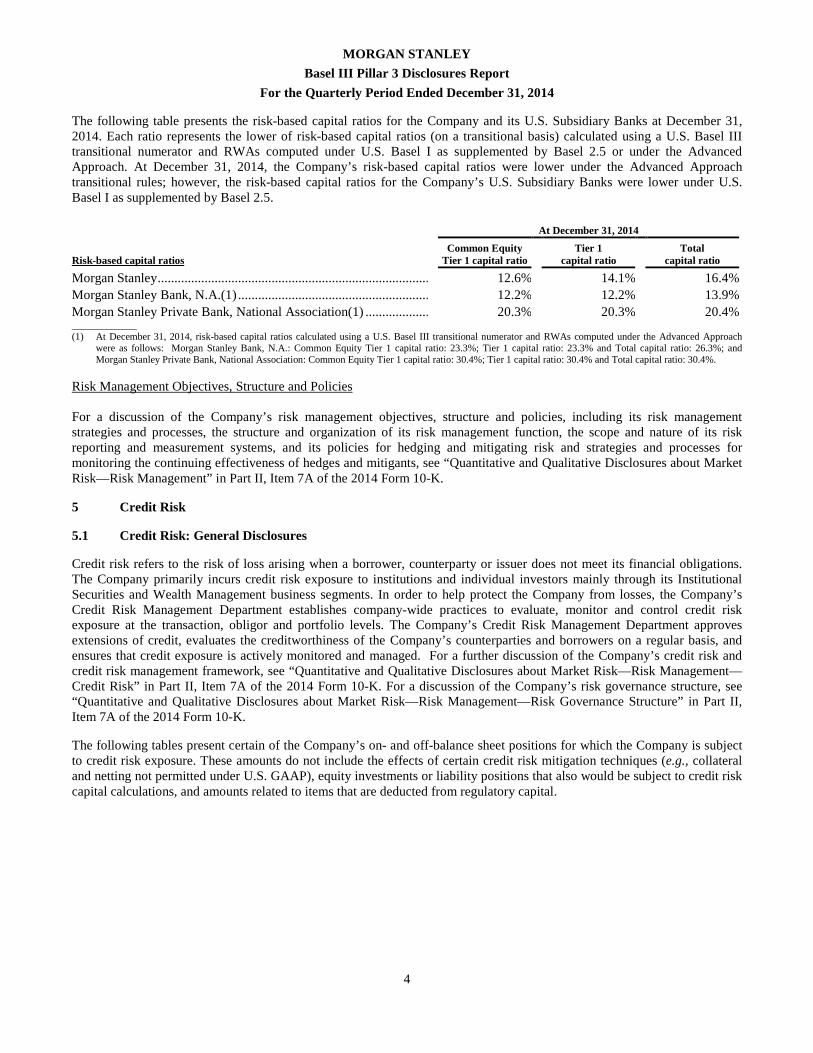
The following table presents the risk-based capital ratios for the Company and its U.S. Subsidiary Banks at December 31, 2014. Each ratio represents the lower of risk-based capital ratios (on a transitional basis) calculated using a U.S. Basel III transitional numerator and RWAs computed under U.S. Basel I as supplemented by Basel 2.5 or under the Advanced Approach. At December 31, 2014, the Company’s risk-based capital ratios were lower under the Advanced Approach transitional rules; however, the risk-based capital ratios for the Company’s U.S. Subsidiary Banks were lower under U.S. Basel I as supplemented by Basel 2.5.
At December 31, 2014
Risk-based capital ratios Common Equity
Tier 1 capital ratio Tier 1
capital ratio Total
capital ratio
Morgan Stanley ................................................................................................ 12.6% 14.1% 16.4%Morgan Stanley Bank, N.A.(1) ................................................................ 12.2% 12.2% 13.9%Morgan Stanley Private Bank, National Association(1) ................................ 20.3% 20.3% 20.4%_____________ (1) At December 31, 2014, risk-based capital ratios calculated using a U.S. Basel III transitional numerator and RWAs computed under the Advanced Approach
were as follows: Morgan Stanley Bank, N.A.: Common Equity Tier 1 capital ratio: 23.3%; Tier 1 capital ratio: 23.3% and Total capital ratio: 26.3%; and Morgan Stanley Private Bank, National Association: Common Equity Tier 1 capital ratio: 30.4%; Tier 1 capital ratio: 30.4% and Total capital ratio: 30.4%.
Risk Management Objectives, Structure and Policies For a discussion of the Company’s risk management objectives, structure and policies, including its risk management strategies and processes, the structure and organization of its risk management function, the scope and nature of its risk reporting and measurement systems, and its policies for hedging and mitigating risk and strategies and processes for monitoring the continuing effectiveness of hedges and mitigants, see “Quantitative and Qualitative Disclosures about Market Risk—Risk Management” in Part II, Item 7A of the 2014 Form 10-K.
5 Credit Risk
5.1 Credit Risk: General Disclosures
Credit risk refers to the risk of loss arising when a borrower, counterparty or issuer does not meet its financial obligations. The Company primarily incurs credit risk exposure to institutions and individual investors mainly through its Institutional Securities and Wealth Management business segments. In order to help protect the Company from losses, the Company’s Credit Risk Management Department establishes company-wide practices to evaluate, monitor and control credit risk exposure at the transaction, obligor and portfolio levels. The Company’s Credit Risk Management Department approves extensions of credit, evaluates the creditworthiness of the Company’s counterparties and borrowers on a regular basis, and ensures that credit exposure is actively monitored and managed. For a further discussion of the Company’s credit risk and credit risk management framework, see “Quantitative and Qualitative Disclosures about Market Risk—Risk Management—Credit Risk” in Part II, Item 7A of the 2014 Form 10-K. For a discussion of the Company’s risk governance structure, see “Quantitative and Qualitative Disclosures about Market Risk—Risk Management—Risk Governance Structure” in Part II, Item 7A of the 2014 Form 10-K.
The following tables present certain of the Company’s on- and off-balance sheet positions for which the Company is subject to credit risk exposure. These amounts do not include the effects of certain credit risk mitigation techniques (e.g., collateral and netting not permitted under U.S. GAAP), equity investments or liability positions that also would be subject to credit risk capital calculations, and amounts related to items that are deducted from regulatory capital.
MORGAN STANLEY
Basel III Pillar 3 Disclosures Report
For the Quarterly Period Ended December 31, 2014
5
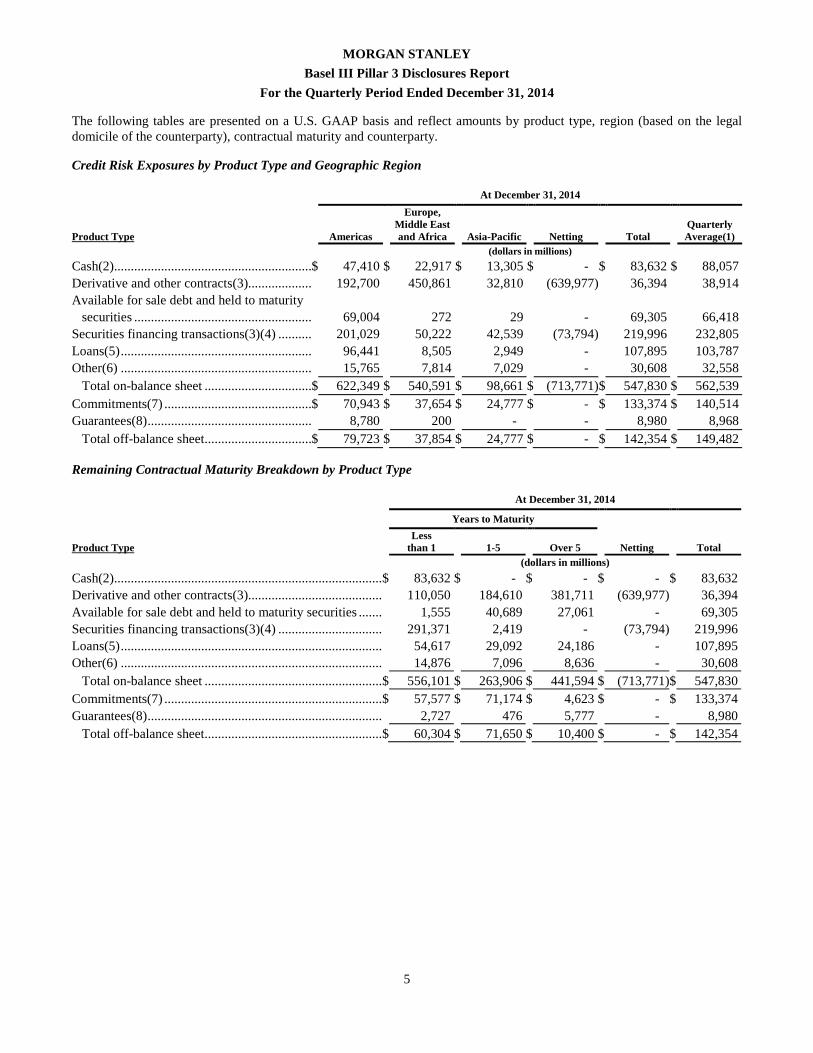
The following tables are presented on a U.S. GAAP basis and reflect amounts by product type, region (based on the legal domicile of the counterparty), contractual maturity and counterparty.
Credit Risk Exposures by Product Type and Geographic Region
At December 31, 2014
Product Type Americas
Europe, Middle East and Africa Asia-Pacific Netting Total
Quarterly Average(1)
(dollars in millions)
Cash(2)................................................................$ 47,410 $ 22,917 $ 13,305 $ - $ 83,632 $ 88,057 Derivative and other contracts(3)................................ 192,700 450,861 32,810 (639,977) 36,394 38,914 Available for sale debt and held to maturity securities ................................................................ 69,004 272 29 - 69,305 66,418 Securities financing transactions(3)(4) ................................ 201,029 50,222 42,539 (73,794) 219,996 232,805 Loans(5) ................................................................ 96,441 8,505 2,949 - 107,895 103,787 Other(6) ................................................................ 15,765 7,814 7,029 - 30,608 32,558 Total on-balance sheet ................................$ 622,349 $ 540,591 $ 98,661 $ (713,771)$ 547,830 $ 562,539 Commitments(7) ................................................................$ 70,943 $ 37,654 $ 24,777 $ - $ 133,374 $ 140,514 Guarantees(8) ................................................................ 8,780 200 - - 8,980 8,968
Total off-balance sheet................................$ 79,723 $ 37,854 $ 24,777 $ - $ 142,354 $ 149,482
Remaining Contractual Maturity Breakdown by Product Type
At December 31, 2014
Years to Maturity
Product Type Less than 1 1-5 Over 5 Netting Total
(dollars in millions)
Cash(2)................................................................................................$ 83,632 $ - $ - $ - $ 83,632 Derivative and other contracts(3)................................................................ 110,050 184,610 381,711 (639,977) 36,394 Available for sale debt and held to maturity securities ................................ 1,555 40,689 27,061 - 69,305 Securities financing transactions(3)(4) ................................ 291,371 2,419 - (73,794) 219,996 Loans(5) ................................................................................................ 54,617 29,092 24,186 - 107,895 Other(6) ................................................................................................ 14,876 7,096 8,636 - 30,608 Total on-balance sheet ................................................................$ 556,101 $ 263,906 $ 441,594 $ (713,771)$ 547,830 Commitments(7) ................................................................................................$ 57,577 $ 71,174 $ 4,623 $ - $ 133,374 Guarantees(8) ................................................................................................ 2,727 476 5,777 - 8,980 Total off-balance sheet................................................................$ 60,304 $ 71,650 $ 10,400 $ - $ 142,354
MORGAN STANLEY
Basel III Pillar 3 Disclosures Report
For the Quarterly Period Ended December 31, 2014
6
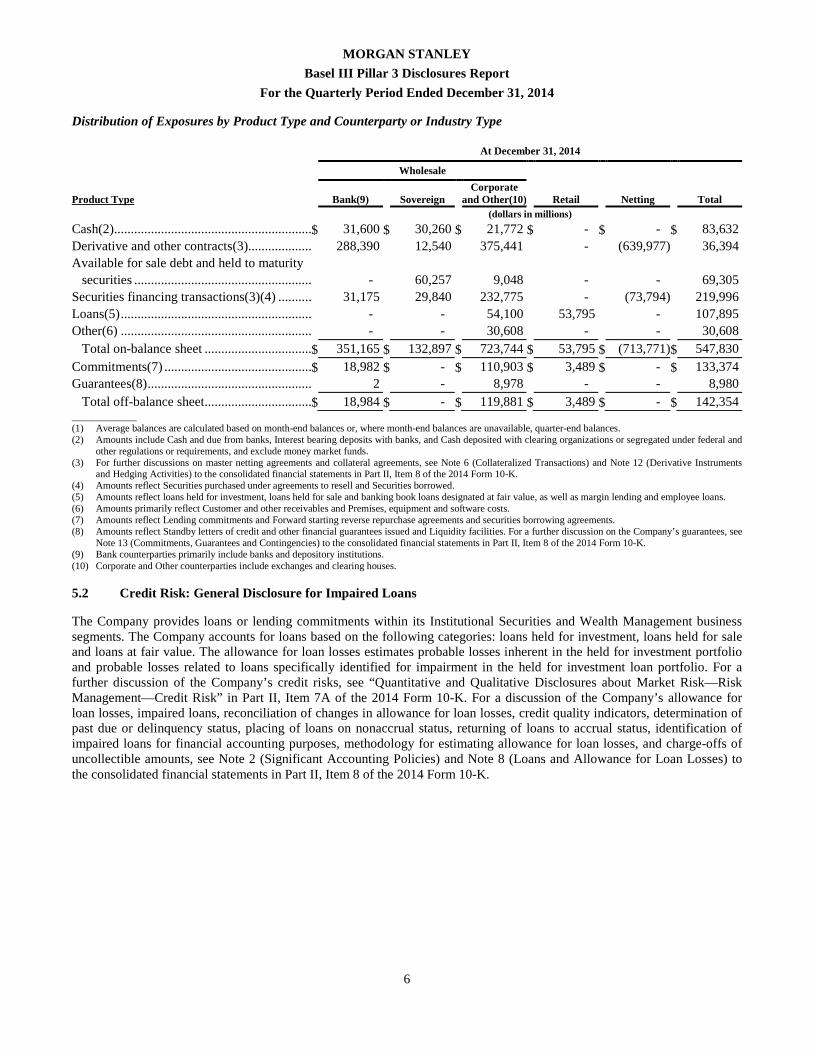
Distribution of Exposures by Product Type and Counterparty or Industry Type
At December 31, 2014
Wholesale
Product Type Bank(9) Sovereign Corporate
and Other(10) Retail Netting Total (dollars in millions)
Cash(2)................................................................$ 31,600 $ 30,260 $ 21,772 $ - $ - $ 83,632 Derivative and other contracts(3)................................ 288,390 12,540 375,441 - (639,977) 36,394 Available for sale debt and held to maturity securities ................................................................ - 60,257 9,048 - - 69,305 Securities financing transactions(3)(4) ................................ 31,175 29,840 232,775 - (73,794) 219,996 Loans(5) ................................................................ - - 54,100 53,795 - 107,895 Other(6) ................................................................ - - 30,608 - - 30,608 Total on-balance sheet ................................$ 351,165 $ 132,897 $ 723,744 $ 53,795 $ (713,771)$ 547,830
Commitments(7) ................................................................$ 18,982 $ - $ 110,903 $ 3,489 $ - $ 133,374 Guarantees(8) ................................................................ 2 - 8,978 - - 8,980 Total off-balance sheet................................$ 18,984 $ - $ 119,881 $ 3,489 $ - $ 142,354 _____________ (1) Average balances are calculated based on month-end balances or, where month-end balances are unavailable, quarter-end balances. (2) Amounts include Cash and due from banks, Interest bearing deposits with banks, and Cash deposited with clearing organizations or segregated under federal and
other regulations or requirements, and exclude money market funds. (3) For further discussions on master netting agreements and collateral agreements, see Note 6 (Collateralized Transactions) and Note 12 (Derivative Instruments
and Hedging Activities) to the consolidated financial statements in Part II, Item 8 of the 2014 Form 10-K. (4) Amounts reflect Securities purchased under agreements to resell and Securities borrowed. (5) Amounts reflect loans held for investment, loans held for sale and banking book loans designated at fair value, as well as margin lending and employee loans. (6) Amounts primarily reflect Customer and other receivables and Premises, equipment and software costs. (7) Amounts reflect Lending commitments and Forward starting reverse repurchase agreements and securities borrowing agreements. (8) Amounts reflect Standby letters of credit and other financial guarantees issued and Liquidity facilities. For a further discussion on the Company’s guarantees, see
Note 13 (Commitments, Guarantees and Contingencies) to the consolidated financial statements in Part II, Item 8 of the 2014 Form 10-K. (9) Bank counterparties primarily include banks and depository institutions. (10) Corporate and Other counterparties include exchanges and clearing houses.
5.2 Credit Risk: General Disclosure for Impaired Loans
The Company provides loans or lending commitments within its Institutional Securities and Wealth Management business segments. The Company accounts for loans based on the following categories: loans held for investment, loans held for sale and loans at fair value. The allowance for loan losses estimates probable losses inherent in the held for investment portfolio and probable losses related to loans specifically identified for impairment in the held for investment loan portfolio. For a further discussion of the Company’s credit risks, see “Quantitative and Qualitative Disclosures about Market Risk—Risk Management—Credit Risk” in Part II, Item 7A of the 2014 Form 10-K. For a discussion of the Company’s allowance for loan losses, impaired loans, reconciliation of changes in allowance for loan losses, credit quality indicators, determination of past due or delinquency status, placing of loans on nonaccrual status, returning of loans to accrual status, identification of impaired loans for financial accounting purposes, methodology for estimating allowance for loan losses, and charge-offs of uncollectible amounts, see Note 2 (Significant Accounting Policies) and Note 8 (Loans and Allowance for Loan Losses) to the consolidated financial statements in Part II, Item 8 of the 2014 Form 10-K.
MORGAN STANLEY
Basel III Pillar 3 Disclosures Report
For the Quarterly Period Ended December 31, 2014
7
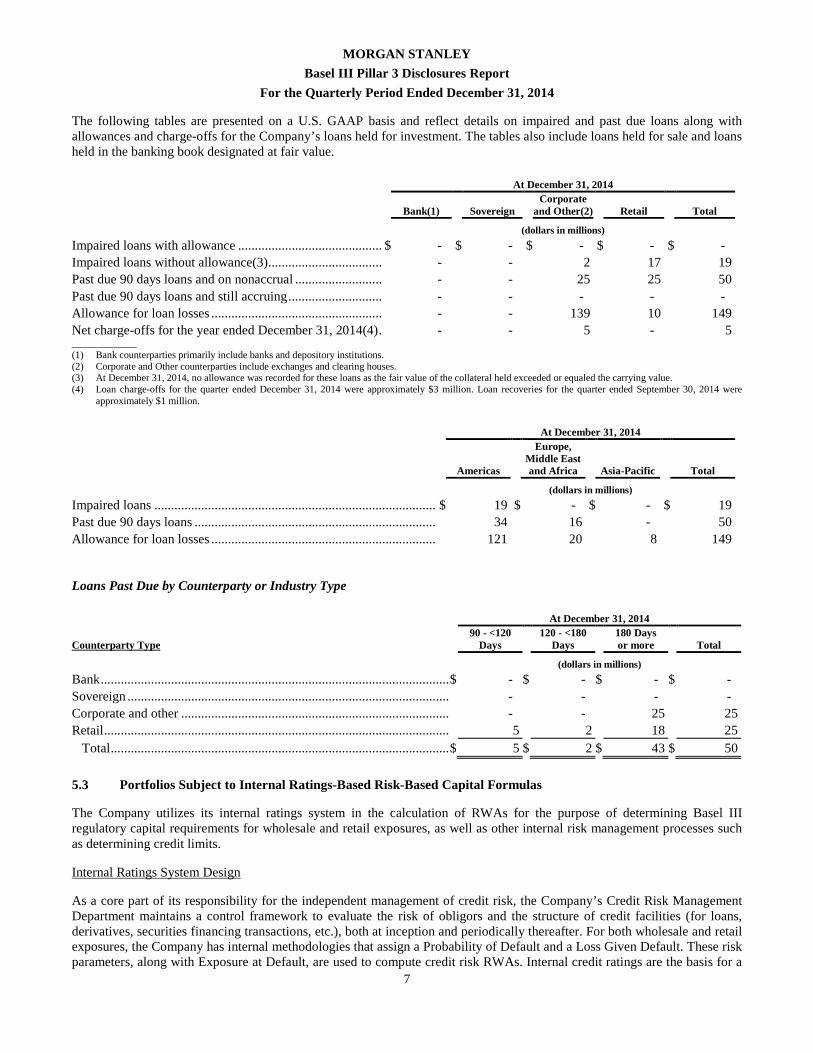
The following tables are presented on a U.S. GAAP basis and reflect details on impaired and past due loans along with allowances and charge-offs for the Company’s loans held for investment. The tables also include loans held for sale and loans held in the banking book designated at fair value.
At December 31, 2014
Bank(1) Sovereign Corporate
and Other(2) Retail Total
(dollars in millions)
Impaired loans with allowance ................................................................$ - $ - $ - $ - $ - Impaired loans without allowance(3) ................................................................ - - 2 17 19 Past due 90 days loans and on nonaccrual ................................ - - 25 25 50 Past due 90 days loans and still accruing ................................ - - - - - Allowance for loan losses ................................................................ - - 139 10 149 Net charge-offs for the year ended December 31, 2014(4) ................................ - - 5 - 5 _____________ (1) Bank counterparties primarily include banks and depository institutions. (2) Corporate and Other counterparties include exchanges and clearing houses. (3) At December 31, 2014, no allowance was recorded for these loans as the fair value of the collateral held exceeded or equaled the carrying value. (4) Loan charge-offs for the quarter ended December 31, 2014 were approximately $3 million. Loan recoveries for the quarter ended September 30, 2014 were
approximately $1 million.
At December 31, 2014
Americas
Europe, Middle East and Africa Asia-Pacific Total
(dollars in millions)
Impaired loans ................................................................................................$ 19 $ - $ - $ 19 Past due 90 days loans ................................................................................................ 34 16 - 50 Allowance for loan losses ................................................................................................ 121 20 8 149
Loans Past Due by Counterparty or Industry Type
At December 31, 2014
Counterparty Type 90 - <120
Days 120 - <180
Days 180 Days or more Total
(dollars in millions)
Bank ................................................................................................................................$ - $ - $ - $ - Sovereign ................................................................................................................................ - - - - Corporate and other ................................................................................................ - - 25 25 Retail ................................................................................................................................ 5 2 18 25 Total ................................................................................................................................$ 5 $ 2 $ 43 $ 50
5.3 Portfolios Subject to Internal Ratings-Based Risk-Based Capital Formulas
The Company utilizes its internal ratings system in the calculation of RWAs for the purpose of determining Basel III regulatory capital requirements for wholesale and retail exposures, as well as other internal risk management processes such as determining credit limits.
Internal Ratings System Design
As a core part of its responsibility for the independent management of credit risk, the Company’s Credit Risk Management Department maintains a control framework to evaluate the risk of obligors and the structure of credit facilities (for loans, derivatives, securities financing transactions, etc.), both at inception and periodically thereafter. For both wholesale and retail exposures, the Company has internal methodologies that assign a Probability of Default and a Loss Given Default. These risk parameters, along with Exposure at Default, are used to compute credit risk RWAs. Internal credit ratings are the basis for a
MORGAN STANLEY
Basel III Pillar 3 Disclosures Report
For the Quarterly Period Ended December 31, 2014
8
comprehensive limits framework used to control credit risk and serve as the Company’s Credit Risk Management Department’s independent assessment of credit risk. To monitor the credit risk of the portfolio, the Company uses quantitative models and expert judgment to estimate the various risk parameters related to each obligor and/or credit facility. Internal ratings procedures, methodologies, models and limits frameworks are all independently and formally governed, and models are reviewed by an independent oversight function.
The Probability of Default represents an estimated long run average likelihood of default of an obligor. The Loss Given Default is an estimate of the economic loss in downturn years incurred by the Company in the event of default by an obligor, expressed as a percentage of Exposure at Default. Exposure at Default is the estimated amount due at the time of default. Exposure at Default for certain products may be reduced by certain credit risk mitigants. Contingent liabilities, such as undrawn commitments and standby letters of credit, may be considered in Exposure at Default.
Internal Ratings System Process
The performance of the overall internal ratings system is monitored on a quarterly basis. This involves a review of key performance measures that include rating overrides, accuracy ratio and comparison of internal ratings versus applicable agency ratings. The review is performed by an independent group, and the results and conclusions are reported to corresponding credit risk governance committees. The overall effectiveness of the internal ratings system is assessed annually and the evaluation results go through a rigorous challenge process by various governance committees before it is presented to the Company’s Board of Directors.
Credit Limits Framework
The Company employs an internal comprehensive and global Credit Limits Framework as one of the primary tools used to evaluate and manage credit exposure across the Company. The Credit Limits Framework includes single-name limits and portfolio concentration limits by country, industry and product type. The limits within the Credit Limits Framework are calibrated to the Company’s risk tolerance and reflect factors that include the Company’s capital levels and the risk attributes of the exposures managed by the limits. Credit exposure is actively monitored against the relevant credit limits, and excesses are escalated in accordance with established governance thresholds. In addition, credit limits are evaluated and reaffirmed at least annually or more frequently as necessary.
Wholesale Exposures
Wholesale exposures are credit risk exposures to institutions and individual investors that may arise from a variety of business activities, including, but not limited to, entering into swap or other derivative contracts under which counterparties have obligations to make payments to the Company; extending credit to clients through various lending commitments; providing short-term or long-term funding that is secured by physical or financial collateral whose value may at times be insufficient to fully cover the loan repayment amount; and posting margin and/or collateral to clearing houses, clearing agencies, exchanges, banks, securities companies and other financial counterparties.
The Company’s Credit Risk Management Department evaluates the creditworthiness of a wholesale obligor (company, individual, sovereign entity or other government entity) by assigning it an internal credit rating, under which obligors are rated based on their ability to perform over a wide range of economic, business and industry conditions.
The Company’s Credit Risk Management Department rates wholesale counterparties based on an analysis of the obligor and industry- or sector-specific qualitative and quantitative factors. The ratings process typically includes an analysis of the obligor’s financial statements, evaluation of its market position, strategy, management, legal and environmental issues; and consideration of industry dynamics affecting its performance. The Company’s Credit Risk Management Department also considers security prices and other financial data reflecting a market view of the obligor. The Company’s Credit Risk Management Department collects relevant information to rate an obligor. If the available information on an obligor is limited, a conservative rating is assigned to reflect uncertainty arising from the limited information.
Retail Exposures
Retail exposures generally include exposures to an individual and exposures to small businesses that are managed as part of a segment of exposures with similar risk characteristics, and not on an individual exposure basis. The Company incurs retail exposure credit risk within its Wealth Management business lending to individual investors, including margin loans
MORGAN STANLEY
Basel III Pillar 3 Disclosures Report
For the Quarterly Period Ended December 31, 2014
9
collateralized by securities and through single-family residential prime mortgage loans in the form of conforming, nonconforming or home equity lines of credit (“HELOC”). In addition, the Company grants loans to certain Wealth Management employees primarily in conjunction with a program to retain and recruit such employees. The primary source of the Company’s retail exposure is concentrated in two of three Basel III retail exposure categories: Residential Mortgages and Other Retail Exposures. The third Basel III retail category, Qualifying Revolving Exposures, is not currently relevant to the Company as it has no assets related to this category.
Retail exposures consist of many small loans, thereby making it generally inefficient to assign ratings to each individual loan. Individual loans, therefore, are segmented and aggregated into pools. The Company’s Credit Risk Management Department develops the methodology to assign Probability of Default, Loss Given Default and Exposure at Default estimates to these pools of exposures with similar risk characteristics, using factors that may include the Fair Isaac Corporation (“FICO”) scores of the borrowers. Exposure at Default for certain products may be reduced by eligible collateral. Contingent liabilities such as undrawn commitments and standby letters of credit are considered in Exposure at Default.
Internal Ratings System Exposures
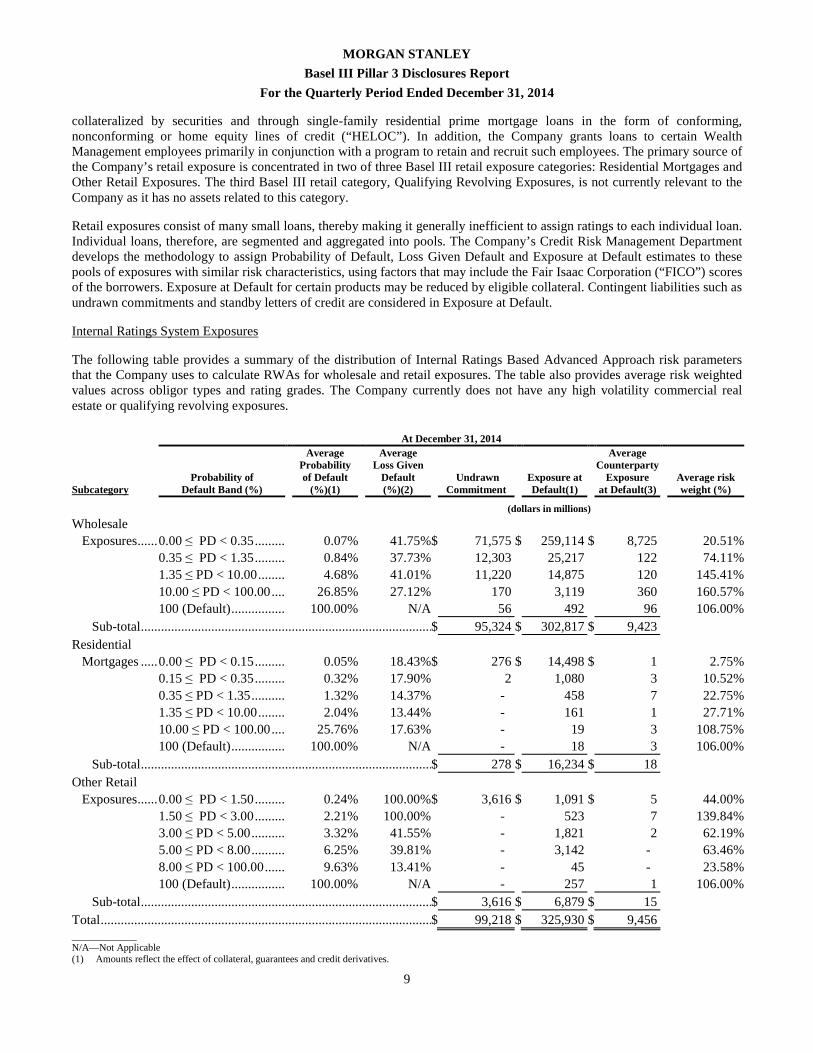
The following table provides a summary of the distribution of Internal Ratings Based Advanced Approach risk parameters that the Company uses to calculate RWAs for wholesale and retail exposures. The table also provides average risk weighted values across obligor types and rating grades. The Company currently does not have any high volatility commercial real estate or qualifying revolving exposures.
At December 31, 2014
Subcategory Probability of
Default Band (%)
Average Probability of Default
(%)(1)
Average Loss Given
Default (%)(2)
Undrawn Commitment
Exposure at Default(1)
Average Counterparty
Exposure at Default(3)
Average risk weight (%)
(dollars in millions)
Wholesale
Exposures ................................0.00 ≤ PD < 0.35 ................................ 0.07% 41.75%$ 71,575 $ 259,114 $ 8,725 20.51% 0.35 ≤ PD < 1.35 ................................ 0.84% 37.73% 12,303 25,217 122 74.11% 1.35 ≤ PD < 10.00 ................................ 4.68% 41.01% 11,220 14,875 120 145.41% 10.00 ≤ PD < 100.00 ................................ 26.85% 27.12% 170 3,119 360 160.57% 100 (Default) ................................ 100.00% N/A 56 492 96 106.00% Sub-total ................................................................................................$ 95,324 $ 302,817 $ 9,423 Residential
Mortgages ................................0.00 ≤ PD < 0.15 ................................ 0.05% 18.43%$ 276 $ 14,498 $ 1 2.75% 0.15 ≤ PD < 0.35 ................................ 0.32% 17.90% 2 1,080 3 10.52% 0.35 ≤ PD < 1.35 ................................ 1.32% 14.37% - 458 7 22.75% 1.35 ≤ PD < 10.00 ................................ 2.04% 13.44% - 161 1 27.71% 10.00 ≤ PD < 100.00 ................................ 25.76% 17.63% - 19 3 108.75% 100 (Default) ................................ 100.00% N/A - 18 3 106.00% Sub-total ................................................................................................$ 278 $ 16,234 $ 18 Other Retail Exposures ................................0.00 ≤ PD < 1.50 ................................ 0.24% 100.00%$ 3,616 $ 1,091 $ 5 44.00% 1.50 ≤ PD < 3.00 ................................ 2.21% 100.00% - 523 7 139.84% 3.00 ≤ PD < 5.00 ................................ 3.32% 41.55% - 1,821 2 62.19% 5.00 ≤ PD < 8.00 ................................ 6.25% 39.81% - 3,142 - 63.46% 8.00 ≤ PD < 100.00 ................................ 9.63% 13.41% - 45 - 23.58% 100 (Default) ................................ 100.00% N/A - 257 1 106.00% Sub-total ................................................................................................$ 3,616 $ 6,879 $ 15 Total ................................................................................................................................$ 99,218 $ 325,930 $ 9,456 _____________ N/A—Not Applicable (1) Amounts reflect the effect of collateral, guarantees and credit derivatives.
MORGAN STANLEY
Basel III Pillar 3 Disclosures Report
For the Quarterly Period Ended December 31, 2014
10
(2) Under U.S. Basel III, credit risk mitigation in the form of collateral may be applied by reducing Exposure at Default or adjusting the Loss Given Default. The Company may apply one or the other approach depending on product type. When collateral mitigation is applied against the Exposure at Default, the Loss Given Default is set at 100% to avoid duplication.
(3) Amounts represent the weighted average exposure at default per counterparty within the respective Probability of Default band, weighted by their pro rata Exposure at Default contribution.
5.4 General Disclosure for Wholesale Counterparty Credit Risk of Derivative Contracts, Repo-Style Transactions and Margin Lending
Counterparty Credit Risk Overview
Counterparty credit exposure arises from the risk that parties are unable to meet their payment obligations under derivative contracts, repo-style transactions and wholesale margin loans. Repo-style transactions include repurchase agreements and securities lending transactions. Derivative contracts and security values have a risk of increased potential future counterparty exposure from changes in movements in market prices and other risk factors. Potential future exposure is mitigated by the use of netting and collateral agreements. The Company uses an internal model to compute expected exposure that includes the mitigating effects of netting and collateral in valuing over-the-counter (“OTC”) and exchange-traded derivative contracts, repo-style transactions and margin lending. The use of netting, collateral, internal models methodology and credit valuation adjustment are discussed further below, in addition to other counterparty credit risk management practices.
Derivative Contracts
The Company actively manages its credit exposure through the application of collateral arrangements and readily available market instruments such as credit derivatives. The use of collateral in managing derivative risk is standard in the market place, and is governed by appropriate documentation such as the Credit Support Annex to the International Swaps and Derivatives Association, Inc. (“ISDA”) documentation. In line with these standards, the Company generally accepts only cash, government bonds, corporate debt and main index equities as collateral. The Company has policies and procedures for reviewing the legal enforceability of credit support documents in accordance with applicable rules.
Repo-Style Transactions
The Company engages in funding activities through the use of repurchase agreements and other repo-style transactions. The Company manages credit exposure arising from reverse repurchase agreements, repurchase agreements, securities borrowing and securities lending transactions by, in appropriate circumstances, entering into master netting and collateral agreements with counterparties that provide the Company, in the event of a customer default, the right to liquidate collateral and the right to offset a counterparty’s rights and obligations. Under these agreements and transactions, the Company either receives or provides collateral, including U.S. government and agency securities, other sovereign government obligations, corporate and other debt, and corporate equities.
Wholesale Margin Lending
The Company also engages in activities to provide additional funding through wholesale margin lending for institutional customers. Customer receivables generated from margin lending activity are collateralized by customer-owned securities held by the Company. The Company monitors required margin levels and established credit limits daily and, pursuant to such guidelines, requires customers to provide additional collateral or reduce positions, when necessary.
Netting
The Company recognizes netting in its estimation of Exposure at Default for its derivative portfolios where it has a master netting agreement in place and other relevant requirements are met. The ISDA Master Agreement is an industry-standard master netting agreement that is typically used to document derivative transactions. The Company generally uses the ISDA Master Agreement and similar master netting agreements to document derivative and repo-style transactions. For a discussion of the Company’s master netting agreements, see Note 6 (Collateralized Transactions) and Note 12 (Derivative Instruments and Hedging Activities) to the consolidated financial statements in Part II, Item 8 of the 2014 Form 10-K.

MORGAN STANLEY
Basel III Pillar 3 Disclosures Report
For the Quarterly Period Ended December 31, 2014
11
Collateral
The Company may require collateral depending on a credit assessment done for each of the Company’s counterparties. There is an established infrastructure to manage, maintain and value collateral on a daily basis. Collateral held is managed in accordance with the Company’s guidelines and the relevant underlying agreements.
For a discussion of the Company’s use of collateral as a credit risk mitigant, including with respect to derivatives, repo-style transactions and margin loans, see Note 6 (Collateralized Transactions) and Note 12 (Derivative Instruments and Hedging Activities) to the consolidated financial statements in Part II, Item 8 of the 2014 Form 10-K. For further information on the Company’s valuation approaches, including for collateral, see Note 2 (Significant Accounting Policies) and Note 4 (Fair Value Disclosures) to the consolidated financial statements included in Part II, Item 8 of the 2014 Form 10-K.
General Disclosure for Counterparty Credit Risk
The following table is presented on a U.S. GAAP basis and reflects the net exposures for derivative and other contracts and securities financing transactions and the gross notional exposures for wholesale margin lending.
At
December 31, 2014
(dollars in millions)
Derivative and Other Contracts: Gross positive fair value ................................................................................................................................................................$ 676,371 Counterparty netting benefit ................................................................................................................................ (576,782) Net current credit exposure ................................................................................................................................$ 99,589 Securities collateral ................................................................................................................................................................ (9,844) Cash collateral ................................................................................................................................................................ (63,214) Net exposure (after netting and collateral) ................................................................................................................................$ 26,531
Repo-Style Transactions: Gross notional exposure................................................................................................................................................................$ 293,790 Net exposure (after netting and collateral) ................................................................................................................................ 12,371 Wholesale Margin Lending: Gross notional exposure(1) ................................................................................................................................$ 12,807 _____________ (1) At December 31, 2014, the fair value of the collateral held exceeded the carrying value of margin loans.
The following table is presented on a U.S. GAAP basis and reflects the notional amount of outstanding credit derivatives at December 31, 2014, used to hedge the Company’s own portfolio and those undertaken in connection with client intermediation activities. The Company believes that the notional amounts of the derivative contracts generally overstate its exposure.
At December 31, 2014 Hedge Portfolio Intermediation Activities
Credit derivative type Purchased Sold Purchased Sold
(dollars in millions)
Credit derivatives: Credit default swaps ................................................................$ 40,590 $ 15,518 $ 884,217 $ 883,030 Total return swaps ................................................................ - - 4,695 5,001 Credit options ................................................................ 3,497 1,200 5,700 8,314 Total ................................................................................................$ 44,087 $ 16,718 $ 894,612 $ 896,345
For a further discussion of the Company’s credit derivatives, see “Quantitative and Qualitative Disclosures about Market Risk—Risk Management—Credit Risk—Credit Exposure–Derivatives—Credit Derivatives” in Part II, Item 7A and Note 12 (Derivative Instruments and Hedging Activities) to the consolidated financial statements in Part II, Item 8 of the 2014 Form 10-K.
MORGAN STANLEY
Basel III Pillar 3 Disclosures Report
For the Quarterly Period Ended December 31, 2014
12
Internal Models Methodology
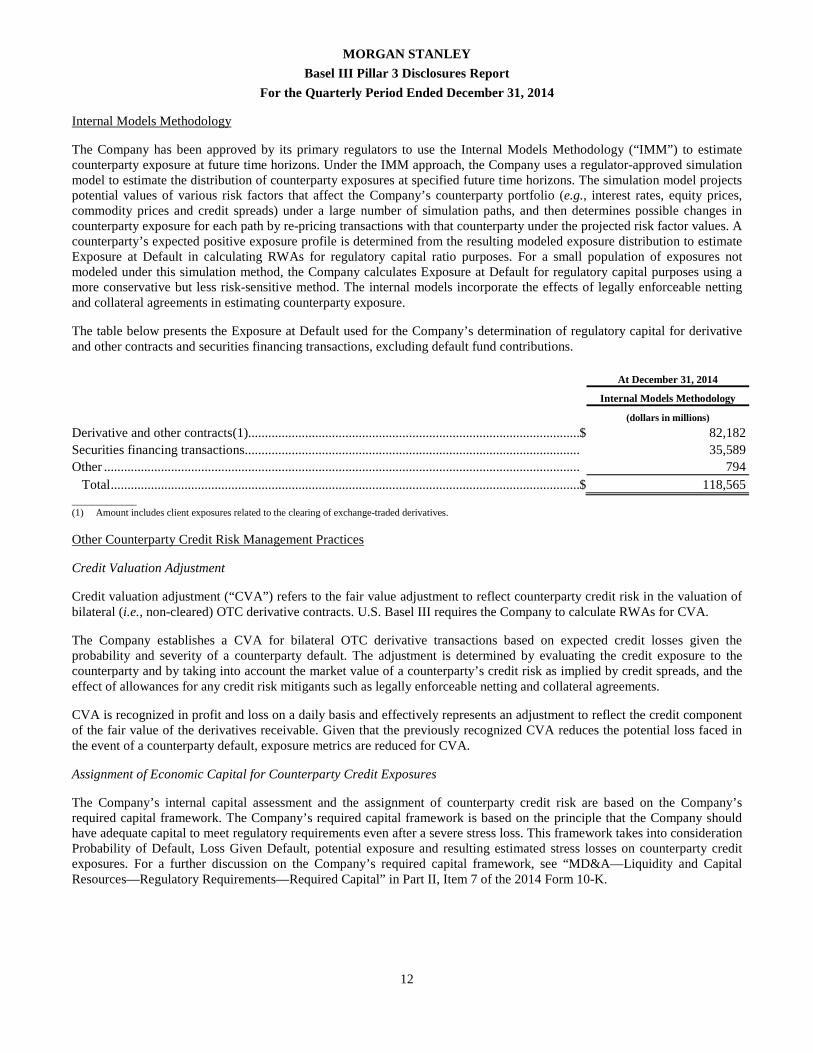
The Company has been approved by its primary regulators to use the Internal Models Methodology (“IMM”) to estimate counterparty exposure at future time horizons. Under the IMM approach, the Company uses a regulator-approved simulation model to estimate the distribution of counterparty exposures at specified future time horizons. The simulation model projects potential values of various risk factors that affect the Company’s counterparty portfolio (e.g., interest rates, equity prices, commodity prices and credit spreads) under a large number of simulation paths, and then determines possible changes in counterparty exposure for each path by re-pricing transactions with that counterparty under the projected risk factor values. A counterparty’s expected positive exposure profile is determined from the resulting modeled exposure distribution to estimate Exposure at Default in calculating RWAs for regulatory capital ratio purposes. For a small population of exposures not modeled under this simulation method, the Company calculates Exposure at Default for regulatory capital purposes using a more conservative but less risk-sensitive method. The internal models incorporate the effects of legally enforceable netting and collateral agreements in estimating counterparty exposure.
The table below presents the Exposure at Default used for the Company’s determination of regulatory capital for derivative and other contracts and securities financing transactions, excluding default fund contributions.
At December 31, 2014
Internal Models Methodology
(dollars in millions)
Derivative and other contracts(1)................................................................................................................................$ 82,182 Securities financing transactions................................................................................................................................ 35,589 Other ................................................................................................................................................................ 794 Total ................................................................................................................................................................$ 118,565 _____________ (1) Amount includes client exposures related to the clearing of exchange-traded derivatives.
Other Counterparty Credit Risk Management Practices
Credit Valuation Adjustment
Credit valuation adjustment (“CVA”) refers to the fair value adjustment to reflect counterparty credit risk in the valuation of bilateral (i.e., non-cleared) OTC derivative contracts. U.S. Basel III requires the Company to calculate RWAs for CVA.
The Company establishes a CVA for bilateral OTC derivative transactions based on expected credit losses given the probability and severity of a counterparty default. The adjustment is determined by evaluating the credit exposure to the counterparty and by taking into account the market value of a counterparty’s credit risk as implied by credit spreads, and the effect of allowances for any credit risk mitigants such as legally enforceable netting and collateral agreements.
CVA is recognized in profit and loss on a daily basis and effectively represents an adjustment to reflect the credit component of the fair value of the derivatives receivable. Given that the previously recognized CVA reduces the potential loss faced in the event of a counterparty default, exposure metrics are reduced for CVA.
Assignment of Economic Capital for Counterparty Credit Exposures
The Company’s internal capital assessment and the assignment of counterparty credit risk are based on the Company’s required capital framework. The Company’s required capital framework is based on the principle that the Company should have adequate capital to meet regulatory requirements even after a severe stress loss. This framework takes into consideration Probability of Default, Loss Given Default, potential exposure and resulting estimated stress losses on counterparty credit exposures. For a further discussion on the Company’s required capital framework, see “MD&A—Liquidity and Capital Resources—Regulatory Requirements—Required Capital” in Part II, Item 7 of the 2014 Form 10-K.
MORGAN STANLEY
Basel III Pillar 3 Disclosures Report
For the Quarterly Period Ended December 31, 2014
13
Additional Collateral Requirements Due to Credit Rating Downgrade
For a discussion of the additional collateral or termination payments that may be called in the event of a future credit rating downgrade of the Company, see “MD&A—Liquidity and Capital Resources—Credit Ratings” in Part II, Item 7 of the 2014 Form 10-K.
Wrong-Way Risk
The Company incorporates the effect of specific wrong-way risk in its calculation of the counterparty exposure. Specific wrong-way risk arises when a transaction is structured in such a way that the exposure to the counterparty is positively correlated with the Probability of Default of the counterparty; for example, a counterparty writing put options on its own stock or a counterparty collateralized by its own or related party stock. The Company considers specific wrong-way risk when approving transactions. The Company also monitors general wrong-way risk, which arises when the counterparty Probability of Default is correlated with general market or macroeconomic factors. The credit assessment process identifies these correlations and manages the risk accordingly.
5.5 Credit Risk Mitigation
Overview
In addition to the use of netting and collateral for mitigating counterparty credit risk discussed above, the Company may seek to mitigate credit risk from its lending and derivatives transactions in multiple ways, including through the use of guarantees and hedges. At the transaction level, the Company seeks to mitigate risk through management of key risk elements such as size, tenor, financial covenants, seniority and collateral. The Company actively hedges its lending and derivatives exposure through various financial instruments that may include single-name, portfolio and structured credit derivatives. Additionally, the Company may sell, assign or syndicate funded loans and lending commitments to other financial institutions in the primary and secondary loan market.
In connection with its derivatives activities, the Company generally enters into master netting agreements and collateral arrangements with counterparties. These agreements provide the Company with the ability to demand collateral, as well as to liquidate collateral and offset receivables and payables covered under the same master netting agreement in the event of a counterparty default. For further information on the impact of netting on the Company’s credit exposures, see “Collateral” in Section 5.4 herein and “Quantitative and Qualitative Disclosures about Market Risk—Risk Management—Credit Risk” in Part II, Item 7A of the 2014 Form 10-K.
Loan Collateral Recognition and Management
Collateralizing loans significantly reduces the credit risk to the Company. As part of the credit evaluation process, when possible, the Company’s Credit Risk Management Department assesses the ability of obligors to grant collateral. The Company’s Credit Risk Management Department may consider the receipt of collateral as a factor when approving loans, as applicable.
Loans secured by customer margin accounts, a source of credit exposure, are collateralized in accordance with internal and regulatory guidelines. The Company monitors required margin levels and established credit limits daily, and pursuant to such guidelines, requires customers to provide additional collateral, or reduce positions, when necessary. Factors considered in the review of margin loans are the amount of the loan, the intended purpose, the degree of leverage being employed in the account, and overall evaluation of the portfolio to ensure diversification or, in the case of concentrated positions, appropriate liquidity of the underlying collateral or potential hedging strategies to reduce risk. Additionally, transactions relating to concentrated or restricted positions require a review of any legal impediments to liquidation of the underlying collateral. Underlying collateral for margin loans is reviewed with respect to the liquidity of the proposed collateral positions, valuation of securities, historic trading range, volatility analysis and an evaluation of industry concentrations.
With respect to first and second mortgages, including HELOC loans, a loan evaluation process is adopted within a framework of the credit underwriting policies and collateral valuation. Loan-to-collateral value ratios are determined based on independent third-party property appraisal/valuations, and the security lien position is established through title/ownership reports.
MORGAN STANLEY
Basel III Pillar 3 Disclosures Report
For the Quarterly Period Ended December 31, 2014
14
Guarantees and Credit Derivatives
The Company may accept or request guarantees from related or third parties to mitigate credit risk for wholesale obligors. Such arrangements represent obligations for the guarantor to make payments to the Company if counterparty fails to fulfill its obligation under a borrowing arrangement or other contractual obligation. The Company typically accepts guarantees from corporate entities and financial institutions within its Institutional Securities business segment, and individuals and their small- and medium-sized domestic businesses within its Wealth Management business segment.. The Company may also hedge certain exposures using credit derivatives. The Company enters into credit derivatives, principally through credit default swaps, under which it receives or provides protection against the risk of default on a set of debt obligations issued by a specified reference entity or entities. A majority of the Company’s hedge counterparties are banks, broker-dealers, insurance and other financial institutions.
The Company recognizes certain credit derivatives and third-party guarantees for the reduction of capital requirements under the Advanced Approach. At December 31, 2014, the aggregate Exposure at Default amount of the Company’s wholesale exposure hedged by such credit derivatives or third-party guarantees, excluding CVA hedges, was $3,212 million.
6 Equities Not Subject to Market Risk Capital Rule
Overview
The Company from time to time makes equity investments that may include business facilitation or other investing activities. Such investments are typically strategic investments undertaken by the Company to facilitate core business activities. From time to time, the Company may also make equity investments and capital commitments to public and private companies, funds and other entities. Additionally, the Company sponsors and manages investment vehicles and separate accounts for clients seeking exposure to private equity, infrastructure, mezzanine lending and real estate-related and other alternative investments. The Company may also invest in and provide capital to such investment vehicles.
Valuation for equity investments not subject to market risk capital rule
The Company’s equity investments include investments in private equity funds, real estate funds and hedge funds (which include investments made in connection with certain employee deferred compensation plans), as well as direct investments in equity securities, which are recorded at fair value.
The Company applies the Alternative Modified Look-Through Approach for equity exposures to investment funds. Under this approach, the adjusted carrying value of an equity exposure to an investment fund is assigned on a pro rata basis to different risk weight categories based on the information in the fund’s prospectus or related documents. For all other equity exposures, the Company applies the Simple Risk-Weight Approach (“SRWA”). Under SRWA, the RWA for each equity exposure is calculated by multiplying the adjusted carrying value of the equity exposure by the applicable regulatory prescribed risk weight.
MORGAN STANLEY
Basel III Pillar 3 Disclosures Report
For the Quarterly Period Ended December 31, 2014
15
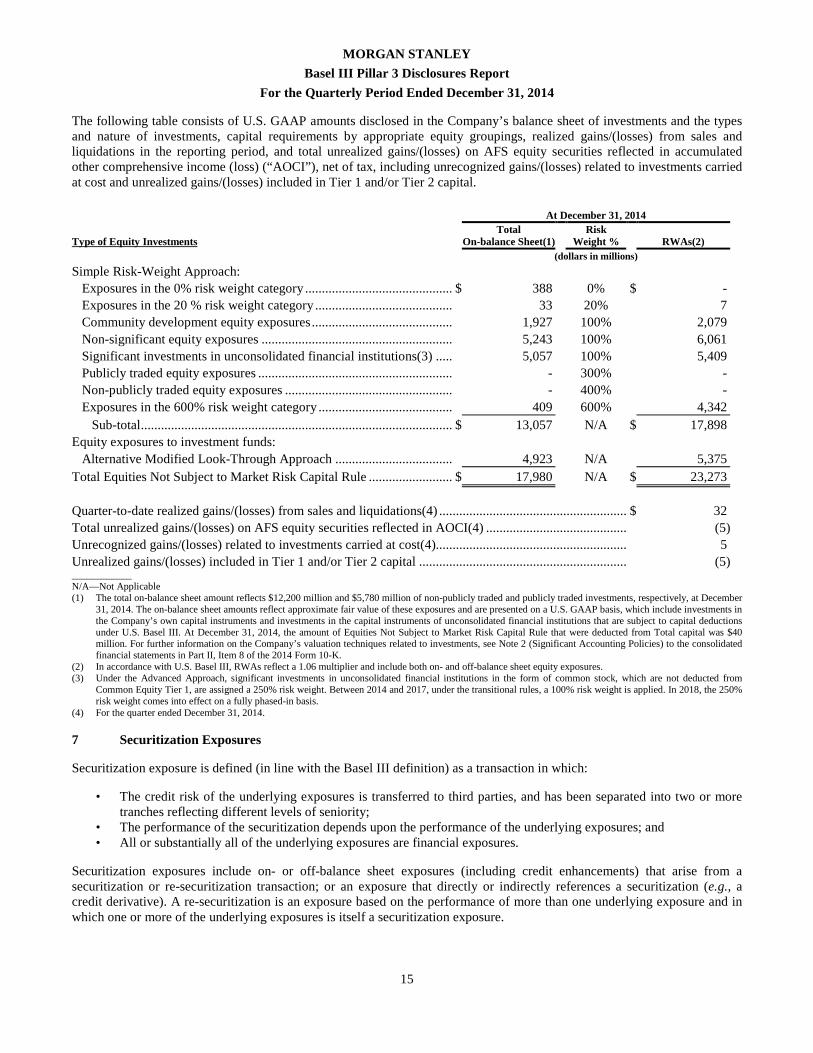
The following table consists of U.S. GAAP amounts disclosed in the Company’s balance sheet of investments and the types and nature of investments, capital requirements by appropriate equity groupings, realized gains/(losses) from sales and liquidations in the reporting period, and total unrealized gains/(losses) on AFS equity securities reflected in accumulated other comprehensive income (loss) (“AOCI”), net of tax, including unrecognized gains/(losses) related to investments carried at cost and unrealized gains/(losses) included in Tier 1 and/or Tier 2 capital.
At December 31, 2014
Type of Equity Investments Total
On-balance Sheet(1) Risk
Weight % RWAs(2) (dollars in millions) Simple Risk-Weight Approach: Exposures in the 0% risk weight category ................................................................$ 388 0% $ - Exposures in the 20 % risk weight category ................................................................ 33 20% 7 Community development equity exposures ................................................................ 1,927 100% 2,079 Non-significant equity exposures ................................................................ 5,243 100% 6,061 Significant investments in unconsolidated financial institutions(3) ................................ 5,057 100% 5,409 Publicly traded equity exposures ................................................................ - 300% - Non-publicly traded equity exposures ................................................................ - 400% - Exposures in the 600% risk weight category ................................................................ 409 600% 4,342 Sub-total ................................................................................................$ 13,057 N/A $ 17,898 Equity exposures to investment funds: Alternative Modified Look-Through Approach ................................................................ 4,923 N/A 5,375 Total Equities Not Subject to Market Risk Capital Rule ................................$ 17,980 N/A $ 23,273 Quarter-to-date realized gains/(losses) from sales and liquidations(4) ................................................................$ 32 Total unrealized gains/(losses) on AFS equity securities reflected in AOCI(4) ................................................................ (5)Unrecognized gains/(losses) related to investments carried at cost(4)................................................................ 5 Unrealized gains/(losses) included in Tier 1 and/or Tier 2 capital ................................................................ (5)____________ N/A—Not Applicable (1) The total on-balance sheet amount reflects $12,200 million and $5,780 million of non-publicly traded and publicly traded investments, respectively, at December
31, 2014. The on-balance sheet amounts reflect approximate fair value of these exposures and are presented on a U.S. GAAP basis, which include investments in the Company’s own capital instruments and investments in the capital instruments of unconsolidated financial institutions that are subject to capital deductions under U.S. Basel III. At December 31, 2014, the amount of Equities Not Subject to Market Risk Capital Rule that were deducted from Total capital was $40 million. For further information on the Company’s valuation techniques related to investments, see Note 2 (Significant Accounting Policies) to the consolidated financial statements in Part II, Item 8 of the 2014 Form 10-K.
(2) In accordance with U.S. Basel III, RWAs reflect a 1.06 multiplier and include both on- and off-balance sheet equity exposures. (3) Under the Advanced Approach, significant investments in unconsolidated financial institutions in the form of common stock, which are not deducted from
Common Equity Tier 1, are assigned a 250% risk weight. Between 2014 and 2017, under the transitional rules, a 100% risk weight is applied. In 2018, the 250% risk weight comes into effect on a fully phased-in basis.
(4) For the quarter ended December 31, 2014.
7 Securitization Exposures
Securitization exposure is defined (in line with the Basel III definition) as a transaction in which:
• The credit risk of the underlying exposures is transferred to third parties, and has been separated into two or more tranches reflecting different levels of seniority;
• The performance of the securitization depends upon the performance of the underlying exposures; and • All or substantially all of the underlying exposures are financial exposures.
Securitization exposures include on- or off-balance sheet exposures (including credit enhancements) that arise from a securitization or re-securitization transaction; or an exposure that directly or indirectly references a securitization (e.g., a credit derivative). A re-securitization is an exposure based on the performance of more than one underlying exposure and in which one or more of the underlying exposures is itself a securitization exposure.
MORGAN STANLEY
Basel III Pillar 3 Disclosures Report
For the Quarterly Period Ended December 31, 2014
16
On-balance sheet exposures include securities and loans for which securitization trusts are the counterparty. Off-balance sheet exposures include liquidity commitments and derivatives (including tranched credit derivatives and derivatives for which the reference obligation is a securitization).
Securitization exposures are classified as either traditional or synthetic. In a traditional securitization, the originator establishes a special purpose entity (“SPE”) and sells assets (either originated or purchased) off its balance sheet into the SPE, which issues securities to investors. In a synthetic securitization, credit risk is transferred to an investor through the use of credit derivatives or guarantees. In a synthetic securitization, there is no change in accounting treatment for the assets securitized.
The Company does not manage or advise entities that invest in securitizations sponsored by the Company.
Except for (i) its AFS securities portfolios, for which the Company purchases mostly highly rated tranches of commercial mortgage and other securitizations not sponsored by the Company, and (ii) warehouse loans to client sponsored SPEs, the Company engages in securitizations primarily as a trading activity.
The Company retains securities issued in securitization transactions it sponsors, and it purchases securities issued in securitization transactions sponsored by others as part of its trading inventory. These interests are included in the consolidated statements of financial condition at fair value with mark-to-market changes reported in the trading book.
For further information on securitization transactions in which the Company holds any exposure in either the banking book or the trading book, see the tables in “Transfers of Assets with Continuing Involvement” in Note 7 (Variable Interest Entities and Securitization Activities) to the consolidated financial statements in Part II, Item 8 of the 2014 Form 10-K.
7.1 Accounting and Valuation
For a discussion of the Company’s accounting and valuation techniques related to securitization, see Note 2 (Significant Accounting Policies), Note 4 (Fair Value Measurements) and Note 7 (Variable Interest Entities and Securitization Activities) to the consolidated financial statements in Part II, Item 8 of the 2014 Form 10-K.
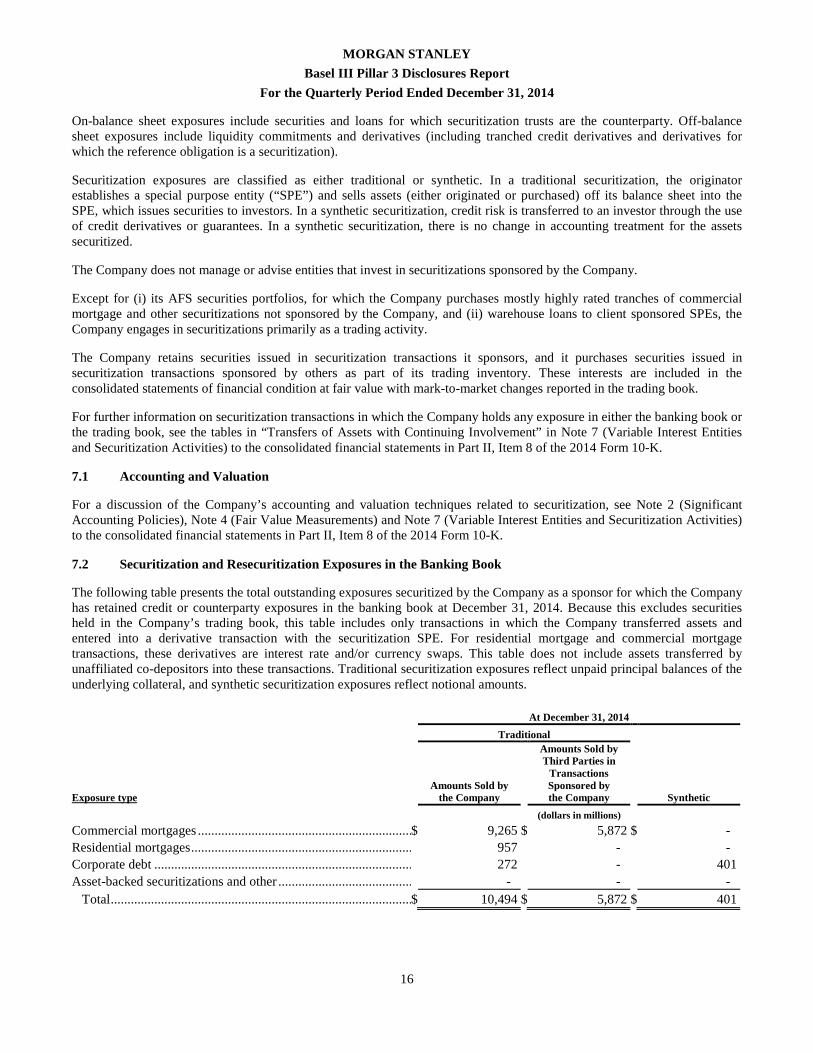
7.2 Securitization and Resecuritization Exposures in the Banking Book
The following table presents the total outstanding exposures securitized by the Company as a sponsor for which the Company has retained credit or counterparty exposures in the banking book at December 31, 2014. Because this excludes securities held in the Company’s trading book, this table includes only transactions in which the Company transferred assets and entered into a derivative transaction with the securitization SPE. For residential mortgage and commercial mortgage transactions, these derivatives are interest rate and/or currency swaps. This table does not include assets transferred by unaffiliated co-depositors into these transactions. Traditional securitization exposures reflect unpaid principal balances of the underlying collateral, and synthetic securitization exposures reflect notional amounts.
At December 31, 2014
Traditional
Exposure type Amounts Sold by
the Company
Amounts Sold by Third Parties in
Transactions Sponsored by the Company Synthetic
(dollars in millions)
Commercial mortgages ................................................................$ 9,265 $ 5,872 $ - Residential mortgages ................................................................................................ 957 - - Corporate debt ................................................................................................ 272 - 401 Asset-backed securitizations and other ................................................................ - - - Total ................................................................................................$ 10,494 $ 5,872 $ 401
MORGAN STANLEY
Basel III Pillar 3 Disclosures Report
For the Quarterly Period Ended December 31, 2014
17
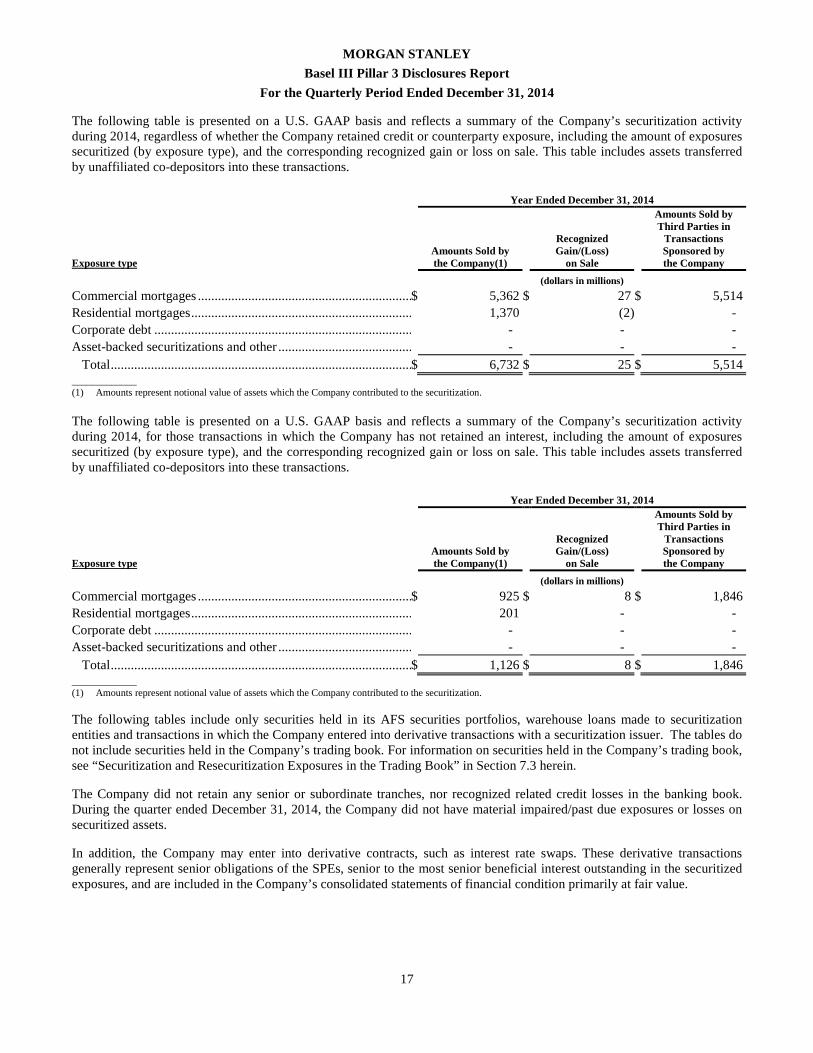
The following table is presented on a U.S. GAAP basis and reflects a summary of the Company’s securitization activity during 2014, regardless of whether the Company retained credit or counterparty exposure, including the amount of exposures securitized (by exposure type), and the corresponding recognized gain or loss on sale. This table includes assets transferred by unaffiliated co-depositors into these transactions.
Year Ended December 31, 2014
Exposure type Amounts Sold by the Company(1)
Recognized Gain/(Loss)
on Sale
Amounts Sold by Third Parties in
Transactions Sponsored by the Company
(dollars in millions)
Commercial mortgages ................................................................$ 5,362 $ 27 $ 5,514 Residential mortgages ................................................................................................ 1,370 (2) - Corporate debt ................................................................................................ - - - Asset-backed securitizations and other ................................................................ - - - Total ................................................................................................$ 6,732 $ 25 $ 5,514 _____________ (1) Amounts represent notional value of assets which the Company contributed to the securitization.
The following table is presented on a U.S. GAAP basis and reflects a summary of the Company’s securitization activity during 2014, for those transactions in which the Company has not retained an interest, including the amount of exposures securitized (by exposure type), and the corresponding recognized gain or loss on sale. This table includes assets transferred by unaffiliated co-depositors into these transactions.
Year Ended December 31, 2014
Exposure type Amounts Sold by the Company(1)
Recognized Gain/(Loss)
on Sale
Amounts Sold by Third Parties in
Transactions Sponsored by the Company
(dollars in millions)
Commercial mortgages ................................................................$ 925 $ 8 $ 1,846 Residential mortgages ................................................................................................ 201 - - Corporate debt ................................................................................................ - - - Asset-backed securitizations and other ................................................................ - - - Total ................................................................................................$ 1,126 $ 8 $ 1,846 _____________ (1) Amounts represent notional value of assets which the Company contributed to the securitization.
The following tables include only securities held in its AFS securities portfolios, warehouse loans made to securitization entities and transactions in which the Company entered into derivative transactions with a securitization issuer. The tables do not include securities held in the Company’s trading book. For information on securities held in the Company’s trading book, see “Securitization and Resecuritization Exposures in the Trading Book” in Section 7.3 herein.
The Company did not retain any senior or subordinate tranches, nor recognized related credit losses in the banking book. During the quarter ended December 31, 2014, the Company did not have material impaired/past due exposures or losses on securitized assets.
In addition, the Company may enter into derivative contracts, such as interest rate swaps. These derivative transactions generally represent senior obligations of the SPEs, senior to the most senior beneficial interest outstanding in the securitized exposures, and are included in the Company’s consolidated statements of financial condition primarily at fair value.
MORGAN STANLEY
Basel III Pillar 3 Disclosures Report
For the Quarterly Period Ended December 31, 2014
18
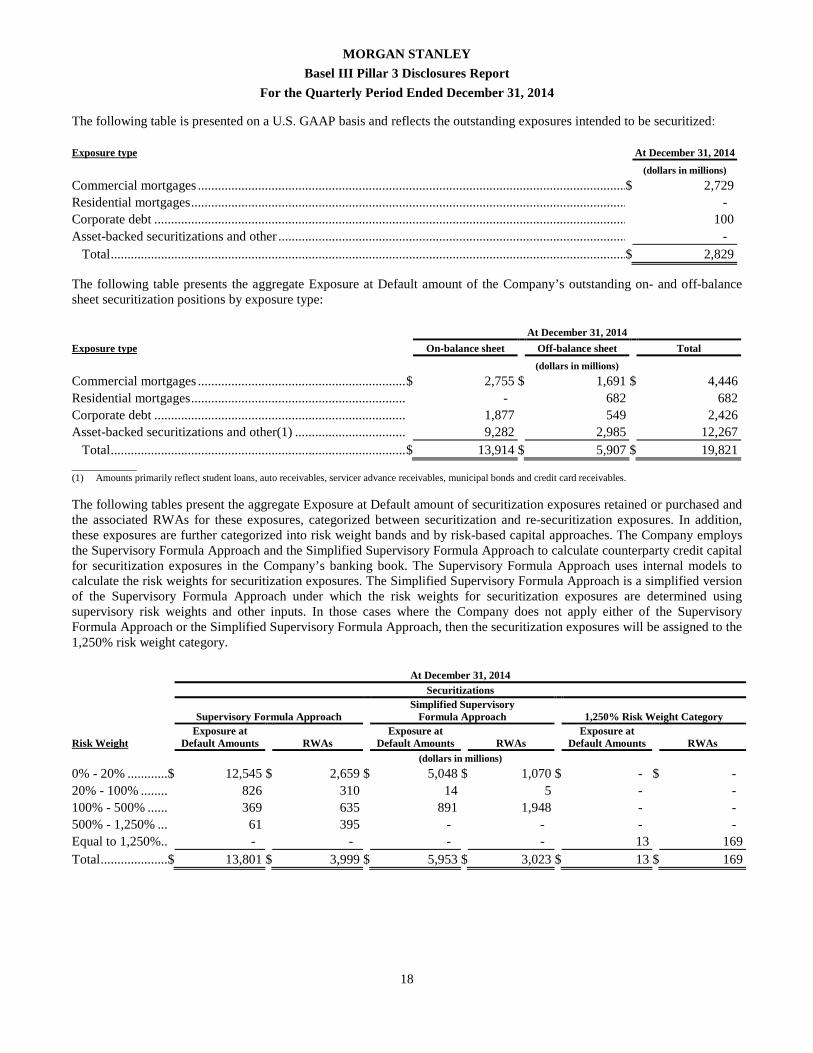
The following table is presented on a U.S. GAAP basis and reflects the outstanding exposures intended to be securitized:
Exposure type At December 31, 2014
(dollars in millions)
Commercial mortgages ................................................................................................................................$ 2,729 Residential mortgages ................................................................................................................................................................ - Corporate debt ................................................................................................................................................................ 100 Asset-backed securitizations and other ................................................................................................................................ - Total ................................................................................................................................................................$ 2,829
The following table presents the aggregate Exposure at Default amount of the Company’s outstanding on- and off-balance sheet securitization positions by exposure type:
At December 31, 2014
Exposure type On-balance sheet Off-balance sheet Total
(dollars in millions)
Commercial mortgages ................................................................$ 2,755 $ 1,691 $ 4,446 Residential mortgages ................................................................................................ - 682 682 Corporate debt ................................................................................................ 1,877 549 2,426 Asset-backed securitizations and other(1) ................................................................ 9,282 2,985 12,267 Total ................................................................................................$ 13,914 $ 5,907 $ 19,821 _____________ (1) Amounts primarily reflect student loans, auto receivables, servicer advance receivables, municipal bonds and credit card receivables.
The following tables present the aggregate Exposure at Default amount of securitization exposures retained or purchased and the associated RWAs for these exposures, categorized between securitization and re-securitization exposures. In addition, these exposures are further categorized into risk weight bands and by risk-based capital approaches. The Company employs the Supervisory Formula Approach and the Simplified Supervisory Formula Approach to calculate counterparty credit capital for securitization exposures in the Company’s banking book. The Supervisory Formula Approach uses internal models to calculate the risk weights for securitization exposures. The Simplified Supervisory Formula Approach is a simplified version of the Supervisory Formula Approach under which the risk weights for securitization exposures are determined using supervisory risk weights and other inputs. In those cases where the Company does not apply either of the Supervisory Formula Approach or the Simplified Supervisory Formula Approach, then the securitization exposures will be assigned to the 1,250% risk weight category.
At December 31, 2014 Securitizations
Supervisory Formula Approach Simplified Supervisory
Formula Approach 1,250% Risk Weight Category
Risk Weight Exposure at
Default Amounts RWAs Exposure at
Default Amounts RWAs Exposure at
Default Amounts RWAs (dollars in millions)
0% - 20% ................................$ 12,545 $ 2,659 $ 5,048 $ 1,070 $ - $ - 20% - 100% ................................ 826 310 14 5 - - 100% - 500% ................................ 369 635 891 1,948 - - 500% - 1,250% ................................ 61 395 - - - - Equal to 1,250%................................ - - - - 13 169 Total ................................$ 13,801 $ 3,999 $ 5,953 $ 3,023 $ 13 $ 169
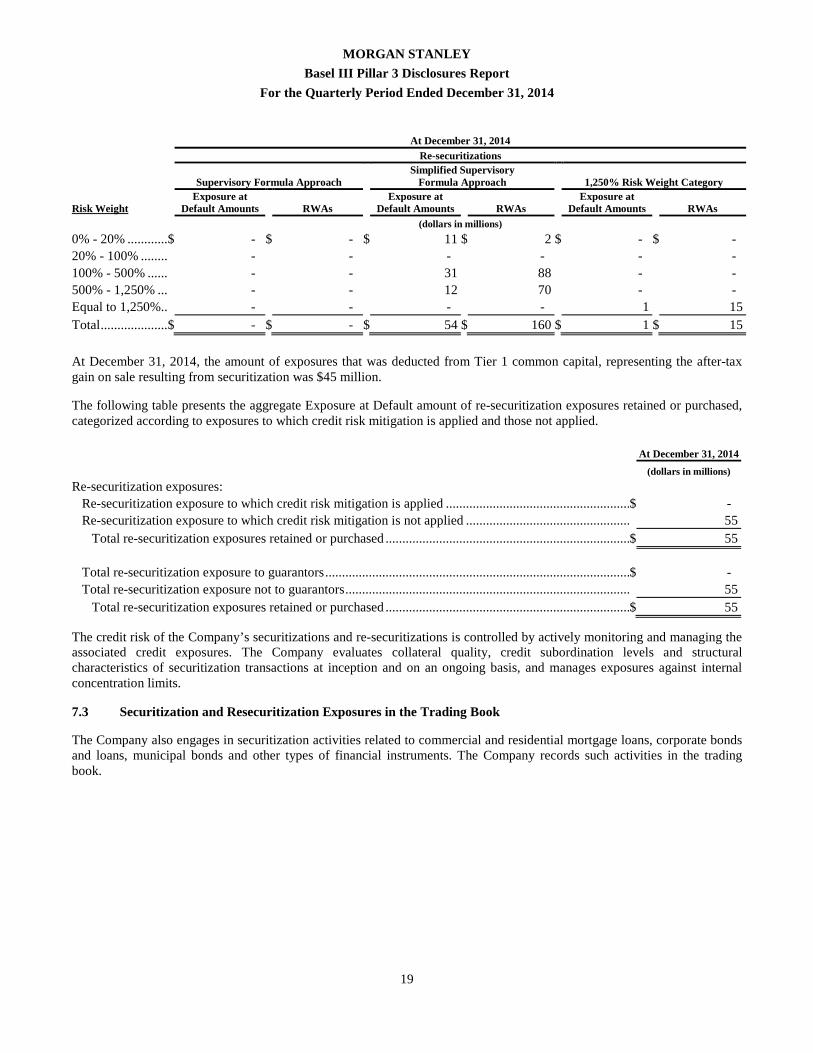
MORGAN STANLEY
Basel III Pillar 3 Disclosures Report
For the Quarterly Period Ended December 31, 2014
19
At December 31, 2014 Re-securitizations
Supervisory Formula Approach Simplified Supervisory
Formula Approach 1,250% Risk Weight Category
Risk Weight Exposure at
Default Amounts RWAs Exposure at
Default Amounts RWAs Exposure at
Default Amounts RWAs (dollars in millions)
0% - 20% ................................$ - $ - $ 11 $ 2 $ - $ - 20% - 100% ................................ - - - - - - 100% - 500% ................................ - - 31 88 - - 500% - 1,250% ................................ - - 12 70 - - Equal to 1,250%................................ - - - - 1 15 Total ................................$ - $ - $ 54 $ 160 $ 1 $ 15
At December 31, 2014, the amount of exposures that was deducted from Tier 1 common capital, representing the after-tax gain on sale resulting from securitization was $45 million.
The following table presents the aggregate Exposure at Default amount of re-securitization exposures retained or purchased, categorized according to exposures to which credit risk mitigation is applied and those not applied.
At December 31, 2014
(dollars in millions)
Re-securitization exposures:
Re-securitization exposure to which credit risk mitigation is applied ................................................................$ - Re-securitization exposure to which credit risk mitigation is not applied ................................................................ 55 Total re-securitization exposures retained or purchased ................................................................................................$ 55 Total re-securitization exposure to guarantors ................................................................................................$ - Total re-securitization exposure not to guarantors ................................................................................................ 55 Total re-securitization exposures retained or purchased ................................................................................................$ 55
The credit risk of the Company’s securitizations and re-securitizations is controlled by actively monitoring and managing the associated credit exposures. The Company evaluates collateral quality, credit subordination levels and structural characteristics of securitization transactions at inception and on an ongoing basis, and manages exposures against internal concentration limits.
7.3 Securitization and Resecuritization Exposures in the Trading Book
The Company also engages in securitization activities related to commercial and residential mortgage loans, corporate bonds and loans, municipal bonds and other types of financial instruments. The Company records such activities in the trading book.
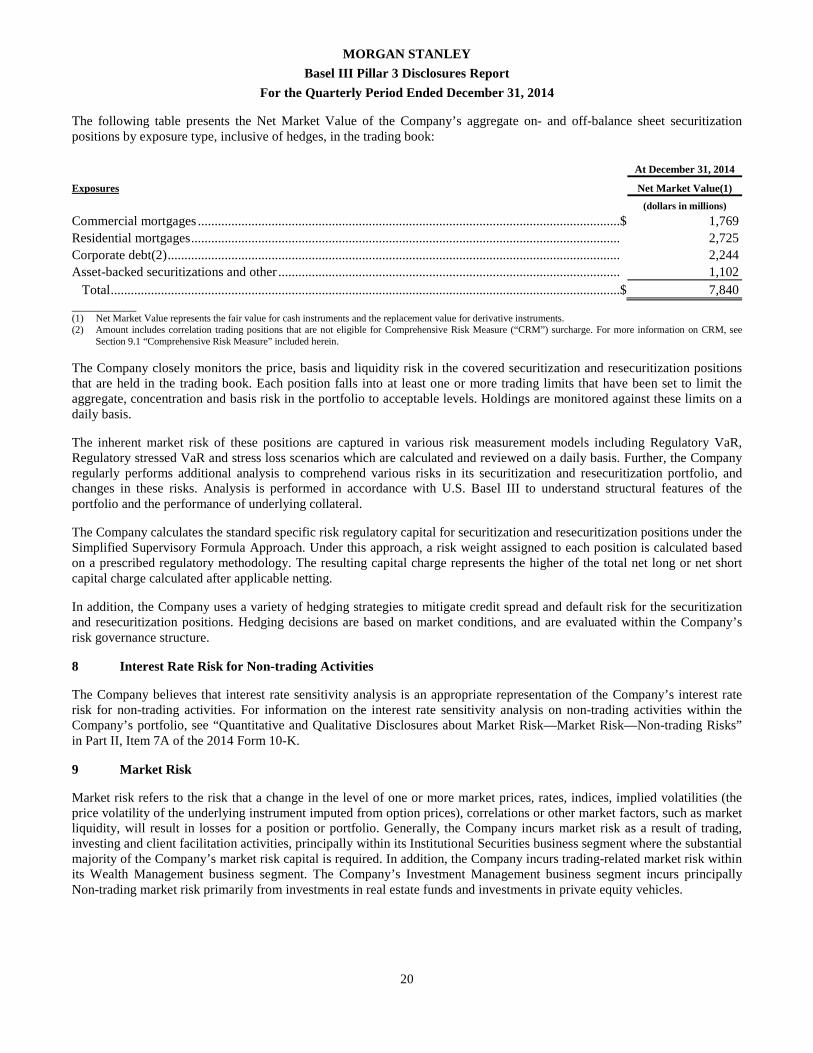
MORGAN STANLEY
Basel III Pillar 3 Disclosures Report
For the Quarterly Period Ended December 31, 2014
20
The following table presents the Net Market Value of the Company’s aggregate on- and off-balance sheet securitization positions by exposure type, inclusive of hedges, in the trading book:
At December 31, 2014 Exposures Net Market Value(1)
(dollars in millions)
Commercial mortgages ................................................................................................................................$ 1,769 Residential mortgages ................................................................................................................................ 2,725 Corporate debt(2) ................................................................................................................................................................ 2,244 Asset-backed securitizations and other ................................................................................................................................ 1,102 Total ................................................................................................................................................................$ 7,840
_____________
(1) Net Market Value represents the fair value for cash instruments and the replacement value for derivative instruments. (2) Amount includes correlation trading positions that are not eligible for Comprehensive Risk Measure (“CRM”) surcharge. For more information on CRM, see
Section 9.1 “Comprehensive Risk Measure” included herein.
The Company closely monitors the price, basis and liquidity risk in the covered securitization and resecuritization positions that are held in the trading book. Each position falls into at least one or more trading limits that have been set to limit the aggregate, concentration and basis risk in the portfolio to acceptable levels. Holdings are monitored against these limits on a daily basis.
The inherent market risk of these positions are captured in various risk measurement models including Regulatory VaR, Regulatory stressed VaR and stress loss scenarios which are calculated and reviewed on a daily basis. Further, the Company regularly performs additional analysis to comprehend various risks in its securitization and resecuritization portfolio, and changes in these risks. Analysis is performed in accordance with U.S. Basel III to understand structural features of the portfolio and the performance of underlying collateral.
The Company calculates the standard specific risk regulatory capital for securitization and resecuritization positions under the Simplified Supervisory Formula Approach. Under this approach, a risk weight assigned to each position is calculated based on a prescribed regulatory methodology. The resulting capital charge represents the higher of the total net long or net short capital charge calculated after applicable netting.
In addition, the Company uses a variety of hedging strategies to mitigate credit spread and default risk for the securitization and resecuritization positions. Hedging decisions are based on market conditions, and are evaluated within the Company’s risk governance structure.
8 Interest Rate Risk for Non-trading Activities
The Company believes that interest rate sensitivity analysis is an appropriate representation of the Company’s interest rate risk for non-trading activities. For information on the interest rate sensitivity analysis on non-trading activities within the Company’s portfolio, see “Quantitative and Qualitative Disclosures about Market Risk—Market Risk—Non-trading Risks” in Part II, Item 7A of the 2014 Form 10-K.
9 Market Risk
Market risk refers to the risk that a change in the level of one or more market prices, rates, indices, implied volatilities (the price volatility of the underlying instrument imputed from option prices), correlations or other market factors, such as market liquidity, will result in losses for a position or portfolio. Generally, the Company incurs market risk as a result of trading, investing and client facilitation activities, principally within its Institutional Securities business segment where the substantial majority of the Company’s market risk capital is required. In addition, the Company incurs trading-related market risk within its Wealth Management business segment. The Company’s Investment Management business segment incurs principally Non-trading market risk primarily from investments in real estate funds and investments in private equity vehicles.
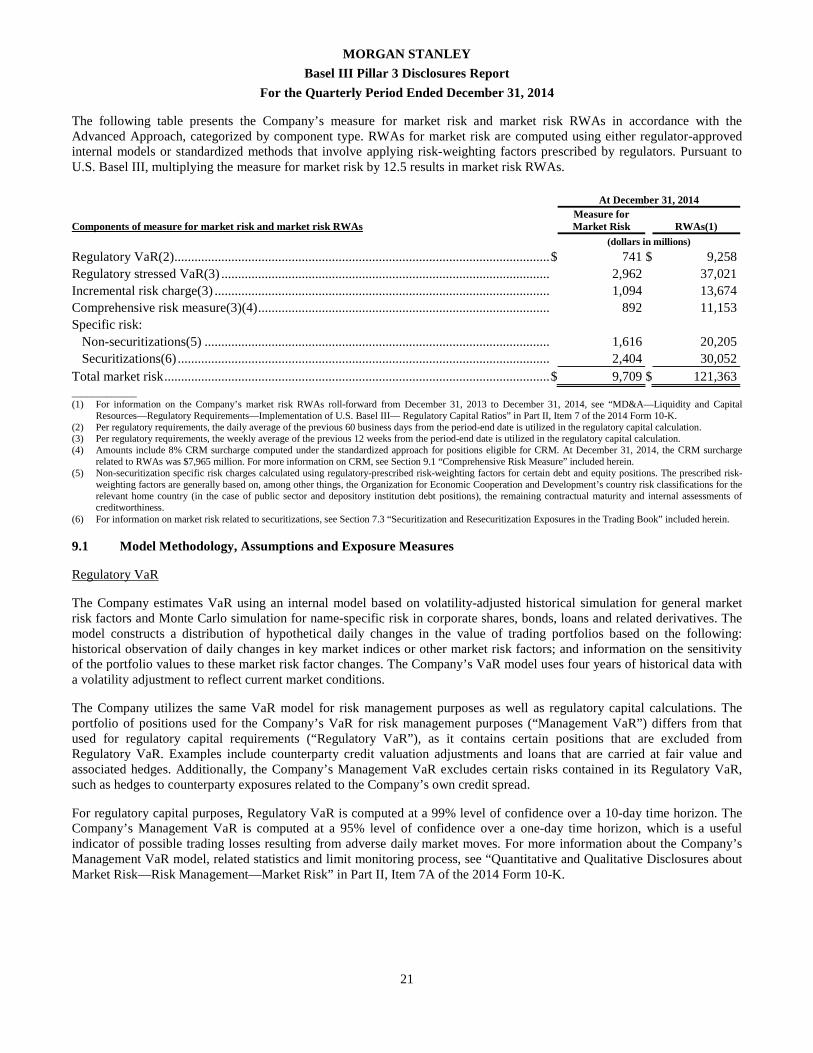
MORGAN STANLEY
Basel III Pillar 3 Disclosures Report
For the Quarterly Period Ended December 31, 2014
21
The following table presents the Company’s measure for market risk and market risk RWAs in accordance with the Advanced Approach, categorized by component type. RWAs for market risk are computed using either regulator-approved internal models or standardized methods that involve applying risk-weighting factors prescribed by regulators. Pursuant to U.S. Basel III, multiplying the measure for market risk by 12.5 results in market risk RWAs.
At December 31, 2014
Components of measure for market risk and market risk RWAs Measure for Market Risk RWAs(1)
(dollars in millions)
Regulatory VaR(2) ................................................................................................................................$ 741 $ 9,258 Regulatory stressed VaR(3) ................................................................................................................................ 2,962 37,021 Incremental risk charge(3) ................................................................................................................................ 1,094 13,674 Comprehensive risk measure(3)(4) ................................................................................................ 892 11,153 Specific risk: Non-securitizations(5) ................................................................................................................................ 1,616 20,205 Securitizations(6) ................................................................................................................................ 2,404 30,052 Total market risk ................................................................................................................................$ 9,709 $ 121,363 _____________ (1) For information on the Company’s market risk RWAs roll-forward from December 31, 2013 to December 31, 2014, see “MD&A—Liquidity and Capital
Resources—Regulatory Requirements—Implementation of U.S. Basel III— Regulatory Capital Ratios” in Part II, Item 7 of the 2014 Form 10-K. (2) Per regulatory requirements, the daily average of the previous 60 business days from the period-end date is utilized in the regulatory capital calculation. (3) Per regulatory requirements, the weekly average of the previous 12 weeks from the period-end date is utilized in the regulatory capital calculation. (4) Amounts include 8% CRM surcharge computed under the standardized approach for positions eligible for CRM. At December 31, 2014, the CRM surcharge
related to RWAs was $7,965 million. For more information on CRM, see Section 9.1 “Comprehensive Risk Measure” included herein. (5) Non-securitization specific risk charges calculated using regulatory-prescribed risk-weighting factors for certain debt and equity positions. The prescribed risk-
weighting factors are generally based on, among other things, the Organization for Economic Cooperation and Development’s country risk classifications for the relevant home country (in the case of public sector and depository institution debt positions), the remaining contractual maturity and internal assessments of creditworthiness.
(6) For information on market risk related to securitizations, see Section 7.3 “Securitization and Resecuritization Exposures in the Trading Book” included herein.
9.1 Model Methodology, Assumptions and Exposure Measures
Regulatory VaR
The Company estimates VaR using an internal model based on volatility-adjusted historical simulation for general market risk factors and Monte Carlo simulation for name-specific risk in corporate shares, bonds, loans and related derivatives. The model constructs a distribution of hypothetical daily changes in the value of trading portfolios based on the following: historical observation of daily changes in key market indices or other market risk factors; and information on the sensitivity of the portfolio values to these market risk factor changes. The Company’s VaR model uses four years of historical data with a volatility adjustment to reflect current market conditions.
The Company utilizes the same VaR model for risk management purposes as well as regulatory capital calculations. The portfolio of positions used for the Company’s VaR for risk management purposes (“Management VaR”) differs from that used for regulatory capital requirements (“Regulatory VaR”), as it contains certain positions that are excluded from Regulatory VaR. Examples include counterparty credit valuation adjustments and loans that are carried at fair value and associated hedges. Additionally, the Company’s Management VaR excludes certain risks contained in its Regulatory VaR, such as hedges to counterparty exposures related to the Company’s own credit spread.
For regulatory capital purposes, Regulatory VaR is computed at a 99% level of confidence over a 10-day time horizon. The Company’s Management VaR is computed at a 95% level of confidence over a one-day time horizon, which is a useful indicator of possible trading losses resulting from adverse daily market moves. For more information about the Company’s Management VaR model, related statistics and limit monitoring process, see “Quantitative and Qualitative Disclosures about Market Risk—Risk Management—Market Risk” in Part II, Item 7A of the 2014 Form 10-K.
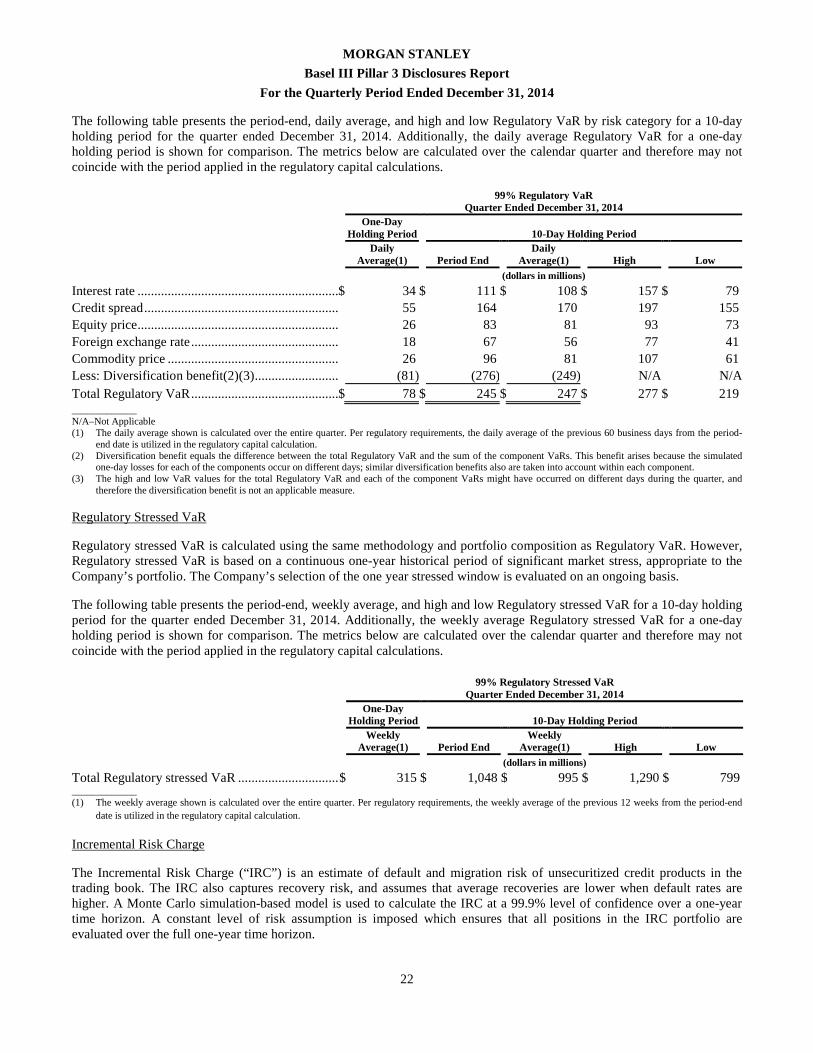
MORGAN STANLEY
Basel III Pillar 3 Disclosures Report
For the Quarterly Period Ended December 31, 2014
22
The following table presents the period-end, daily average, and high and low Regulatory VaR by risk category for a 10-day holding period for the quarter ended December 31, 2014. Additionally, the daily average Regulatory VaR for a one-day holding period is shown for comparison. The metrics below are calculated over the calendar quarter and therefore may not coincide with the period applied in the regulatory capital calculations.
99% Regulatory VaR
Quarter Ended December 31, 2014
One-Day
Holding Period 10-Day Holding Period
Daily
Average(1) Period End Daily
Average(1) High Low (dollars in millions)
Interest rate ................................................................$ 34 $ 111 $ 108 $ 157 $ 79 Credit spread ................................................................ 55 164 170 197 155 Equity price ................................................................ 26 83 81 93 73 Foreign exchange rate ................................................................ 18 67 56 77 41 Commodity price ................................................................ 26 96 81 107 61 Less: Diversification benefit(2)(3) ................................ (81) (276) (249) N/A N/ATotal Regulatory VaR ................................................................$ 78 $ 245 $ 247 $ 277 $ 219 _____________ N/A–Not Applicable (1) The daily average shown is calculated over the entire quarter. Per regulatory requirements, the daily average of the previous 60 business days from the period-
end date is utilized in the regulatory capital calculation. (2) Diversification benefit equals the difference between the total Regulatory VaR and the sum of the component VaRs. This benefit arises because the simulated
one-day losses for each of the components occur on different days; similar diversification benefits also are taken into account within each component. (3) The high and low VaR values for the total Regulatory VaR and each of the component VaRs might have occurred on different days during the quarter, and
therefore the diversification benefit is not an applicable measure.
Regulatory Stressed VaR
Regulatory stressed VaR is calculated using the same methodology and portfolio composition as Regulatory VaR. However, Regulatory stressed VaR is based on a continuous one-year historical period of significant market stress, appropriate to the Company’s portfolio. The Company’s selection of the one year stressed window is evaluated on an ongoing basis.
The following table presents the period-end, weekly average, and high and low Regulatory stressed VaR for a 10-day holding period for the quarter ended December 31, 2014. Additionally, the weekly average Regulatory stressed VaR for a one-day holding period is shown for comparison. The metrics below are calculated over the calendar quarter and therefore may not coincide with the period applied in the regulatory capital calculations.
99% Regulatory Stressed VaR
Quarter Ended December 31, 2014
One-Day
Holding Period 10-Day Holding Period
Weekly
Average(1) Period End Weekly
Average(1) High Low (dollars in millions)
Total Regulatory stressed VaR ................................$ 315 $ 1,048 $ 995 $ 1,290 $ 799 _____________ (1) The weekly average shown is calculated over the entire quarter. Per regulatory requirements, the weekly average of the previous 12 weeks from the period-end
date is utilized in the regulatory capital calculation.
Incremental Risk Charge
The Incremental Risk Charge (“IRC”) is an estimate of default and migration risk of unsecuritized credit products in the trading book. The IRC also captures recovery risk, and assumes that average recoveries are lower when default rates are higher. A Monte Carlo simulation-based model is used to calculate the IRC at a 99.9% level of confidence over a one-year time horizon. A constant level of risk assumption is imposed which ensures that all positions in the IRC portfolio are evaluated over the full one-year time horizon.
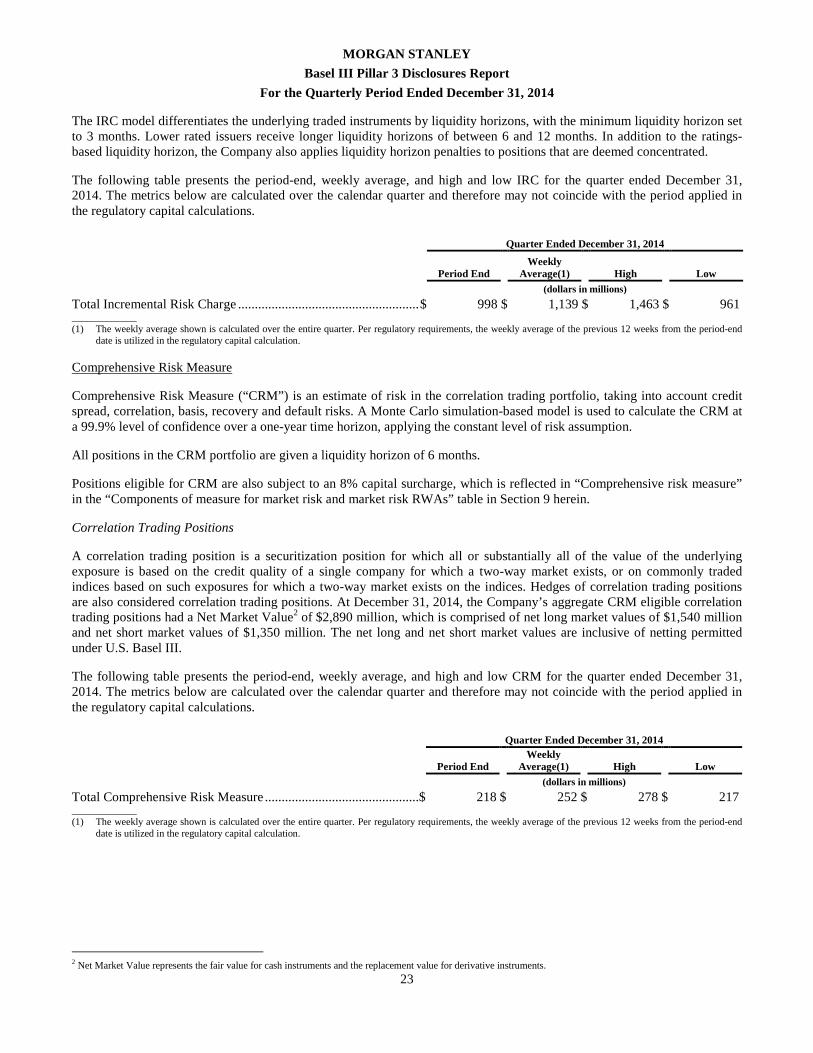
MORGAN STANLEY
Basel III Pillar 3 Disclosures Report
For the Quarterly Period Ended December 31, 2014
23
The IRC model differentiates the underlying traded instruments by liquidity horizons, with the minimum liquidity horizon set to 3 months. Lower rated issuers receive longer liquidity horizons of between 6 and 12 months. In addition to the ratings-based liquidity horizon, the Company also applies liquidity horizon penalties to positions that are deemed concentrated.
The following table presents the period-end, weekly average, and high and low IRC for the quarter ended December 31, 2014. The metrics below are calculated over the calendar quarter and therefore may not coincide with the period applied in the regulatory capital calculations.
Quarter Ended December 31, 2014
Period End Weekly
Average(1) High Low (dollars in millions)
Total Incremental Risk Charge ................................................................$ 998 $ 1,139 $ 1,463 $ 961 _____________ (1) The weekly average shown is calculated over the entire quarter. Per regulatory requirements, the weekly average of the previous 12 weeks from the period-end
date is utilized in the regulatory capital calculation.
Comprehensive Risk Measure
Comprehensive Risk Measure (“CRM”) is an estimate of risk in the correlation trading portfolio, taking into account credit spread, correlation, basis, recovery and default risks. A Monte Carlo simulation-based model is used to calculate the CRM at a 99.9% level of confidence over a one-year time horizon, applying the constant level of risk assumption.
All positions in the CRM portfolio are given a liquidity horizon of 6 months.
Positions eligible for CRM are also subject to an 8% capital surcharge, which is reflected in “Comprehensive risk measure” in the “Components of measure for market risk and market risk RWAs” table in Section 9 herein.
Correlation Trading Positions
A correlation trading position is a securitization position for which all or substantially all of the value of the underlying exposure is based on the credit quality of a single company for which a two-way market exists, or on commonly traded indices based on such exposures for which a two-way market exists on the indices. Hedges of correlation trading positions are also considered correlation trading positions. At December 31, 2014, the Company’s aggregate CRM eligible correlation trading positions had a Net Market Value2 of $2,890 million, which is comprised of net long market values of $1,540 million and net short market values of $1,350 million. The net long and net short market values are inclusive of netting permitted under U.S. Basel III.
The following table presents the period-end, weekly average, and high and low CRM for the quarter ended December 31, 2014. The metrics below are calculated over the calendar quarter and therefore may not coincide with the period applied in the regulatory capital calculations.
Quarter Ended December 31, 2014
Period End Weekly
Average(1) High Low (dollars in millions)
Total Comprehensive Risk Measure ................................................................$ 218 $ 252 $ 278 $ 217 _____________ (1) The weekly average shown is calculated over the entire quarter. Per regulatory requirements, the weekly average of the previous 12 weeks from the period-end
date is utilized in the regulatory capital calculation.
2 Net Market Value represents the fair value for cash instruments and the replacement value for derivative instruments.
MORGAN STANLEY
Basel III Pillar 3 Disclosures Report
For the Quarterly Period Ended December 31, 2014
24
9.2 Model Limitations
The Company uses VaR and Stressed VaR as components in a range of risk management tools. Among their benefits, VaR models permit estimation of a portfolio’s aggregate market risk exposure, incorporating a range of varied market risks and portfolio assets. However, VaR has various limitations, which include, but are not limited to: use of historical changes in market risk factors, which may not be accurate predictors of future market conditions, and may not fully incorporate the risk of extreme market events that are outsized relative to observed historical market behavior or reflect the historical distribution of results beyond the 99% confidence interval; and reporting of losses over a defined time horizon, which does not reflect the risk of positions that cannot be liquidated or hedged over that defined horizon.
The Company also uses IRC and CRM models to measure default and migration risk of credit spread and correlation products in the trading book. Among their benefits, these models permit estimation of a portfolio’s aggregate exposure to default and migration risk, incorporating a range of market risk factors in a period of financial stress. However, the IRC and CRM models have various limitations, which include, but are not limited to: use of historical default rates, credit spread movements, correlation and recovery rates, which may not be accurate predictors of future credit environments, and may not fully incorporate the risk of extreme credit events that are outsized relative to observed historical behavior or reflect the historical distribution of results beyond the 99.9% confidence interval.
Regulatory VaR, Regulatory stressed VaR, IRC and CRM numbers are not readily comparable across firms because of differences in the firms’ portfolios, modeling assumptions and methodologies. In IRC and CRM, those differences may be particularly pronounced because of the long risk horizon measured by these models as well as the difficulty in performing backtesting. These differences can result in materially different numbers across firms for similar portfolios. As a result, the model-based numbers tend to be more useful when interpreted as indicators of trends in a firm's risk profile rather than as an absolute measure of risk to be compared across firms.
9.3 Model Validation
The Company validates its Regulatory VaR model, Regulatory stressed VaR model, IRC model and CRM model on an ongoing basis. The Company’s model validation process is independent of the internal models’ development, implementation and operation. The validation process includes, among other things, an evaluation of the conceptual soundness of the internal models.
The Company’s Regulatory VaR model, Regulatory stressed VaR model, IRC model and CRM model have all been approved for use by the Company’s regulators.
9.4 Regulatory VaR Backtesting
One method of evaluating the reasonableness of the Company’s VaR model as a measure of the Company’s potential volatility of net revenue is to compare the VaR with the hypothetical buy-and-hold trading revenue. Assuming no intra-day trading, for a 99%/one-day VaR, the expected number of times that trading losses should exceed VaR during the year is two to three times, and, in general, if trading losses were to exceed VaR more than ten times in a year, the adequacy of the VaR model would be questioned. For days where losses exceed the VaR statistic, the Company examines the drivers of trading losses to evaluate the VaR model’s accuracy relative to realized trading results.
The Company regularly conducts a comparison of its VaR-based estimates with buy-and-hold gains or losses experienced (“backtesting”). The buy-and-hold gains or losses are defined in the U.S. Basel III as profits or losses on covered positions, as defined in Section 9.5 below, excluding fees, commissions, reserves, net interest income and intraday trading. The buy-and-hold gains or losses utilized for Regulatory VaR backtesting differs from the daily net trading revenue as disclosed in “Quantitative and Qualitative Disclosures about Market Risk—Risk Management—Market Risk” in Part II, Item 7A of the 2014 Form 10-K. The Company had no Regulatory VaR backtesting exceptions during the quarter ended December 31, 2014.
MORGAN STANLEY
Basel III Pillar 3 Disclosures Report
For the Quarterly Period Ended December 31, 2014
25
9.5 Covered Positions
During the quarter ended December 31, 2014, the Company had exposures to a wide range of interest rates, credit spread, equity prices, foreign exchange rates and commodity prices—and the associated implied volatilities and spreads—related to the global markets in which it conducts its trading activities. For more information about such exposures, see “Quantitative and Qualitative Disclosures about Market Risk—Risk Management—Market Risk—Sales and Trading and Related Activities” in Part II, Item 7A of the 2014 Form 10-K.
Under U.S. Basel III, covered positions include trading assets or liabilities held by the Company for the purpose of short-term resale or with the intent of benefiting from actual or expected price movements related to its market-making activities, as well as, foreign exchange and commodity exposure of certain banking book assets. CVA is not a covered position under U.S. Basel III and as a result, hedges to the non-covered CVA are themselves not eligible to be covered positions.
The Company manages its covered positions by employing a variety of risk mitigation strategies. These strategies include diversification of risk exposures and hedging. Hedging activities consist of the purchase or sale of positions in related securities and financial instruments, including a variety of derivative products (e.g., futures, forwards, swaps and options). Hedging activities may not always provide effective mitigation against trading losses due to differences in the terms, specific characteristics or other basis risks that may exist between the hedge instrument and the risk exposure that is being hedged. The Company manages the market risk associated with its trading activities on a Company-wide basis, on a world-wide trading division level and on an individual product basis. The Company manages and monitors its market risk exposures in such a way as to maintain a portfolio that the Company believes is well-diversified in the aggregate with respect to market risk factors and that reflects the Company’s aggregate risk tolerance as established by the Company’s senior management.
Valuation Policies, Procedures, and Methodologies for Covered Positions
For more information on the Company’s valuation policies, procedures, and methodologies for covered positions (trading assets and trading liabilities), see Note 2 (Significant Accounting Policies) and Note 4 (Fair Value Disclosures) to the consolidated financial statements in Part II, Item 8 of the 2014 Form 10-K.
9.6 Stress Testing of Covered Positions
The Company stress tests the market risk of its covered positions at a frequency appropriate to each portfolio and in no case less frequently than quarterly. The stress tests take into account concentration risk, illiquidity under stressed market conditions and other risks arising from the Company’s trading activities.
In addition, the Company utilizes a proprietary economic stress testing methodology that comprehensively measures the Company’s market and credit risk. The methodology simulates many stress scenarios based on more than 25 years of historical data and attempts to capture the different liquidities of various types of general and specific risks. Event and default risks for relevant credit portfolios are also captured.
Furthermore, as part of the Federal Reserve’s annual Comprehensive Capital Analysis and Review, commonly referred to as “CCAR,” the Company is required to perform annual capital stress testing under scenarios prescribed by the Federal Reserve. The stress testing results are submitted to the Federal Reserve and a summary of the results under the severely adverse economic scenario is publicly disclosed. For more information on the Company’s stress testing, see “MD&A—Liquidity and Capital Resources—Regulatory Requirements” in Part II, Item 7 of the 2014 Form 10-K.
MORGAN STANLEY
Basel III Pillar 3 Disclosures Report
For the Quarterly Period Ended December 31, 2014
26
10 Operational Risk
Operational risk refers to the risk of loss resulting from inadequate or failed processes, people, and systems or from external events (e.g., fraud; theft, legal, regulatory and compliance risks; or damage to physical assets). The Company may incur operational risk across the full scope of its business activities, including revenue-generating activities (e.g., sales and trading) and support and control groups (e.g., information technology and trade processing). For a further discussion of the Company’s operational risk, see “Quantitative and Qualitative Disclosures about Market Risk—Risk Management—Operational Risk” in Part II, Item 7A of the 2014 Form 10-K.
As an advanced approach banking organization, the Company is required to compute operational risk RWAs using an advanced measurement approach. The Company has established an operational risk framework to identify, measure, monitor and control risk across the Company. Effective operational risk management is essential to reducing the impact of operational risk incidents and mitigating legal, and regulatory risks. The framework is continually evolving to account for changes in the Company and to respond to the changing regulatory and business environment. The Company has implemented operational risk data and assessment systems to monitor and analyze internal and external operational risk events, to assess business environment and internal control factors and to perform scenario analysis. The collected data elements are incorporated in the Company’s operational risk capital model. The model encompasses both quantitative and qualitative elements. Internal loss data and scenario analysis results are direct inputs to the capital models, while external operational risk incidents and business environment internal control factors are evaluated as part of the scenario analysis process. In addition, given the evolving regulatory and litigation environment across the financial services industry and that operational risk RWAs incorporate the impact of such related matters, operational risk RWAs have increased and may continue to do so. The Company performs an ongoing review, update, oversight and validation of its advanced measurement approach framework.
The Company uses the Loss Distribution Approach to model operational risk exposures. In this approach, loss frequency and severity distributions are separately modeled and combined to produce an Aggregate Loss Distribution at various confidence levels over a one-year period. This modeling process is performed separately on each of the units of measure. The results are aggregated across all units of measure, taking into account diversification, to determine operational risk regulatory capital.
In addition, the Company employs a variety of risk processes and mitigants to manage its operational risk exposures. These include a strong governance framework, a comprehensive risk management program and insurance. The Company continually undertakes measures to improve infrastructure and mitigate operational risk. The goal of the Company’s operational risk management framework is to identify and assess significant operational risks and to ensure that appropriate mitigation actions are undertaken. Operational risks and associated risk exposures are assessed relative to the risk tolerance established by the Company’s Board of Directors and are prioritized accordingly. The breadth and range of operational risk are such that the types of mitigating activities are wide-ranging. Examples of activities include the use of legal agreements and contracts to transfer and/or limit operational risk exposures; due diligence; implementation of enhanced policies and procedures; exception management processing controls; and segregation of duties.
See “Capital Adequacy” in Section 4 herein for the Company’s operational risk RWAs at December 31, 2014.
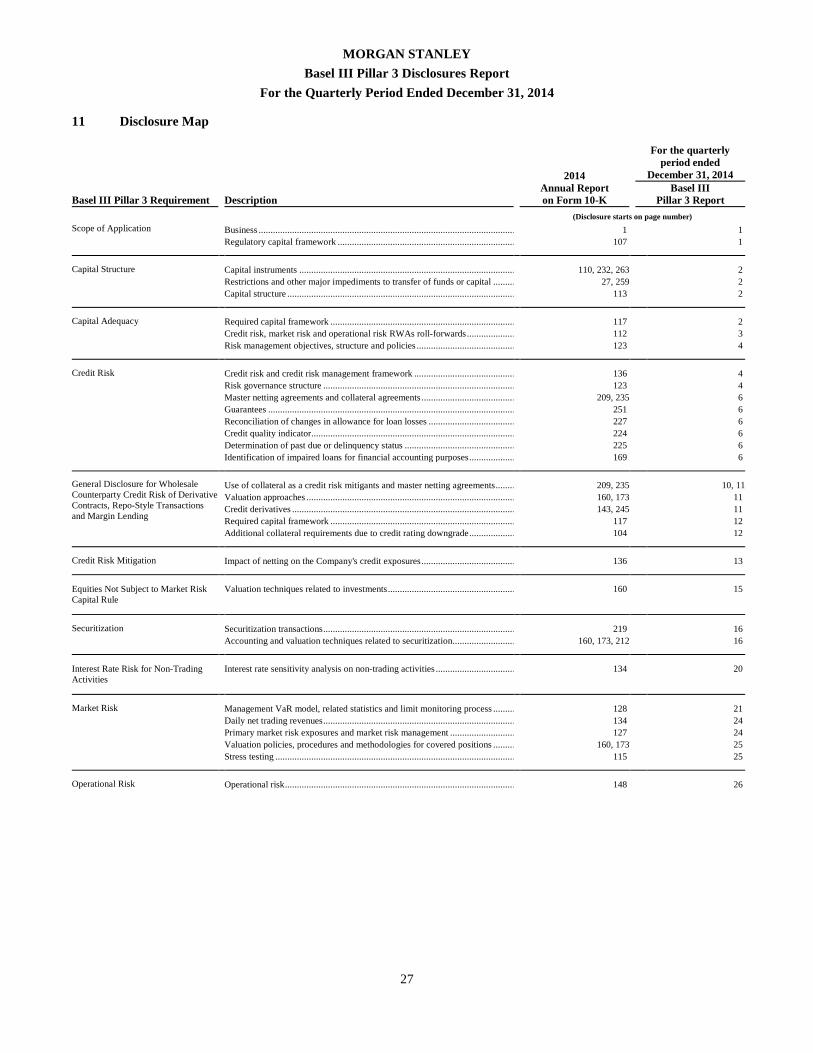
MORGAN STANLEY
Basel III Pillar 3 Disclosures Report
For the Quarterly Period Ended December 31, 2014
27
11 Disclosure Map
2014
Annual Report on Form 10-K
For the quarterly period ended
December 31, 2014
Basel III Pillar 3 Requirement Description
Basel III Pillar 3 Report
(Disclosure starts on page number)
Scope of Application Business ................................................................................................................................ 1 1 Regulatory capital framework ................................................................................................ 107 1 ................................................................................................................................ Capital Structure Capital instruments ................................................................................................ 110, 232, 263 2 Restrictions and other major impediments to transfer of funds or capital ................................ 27, 259 2 Capital structure ................................................................................................ 113 2 ................................................................................................................................ Capital Adequacy Required capital framework ................................................................................................ 117 2 Credit risk, market risk and operational risk RWAs roll-forwards ................................ 112 3 Risk management objectives, structure and policies ................................................................ 123 4 ................................................................................................................................ Credit Risk Credit risk and credit risk management framework ................................................................ 136 4 Risk governance structure ................................................................................................ 123 4 Master netting agreements and collateral agreements ................................................................ 209, 235 6 Guarantees ................................................................................................................................ 251 6 Reconciliation of changes in allowance for loan losses ................................................................ 227 6 Credit quality indicator................................................................................................ 224 6 Determination of past due or delinquency status ................................................................ 225 6 Identification of impaired loans for financial accounting purposes ................................ 169 6 ................................................................................................................................ General Disclosure for Wholesale Counterparty Credit Risk of Derivative Contracts, Repo-Style Transactions and Margin Lending
Use of collateral as a credit risk mitigants and master netting agreements ................................ 209, 235 10, 11 Valuation approaches ................................................................................................ 160, 173 11 Credit derivatives ................................................................................................ 143, 245 11 Required capital framework ................................................................................................ 117 12
Additional collateral requirements due to credit rating downgrade ................................ 104 12 ................................................................................................................................ Credit Risk Mitigation Impact of netting on the Company's credit exposures ................................................................ 136 13 ................................................................................................................................ Equities Not Subject to Market Risk Capital Rule
Valuation techniques related to investments ................................................................ 160 15
................................................................................................................................ Securitization Securitization transactions ................................................................................................ 219 16 Accounting and valuation techniques related to securitization................................ 160, 173, 212 16 ................................................................................................................................ Interest Rate Risk for Non-Trading Activities
Interest rate sensitivity analysis on non-trading activities ................................................................ 134 20
................................................................................................................................ Market Risk Management VaR model, related statistics and limit monitoring process ................................ 128 21 Daily net trading revenues ................................................................................................ 134 24 Primary market risk exposures and market risk management ................................ 127 24 Valuation policies, procedures and methodologies for covered positions ................................ 160, 173 25 Stress testing ................................................................................................................................ 115 25 ................................................................................................................................ Operational Risk Operational risk ................................................................................................ 148 26