4pe 9 16 13
2
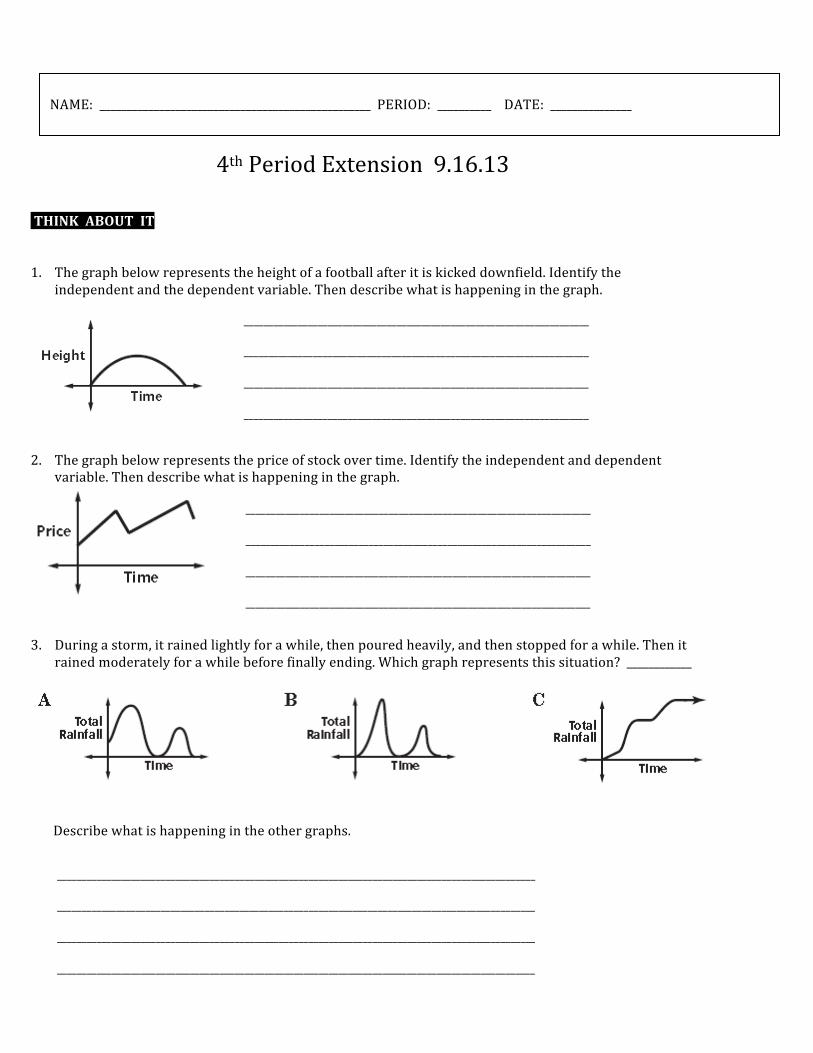
DEMONSTRATION OF LEARNING 4 th Period Extension 9.16.13 THINK ABOUT IT 1. The graph below represents the height of a football after it is kicked downfield. Identify the independent and the dependent variable. Then describe what is happening in the graph. 2. The graph below represents the price of stock over time. Identify the independent and dependent variable. Then describe what is happening in the graph. 3. During a storm, it rained lightly for a while, then poured heavily, and then stopped for a while. Then it rained moderately for a while before finally ending. Which graph represents this situation? ____________ Describe what is happening in the other graphs. NAME: __________________________________________________ PERIOD: __________ DATE: _______________ ______________________________________________________________________ ______________________________________________________________________ ______________________________________________________________________ ______________________________________________________________________ ______________________________________________________________________ ______________________________________________________________________ ______________________________________________________________________ ______________________________________________________________________ _________________________________________________________________________________________________ _________________________________________________________________________________________________ _________________________________________________________________________________________________ _________________________________________________________________________________________________
-
Upload
jerome-valdez -
Category
Documents
-
view
214 -
download
0
description
Â
Transcript of 4pe 9 16 13
DEMONSTRATION OF LEARNING
4th Period Extension 9.16.13 THINK ABOUT IT 1. The graph below represents the height of a football after it is kicked downfield. Identify the
independent and the dependent variable. Then describe what is happening in the graph.
2. The graph below represents the price of stock over time. Identify the independent and dependent
variable. Then describe what is happening in the graph.
3. During a storm, it rained lightly for a while, then poured heavily, and then stopped for a while. Then it
rained moderately for a while before finally ending. Which graph represents this situation? ____________
Describe what is happening in the other graphs.
NAME: __________________________________________________ PERIOD: __________ DATE: _______________
______________________________________________________________________ ______________________________________________________________________ ______________________________________________________________________ ______________________________________________________________________
______________________________________________________________________ ______________________________________________________________________ ______________________________________________________________________ ______________________________________________________________________
_________________________________________________________________________________________________ _________________________________________________________________________________________________ _________________________________________________________________________________________________ _________________________________________________________________________________________________