4.EMPLOYMENT & UNEMPLOYMENT - corkcity.ie · 4.EMPLOYMENT & UNEMPLOYMENT In 2002, 52% (53,274) of...
10
4.EMPLOYMENT & UNEMPLOYMENT
Transcript of 4.EMPLOYMENT & UNEMPLOYMENT - corkcity.ie · 4.EMPLOYMENT & UNEMPLOYMENT In 2002, 52% (53,274) of...

4 . E M P L O Y M E N T & U N E M P L O Y M E N T

4 . E M P L O Y M E N T & U N E M P L O Y M E N T
In 2002, 52% (53,274) of Cork’s population aged over fifteen were in the labour force.This is a marginal increase on the participation rate of 51% recorded by the census in1996. The settlement of younger elements of the population outside the boundaries ofthe city may in part explain the static growth of participation.
Reflecting national trends, female participation in the labour force increased between1996 and 2002 by 4% whilst in contrast, the proportion of men in the labour forcedecreased by 2.5%.
Table 4.0: Labour force structure, employment and unemployment of population aged 15+ in Cork, 1986-2002
4.1 Labour force participation
In 2002, 52.2% (53,274) of Cork city’s population aged over fifteen years were in thelabour force (Table 4.0). This is a slight increase on the participation rate of 51.2% in1996. The activity rate in the labour force is characterised by a number of trends. In particular:
The number of people in work has increased by 5,486 since 1996. Primary amongstthis change has been the growth of participation of women in the work force (Tables4.1 and 4.2).
Female participation increased by 4% between 1996 and 2002. There are now3,366 more women at work in Cork that there was in 1996, and a decline of 1,141in the number of women unemployed. In the same period there has been adecrease in 6,222 in the number of women who described themselves as occupiedwith home duties.
43

In contrast, the proportion of men in the labour market actually decreased by asmall proportion (-2.5%). However whilst the trend toward more female participation in the workforce is growing in line with national trends, male participation in the labour force in Cork is higher than female participation (62.7%for men, compared to 42.8% for women).
Table 4.1: Males aged 15+ classified by principal economic status in Cork, 1996- 2002
Table 4.2: Females aged 15+ classified by principal economic status in Cork, 1996- 2002
4.2 Socio-economic status
The composition of Cork city’s population in terms of socio-economic groups providesuseful insights into the contexts of social exclusion (Table 4.3). Of all groups, thelargest proportion of the population fall into the Non-Manual group (SEG D), constituting 17.8% (or 21,926) of the total population.
There has been a decline between 1996 and 2002 in the proportion of those defined as
CITY OF DIFFERENCE MAPPING SOCIAL INCLUSION IN CORK www.corkcity.ie/socialinclusion
44
EM
PL
OY
ME
NT
&U
NE
MP
LO
YM
WN
T
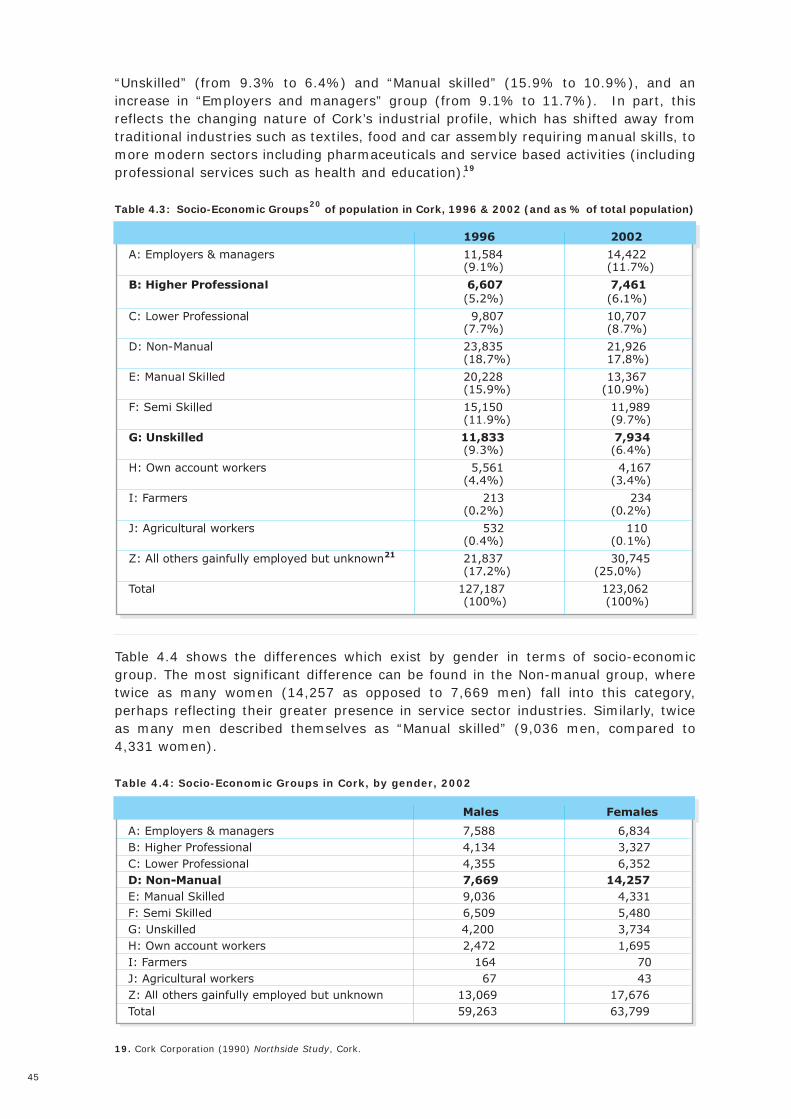
“Unskilled” (from 9.3% to 6.4%) and “Manual skilled” (15.9% to 10.9%), and anincrease in “Employers and managers” group (from 9.1% to 11.7%). In part, this reflects the changing nature of Cork’s industrial profile, which has shifted away fromtraditional industries such as textiles, food and car assembly requiring manual skills, tomore modern sectors including pharmaceuticals and service based activities (includingprofessional services such as health and education).
Table 4.3: Socio-Economic Groups of population in Cork, 1996 & 2002 (and as % of total population)
Table 4.4 shows the differences which exist by gender in terms of socio-economicgroup. The most significant difference can be found in the Non-manual group, wheretwice as many women (14,257 as opposed to 7,669 men) fall into this category, perhaps reflecting their greater presence in service sector industries. Similarly, twiceas many men described themselves as “Manual skilled” (9,036 men, compared to4,331 women).
Table 4.4: Socio-Economic Groups in Cork, by gender, 2002
45
19
20
19. Cork Corporation (1990) Northside Study, Cork.

Map 14: Percentage of Higher Professionals in Cork, 2002
Map 15: Percentage of Unskilled in Cork, 2002
CITY OF DIFFERENCE MAPPING SOCIAL INCLUSION IN CORK www.corkcity.ie/socialinclusion
46
EM
PL
OY
ME
NT
&U
NE
MP
LO
YM
WN
T
20. The socio-economic-group (SEG) of all persons aged 15 and over who are at work is determined by their occupation and additionally in some cases by their employment status. Unemployed or retired persons are classified according totheir former occupation. All other persons are classified according to the person on whom they are deemed to be dependent.
21. It should be noted that in SEG composition, a significant proportion of the population (25% in 2002) are described as ‘gainfully employed but unknown’ i.e. the census cannot be more specific about the SEG status of a quarter of thepopulation. This could effect the proportions of the other SEG categories.

There remain geographical inequalities in the pattern of socio-economic groups acrossthe city (Maps 14 and 15). In particular:
The majority of wards in the north of the city have the lowest proportions of peoplewho fall into the “Higher professionals” socio-economic group, where no more thanaround two percent of people are “Higher professionals” (Map 14).
In contrast, up to a fifth of the populations of certain wards within the south of thecity - Knockrea B, Browningstown, Bishopstown A and Sunday’s Well A are made ofup of “Higher Professionals”. This pattern is perhaps not surprising given that professional services -particularly health and education - are responsible for overhalf (56%) of employment in the south west of the city. In addition as the previous section showed, these areas have higher than average proportions of their populations with third level qualifications.
As with educational qualifications, there is a reversal of this distribution when it comesto those defined as “Unskilled” (Map 15). The highest proportions of this group can befound in the north west wards of Knocknaheeny, Churchfield, Fairhill B, GurranabraherE and D. Between 13% and 19% of the populations here fall into this socio-economic group. These areas have high rates of early school leaving, high proportions of local authority housing, and as the previous section noted, have traditionally been dependent on traditional manufacturing industries for employment.As the 1990 Northside Study suggested, the economic recession of the 1980s andsubsequent restructuring of Cork’s economy around industries requiring a different(and sometimes more specialized) skills base has contributed to a jobs-skills mismatch for many people in these areas. The legacy of these problems has not disappeared. Social conditions in many of the areas noted above are such that theyhave been less attractive to new enterprises and less likely to originate new businessstart-ups, despite the overall growth in the economy in the city over the last decade.
4.3 Unemployment
The census of 2002 recorded an overall unemployment rate for Cork of 12.4%. It ishigher for males (14.2%) than for females (10.1%). Reflecting national economicgrowth, the city has experienced a dramatic fall in unemployment rates between 1986and 2002, from 22.5% to 12.4%. However the distribution of employment in the cityremains uneven, and unemployment amongst certain groups, such as men and womenaged over forty five has increased.
Despite the overall decline in unemployment, Cork has eleven of the State’s eightyeight worst unemployment black-spots, which have average unemployment rates of25%. All of them are within the northern area of the city.
The census of 2002 recorded an overall unemployment rate for Cork of 12.4%. It ishigher for males (14.2%) than for females (10.1%). In terms of the age profile of thosecurrently unemployed (not including first time job seekers), the greatest proportion areaged between twenty five and thirty five (constituting 28% of all those unemployed).Unemployment amongst certain groups, such as men and women aged over forty five
47
22
23

has increased by a small proportion since 1996 (Table 4.5). However, reflecting national economic growth, the city has experienced a dramatic fall in unemploymentrates between 1986 and 2002, from 22.5% to 12.4%. The most significant decline happened after 1996, when unemployment fell by 8%. Consequently, unemploymentis at its lowest level for a generation.
Table 4.5: Unemployed Persons (excluding first time job seekers) aged 15+ years,by age group, Cork, 1996 and 2002.
Table 4.6: Age profile of the labour force in unemployment “blackspots”, Cork, 2002
Nevertheless, there are some local areas where many people are still out of work. Corkhas eleven of the State’s eighty eight worst unemployment “black-spots”, which have
CITY OF DIFFERENCE MAPPING SOCIAL INCLUSION IN CORK www.corkcity.ie/socialinclusion
48
EM
PL
OY
ME
NT
&U
NE
MP
LO
YM
WN
T
22. Cork City Development Board (2001), Cork City: Analysis of Present Economic, Social and Cultural Situation (draft); Cork City Council (2004), Cork City Development Plan 2004, Planning and Development Directorate.
23. ‘Blackspots’ are those DEDs or wards where the labour force exceeds 200 persons and its unemployment rate exceeds 20%.

average unemployment rates of almost 25%. These areas are mainly concentrated onthe northern side of the city and include Blackpool A (23.3%), Churchfield (23.1%),Farranferris B (20.1%) and C (20.3%), Gurranebraher A (20.6%), B (20.3%), and E(21.4%), Knocknaheeny (27.3%), Mayfield (23.6%), Shandon B (23.4%), The Glen A(31.4%) (Table 6, Appendix II). Unemployment is also higher than average in smallergeographical pockets on the Southside neighbourhoods of Togher and Mahon.
Since 1996, the decrease in unemployment across the city has also been differentiated.Whilst there has been a 15% decrease in unemployment in Fair Hill and 22% decreasein Knocknaheeny, the decline in unemployment in Mayfield was only 9%, and in the GlenA it was only 7%. There are also differences in the age profiles of those in the labourforce in these eleven black-spot areas (Table 4.6):
Some areas have a particularly young labour force; in Knocknaheeny, for example,the largest proportion of the labour force is aged between fifteen and twenty four.Similarly, over 50% of the labour forces of Knocknaheeny, The Glen A, Mayfield andChurchfield are aged between fifteen and thirty four; for Shandon B, this age groupaccounts for 70% of its labour force.
Other areas have a labour force with an older age profile, in particular GurranebraherA and B, where around a third of their workforce (31.3% and 36.7% respectively) isbetween forty five and sixty five years of age. This is in marked contrast to ShandonB, where only 15% of the workforce fall into this age group.
Maps 16 and 17 show the patterning of male unemployment across Cork in 1996 and2002. Reflecting total unemployment rates, male unemployment in Cork has declinedsharply between 1996 and 2002, from 23.5% to 14.2%. As the maps show, however,many of the northern wards have maintained above average proportions of male unemployment; the northern wards of Knocknaheeny, Churchfield, The Glen A, Mayfieldand Blackpool and more centrally, City Hall A represent particular concentrations. In thesouth, Mahon B and Togher also stand out as having above average rates for the city andcompared to the wards in the southern parts of the city (see also Table 7, Appendix II).
Map 16: Percentage of males aged 15+ unemployed in Cork, 1996
49
24

Map 17: Percentage of males aged 15+ unemployed in Cork, 2002
Unemployment plays a central role in pushing people towards poverty. The continuinghigh unemployment rates in many wards in the northern parts of the city bear witnessto the wider socio-economic problems and barriers to social inclusion that affects manyindividuals living in these areas, including as previous sections have highlighted, higher rates of dependency, and fewer educational qualifications and skills.
4.4 People economically inactive: unable to work due to sickness or disability
In the census of 2002, 6,564 people in Cork stated they were unable to work due topermanent sickness or disability, an increase of 2,234 since 1996. The highest proportions of those unable to work due to disability are found in the north westernparts of the city.
Some 6,564 people in Cork state they are unable to work due to permanent sicknessor disability, representing 13.5% of all those not in the labour force in the city and 6%of the total population aged fifteen and over. The proportion of those not in the labourforce citing that they are unable to work due to disability has increased by five percentsince 1996.
It is clear that certain areas of the city have higher proportions of people who are economically inactive due to disability (Table 8, Appendix II). These are focused aroundthe northern wards, particularly those to the north west. In some wards, over a fifth
CITY OF DIFFERENCE MAPPING SOCIAL INCLUSION IN CORK www.corkcity.ie/socialinclusion
50
EM
PL
OY
ME
NT
&U
NE
MP
LO
YM
WN
T
24. For the purposes of the maps, unemployment was calculated as those ‘Unemployed having lost or given up previous job’ as aproportion of the total male population aged 15+ and does not include first time job seekers.
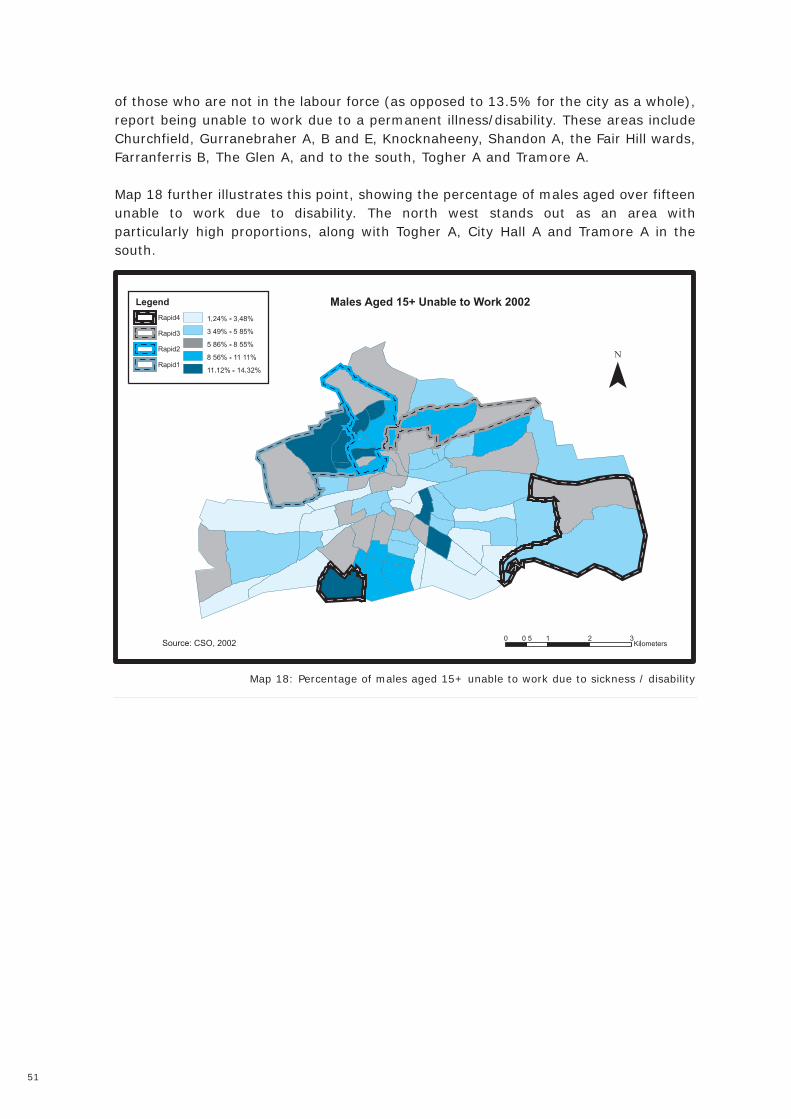
of those who are not in the labour force (as opposed to 13.5% for the city as a whole),report being unable to work due to a permanent illness/disability. These areas includeChurchfield, Gurranebraher A, B and E, Knocknaheeny, Shandon A, the Fair Hill wards,Farranferris B, The Glen A, and to the south, Togher A and Tramore A.
Map 18 further illustrates this point, showing the percentage of males aged over fifteenunable to work due to disability. The north west stands out as an area with particularly high proportions, along with Togher A, City Hall A and Tramore A in thesouth.
Map 18: Percentage of males aged 15+ unable to work due to sickness / disability
51