49 Information sheet bitre - Bureau of Infrastructure ... · PDF fileInformation sheet 49...
28
Information sheet 49 bitre BITRE Road Construction and Maintenance Price Index and Sub-Indexes—2013 update At a glance • This information sheet presents the 2013 re-calibrated BITRE Road Construction and Maintenance Price Index (RCMPI).The revised index is an indicator of the change in input costs faced by the road construction and maintenance industry in Australia. • The RCMPI monitors price changes in the following eight major inputs: (1) site-based labour; (2) office-based labour; (3) bituminous materials; (4) cement and concrete; (5) quarry products; (6) other materials; (7) plant hire/ depreciation; and (8) fuel. • The re-calibrated RCMPI is now presented on a quarterly basis. In addition, the RCMPI is now calculated on an index reference period of 2011–12 = 100.0. Prior to the 2013 re-calibration, the RCMPI was referenced on 1998-99 = 100.0.This change simplifies comparison of price movements between the RCMPI and the Australian Bureau of Statistics’ producer price indexes. • The input per cent shares for road construction and maintenance were re-estimated using survey data collected from 8 state/ territory road authorities, 233 local governments and 36 private sector contractors. • The input per cent shares have changed over the 16 years since the last review: º Labour costs have increased to 33.9 per cent of total costs in 2013, from 25.8 per cent of total costs in 1997; º Materials costs have decreased to 37.1 per cent in 2013, from 47.7 per cent in 1997; and º Equipment costs have increased to 29.0 per cent in 2013, from 26.5 in 1997. • The role of the private sector in road construction and maintenance projects within Australia has increased to 56.4 per cent, compared to 40.4 per cent in 1997. • On the basis of the re-calibrated RCMPI, the cost of road construction and maintenance have increased by 1.42 percentage points between 2011–12 and 2012–13.The most significant contributors to the index increase were rises in ‘site-based labour’ and ‘bituminous materials’ costs.They were counterbalanced, to a limited extent, by falls in ‘plant hire/ depreciation’, ‘other materials’ and ‘fuel’ costs over the same period. • This Information sheet introduces two new sub-indexes by major activity: construction and maintenance, and three new sub-indexes by road type: arterial, sealed local and unsealed local roads. • Figure S1 shows that between 2011–12 and 2012–13, the costs for road works changed at different rates depending on the type of works activity and type of road.
Transcript of 49 Information sheet bitre - Bureau of Infrastructure ... · PDF fileInformation sheet 49...

Info
rmat
ion
shee
t49
bitreBITRE Road Construction and Maintenance Price Index and Sub-Indexes—2013 update
At a glance• Thisinformationsheetpresentsthe2013re-calibratedBITRERoadConstructionandMaintenancePriceIndex
(RCMPI).TherevisedindexisanindicatorofthechangeininputcostsfacedbytheroadconstructionandmaintenanceindustryinAustralia.
• TheRCMPImonitorspricechangesinthefollowingeightmajorinputs: (1)site-basedlabour;(2)office-basedlabour;(3)bituminousmaterials;(4)cementandconcrete; (5)quarryproducts;(6)othermaterials;(7)planthire/depreciation;and(8)fuel.
• There-calibratedRCMPIisnowpresentedonaquarterlybasis.Inaddition,theRCMPIisnowcalculatedonanindexreferenceperiodof2011–12=100.0.Priortothe2013re-calibration,theRCMPIwasreferencedon1998-99=100.0.ThischangesimplifiescomparisonofpricemovementsbetweentheRCMPIandtheAustralianBureauofStatistics’producerpriceindexes.
• Theinputpercentsharesforroadconstructionandmaintenancewerere-estimatedusingsurveydatacollectedfrom8state/territoryroadauthorities,233localgovernmentsand36privatesectorcontractors.
• Theinputpercentshareshavechangedoverthe16yearssincethelastreview:º Labourcostshaveincreasedto33.9percentoftotalcostsin2013,from25.8percentoftotalcostsin1997;º Materialscostshavedecreasedto37.1percentin2013,from47.7percentin1997;andº Equipmentcostshaveincreasedto29.0percentin2013,from26.5in1997.
• TheroleoftheprivatesectorinroadconstructionandmaintenanceprojectswithinAustraliahasincreasedto56.4percent,comparedto40.4percentin1997.
• Onthebasisofthere-calibratedRCMPI,thecostofroadconstructionandmaintenancehaveincreasedby1.42percentagepointsbetween2011–12and2012–13.Themostsignificantcontributorstotheindexincreasewererisesin‘site-basedlabour’and‘bituminousmaterials’costs.Theywerecounterbalanced,toalimitedextent,byfallsin‘planthire/depreciation’,‘othermaterials’and‘fuel’costsoverthesameperiod.
• ThisInformationsheetintroducestwonewsub-indexesbymajoractivity:constructionandmaintenance,andthreenewsub-indexesbyroadtype:arterial,sealedlocalandunsealedlocalroads.
• FigureS1showsthatbetween2011–12and2012–13,thecostsforroadworkschangedatdifferentratesdependingonthetypeofworksactivityandtypeofroad.

Info
rmat
ion
shee
t4
9
2
Figure S1 The changes in RCMPI and the sub-indexes from 2011–12 to 2012–13
0.0
0.2
0.4
0.6
0.8
1.0
1.2
1.4
1.6
1.8
Arterial SealedUnsealed
Local
MaintenanceConstructionRCMPI
Inde
x po
ints
Construction and maintenance
1.42
1.32
1.55
0.97
1.46
1.62
Incertainsituationsitmaybemoreappropriatetousethenewsub-indexesinsteadoftheRCMPI.
Between2011–12and2012–13,themaintenancesub-indexincreasedatagreaterratethantheconstructionsub-index,asthecostof‘site-basedlabour’and‘bituminousmaterials’rosefasterthanotherinputsoverthesameperiodandtheinputpercentsharesofthesecomponentsarehigherwithinthemaintenancesub-index.
1 IntroductionTheBITREroadconstructionandmaintenancepriceindex(RCMPI)isaninput-priceindexwhichhasanumberofapplications.Itisusedasadeflatortoconvertnominal(currentprices)roadexpenditureintoreal(constantprice)values.Italsoprovidesameansforcalculatingrealchangesinroadexpendituresandgovernmentroadfundinglevels(e.g.BITRE2008,2009).
Inaddition,itisusedtomeasuretherateofchangeinthepricesofgoodsandservices,whicharepurchasedbysuppliersofroadconstructionandmaintenanceservices.Itisintendedtoreflecttrendsinpricesofmajorinputcomponentsofroadconstructionandmaintenance.
Morerecently,theRCMPIservedasoneoftheinputsintheNationalTransportCommission’sdeterminationofroadchargesforheavyfreightvehicles(NTC2012).
Thecontributionofeachinputtotheoverallcostofroadconstructionandmaintenanceworkisdeterminedbytwofactors:theunitpriceoftheinputandtheinput’spercentshareinthetotalcostofroadworks.
TheRCMPIisupdatedeachquartertoreflectshiftsinthepriceofinputs.TheupdatesreliedonquarterlydatacompiledbytheAustralianBureauofStatistics(ABS)oninputpricechangesandtheAustralianInstituteofPetroleumonpricesofdieselfuel.
However,thequarterlyupdatesdonotaccountforchangesintherelativequantitiesofinputsused.Overtimechanges to industrypractice, inputprices and technological advanceswill inevitably alter the inputmix, andhencetherelativitiesinthequantitiesusedforbothmaterialandnon-materialinputs.Thechangesresultintheindex gradually deviating from the actual prices for roadworks experienced by government and industry.Theinputpercentshareschangeataslowpaceanddonotrequirefrequentre-calibration.
Overthelast30yearstheroadconstructionandmaintenanceindustryhaschangedinanumberofways,including:increaseduseofcontractorsforbothroadconstructionandmaintenance;improvedtechnologyinroadbuilding;andgreateruseofcapitalequipmentasasubstituteforlabour,whichhasgenerallybecomemoreexpensiveinresponsetogreatercompetitionfromtheminingsector.Theseindustrychangesarethemotivationsbehindthe2013RCMPIre-calibration.

Info
rmat
ion
shee
t4
9
3
AlongwithBITREthereweretwoothercontributorstoliteratureonroadindexesinAustralia.Inthepaststateroadagencieshaveproducedroadconstructionandmaintenancepriceindexes(BTCE1997).However,noneofthemhavepubliclyreleasedtheirroadpriceindexesinrecenttimes.ABSistheothercontributortoliteratureonroadindexes(seeBox1).
Box 1 Comparing the BITRE RCMPI with the ABS Road and bridge construction output price indexFrom2002,theABShaspublishedanoutputproducerpriceindexforthegeneralconstructionindustryintheAustralianandNewZealandStandardIndustrialClassification1993(ANZSIC93subdivision41).Thisindexincludesacomponentfor‘Roadandbridgeconstruction’(ANZSIC93subdivision4121).Since2005thisindexhasbeenpublishedatboththenationalandstate/territorylevels.TheABSindexandtheBITREindexareconceptuallydifferentbecausethe‘Roadandbridge’indexisanoutputpriceindexwhereastheRCMPIisaninputpriceindex.TheABS‘Roadandbridge’indextakesintoaccountthesellingpricesandincludeschangesinprofitmarginsreceivedbysuppliersofroadconstructionproducts.DespitethedifferencesinscopebetweentheABSandRCMPIindexes,thetwoindexesdonotdivergesignificantlywhencompared.Thedifferencesbetweenthetwoindexesareasfollows:
BITRE RCMPI ABS Road and bridge index
Typeofindex Itisaninputpriceindexthatmeasureschangesinthepricesofinputs.
Itisanoutputpriceindexmeasuringchangesintheprices(revenues)receivedbybusinessesundertakingroadandbridgeconstructionlessanydirecttaxpaid.
Questionbeingaskedandanswered
WhatistherateofchangeinthepricesoftheinputsusedinroadconstructionandmaintenanceinAustralia?
Whatistherateofchangeinthepricesofoutputsofroadandbridgeconstructionsoldintheperiodinquestion?
Basisoftheindex Therearetwokeypillars:(a)Inputpercentsharescollectedfromsurveysoflocalgovernments,state/territoryroadauthoritiesandprivatesectorcontractors.Thesesharesareupdatedirregularly.(b)ABSproducerpriceindexesfortheinputsrecognisedintheindex.Theseareupdatedquarterly.
ThevalueweightsarederivedfromdataonaselectionofrepresentativemainroadandhighwayprojectsinNewSouthWales,Victoria,Queensland,SouthAustraliaandWesternAustralia.Pricesfortheoutputsarecollectedquarterly,andtheyarecollectedasworkinplace.Thisisanall-inclusivepriceforaserviceorproduct.
Scope Itcoversbothnewroadconstructionandroadmaintenance.Itexcludescostoflandacquisition
Itcoversonlynewroadconstruction.Theoutputpriceexcludescostoflandacquisition
TherestoftheInformationsheetisstructuredasfollows:
• Section2providesabriefhistoryoftheRCMPI.• Section3discussesthemethodologyusedinre-calibratingtheRCMPI.• Section4discussesthemethodologyusedincalibratingthefivenewsub-indexes.Twoofthesub-indexesare
classifiedbytypeofmajoractivity:constructionandmaintenance,andthreeareclassifiedbyroadtype:arterial,sealedlocalroadsandunsealedlocalroads.
• Section5presentstheresultsandsummarisesthefindingsfromthisstudy.• Section6recapstheoutcomesofthisInformationsheet.
Road grader. ImagecourstesyofCaterpillarInc.

Info
rmat
ion
shee
t4
9
4
2 History of the RCMPIOneoftheearliestCommonwealthcontributionsinthisareawasbytheCommonwealthBureauofRoads(CBR).AftertheamalgamationoftheCBRandtheBureauofTransportEconomics(BTE)in1976,theBTEanditssuccessorscontinuedtopublishroadconstructionpriceindexes(BTE(1978),BTCE(1997),BITRE(2012,2011a)).
BITRE’sroadconstructionandmaintenanceindexhasevolvedovermanyyears.Keydatesinthisevolutionare:1981,1997and2013.
1981In1981, theBureauofTransportEconomics (BTE) introducedanew input-price index (withnoadjustmentfor productivity) and it was based on inputs purchased by the industry (for example, labour, materialsand plant). Itwaswhen the RCMPIwas created and the basicmethodology has remained the same eversince. Up to 1997 the RCMPI included six components to represent the inputs used in constructing andmaintaining roads.The six inputswere: (1) salaried labour (2)other labour (3)bitumen (4)othermaterials(5)plantacquisitionordepreciationand(6)fuel.Theinputpercentsharesforthesixfactorswerethesamefrom1981to1997.Surveydatatoestimateinputpercentshareswerecollectedfromstate/territoryroadauthoritiesandlocalgovernments,butnotcontractors.
1997In1997,afterconsultationwithanumberofstate/territoryroadauthoritiesandlocalgovernments,andtakinginto consideration data availability, two additional input components were added to the previous index:(7)concrete;and(8)quarryproducts.Theiradditionprovidedabetterrepresentationofmaterialsusedinroadconstructionandmaintenance.Togethertheycontributedabout52percentofthetotalmaterialscomponent.Furthermore,in1997itwasacknowledgedthattheproportionofroadconstructionandmaintenanceworksthatlocalgovernmentsandstate/territoryroadauthoritieswerecontractingouttoprivatesectorcontractorswasincreasing.Thereforeprivatesectorcontractorswereexplicitlyincludedinthesurveyoftheindustrytoestablishtheinputpercentsharesapplicableintheroadconstructionandmaintenancesector.
2013The2013re-calibrationoftheRCMPIintroducedchangesthataffectedthreeinputs.Upuntil2013,twoseparatelabourinputswereusedintheRCMPI:‘salariedlabour’and‘otherlabour’.Thewagecostsforthetwoinputsweremonitoredusingaverageweeklyearningsformalesinallindustries,Australia-wide.
Inanefforttoaccuratelylabelthelabourinputs,theywererenamedas‘site-basedlabour’(previously‘otherlabour’)and‘office-basedlabour’(previously‘salariedlabour’)in2013.
Moreover,inordertomonitorchangesinthecostof‘site-basedlabour’,theABSseriesonhourlyratesofpayintheconstructionsectorwereintroduced.TheABSproducerpriceindexesforengineeringdesignandengineeringconsultingwerealsointroducedtomonitorchangesinthecostof‘office-basedlabour’.Thenewindexesprovidedabetterrepresentationoflabourcostsinvolvedinroadconstructionandmaintenance.
‘Othermaterials’capturedthecostofresidualinputs,thetypeofinputsusedinroadconstructionandmaintenancewhichwerenotexplicitlynamedintheRCMPI.Upuntil2013,theABSproducerpriceindexfor‘allgroups’inputstothehouseconstructionindustrywasusedtomonitorchangesinthecostof‘othermaterials’.
Inthe2013re-calibration,theABSproducerpriceindexforreinforcingsteelwasintroducedtomonitorchangesininputcostsof‘othermaterials’toreplacetheABS‘allgroups’houseconstructioninputindex.ThereasonbeingreinforcingsteelwasoneofthemostimportantinputsnotexplicitlylistedintheRCMPI.Theyareusedforreinforcingconcretepavementsandroadfurniture.

Info
rmat
ion
shee
t4
9
5
3 Methodology: An overview of the RCMPI re-calibrationThestepsinvolvedinre-calibratingtheRCMPIareillustratedinFigure1.
Figure 1 A schematic overview of the RCMPI re-calibration
Step 1 REVIEWTHEINPUTSUSEDINRCMPI
Step 2 SURVEYSThenumberofrespondentswere:8State/territoryroadauthorities233outof558Localgovernments36Privatesectorcontractors
Step 3 TOTALROADEXPENDITUREINAUSTRALIAWhoundertookwhattypeofroadworks?Howmuchwasdonein-house?Howmuchwasoutsourced?
Step 4 WHATINPUTMIXESWEREUSED?
Step 5a
SURVEYRESULTS:STATE/TERRITORYCONSTRUCTION/MAINTENANCEArterialroadsSealedlocalroadsUnsealedlocalroads
Step 5b
SURVEYRESULTS:LOCALGOVERNMENTSCONSTRUCTION/MAINTENANCEArterialroadsSealedlocalroadsUnsealedlocalroads
Step 5c
SURVEYRESULTS:PRIVATESECTORCONSTRUCTION/MAINTENANCEArterialroadsSealedlocalroadsUnsealedlocalroads
Step 6 CONSOLIDATEINPUTMIXTABLESBYROADTYPENational:SealedlocalroadsNational:UnsealedlocalroadsNational:Arterialroads
Step 7 CONSOLIDATEINPUTMIXTABLESBYACTIVITYTYPEConstruction:AllroadsMaintenance:Allroads
Step 8 CREATEANATIONALINPUTMIXTABLECOMBININGFIVETABLES(fromstep6andstep7)
Step 9a
COMPUTEAre-calibratedRCMPI
Step 9b
COMPUTESub-indexesbyactivitytypeConstruction:AllroadsMaintenance:Allroads
Step 9c
COMPUTESub-indexesbyroadtypeArterialroadsSealedlocalroadsUnsealedlocalroads

Info
rmat
ion
shee
t4
9
6
3.1 Review of the RCMPIAspartoftheRCMPIre-calibration,BITREreviewedthecomponentinputsoftheindexusedinthe16yearsto2013.BITREalsoexaminedtheextenttowhichtheinputswerealignedwiththecorrespondingproducerpriceindexes.Table1summarisestheresultsofthereviewandshowsthatthere-alignmentbetweeninputsandthevariablesusedtomeasurepricechangeisunchangedforfiveoftheeightvariablesinthere-calibratedBITRERCMPI,whichmeanstheyremainthesameasinthepre-2013BITRERCMPI.
Table 1 Description of inputs in the RCMPI and measures of change in the price of inputs
Aspect Input Input description Measures of price change used in 2013 re-calibration of the RCMPI
Measures of price change used in BTCE (1997)
1 Site-basedlabour
Site-basedlabourreferstomainlymanualoccupationssuchaslabourers,technicians,drivers,equipmentoperators,andtradespersons.Peopleintheseoccupationsareoftenpaidanhourlyrate.
Description:ABSquarterlyindexfortotalhourlyratesofpay(excludingbonuses)earnedbyallworkersintheprivateandpublicconstructionsectorsfromABScatalogue6345.0WagePriceIndex,Australia,IDA2603589K.
Previouslydescribedas‘otherlabour’butitformsalargershareoftotalcost.Description:ABSestimatesofaverageweeklyearnings(excludingbonuses)inallindustriesAustralia-wideformales;employedasfulltimeonadultpayratesfromABScatalogue6302.0,AverageWeeklyEarnings,seriesIDA2734021V.
2 Office-basedlabour
Office-basedlabourreferstomainlynon-manualoccupationssuchasadministrators,projectmanagers,engineers,lawyers,andaccountants.Peopleintheseoccupationsaretypicallypaidafixedannualsalary.
Description:ABSquarterlyindexforengineeringdesignandengineeringconsultingservicesfromABScatalogue6427.0,Producerpriceindexes,seriesIDA2314202T.
Previouslydescribedas‘Salariedlabour’andseriesIDA2734021Vwasusedtomonitorpricechangefortheinput.
3 Bituminousmaterials
Costofasphalticconcrete(includingbitumen,mineralaggregate,sand,rockdust,andotheradditives).
Thisinputisunchangedbecauseitisaccuratelydescribingthechangesofinputprices
Description:WeightedAverageof6CapitalCities;AsphaltplacedfromABSProducerPriceIndexes(6427.0),seriesID2314822F.
4 Cementandconcrete
CostofPortlandorblendedcementconcrete(includingmineralaggregateandadditives,excludingsteelforreinforcement).
Unchanged:samereasonasinput3 Description:IndexNumber;Ready-mixedconcrete;WeightedAverageof6CapitalCitiesfromABSProducerPriceIndexes(6427.0),seriesIDA2389358J.
5 Quarryproducts
Thisreferstomaterialssuchasgravelandsandsexcludingmaterialsusedasacomponentofasphalticconcrete.
Unchanged:samereasonasinput3 Description:IndexNumber;Sand;WeightedAverageof6CapitalCitiesfromABSProducerPriceIndexes(6427.0),seriesIDA2389412K.
6 Othermaterials(reinforcingsteel)
Allotherinputs(themostimportantofwhichissteel)usedasreinforcingforconcretepavementsandforroadfurniture.
Description:IndexNumber;Reinforcingsteel;WeightedAverageof6CapitalCitiesfromABSProducerPriceIndexes(6427.0),seriesIDA2389361W.
Description:InputtotheHouseconstructionindustry;WeightedAverageof6CapitalCitiesfromABSProducerPriceIndexes(6427.0),A2390558X.
7 Hire/depreciation
Costsofhireorownershipofplantandequipment.
Unchanged:samereasonasinput3 Description:IndexNumbers;663OthergoodsandequipmentrentalandhiringfromABSProducerPriceIndexes(6427.0),seriesIDA2314181T.
8 Fuel Dieselfuelusedtorunequipment. Unchanged:samereasonasinput3 Description:AustralianInstituteofPetroleumWeeklyDieselPricesreport,“Retail:DieselPumpPrice(NationalAverage)”—AverageforthequarterfromtheAustrlainInstituteofPetroleumathttp://www.aip.com.au/pricing/
Note: Theshadedrowshighlighttheinputswhichusenewvariablestomonitorpricechangesinthere-calibratedRCMPI. Thedieselfuelpricesareretailpriceswhichincludesretailprofit,however,theyarethebestdataavailableforthisinput.Dieselfuelaccountsfor
approximately6%ofthetotalroadconstructionandmaintenancecosts.
3.1.1 Distinguishing between labour input typesOneoftheissuesidentifiedbythereviewwasthatinrecentversionsoftheRCMPI,thetwodifferentlabourinputs‘salariedlabour’and‘otherlabour’usedthesameindicatorofpricechange.ThesolutiontotheissuewastoassigntwonewABSindexestomonitorpricechangesin‘site-basedlabour’(previously‘otherlabour’)and‘office-basedlabour’(previously‘salariedlabour’).
Info
rmat
ion
shee
t4
9
7
Thetwotypesoflabourinputshavedifferenttrainingrequirements,skilllevelsandremuneration.‘Site-basedlabour’includestechnicians,drivers,equipmentoperators,andtradespersonsandmakesupthelargestproportionoftotallabourinputinroadprojects.‘Office-basedlabour’ismadeupofoccupationssuchasadministrators,projectmanagers,engineers,lawyers,andaccountants.Upuntil2013,thechangesinthecostofthetwotypesoflabourweremonitoredusingtheABSestimatesofaverageweeklyearnings(excludingbonuses).ItincludedallindustriesAustralia-wideformalesemployedasfulltimeonadultpayrates(usingdatafromABScatalogue6302.0,seriesIDA2734021V).
Inordertoaccuratelydescribethetwolabourinputs,there-calibratedindexnowmonitorsmovementsinthewagecostsof‘site-basedlabour’usingtheABSquarterlyindexfortotalhourlyratesofpay(excludingbonuses)earnedbyallworkers(maleandfemale)intheprivateandpublicconstructionsectors(usingdatafromABScatalogue6345.0,Wagepriceindex,Australia,seriesIDA2603589K).
‘Office-basedlabour’requiresdifferentskillsandtheyarepaidatadifferentrates,thereforethere-calibratedindexusesaquarterlyindexforengineeringdesignandengineeringconsultingservices(fromABScatalogue6427.0,Producerpriceindexes(PPI),seriesIDA2314202T)tomonitorchangesinthewagecostsof‘office-basedlabour’.
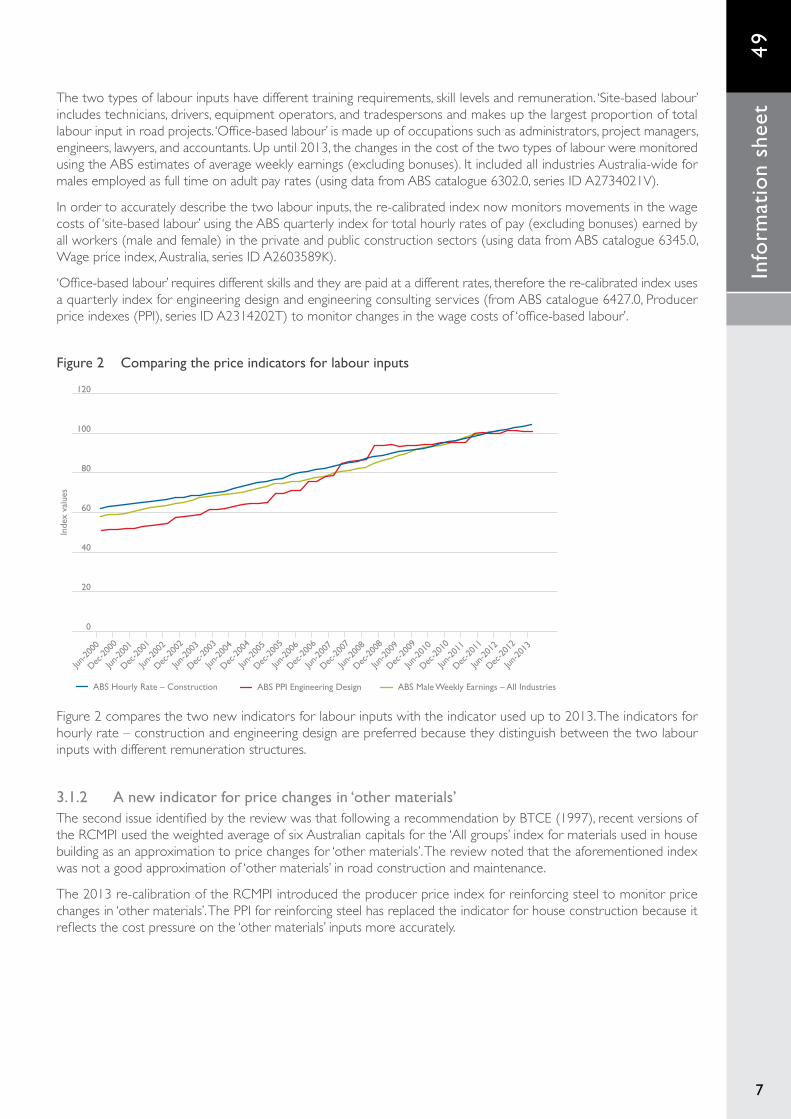
Figure 2 Comparing the price indicators for labour inputs
0
20
40
60
80
100
120
ABS Male Weekly Earnings – All IndustriesABS PPI Engineering DesignABS Hourly Rate – Construction
Jun-2
013
Dec-2
012
Jun-2
012
Dec-2
011
Jun-2
011
Dec-2
010
Jun-2
010
Dec-2
009
Jun-2
009
Dec-2
008
Jun-2
008
Dec-2
007
Jun-2
007
Dec-2
006
Jun-2
006
Dec-2
005
Jun-2
005
Dec-2
004
Jun-2
004
Dec-2
003
Jun-2
003
Dec-2
002
Jun-2
002
Dec-2
001
Jun-2
001
Dec-2
000
Jun-2
000
Inde
x va
lues
Figure2comparesthetwonewindicatorsforlabourinputswiththeindicatorusedupto2013.Theindicatorsforhourlyrate–constructionandengineeringdesignarepreferredbecausetheydistinguishbetweenthetwolabourinputswithdifferentremunerationstructures.
3.1.2 A new indicator for price changes in ‘other materials’ThesecondissueidentifiedbythereviewwasthatfollowingarecommendationbyBTCE(1997),recentversionsoftheRCMPIusedtheweightedaverageofsixAustraliancapitalsforthe‘Allgroups’indexformaterialsusedinhousebuildingasanapproximationtopricechangesfor‘othermaterials’.Thereviewnotedthattheaforementionedindexwasnotagoodapproximationof‘othermaterials’inroadconstructionandmaintenance.
The2013re-calibrationoftheRCMPIintroducedtheproducerpriceindexforreinforcingsteeltomonitorpricechangesin‘othermaterials’.ThePPIforreinforcingsteelhasreplacedtheindicatorforhouseconstructionbecauseitreflectsthecostpressureonthe‘othermaterials’inputsmoreaccurately.

Info
rmat
ion
shee
t4
9
8
Figure3comparesthenewindicatorfor‘othermaterials’withthepriceindicatorusedupto2013.
Figure 3 Comparing the price indicators for ‘other materials’
0
20
40
60
80
100
120
140
160
180
ABS All Groups PPI – House ConstructionABS PPI Reinforcing Steel
Inde
x va
lues
Jun-2
013
Dec-2
012
Jun-2
012
Dec-2
011
Jun-2
011
Dec-2
010
Jun-2
010
Dec-2
009
Jun-2
009
Dec-2
008
Jun-2
008
Dec-2
007
Jun-2
007
Dec-2
006
Jun-2
006
Dec-2
005
Jun-2
005
Dec-2
004
Jun-2
004
Dec-2
003
Jun-2
003
Dec-2
002
Jun-2
002
Dec-2
001
Jun-2
001
Dec-2
000
Jun-2
000
3.2 The surveysInstep2(Figure1)surveyswereusedtocollectinformationforre-calibratingtheRCMPI.ThequestionnairesusedwereverysimilartotheonesusedinBTCE(1997).Themajordifferencewasthattherespondentswereexplicitlyrequestedtoestimateinputpercentsharesbyactivitytype:constructionversusmaintenance,andbyroadtype:arterial,unsealedlocalroadsandsealedlocalroads.
State/ territory road authoritiesSurveyformsweresenttoall(8)state/territoryroadauthoritiesandthesurveyscollecteddataon:
• TheinputpercentsharesofinputsusedintheconstructionandmaintenanceoftheNationalHighwaysystem,statehighwaysandarterialroads;
• Thelengthofroadsundertheirjurisdictionbyroadtype:localroads(sealedandunsealed)andarterialroads(includingnationalhighways);
• Thetotalroadinfrastructureexpendituresub-dividedbyroadtype:arterialversuslocalroads;byactivitytype:constructionversusmaintenanceandbyroadtype:localroads(sealedandunsealed)andarterialroads(includingnationalhighways);and
• Theextentofroadworksoutsourcingtolocalgovernmentsandprivatesectorcontractors.
AppendixAprovidesasummaryoftheinputpercentsharesestimatesusedinprojectsimplemented(fundedandundertakenin-house)bystate/territoryroadauthorities.
Local governmentsSurveyformsweredistributedtoall(558)localgovernmentsinAustralia.
Localgovernmentsareresponsiblefortheconstructionandmaintenanceoflocalroads,somearterialroads,andtolesserextentstatehighways.Theirinvolvementindifferenttypesofroadvariesbetweenstatesandevenwithinstates.Themainpurposeofthesurveyoflocalgovernmentswastoobtain:
• Dataoninputpercentsharesthatapplyintheconstructionandmaintenanceoflocalroadsaswellasarterialroadsandstatehighways;
• Thelengthofroadsundertheirjurisdictionbyroadtype:localroads(sealedandunsealed)andarterialroads(includingnationalhighways);and
• Informationonthepercentageofconstructionandmaintenanceworkstheycontractedouttoprivatesectorfirms.AppendixAshowstheestimatesofinputpercentsharesforprojectsundertakenin-housebylocalgovernments.

Info
rmat
ion
shee
t4
9
9
Private contractorsBITREcommissionedArup,aprivatesectorconsultingfirm,tocollectdataviaasurveyabouttheinputpercentsharesusedintheprivatesector.BITREprovidedArupwithasamplesurveyquestionnaire.Inaddition,Arupcollectedfurthersupplementarydatafromrespondents,includingtotalvalueofconstructionandmaintenancecostofroadprojectsdeliveredin2011–12,andthenumberofkilometresacompanyconstructedormaintainedin2011–12perstateforeachroadtype-arterial,sealedlocalandunsealedlocal.
ThemajorityofthefirmscontactedarelistedinAustroads(2013).Semi-structuredinterviewswereundertakenwithestimators,businessdevelopmentmanagersandaccountantsofthesefirms.Table2showsthedistributionofrespondingfirmsbyannualaveragesizeofcompanyturnover.TheinputpercentsharesusedbytheprivatesectorcontractorsaresummarisedinAppendixA.
Table 2 Private sector firms responded to the surveys, sorted by turnover
Annual turnover ($ millions) Number of firms that responded Per cent of respondents
0to50 16 44.44
51to100 4 11.11
101to150 6 16.67
150plus 7 19.44
Unstated 3 8.33
Total 36 100
Note: Componentsmaynotnecessarilyadduptothetotalsduetorounding.Source: Arup(2013).
3.3 Road expenditure and the roles played in road works projectsAkeyelementinre-calibratingtheRCMPIwastodeterminetheinputmixesusedbytheagenciesthatconstructandmaintainroadsinAustralia.Step3(Figure1)identifiedtherolesamongthethreemajorsuppliersofroadworksservices.Therolesaredifferentfromthoserelatedtofundingofroadworks.Forexample,theprivatesector’scontributionrepresentsasmallpercentageofthetotalroadexpenditure,however,thesectorplaysamajorroleasasupplierofroadconstructionandroadmaintenanceservices.Incontrast,Table3showsthattheAustralian(commonwealth)governmentdoesnotprovideroadworksservices,despitebeingasignificantcontributortototalroadexpenditure(seeBITRE2013).
Dataonroadexpenditurebylevelsofgovernment:Commonwealth,state/territory,localandalsotheprivatesectorareinBITRE(2013).
Table3combinestheBITREsurveysdatacollected fromthethreemajorsuppliersof roadconstructionandmaintenanceservicesinAustralia:state/territorydepartmentsofmainroads;localgovernmentsandprivatesectorcontractors.
Table3showsthat in2013,about56percentoftotalroadconstructionandmaintenanceexpenditurewereexpendedonprojectsimplementedbytheprivatesector.Someofthesewereprojectsfortheprivatesector,butthemajorityoftheprojectswereoutsourcedtotheprivatesectorandfundedbyeitherstate/territorygovernmentsorlocalgovernments.

Info
rmat
ion
shee
t4
9
10
Table 3 The roles in the supply of road construction and road maintenance services: 1997 and 2013
Supplier of services Units 1997 2013 Change from1997 to 2013
State/territoryroadauthoritiesa
% 26.06 16.23 -9.83
Localgovernmentsb % 33.58 27.36 -6.22
Privatesectorc % 40.36 56.41 16.05
Total % 100.00 100.00 0.00
Totalroadexpenditured $Million 5725.60 19459.40 13733.80
Notes:a. Fundsonprojectsimplementedbystate/territoryroadauthorities=grossstate/territoryroadexpenditurefromABSdataonGovernment
FinanceStatisticsLESSexpenditureonprojectsoutsourcedtolocalgovernmentsandprivatesectorcontractors.b. Fundsonprojectsimplementedbylocalgovernments=grosslocalgovernmentroadexpenditurefromABSGovernmentFinanceStatistics
LESSexpenditureonprojectsoutsourcedtoprivatesectorcontractors.c. Fundsonprojects implementedbyprivatesectorcontractorsequalgrossprivatesectorroadexpenditurefromABSdataonGovernment
FinanceStatisticsPLUSprojectsoutsourcedtoprivatesectorcontractorsbylocalgovernmentsandstate/territoryroadauthorities.d. Thedataontotalroadexpenditurefor2013arefromBITRE(2013).Source: BasedonBITRE(2013)andBITREsurveysofstate/territorydepartmentsofmainroads,localgovernmentsandprivatesectorcontractors.
3.4 Estimating input per cent sharesAttheendofstep5(Figure1)theunitrecorddatasetincludesinformationfrom:
• Eachof3respondingstateroadauthoritiesoninputshares;• Eachof36respondingprivatesectorfirmsoninputshares;and• Eachof233respondinglocalgovernmentsoninputshares.
Eachrespondenttothesurveyprovidedatmostsixsetsofinputpercentsharesrelatedto:
• Theconstructionofarterialroads,sealedlocalroadsandunsealedlocalroads;and• Themaintenanceofarterialroads,sealedlocalroadsandunsealedlocalroads.
Steps6,7,and8(inFigure1)relatetotheaggregationoftheseinputsharesintothenationalinputpercentshares.ThesenationalinputpercentsharesaresummarisedinAppendixB.Theinputpercentsharesarescaledtosumtoone(or100percent),andthereforetheycanbeinterpretedaseachinput’sproportionwithinthetotalpriceofroadconstructionandmaintenance.Thisscalinghasnoeffectonthecalculation.Theshadedcolumns(withinTablesinAppendixB)aretheaggregatedinputpercentsharesusedinthecomputationsofthere-calibratedRCMPIandvarioussub-indexes.
3.5 Computing the re-calibrated RCMPIStep9a(Figure1)isthecomputationofthere-calibratedRCMPIusingthenationalinputpercentsharesinAppendixB.Eachinputisassociatedwithapriceindicator.Theindexvalueforapointintime(inthiscaseaquarter)iscalculatedasthesumoftheproductoftheinputs’priceindicatormultipliedbyitsinputpercentshare.
Anindexreferenceperiodischosenfortheindexandit istypicallyassignedanindexvalueof100.Theindexreferenceperiodforthere-calibratedRCMPIis2011–12which,foraquarterlyindex,meansthattheaverageoftheindexvaluesforthefourquartersinthefinancialyearis100.Theresultssectionpresentsthere-calibratedRCMPIingraphicalandtabularform.Furthermore,itprovidesacomparisonbetweenthere-calibratedRCMPIandtheRCMPIbasedon1997inputpercentshares.

Info
rmat
ion
shee
t4
9
11
4 Methodology: Computing the input per cent shares for the sub-indexes
AkeystrengthoftheRCMPIisthatitestimatestheinputpricechangesintheconstructionofan‘average’roadinAustralia.However,itisnotpossibleto‘unpack’theBITREindex,andrevealhowtheinputpricesdifferbyclass/categoryofroadorbytypeofactivity.Inresponse,thisinformationsheetprovidesestimatesofthesub-indexeswhichshowhowthecostofroadworkschangesbythreecategoriesofroadandtwotypesofroadworksactivity.
4.1 Sub-indexes by type of activityStep9b(Figure1)classifiedthemainactivitiesintotwocategories:constructionandmaintenance.Roadconstructionincludesconstructionofanewroad,bridge,ortunnelwherenonepreviouslyexisted;majorwideningorreplacement,e.g.replacementofatwo-laneroadwithafour-laneroad;upgradestointersections,e.g.changestointersectionlayoutorinstallationofnewtrafficsignals;large-scaleheavypatchingorpavementrehabilitation,andminorimprovementsinalignment;andreplacementofanunsealedroadwithasealedroad.
Roadmaintenance includes restoring edgewear, repairing potholes and small-scale pavement rehabilitation;re-sheetingofgravelroadsandresealingofbitumen-surfacedroads;line-marking;minorbridgeandtunnelrepairs;repairstoguardrailsortrafficsignsandsignals;cleaningofroaddrainsandculverts;androad-sidelandscaping.
Oneofthemainreasonsforcreatingasub-indexforroadconstruction,separatefromthatformaintenance,isbecausethetwoactivitiesdifferintermsofinputrequirements.TheinputpercentsharesforconstructionactivityandmaintenanceactivityaggregatedoverroadtypeareshowninAppendixB.
Figure4 shows that for the roadconstruction sub-index, the inputper cent share formaterials ishigherby3.7percentagepointsthaninthere-calibratedRCMPI.Thisiscounter-balancedbythevalueoftheinputpercentshareforlabour,whichintheconstructionindexislowerbyabout2.1percentagepointsthaninthere-calibratedRCMPI.
Ontheotherhand,theroadmaintenancesub-indexinFigure4showsthattheinputpercentshareforlabourishigherby2.3percentagepointsthaninthere-calibratedRCMPI.Thisiscounter-balancedbythevalueoftheinputpercentshareformaterials,whichinthemaintenanceindexislowerby3.2percentagepointsthaninthere-calibratedRCMPI.
Figure 4 Input per cent shares: RCMPI, Construction and Maintenance activity sub-indexes
0
5
10
15
20
25
30
35
40
45
EquipmentMaterials Labour
Inpu
t pe
r ce
nt s
hare
s (%
)
Index by activity: Maintenance
Index by activity: Construction
Re-calibrated RCMPI
33.9
37.1
29.0
31.8
40.8
27.4
36.233.9
29.9
Source: BITREestimatesbasedondatainTableB1,B2andB3inAppendixB.
Info
rmat
ion
shee
t4
9
12
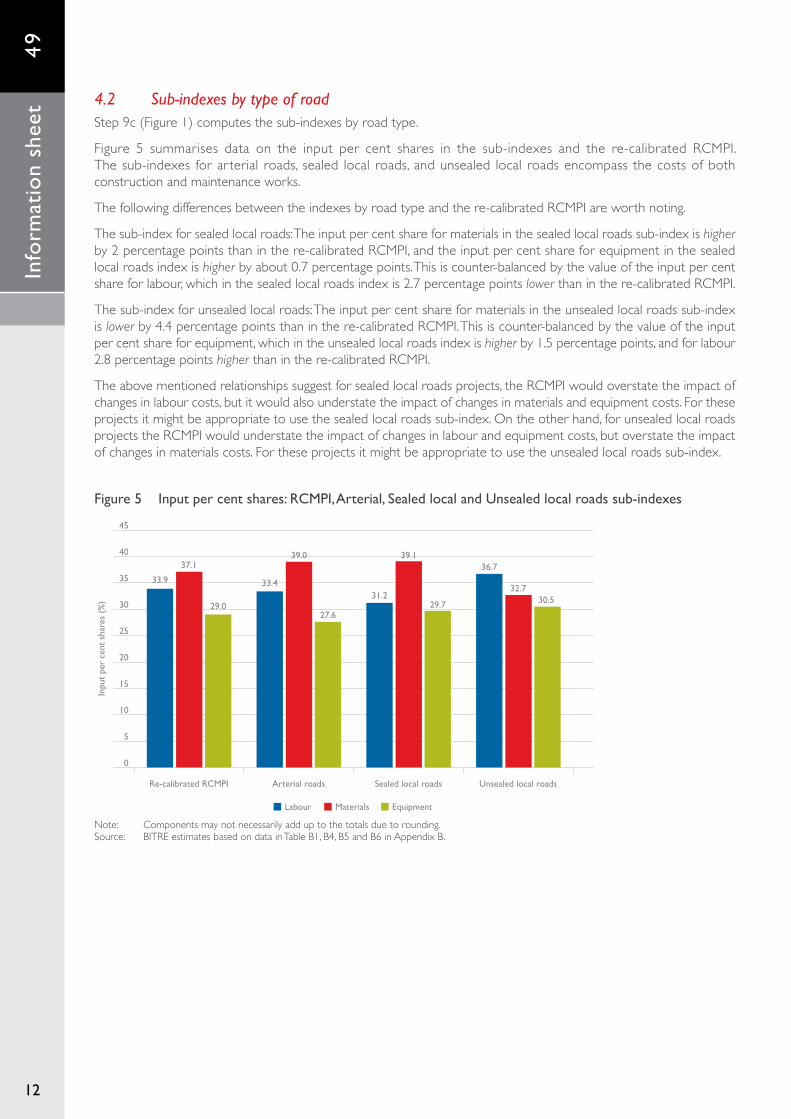
4.2 Sub-indexes by type of roadStep9c(Figure1)computesthesub-indexesbyroadtype.
Figure 5 summarises data on the input per cent shares in the sub-indexes and the re-calibrated RCMPI.Thesub-indexes forarterial roads, sealed local roads,andunsealed local roadsencompass thecostsofbothconstructionandmaintenanceworks.
Thefollowingdifferencesbetweentheindexesbyroadtypeandthere-calibratedRCMPIareworthnoting.
Thesub-indexforsealedlocalroads:Theinputpercentshareformaterialsinthesealedlocalroadssub-indexishigherby2percentagepointsthaninthere-calibratedRCMPI,andtheinputpercentshareforequipmentinthesealedlocalroadsindexishigherbyabout0.7percentagepoints.Thisiscounter-balancedbythevalueoftheinputpercentshareforlabour,whichinthesealedlocalroadsindexis2.7percentagepointslowerthaninthere-calibratedRCMPI.
Thesub-indexforunsealedlocalroads:Theinputpercentshareformaterialsintheunsealedlocalroadssub-indexislowerby4.4percentagepointsthaninthere-calibratedRCMPI.Thisiscounter-balancedbythevalueoftheinputpercentshareforequipment,whichintheunsealedlocalroadsindexishigherby1.5percentagepoints,andforlabour2.8percentagepointshigherthaninthere-calibratedRCMPI.
Theabovementionedrelationshipssuggestforsealedlocalroadsprojects,theRCMPIwouldoverstatetheimpactofchangesinlabourcosts,butitwouldalsounderstatetheimpactofchangesinmaterialsandequipmentcosts.Fortheseprojectsitmightbeappropriatetousethesealedlocalroadssub-index.Ontheotherhand,forunsealedlocalroadsprojectstheRCMPIwouldunderstatetheimpactofchangesinlabourandequipmentcosts,butoverstatetheimpactofchangesinmaterialscosts.Fortheseprojectsitmightbeappropriatetousetheunsealedlocalroadssub-index.
Figure 5 Input per cent shares: RCMPI, Arterial, Sealed local and Unsealed local roads sub-indexes
0
5
10
15
20
25
30
35
40
45
Unsealed local roadsSealed local roadsArterial roadsRe-calibrated RCMPI
EquipmentMaterials Labour
33.9
37.1
29.0
33.4
39.0
27.6
31.2
39.1
29.7
36.7
32.730.5
Inpu
t pe
r ce
nt s
hare
s (%
)
Note: Componentsmaynotnecessarilyadduptothetotalsduetorounding.Source: BITREestimatesbasedondatainTableB1,B4,B5andB6inAppendixB.

Info
rmat
ion
shee
t4
9
13
5 ResultsThissectionsummarisesthekeyresultsofthisstudy.
5.1 Sample surveysBITREdirectlysurveyedstate/territoryroadauthoritiesandlocalgovernments.AsurveywasalsocommissionedforAruptocollectdatafromprivatesectorcontractors.Map1showsthegeographicaldistributionofthesampleobservationsonwhichnewestimatesarebased.
Map 1 Sample observationsa,b,c for RCMPI by state and territory, 2013.
Notes:a. Allstate/territoryroadauthoritiesrespondedtothesurveyandsupplieddataonroadexpenditure.Theyalsoprovidedtheextentthey
outsourceprojectstolocalgovernmentsandprivatesectorcontractors.NSW,QldandSA,inaddition,supplieddataoninputpercentshares(denotedbya*onthemap).
b. Thepercentagefigurerepresentsthepercentageoflocalgovernmentsinthestateorterritorythatrespondedtothesurvey.Atotalof233outof558localgovernmentsresponded,givinganoverallresponserateof41.8%foralllocalgovernmentswithinAustralia.
c. 36privatesectorcompaniesrespondedtothesurvey.Ofthese16haveanationalpresenceinAustraliaand,in2011–12,hadroadprojectsinallstatesandterritories.Theyareshownas‘Private-National’onthemap.Therestwerelocalcompaniesoperatinginonlyonestateorterritory,andtheyareshownas‘Private-Local’.
Source: BITREsurveys.
5.2 Role of the private sector has increasedThe2013surveydatashowthattheroleoftheprivatesectorinroadconstructionandmaintenanceprojectsinAustraliahasincreasedto56percentfrom40percentin1997.Therolesofstate/territoryroadauthoritiesandoflocalgovernments,assuppliersofroadworksservices,areestimatedtohavedecreasedto16percent(from26percentin1997)and27percent(from34percentin1997)respectively.Theroleoftheprivatesectorisestimatedbythevalueofprojectsthesectorundertakesforprivatesectorclients,plusthevalueofprojectsoutsourcedtotheprivatesectorcontractorsbyeitherstate/territorygovernmentsorbylocalgovernmentsasapercentageofthetotalroadexpenditure.Thispercentagedoesnotrelatetowhopaysforroadprojects,ratheritrelatestowhophysicallyundertakestheroadconstructionandmaintenanceactivities.

Info
rmat
ion
shee
t4
9
14
5.3 Input per cent shares for labour, materials and equipment have changedSurveydatashowthatoverthe16yearsto2013,therehavebeenchangesinthethreecategoriesofinputsusedinroadconstructionandmaintenance:
• Labourcostshaveincreasedto33.9percentoftotalcostsin2013from25.8percentoftotalcostsin1997;• Materialscostshavedecreasedto37.1percentin2013from47.7percentin1997;and• Equipmentcostshaveincreasedto29percentin2013from26.5in1997.
5.4 A re-calibrated Road Construction and Maintenance Price Index (RCMPI)The2013re-calibratedBITRERoadConstructionandMaintenancePriceIndex(RCMPI)takesintoaccountthefollowingeightmajorinputsusedinroadconstructionandmaintenance:(1)site-basedlabour(2)office-basedlabour(3)bituminousmaterials(4)cementandconcrete(5)quarryproducts(6)othermaterials(7)planthire/depreciationand(8)fuel.
Figure6belowcomparesthefourindexes:
• Re-calibratedRCMPI(2013data,2013inputpercentshares)—theindextobeusedfrom2013onwards.Itutilisesthemostrecentdataonproducerpriceindexesandadoptsthenew2013inputpercentshares.
• RCMPI(2013data,1997inputpercentshares)—anindexcreatedtoillustratestheimpactofthenewinputpercentshares.Ithasnoformalstatus.
• DiscontinuedRCMPI(oldmethodology:pre-2013inputsand1997inputpercentshares)—theofficialindexusedupto2012(BITRE,2012).Theindexvaluesareaveragesofthefourquarterswithinthefinancialyear.TheyarenottheJunequartervaluesoftheindex.
• ABSRoadandBridgeconstructionoutputpriceindex.
Figure 6 Re-calibrated RCMPI (2013 data, 2013 input per cent shares), RCMPI (2013 data, 1997 input per cent shares), discontinued RCMPI and ABS output price index for Road and Bridges Construction (2011–12 = 100)
60
65
70
75
80
85
90
95
100
105
Jun-2
013
Dec-2
012
Jun-2
012
Dec-2
011
Jun-2
011
Dec-2
010
Jun-2
010
Dec-2
009
Jun-2
009
Dec-2
008
Jun-2
008
Dec-2
007
Jun-2
007
Dec-2
006
Jun-2
006
Dec-2
005
Jun-2
005
Dec-2
004
Jun-2
004
Dec-2
003
Jun-2
003
Dec-2
002
Jun-2
002
Dec-2
001
Jun-2
001
Dec-2
000
Jun-2
000
110
ABS Producer Price Index – Road and Bridge ConstructionRCMPI (2013 data, 1997 input per cent shares)Re-calibrated RCMPI 2013
Discontinued RCMPI
Inde
x va
lues
Source: BTCE(1997),ABS(2013a,c),BITRE(2012)andBITREestimates.
There-calibratedindexandthediscontinuedRCMPIgenerallytrackoneanotherveryclosely.TheexceptionwastheperiodbetweenSeptember2008toMarch2010,whenagapopensupbeforetrendingbacktogether.Therearetwomainreasonsastowhythemovementoccurred.
First,thenewpriceindicator(reinforcingsteel)introducedtomonitorpricesof‘othermaterials’wassignificantlyimpactedbetweenSeptemberquarter2008andMarchquarterof2010.AsshowninFigure3,thenewpriceindicator

Info
rmat
ion
shee
t4
9
15
(reinforcingsteel)roseby59.5percentagepoints,whereastheindicatorfor‘othermaterials’(allgroupshouseconstruction)inthediscontinuedRCMPIwentonatthesamerate.Thereforethere-calibratedRCMPIandRCMPI(2013data,1997inputpercentshares)arehigherthanthediscontinuedRCMPIduringthatperiod.
Secondly,theinputpercentsharefor‘othermaterials’hasdecreasedsignificantlyto5.85percentinthere-calibratedRCMPI,comparedto10.8percentintheRCMPI(2013data,1997inputpercentshares).Thereforeduringthatperiod,theriseofthepriceindicatorfor‘othermaterials’(reinforcingsteel)hasabiggerimpactintheRCMPI(2013data,1997inputpercentshares),sinceitsinputpercentshareishigher.
Thesefactorsparticularlyimpactonthecomparisonsof
a. There-calibratedRCMPIandtheRCMPI(2013data,1997inputpercentshares)(Figure7and8);
b. There-calibratedRCMPIandthenewsub-indicesonRoadConstructionandMaintenance(Figures9and10);
c. There-calibratedRCMPIagainstthediscontinuedRCMPI.
5.5 The change in the Indices between 2011–12 and 2012–13Figure7comparesthequarter-on-quarterpercentagechangebetweenthere-calibratedRCMPI(2013data,2013inputpercentshares),RCMPI(2013data,1997inputpercentshares)andthediscontinuedRCMPI.
ThediscontinuedRCMPIisonafinancialyearbasis,thereforeinFigure7,theaveragequarterlychangeintheindexisequaltothedifferencebetweentheindexvaluesfortwoconsecutivefinancialyearsdividedbyfour.Thisconversionallowsthedifferentindicestobecomparedonthesamebasis.
Figure 7 Quarter-on-Quarter percentage changes: the re-calibrated RCMPI (2013 input per cent shares) compared to RCMPI (2013 data, 1997 input per cent shares) and average quarterly changes in the discontinued RCMPI
-3
-2
-1
0
1
2
3
4
5
6
Quarterly change: RCMPI (2013 data, 1997 input per cent shares)Quarterly change: Re-calibrated RCMPI 2013
Jun-2
013
Dec-2
012
Jun-2
012
Dec-2
011
Jun-2
011
Dec-2
010
Jun-2
010
Dec-2
009
Jun-2
009
Dec-2
008
Jun-2
008
Dec-2
007
Jun-2
007
Dec-2
006
Jun-2
006
Dec-2
005
Jun-2
005
Dec-2
004
Jun-2
004
Dec-2
003
Jun-2
003
Dec-2
002
Jun-2
002
Dec-2
001
Jun-2
001
Dec-2
000
Jun-2
000
Average quarterly change: Discontinued RCMPI
Inde
x po
ints
Source: BTCE(1997),ABS(2013a,c),BITRE(2012)andBITREestimates.
There-calibratedquarterlyindexcanbeconvertedtoafinancialyearindexasshowninTable4.Figure8comparestheyear-on-yearpercentagechangebetweenthere-calibratedRCMPI(2013data,2013inputpercentshares)andthediscontinuedRCMPI.

Info
rmat
ion
shee
t4
9
16
Figure 8 Year-on-year percentage changes: the re-calibrated RCMPI (2013 input per cent shares) compared to the discontinued RCMPI
-3
-1
1
3
5
7
Annual Change: Re-calibrated RCMPIAnnual Change: Discontinued RCMPI
2012
–13
2011
–12
2010
–11
2009
–10
2008
–09
2007
–08
2006
–07
2005
–06
2004
–05
2003
–04
2002
–03
2001
–02
Inde
x po
ints
2.15
2.87
4.03
3.43
4.02
3.13
3.602.89
5.69
1.28
2.82
6.56
2.33
3.14
0.36
2.86
3.59
2.52
4.80
6.74
-0.85
2.73
1.42
4.76
Source: BITREestimates.
Figure9showsthatthere-calibratedRCMPIincreasedby1.42percentagepointsbetween2011–12and2012–13.Themostsignificantcontributorstotheindexincreasewererisesin‘site-basedlabour’and‘bituminousmaterials’costs.Theywerecounterbalanced,toalimitedextent,byfallsin‘planthire/depreciation’,‘othermaterials’and‘fuelcosts’overthesameperiod.
Figure 9 Contributions by inputs to the change in the BITRE RCMPI (2013 data, 2013 input per cent shares) between 2011–12 and 2012–13.
-1.0
-0.5
0.0
0.5
1.0
1.5
2.0
Total
Cemen
t and
conc
rete
Offic
e-base
d lab
our
Qua
rry pr
oduc
ts
Bitum
inous
mate
rials
Site-b
ased l
abou
rFu
el
Oth
er m
ateria
ls (St
eel)
Equip
ment h
ire/de
prec
iation
-0.48
-0.07-0.03
0.88
0.75
0.250.08 0.04 1.42
Inde
x po
ints
Source: BITREestimates.

Info
rmat
ion
shee
t4
9
17
5.6 Five new RCMPI sub-indexesThecomputationofthesub-indexesreliesonthesamemethodologyastheRCMPI.However,thecorrespondinginputpercentshareswerecollectedexplicitlyandseparatelybysurveysonmajorsuppliersofroadworksservicesinAustralia,andtheyaredifferentfromthoseintheRCMPI.
Figure10presentsingraphicalformthetwonewsub-indexesbytypeofactivityanditshowstheyhaveslopessimilartothatoftheRCMPI.
Figure11presentsingraphicalformthethreenewsub-indexesbyroadtype.Asforthesub-indexesbyactivitytype,asimplecomparisonofthesub-indexeswiththere-calibratedRCMPIshowssimilarityintheslopesbetweentheindexes.
Table4showsthetimeseriesdataofthesub-indexes.
Figure 10 Two new sub-indexes by type of major activity: construction and maintenance
60
65
70
75
80
85
90
95
100
105
MaintenanceConstructionRe-calibrated RCMPI
Jun-2
013
Dec-2
012
Jun-2
012
Dec-2
011
Jun-2
011
Dec-2
010
Jun-2
010
Dec-2
009
Jun-2
009
Dec-2
008
Jun-2
008
Dec-2
007
Jun-2
007
Dec-2
006
Jun-2
006
Dec-2
005
Jun-2
005
Dec-2
004
Jun-2
004
Dec-2
003
Jun-2
003
Dec-2
002
Jun-2
002
Dec-2
001
Jun-2
001
Dec-2
000
Jun-2
000
Inde
x va
lues
Source: BITREestimates.
Figure 11 Three new sub-indexes by road type: arterial, sealed local and unsealed local roads
60
65
70
75
80
85
90
95
100
105
Unsealed LocalSealed LocalArterialRe-calibrated RCMPI
Jun-2
013
Dec-2
012
Jun-2
012
Dec-2
011
Jun-2
011
Dec-2
010
Jun-2
010
Dec-2
009
Jun-2
009
Dec-2
008
Jun-2
008
Dec-2
007
Jun-2
007
Dec-2
006
Jun-2
006
Dec-2
005
Jun-2
005
Dec-2
004
Jun-2
004
Dec-2
003
Jun-2
003
Dec-2
002
Jun-2
002
Dec-2
001
Jun-2
001
Dec-2
000
Jun-2
000
Inde
x va
lues
Source: BITREestimates.

Info
rmat
ion
shee
t4
9
18
Table 4 BITRE Road Construction and Maintenance Price Indexes and five sub-indexes: (Quarterly, 2011–12=100)
All roads Sub-index by activity type Sub-index by road type
Year Quarter
Re-calibrated
RCMPI(2013 data, 2013 input
per cent shares)
Re-calibrated
RCMPI(Financial
year basis)
Discontinued RCMPI
(Financial year basis, 2011–12
=100)b
RCMPI(2013 data, 1997 input
per cent shares)c
Road Construction
Road Maintenance
Arterial Roads
Sealed Local
Roads
Unsealed Local
Roads
Index reference period, 2011–12 =100a
Index reference period, 2011–12 =100
Index reference period, 2011–12 =100
2004 March 71.65 71.21 71.35 71.82 71.36 71.90 71.67June 72.96 71.67 71.90 72.83 72.79 73.00 72.59 73.22 73.13September 74.65 74.97 74.65 74.51 74.15 74.85 75.20December 75.22 75.58 75.25 75.07 74.72 75.43 75.76
2005 March 76.13 76.48 76.19 75.93 75.54 76.31 76.84June 76.76 75.69 75.30 77.21 76.83 76.55 76.19 76.94 77.46September 78.53 79.10 78.57 78.36 78.01 78.68 79.29December 79.00 79.56 79.01 78.86 78.55 79.19 79.60
2006 March 79.23 79.53 79.21 79.14 78.80 79.39 79.75June 80.40 79.29 78.46 80.76 80.36 80.33 80.02 80.61 80.78September 81.00 81.36 80.98 80.92 80.62 81.13 81.52December 81.10 81.22 81.04 81.06 80.75 81.23 81.48
2007 March 82.17 82.19 82.10 82.12 81.75 82.26 82.67June 82.97 81.81 81.32 83.20 82.99 82.85 82.44 82.97 83.85September 84.59 84.68 84.53 84.54 84.18 84.59 85.26December 85.93 86.13 85.93 85.83 85.48 85.85 86.80
2008 March 86.63 86.86 86.61 86.57 86.25 86.59 87.39June 89.30 86.61 86.99 90.37 89.54 88.98 88.81 89.31 90.33September 92.89 95.56 93.75 91.97 92.42 93.05 93.84December 94.41 98.04 95.80 92.99 93.87 94.68 95.33
2009 March 93.51 96.82 94.87 92.11 92.95 93.73 94.36June 92.62 93.36 88.31 95.12 93.70 91.51 92.08 92.70 93.54September 92.28 93.79 92.97 91.55 91.79 92.22 93.23December 92.41 93.53 92.97 91.81 91.94 92.30 93.35
2010 March 92.20 92.81 92.60 91.76 91.70 91.95 93.36June 93.13 92.50 91.11 93.80 93.49 92.72 92.69 93.00 94.01September 93.73 94.01 93.95 93.46 93.31 93.57 94.60December 94.26 94.21 94.38 94.08 93.80 94.04 95.21
2011 March 95.15 95.07 95.28 94.95 94.57 94.79 96.52June 97.81 95.24 97.67 98.15 97.99 97.58 97.44 97.65 98.67September 99.02 99.30 99.11 98.93 98.98 99.01 99.15December 99.84 99.98 99.93 99.74 99.71 99.73 100.23
2012 March 99.84 99.64 99.76 99.92 99.90 99.88 99.66June 101.30 100.00 100.00 101.09 101.20 101.41 101.42 101.38 100.96September 101.06 100.92 101.01 101.16 101.28 101.14 100.57December 101.62 101.41 101.55 101.72 101.79 101.66 101.23
2013 March 101.62 101.27 101.52 101.75 101.80 101.64 101.22June 101.37 101.42 103.14 100.89 101.21 101.59 101.62 101.40 100.85
Notes:a. Using2011–12astheIndexreferenceperiodmeansthattheaverageoftheindexesforSeptemberquarter2011,Decemberquarter2011,
Marchquarter2012andJunequarter2012is100.b. InthefuturethediscontinuedRCMPIwillnotbeavailablebeyondJunequarter2013.Itissubsumedbythere-calibratedRCMPIbasedon2013
expenditureweightsandinputpercentshares.c. TheRCMPI(2013data,1997inputpercentshares)andthediscontinuedRCMPIarenowcalculatedonanIndexreferenceperiodof2011–12
=100.0.Source: BITREestimates

Info
rmat
ion
shee
t4
9
19
6. ConclusionsThisinformationsheetpresentsthe2013re-calibratedBITRERoadConstructionandMaintenancePriceIndex(RCMPI).The revised indexmonitorspricechanges in theeightmajor inputsused in roadconstructionandmaintenance.Thisisthemostrecentre-calibrationoftheRCMPI.Re-calibrationshavebeenundertakenevery16yearsinthelast32years.
The2013re-calibrationoftheRCMPIinvolvedthreemajortasks:theroadprojectsexpenditureweightswhichreflecttherelativerolesinmajorsuppliersofroadworkshavebeenre-estimated;theinputpercentshareshavealsobeenre-estimated,andthreeoftheinputshavebeenassociatedwithnewproducerpriceindexesinordertomeasurethepricechangesmoreaccurately.
Furthermore,theinformationpaperintroducestwonewsub-indexesbymajoractivity:constructionandmaintenance,andthreenewsub-indexesbyroadtype:arterial,sealedlocalandunsealedlocalroads.Thesesub-indexesareunderpinnedbythesamemethodologyastheRCMPI,however,theyarebasedoninputpercentsharesfortherelevantactivitiesorroadtypes.
TheRCMPIestimatedchangesinthecostofconstructingandmaintainingroadsinAustralia.Foragivenyear,thesub-indexesshowtherangeofpossibleoutcomes,whichdependonthetypeofroadworks(constructionversusmaintenance)andthetypeofroads(arterial,sealedlocalorunsealedlocalroads).

Info
rmat
ion
shee
t4
9
20
Appendix A: Input mix by supplier of road works servicesThefiguresinTableA1areweightedaveragesoftheinputpercentshares,reportedbystate/territoryroadauthoritiesthatprovideddataintheirsurveyresponsesonsubstantialroadworksundertakenin-house.TheweightsusedarebasedontheroaddistancesinTableA2.
TheweightsarecalculatedusingroaddistancesbecausetheyprovideanaccuratereflectionoftheconstructionandmaintenancecostsonAustralianroads.Theyarenotbasedonroadexpendituresinceitplacesgreateremphasistowardsmorecostlyroadworks,suchastunnels,bridgesandmajorroadprojects,andthereforelesslikelytoprovideanexactrepresentationofregularroadworks.
Inthisstudy,roadauthoritiesinNSW,QldandSArespondedwithdataoninputshares.Theotherstatesreportedthattheirroadworkswereoutsourcedtoeitherlocalgovernmentsinthestate/territory,toprivatesectorcontractorsorboth.
Table A1 State/ territory road authorities: Input per cent shares for in-house projects
Arterial roadsa, b Sealed local roadsa, b
Construction Maintenance Maintenance
LABOURSite-based 29.55 37.20 23.18
Office-based 6.95 6.35 1.42
Alllabour 36.50 43.55 24.60MATERIALS
Bituminousmaterials 29.57 27.47 15.39Cementandconcrete 3.11 3.05 0.00
Quarryproducts 0.00 0.00 0.00Othermaterials(reinforcingsteel) 3.11 3.05 2.56
Allmaterials 35.80 33.58 17.95EQUIPMENT
Hire/depreciation 26.91 21.35 55.56Fuel 0.79 1.53 1.88
Allequipment 27.70 22.88 57.44ALLINPUTSc 100.00 100.00 100.00
Samplesize 3 3 2
Notes:a. Theinputsharesinthetableare‘lengthofroad’weightedaveragesofthedatafromstatesthatrespondedtothesurvey.b. The‘lengthofroad’weightsarecomputedusingdatainTableA2as(thelengthofarterialroadsinastateorterritory/thetotallengthofroadin
allthestates/territoriesrespondedtothesurveywithdataoninputpercentshares).ResponseswithestimatesofinputpercentshareswerereceivedfromdepartmentsofmainroadsinNewSouthWales,QueenslandandSouthAustralia.Victoriaindicatedthatmajorityoftheirroadprojectswereoutsourced.
c. Componentsmaynotnecessarilyadduptothetotalsduetorounding.Source: BITREestimates.
Table A2 Length of road in kilometres, by state and territory, by class of road, 2011–12
State/ Territory Arterial roads Local roads Total
(kilometres) (kilometres) (kilometres)
NSW 86225 120462 206687Vic 44457 101323 145780Qld 34986 194186 229172SA 19285 78711 97996WA 29328 140266 169594Tas 5521 25701 31222NT 18499 3264 21763ACT 476 2931 3407Other 19 161 180
Total 238796 667005 905801
Source: BITREestimates.
Info
rmat
ion
shee
t4
9
21
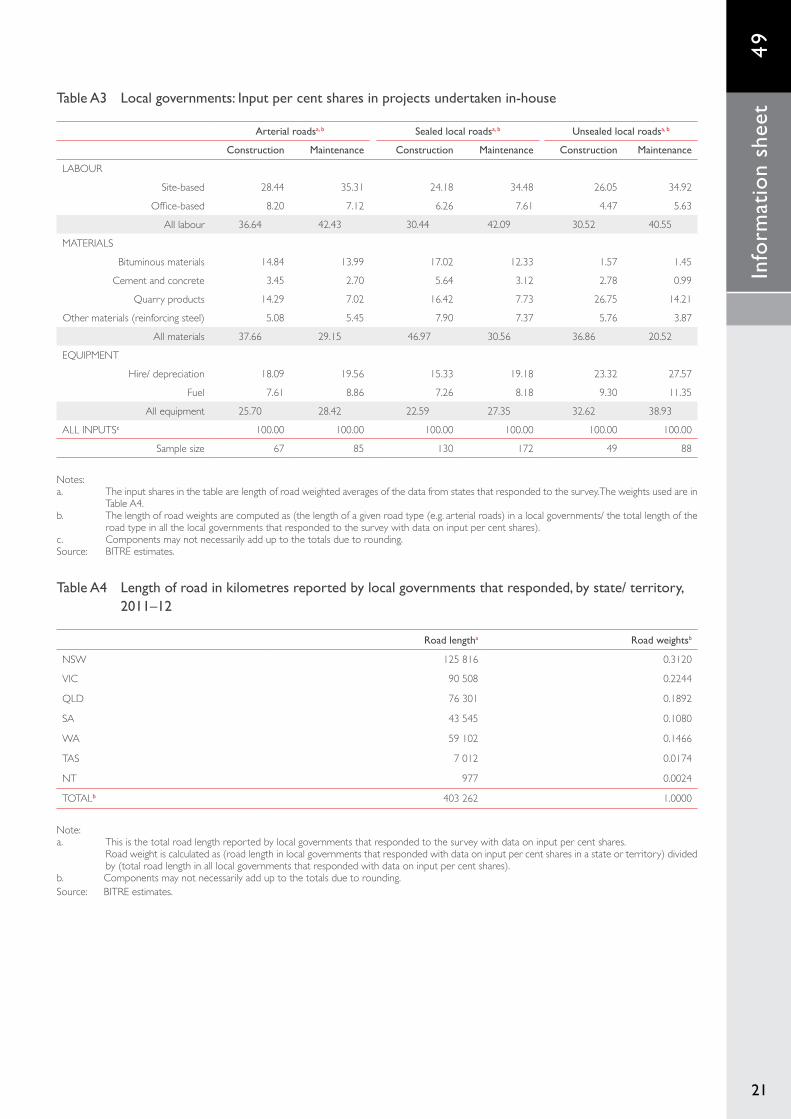
Table A3 Local governments: Input per cent shares in projects undertaken in-house
Arterial roadsa, b Sealed local roadsa, b Unsealed local roadsa, b
Construction Maintenance Construction Maintenance Construction Maintenance
LABOUR
Site-based 28.44 35.31 24.18 34.48 26.05 34.92
Office-based 8.20 7.12 6.26 7.61 4.47 5.63
Alllabour 36.64 42.43 30.44 42.09 30.52 40.55
MATERIALS
Bituminousmaterials 14.84 13.99 17.02 12.33 1.57 1.45
Cementandconcrete 3.45 2.70 5.64 3.12 2.78 0.99
Quarryproducts 14.29 7.02 16.42 7.73 26.75 14.21
Othermaterials(reinforcingsteel) 5.08 5.45 7.90 7.37 5.76 3.87
Allmaterials 37.66 29.15 46.97 30.56 36.86 20.52
EQUIPMENT
Hire/depreciation 18.09 19.56 15.33 19.18 23.32 27.57
Fuel 7.61 8.86 7.26 8.18 9.30 11.35
Allequipment 25.70 28.42 22.59 27.35 32.62 38.93
ALLINPUTSc 100.00 100.00 100.00 100.00 100.00 100.00
Samplesize 67 85 130 172 49 88
Notes:a. Theinputsharesinthetablearelengthofroadweightedaveragesofthedatafromstatesthatrespondedtothesurvey.Theweightsusedarein
TableA4.b. Thelengthofroadweightsarecomputedas(thelengthofagivenroadtype(e.g.arterialroads)inalocalgovernments/thetotallengthofthe
roadtypeinallthelocalgovernmentsthatrespondedtothesurveywithdataoninputpercentshares).c. Componentsmaynotnecessarilyadduptothetotalsduetorounding.Source: BITREestimates.
Table A4 Length of road in kilometres reported by local governments that responded, by state/ territory, 2011–12
Road lengtha Road weightsb
NSW 125816 0.3120
VIC 90508 0.2244
QLD 76301 0.1892
SA 43545 0.1080
WA 59102 0.1466
TAS 7012 0.0174
NT 977 0.0024
TOTALb 403262 1.0000
Note:a. Thisisthetotalroadlengthreportedbylocalgovernmentsthatrespondedtothesurveywithdataoninputpercentshares. Roadweightiscalculatedas(roadlengthinlocalgovernmentsthatrespondedwithdataoninputpercentsharesinastateorterritory)divided
by(totalroadlengthinalllocalgovernmentsthatrespondedwithdataoninputpercentshares).b. Componentsmaynotnecessarilyadduptothetotalsduetorounding.Source: BITREestimates.

Info
rmat
ion
shee
t4
9
22
Table A5 Private sector contractors: Input per cent shares used in projects
Arterial roadsa Sealed local roadsa Unsealed local roadsa
Construction Maintenance Construction Maintenance Construction Maintenance
LABOURSite-based 18.10 20.57 21.55 23.90 25.36 33.14
Office-based 10.84 7.44 7.02 8.80 7.36 8.71Alllabour 28.94 28.01 28.57 32.70 32.71 41.86
MATERIALSBituminousmaterials 11.12 24.89 12.01 26.20 0.14 0.00Cementandconcrete 5.81 7.62 7.76 8.00 1.71 0.00
Quarryproducts 15.17 9.22 15.64 7.20 27.29 26.29Othermaterials(reinforcingsteel) 8.51 3.63 11.24 2.60 10.57 3.43
Allmaterials 40.61 45.37 46.65 44.00 39.71 29.71EQUIPMENT
Hire/depreciation 25.02 21.49 19.01 17.90 20.57 23.29
Fuel 5.43 5.13 5.77 5.40 7.00 5.14Allequipment 30.46 26.62 24.78 23.30 27.57 28.43
ALLINPUTSb 100.00 100.00 100.00 100.00 100.00 100.00Samplesize 21 9 18 10 7 7
Notes:a. Theinputsharesinthetableareaveragesofthedatafrom36companiesthatrespondedtothesurvey.b. Componentsmaynotnecessarilyadduptothetotalsduetorounding.Source: Arup(2013).

Info
rmat
ion
shee
t4
9
23
Appendix B: National aggregated input per cent shares used in RCMPI and sub-indexesTable B1 RCMPI: input per cent shares—2013
State / territory road authorities’
input per cent shares
Local governments’
input per cent shares
Private sector contractors’
input per cent shares
Roada expenditure
weighted input per cent shares
Road expenditure
weighted input per cent shares
Change between
1997 & 2013
2013 1997LABOUR
Site-based 29.98 30.56 23.77 26.64 17.00 9.64Office-based 4.91 6.55 8.36 7.31 8.90 -1.59Alllabour 34.88 37.11 32.13 33.94 25.80 8.14
MATERIALSBituminousmaterials 24.14 10.20 12.39 13.70 12.00 1.70Cementandconcrete 2.06 3.11 5.15 4.09 9.70 -5.61
Quarryproducts 0.00 14.41 16.80 13.42 15.30 -1.88
Othermaterials(reinforcingsteel) 2.91 5.90 6.66 5.85 10.80 -4.95Allmaterials 29.11 33.62 41.01 37.06 47.70 -10.64
EQUIPMENTHire/depreciation 34.61 20.51 21.21 23.19 19.60 3.59
Fuel 1.40 8.76 5.65 5.81 6.80 -0.99Allequipment 36.01 29.27 26.86 29.00 26.50 2.50
ALLINPUTSb 100.00 100.00 100.00 100.00 100.00 naExpenditureweights
(FromTable4ofthisIS)0.1623 0.2736 0.5641 1.00 na na
Note:a. Thedataintheshadedcolumnrepresenttheinputpercentsharesusedinthere-calibratedRCMPI2013. na:notapplicableb. Componentsmaynotnecessarilyadduptothetotalsduetorounding.Source: BITREestimates.
Table B2 Construction sub-index: input per cent shares—2013
State / territory road authorities’ input
per cent shares
Local governments’ input per cent
shares
Private sector contractors’ input
per cent shares
Road expenditurea weighted input per cent shares
LABOUR
Site-based 29.55 26.22 21.67 24.19
Office-based 6.95 6.31 8.41 7.60
Alllabour 36.50 32.53 30.07 31.79
MATERIALS
Bituminousmaterials 29.57 11.14 7.76 12.23
Cementandconcrete 3.11 3.95 5.10 4.46
Quarryproducts 0.00 19.16 19.36 16.16
Othermaterials(reinforcingsteel) 3.11 6.24 10.11 7.92
Allmaterials 35.80 40.50 42.32 40.77
EQUIPMENT
Hire/depreciation 26.91 18.91 21.53 21.69
Fuel 0.79 8.05 6.07 5.76
Allequipment 27.70 26.97 27.60 27.44
ALLINPUTSb 100.00 100.00 100.00 100.00
Expenditureweights(FromTable4ofthisIS)
0.1623 0.2736 0.5641 1.00
Note:a. Thedataintheshadedcolumnrepresenttheinputpercentsharesusedinthe2013roadconstructionsub-index.b. Componentsmaynotnecessarilyadduptothetotalsduetorounding.Source: BITREestimates.

Info
rmat
ion
shee
t4
9
24
Table B3 Maintenance sub-index: input per cent shares—2013
State / territory road authorities’ input
per cent shares
Local governments’ input per cent
shares
Private sector contractors’ input
per cent shares
Road expenditurea
weighted input per cent shares
LABOUR
Site-based 30.19 34.90 25.87 29.04
Office-based 3.89 6.79 8.32 7.18
Alllabour 34.08 41.69 34.19 36.22
MATERIALS
Bituminousmaterials 21.43 9.26 17.03 15.62
Cementandconcrete 1.53 2.27 5.21 3.81
Quarryproducts 0.00 9.66 14.24 10.67
Othermaterials(reinforcingsteel) 2.81 5.56 3.22 3.79
Allmaterials 25.76 26.74 39.69 33.89
EQUIPMENT
Hire/depreciation 38.46 22.10 20.89 24.07
Fuel 1.70 9.46 5.23 5.81
Allequipment 40.16 31.57 26.12 29.89
ALLINPUTSb 100.00 100.00 100.00 100.00
Expenditureweights(FromTable4ofthisIS)
0.1623 0.2736 0.5641 1.00
Note:a. Thedataintheshadedcolumnrepresenttheinputpercentsharesusedinthe2013roadmaintenancesub-index.b. Componentsmaynotnecessarilyadduptothetotalsduetorounding.Source: BITREestimates.

Info
rmat
ion
shee
t4
9
25
Table B4 Arterial roads sub-index: input per cent shares—2013
State / territory road authorities’ input
per cent shares
Local governments’ input per cent
shares
Private sector contractors’ input
per cent shares
Road expenditurea
weighted input per cent shares
LABOUR
Site-based 33.37 31.88 19.33 25.04
Office-based 6.65 7.66 9.14 8.33
Alllabour 40.02 39.54 28.47 33.37
MATERIALS
Bituminousmaterials 28.52 14.41 18.00 18.73
Cementandconcrete 3.08 3.07 6.72 5.13
Quarryproducts 0.00 10.66 12.19 9.79
Othermaterials(reinforcingsteel) 3.08 5.26 6.07 5.37
Allmaterials 34.69 33.40 42.99 39.02
EQUIPMENT
Hire/depreciation 24.13 18.83 23.26 22.19
Fuel 1.16 8.23 5.28 5.42
Allequipment 25.29 27.06 28.54 27.61
ALLINPUTSb 100.00 100.00 100.00 100.00
Expenditureweights(FromTable4ofthisIS)
0.1623 0.2736 0.5641 1.00
Note:a. Thedataintheshadedcolumnrepresenttheinputpercentsharesusedin2013arterialroadssub-index.b. Componentsmaynotnecessarilyadduptothetotalsduetorounding.Source: BITREestimates.
Table B5 Sealed local roads sub-index: input per cent shares—2013
State / territory road authorities’ input
per cent shares
Local governments’ input per cent
shares
Private sector contractors’ input
per cent shares
Road expenditurea weighted input per cent
shares
LABOUR
Site-based 23.18 29.33 22.73 24.61
Office-based 1.42 6.94 7.91 6.59
Alllabour 24.60 36.26 30.64 31.20
MATERIALS
Bituminousmaterials 15.39 14.67 19.11 17.29
Cementandconcrete 0.00 4.38 7.88 5.64
Quarryproducts 0.00 12.08 11.42 9.75
Othermaterials(reinforcingsteel) 2.56 7.64 6.92 6.41
Allmaterials 17.95 38.76 45.33 39.09
EQUIPMENT
Hire/depreciation 55.56 17.25 18.45 24.15
Fuel 1.88 7.72 5.59 5.57
Allequipment 57.44 24.97 24.04 29.72
ALLINPUTSb 100.00 100.00 100.00 100.00
Expenditureweights(FromTable4ofthisIS)
0.1623 0.2736 0.5641 1.00
Notes:a. Thedataintheshadedcolumnrepresenttheinputpercentsharesusedinthethe2013sealedlocalroadssub-index.b. Componentsmaynotnecessarilyadduptothetotalsduetorounding.Source: BITREestimates.

Info
rmat
ion
shee
t4
9
26
Table B6 Unsealed local roads sub-index: input per cent shares—2013
Local governments’ input per cent shares
Private sector contractors’ input per cent shares
Road expenditure weighteda input per cent shares
LABOUR
Site-based 30.49 29.25 29.65
Office-based 5.05 8.04 7.06
Alllabour 35.54 37.29 36.71
MATERIALS
Bituminousmaterials 1.51 0.07 0.54
Cementandconcrete 1.88 0.86 1.19
Quarryproducts 20.48 26.79 24.73
Othermaterials(reinforcingsteel) 4.81 7.00 6.29
Allmaterials 28.69 34.71 32.75
EQUIPMENT
Hire/depreciation 25.45 21.93 23.08
Fuel 10.33 6.07 7.46
Allequipment 35.77 28.00 30.54
ALLINPUTSb 100.00 100.00 100.00
Expenditureweights(FromTable4ofthisIS)
0.3266 0.6734 1.00
Note:a. Thedataintheshadedcolumnrepresenttheinputpercentsharesusedinthe2013unsealedlocalroadssub-index.b. Componentsmaynotnecessarilyadduptothetotalsduetorounding.Source: BITREestimates.
Info
rmat
ion
shee
t4
9
27
ReferencesABS2013a,Producer Price Indexes, Australia, June 2013,ABScatalogueno.6427.0,<http://www.abs.gov.au/AUSSTATS>
ABS2013b,Average Weekly Earnings, Australia, May 2013,ABScatalogueno.6302.0,<http://www.abs.gov.au/AUSSTATS>
ABS2013c,Consumer Price Index, Australia, June 2013,ABScatalogueno.6401.0,<http://www.abs.gov.au/AUSSTATS>
Arup(2013)Inputpercentsharesinprivatesectorroadconstructionandmaintenanceprojects:ResultsfromasurveyundertakenforBITRE(unpublished),June2013.
AustralianPetroleumInstitute2013, Weekly Diesel Prices Report, week ending 1 July, viewedJuly2013at<http://www.aip.com.au/pricing/weeklydieselreport.htm>
Austroads(2013),Austroads’listofContractorsprequalifiedundertheNationalpre-qualificationsystemforcivilconstructioncontracts,availableathttp://www.austroads.com.au/project-delivery/prequalification#ListofContractorsPrequalifiedunderNationalPrequalificationSystem
BITRE2013,Yearbook2013:AustralianInfrastructureStatistics,StatisticalReport,BITRE,Canberra,ACT.
BITRE2012,BITRERoadConstructionandMaintenancePriceIndex, InformationSheet45(November2012),BITRE,Canberra.
BITRE2011a,BITRERoadConstructionandMaintenancePrice Index, InformationSheet42(October2011),BITRE,Canberra.
BITRE2011b,PublicRoad-RelatedExpenditureandRevenueinAustralia,InformationSheet40(February2011),BITRE,Canberra.
BITRE2009a,PublicRoad-RelatedExpenditureandRevenueinAustralia,InformationSheet37(November2009),BITRE,Canberra.
BITRE2009b,PublicRoad-RelatedExpenditureandRevenueinAustralia,InformationSheet29(February2009),BITRE,Canberra.
BITRE2008a,PublicRoad-RelatedExpenditureandRevenueinAustralia,InformationSheet27(February2008),BITRE,Canberra.
BITRE2008b,PublicRoad-RelatedExpenditureandRevenueinAustralia,InformationSheet25(October2008),BITRE,Canberra.
BTCE1997,BTCERoadConstructionandMaintenancePriceIndex(InformationPaper41),AustralianGovernmentPublishingService,Canberra.
NationalTransportCommission2012,Heavyvehiclecharges.ReporttotheStandingCouncilofTransportandInfrastructure,NTC,February2012.
Info
rmat
ion
shee
t4
9
28
©CommonwealthofAustralia2013ISSN1440-9593ISBN978-1-922205-51-3November2013/INFRA1991
CreativeCommonsAttribution3.0AustraliaLicenceisastandardformlicenceagreementthatallowsyoutocopy,communicateandadaptthispublicationprovidedthatyouattributetheworktotheCommonwealthandabidebytheotherlicenceterms.Asummaryofthelicencetermsisavailablefromhttp://creativecommons.org/licenses/by/3.0/au/deed.en.Thefulllicencetermsareavailablefromhttp://creativecommons.org/licenses/by/3.0/au/legalcode.
Thispublicationshouldbeattributedinthefollowingway;BureauofInfrastructure,TransportandRegionalEconomics(BITRE),2013,BITRE Road Construction and Maintenance Price Index and Sub-Index—2013 update,InformationSheet49,BITRE,Canberra.
AcknowledgementTheinformationsheetwascompiledbyBryanLeeintheInfrastructureandSurfaceTransportStatisticsSection.BryanLeealsoundertookmostoftheworktosurveylocalgovernments.AnatoliLightfootundertookthesurveysofstate/territoryroadauthorities.ARUP,aprivatesectorconsultingfirm,wascommissionedbyBITREtocollectdatafromtheprivatesector.
Coverphoto:Roadgrader.ImagecourstesyofCaterpillarInc.
Use of the Coat of ArmsTheDepartmentofthePrimeMinisterandCabinetsetsthetermsunderwhichtheCoatofArmsisused.PleaserefertotheDepartment’sCommonwealthCoatofArmsandGovernmentBrandingwebpagehttp://www.dpmc.gov.au/guidelines/index.cfm#brandandinparticular,theGuidelinesontheuseoftheCommonwealthCoatofArmspublication.
Contact usThispublicationisavailableinPDFformat.Allotherrightsarereserved,includinginrelationtoanyDepartmentallogosortrademarkswhichmayexist.Forenquiriesregardingthelicenceandanyuseofthispublication,pleasecontact:
DepartmentofInfrastructureandRegionalDevelopmentBureauofInfrastructure,TransportandRegionalEconomics(BITRE)GPOBox501,CanberraACT2601,Australia
Telephone:(international)+61262747210Fax: (international)+61262746855Email: [email protected]: www.bitre.gov.au