49 Erosion and sediment transport...
11
49 Erosion and sediment transport measurement (Proceedings of the Florence Symposium, June 1981) Some observations on the movement of cobbles on a streambed LUNA B. LEOPOLD Department of Geology and Geophysics University of California Berkeley, California, 94720 USA WILLIAM W. EMMETT U.S. Geological Survey Box 25046, MS 413, DFC Lakewood, Colorado 80225 USA GENERAL STATEMENT Numerous experiments have been undertaken to measure the bed shear stress necessary to move particles of different sizes. The well known Shields curve for initial motion is supported by compilations of other data, for example, Leopold, Wolman, and Miller (1964), Fig. 6-11, p. 170. However, flume experiments'have dealt primarily with debris of uniform size. In natural gravel bed rivers, size distribution makes the application of such curves problematical for the effect of hiding—small grains being protected from stress by larger grains—is poorly known. It has been shown that the closer one rock is to its neighbors, the larger is the shear stress needed to move either (Langbein and Leopold, 1968). Experiments in an ephemeral stream by Leopold, Emmett, and Myrick (1966) demonstrated that the effect of proximity becomes negligible when adjacent cobbles are separated by 8 diameters or more.
Transcript of 49 Erosion and sediment transport...

49
Erosion and sediment transport measurement (Proceedings of the Florence Symposium, June 1981)
Some observations on the movement of cobbles on a streambed
LUNA B. LEOPOLD
Department of Geology and Geophysics University of California Berkeley, California, 94720 USA
WILLIAM W. EMMETT U.S. Geological Survey Box 25046, MS 413, DFC Lakewood, Colorado 80225 USA
GENERAL STATEMENT
Numerous experiments have been undertaken to measure the bed shear
stress necessary to move particles of different sizes. The well
known Shields curve for initial motion is supported by compilations
of other data, for example, Leopold, Wolman, and Miller (1964),
Fig. 6-11, p. 170. However, flume experiments'have dealt primarily
with debris of uniform size. In natural gravel bed rivers, size
distribution makes the application of such curves problematical for
the effect of hiding—small grains being protected from stress by
larger grains—is poorly known. It has been shown that the closer
one rock is to its neighbors, the larger is the shear stress needed
to move either (Langbein and Leopold, 1968). Experiments in an
ephemeral stream by Leopold, Emmett, and Myrick (1966) demonstrated
that the effect of proximity becomes negligible when adjacent cobbles
are separated by 8 diameters or more.

-.. W C > - A - / , *r.- :•*.-'. ̂<Ci*bw~r:r »t-;:•£". '>iU-*6*&l£:;i~
so
If the shear stress is sufficient to move a rock of a given size,
it is not known whether all rocks of that size will move, whether
all rocks of smaller size will move, or how far each moved rock will
be carried. A preliminary and incomplete experiment to answer those
questions is described here. Because of its simplicity, however, the
procedure might be used for a more sophisticated experimental design.
EXPERIMENT
White Clay Creek at the Stroud Water Laboratory drains 7.25 km2 in
the West Grove Quadrangle, Pennsylvania. The stream at that place
has a width of 5.2 m, and a gravel bed the median grain size, D.Q,
of which is 58 mm. Its pattern is sinuous or straight with well
developed pools and riffles. The drainage area is agricultural,
mostly in pasture with moderate amounts of forested woodlot inter-
spersed with some tilled cropland. Mean annual precipitation is
about 1200 mm.
Three riffles were selected from which cobbles of various sizes
were collected, from the rocks collected 90 were selected, repre
senting three size classes. The smallest class was typical of rocks
on the riffles 35% finer and is designated D,5. In this class the
dominant size was 47 mm on the B axis (intermediate axis). The mid
dle size rocks represented D5Q (50% finer) and the dominant B axis
dimension was 58 mm. The largest size represented Dg^ (84% finer);
the dominant B axis dimension was 91 mm.
These 90
the channel
were placed
flow direct
10 f& rocks of
of 10 rocks
was a line
Two staf
downchannel
elevations
slope to be
Across £
From it, r<
on a gage
stream is .
readings o
allowed co
three riff,
were avail
stress as
T " yds o
where t O;
water, 10'j

51
These 90 rocks were painted yellow and were put in lines across
the channel bed. On each of the three riffles three lines of rocks
were placed, the lines oriented across the channel orthogonal to the
flow direction. On each riffle the upstream line consisted of
I 0 ffo rocks of the D-. size. Downstream a distance of 1.5 m was a line
of 10 rocks of size D™. Further downstream a distance of 1.5 m
was a line of 10 rocks of size D„,.
Two staff gage plates were installed in each riffle, separated by
downchannel distances of 10 to 17 m. Simultaneous water surface
elevations observed at a pair of staff gages allowed water surface
slope to be computed.
Across each riffle a representative cross section was surveyed.
From it, relations of cross sectional area and mean depth to reading
on a' gage plate could be constructed. A few hundred meters down
stream is a gaging station with water stage recorder. Simultaneous
readings of water surface at the gage and at the riffle staff plates
allowed construction of discharge rating curves for each of the
three riffles. Thus for any discharge, values of mean depth and slope
were available at each riffle allowing an estimate of mean bed shear
stress as
x " yds
where T is shear stress in kg m 2, Y is the specific weight of o
water, 1000 kg m~3, and d is depth in m.

52
After each significant peak discharge the rock lines were
inspected. The distance downstream that any rock moved was recorded.
After several storms individual rocks were removed from their down
stream positions and replaced on the line where they had been origin
ally. Only in unusually high discharges were some rocks moved so
far that they could not be located.
ANALYSIS
In the winter of 1979-1980, 11 storms occurred, the discharges from
which were sufficiently high to require measurements of rock movement.
It was assumed that any rock movement could be attributed to the
largest peak discharge occurring between dates of rock inspection.
Thus the computation of the shear stress associated with each rock
movement was based on the highest discharge observed between inspec
tions. These discharge values varied from 0.23 m3 s 1 to
3.42 m3 s 1. The corresponding values of shear stress varied from
2.15 kg m~2 to 14.6 kg ra~2.
The local slope and depth differed among the three riffles at the
same discharge and therefore any given discharge produced a differ
ent value of bed stress at the cross sections. The Laboratory Riffle
No. 1 maintained a constant slope for different discharges and the
value of T thus varied directly as depth.
At the White Rock Riffle No. 2, slope decreased slightly with dis
charge so the values of shear are smaller than those at So. 1. At
the Willow Riffle No. 3, the computed slope decreased rapidly with
dischar:
relatic
that lc
It t:' i
moved 1 •
observi•
rocks ij i.
and sej
rocks
of th>
moved i
bee am'
I the fi
stresj
mi .?*

S3
discharge but the scatter of data was large and no reliable average
relation of slope to discharge could be constructed. Therefore, for
that location no values of shear stress are presented.
It would be expected that the number of rocks of a given size
moved by various flows would increase with bed shear stress. The
observations are presented in Fig. 1 as plots of percentage of
rocks moved as a function of bed shear stress for each flow event,
and separate graphs are shown for the small rocks (D,.), medium size
rocks (D,„) and large ones (DR/.) • On each graph is an arrow indi
cating the value of shear stress needed to initiate motion of the
rock sizes used; the values of stress were read from Fig. 6-11, in
Leopold, Wolman, and Miller (1964).
The figure shows that the shear stress on White Rock Riffle No. 2
exceeded that necessary for movement only on a few occasions and
as a result, the maximum number of rocks moved by any flow was only
10% of the total number, regardless of rock size. On the other
hand, Laboratory Riffle No. 1 experienced shear stress above the mini
mum necessary in nearly every hydrograph rise. Consequently move
ment of all three rock sizes occurred in about two thirds of all flow
events. However, the salient fact is that in only one instance, did
as many as 60% of the rocks move, and in all other cases 40% or less
of the rocks experienced motion. This small percentage of rocks
moved was characteristic despite the fact that the shear stress
became as large as 5 times the value necessary for movement. In
the flow where 60% of the D,- rocks moved, the experienced shear
stress was 2.9 times that needed for initial motion.
«
i?Hfi
r i**S?\ i'"'! : ^?m-
-^>'v
."- Ss'l ^Bt%gy#

•^^.^^4^\^%^^t»^y^^^-:jm^^^^m» *«tiar,t^^^*»J*W£.i.* lS5SHB*lS«K5:xr'i
54
The total number of movements out of the 90 rocks placed occurring
in the 11 flow events is summarized in Table 1, In each of the rif
fles the number of rocks moved decreased with increase of rock size
as one might expect because there were fewer flows providing large
values of shear stress than those providing small values.
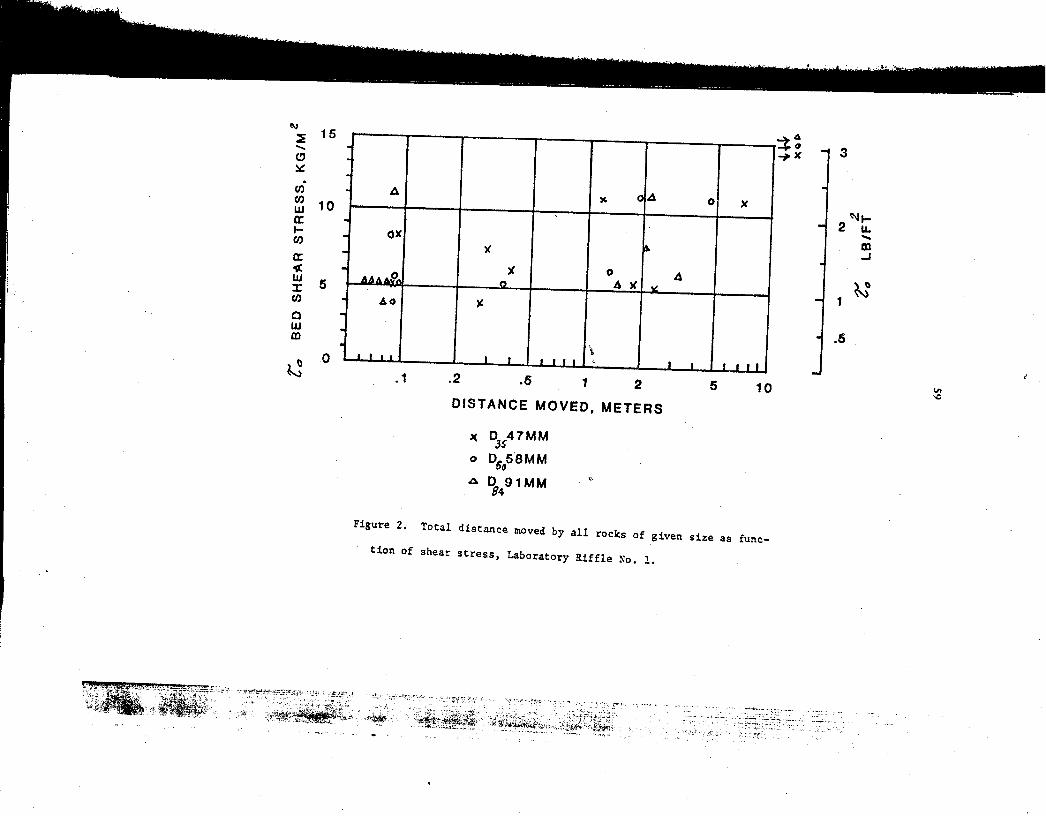
Regarding distance that rocks moved, Fig. 2 shows for each storm
at Laboratory Riffle No. 1 the total distance of all movements as a
function of shear stress. The total distance means the sum of move
ment distances of each rock of a given size class that moved. The
distance moved increased geometrically with increase of shear stress.
In the single flow event where shear stress exceeded 14 kg m 2, 7 of
the 90 rocks were swept' downstream so far that they disappeared and
distance moved is unknown.
Fig. 2 shows no obvious relation of distance moved to rock size
but when movement distances are summed for all 11 flow events, the
relation becomes more clear as shown in Table 2. The table shows
that the smaller rocks moved a somewhat longer distance than did the
large rocks. Yet except for the largest flow that moved some rocks
completely out of the riffle area, the distances moved were small,
usually less than 2 m even in flows where the shear stress was
several times the value needed for motion.
ot
ma '
pe
of
I * * ,i\+ #.r & * 5 i
VCJF

'•» -VV.cfc3l.' i-W-^XAW.,- .•oi^ *&-»X̂ '-:*»<*-.̂ - -.'-̂la*̂ ̂,;v~•,^.^^4v,.^;••^:5^^•^f^slA^^#-1•..^i^^>"
55
CONCLUDING COMMENT
Data on shear stress needed, for initial motion of a rock of given
size are usually compiled either for an isolated rock on a uniform
bed or the first motion of any rock in a bed composed of rocks of
the same size. The interaction of a rock with its neighbors, the
tendency for a smaller one to be protected from shear stress by
larger ones in the vicinity, makes the experimental values of required
stress to be minimal.
The present modest experiment suggests that even when shear
stress is several fold larger than the minimal value derived from
initial motion data mentioned above, only a small proportion of
available rocks will actually be set in motion. It therefore takes
repeated flows of competent shear stress to move all of the rocks
of a given size. If a gravel riffle is an expression of a kinematic
wave as Suggested by Langbein and Leopold (1968), complete replace
ment of rocks in a zone of concentration requires not one but a
series of flow events sufficiently energetic to move those rocks.
This general conclusion has been confirmed by the authors in
other marked rock experiments. On the East Fork River, Wyoming,
marked rocks placed on a gravel bar gradually disappeared over a
period of 4 to 5 yrs, despite annual flows sufficient to move rocks
of that size.
The average distance moved in a flow event of the present experi
ment was about 2 m, the rocks being of the order of size of 0.06 m.
This is a movement of 33 rock diameters, a general confirmation of
the estimate of H. Einstein that a single bedload movement is usually
of the order of 100 grain diameters.
•f̂ H*fe 7***
: . ^ ; ^

'"•'JtSteh...' r-. hsS****-,/- ' . . ^Oimr^iaJ&^Se*.
56
ACKNOWLEDGEMENTS
This work was carried on through the courtesy of Dr. Ruth Patrick
and Dr. Robin Van Note. We acknowledge with thanks the assistance of
Bernard Anderson in making the observations of rock movement.
REFERENCES
Langbein, W.B., and Leopold, L.B., 1968, River channel bars and
dunes—theory of kinematic waves: USGS Prof. Pap. 422-L.
Leopold, L.B., Emmett, W.W., and Myrick, R.M., 1966, Channel and
hillslope processes in a semiarid area, New Mexico: USGS Prof.
Pap. 352-G.
Leopold, L.B., Wolman, M.G., and Miller, J.P., 1964, Fluvial
processes in geomorphology: ^W.H. Freeman Co., San Francisco.
Table 1 .
Riffle nam;
Laboratory
White Rock
Willow Rif
Table 2. class in .
Riffle na
Laborator
White Roc
Willow Ri

57
Table 1. Total number of rock movements in 11 stora events.
Riffle name "35 (47 mm)
Laboratory Riffle 1 14
White Rock Riffle 2 3
Willow Riffle 3 19
-Size class-
(58 nan)
15
2
7
u84 (91 mm)
12
1
3 t
l i f t
. :• s .
Table 2. Total distance (m) moved by all rocks class in all 11 flow events.
Riffle name 35 (47 mm)
Laboratory Riffle 1 13
White Rock Riffle 2 11
Willow Riffle 3 37
-Size class-D50 (58 mm)
12
20
"84 (91 mm)
9
6
16
m

J* LB/FT5
Q Ul > O 2
O O cc u. O UJ O < z UJ o IT Ul a.
60
•40
20
.5 1 I — r — > — i • )
1
I
D j f 4 7MM
*
y 1
Y
o
on»o
» o
7 .; tfl 1 IxJ 10 20
I i r - i r i•— — I 1
J
D. 60MM
W
*
X
if
0 t XX
jaaHo-d-JULM bull ' lyi
X
n or
£ , BED SHEAR S T R E S S , K G / M
.6 1 2 3 - l 1
D 91MM
000*1 x W i i ivi
x x
* LAB RIFFLE
o WHITE ROCK RIFFLE
{ STRESS NEEDED FOR INITIAL MOTION
Figure 1. Percentage of rocks moved by flows having d i f fe ren t
values of bed shear s t r e s s . For each of three rock s i zes a
separate diagram i s presented. Ver t ica l arrow indica tes shear
s t r e s s value needed for i n i t i a l motion of tha t rock s i z e .
10 20
mm^mmmrmmm«K%*iw^aimao0,-.
*4 15
CO oA
* * s
"N>-
*»
CO* CO 111
cr f -co cr < ai x CO
a UJ m
tf
15
10
OX
-flAAA&i
LJL
AO
J-JUL
.1
x o
J L
A X
\ ' i i ' I
.2 .5 1 2
DISTANCE MOVED, METERS
X D 47MM
J L I I I
10
o 0^58MM A P, 91 MM
#4
Figure 2. Total distance moved by a l l rocks of given size as func
tion of shear s t ress , Laboratory Riffle No, 1.
2 u. «>» m - i
W
r^t^fmf'^ <kT ^St^fc^. JIE-itiwWu . " * * • - : . * * < •