4.8 HYDROLOGY AND WATER QUALITY - Siskiyou … Hydrology and... · occurrence of these rock...
30
4.8 Hydrology and Water Quality AES 4.8-1 Crystal Geyser Bottling Plant Project January 2017 Draft Environmental Impact Report 4.8 HYDROLOGY AND WATER QUALITY 4.8.1 INTRODUCTION This section addresses the potential for the Proposed Project to cause impacts related to hydrology and water quality. Following an overview of the environmental setting in Section 4.8.2 and the relevant regulatory setting in Section 4.8.3, project-related impacts and recommended mitigation measures are presented in Section 4.8.4 and Section 4.8.5, respectively. 4.8.2 ENVIRONMENTAL SETTING Groundwater A detailed discussion of the basic hydrologic and hydrogeologic conditions is included in the Hydrogeologic Evaluation (RCS, 2016) included as Appendix P. The following is a summary of that discussion. The project site lies south of the Shasta Valley Groundwater Basin (Basin No 1-4) in the North Coast Hydrologic Region, as defined by the California Department of Water Resources (DWR; DWR Bulletin 118 Online Update 2004). However, the project site is not located within a particular groundwater basin or subbasin, as delineated in the DWR Bulletin 118 (DWR, 2013a), but rather within volcanic rocks emplaced by the volcanism of Mt. Shasta that occurred within the last 10,000 years (RCS, 2016). The hydrogeologic system in the vicinity of the Plant generally consists of two rock types: overlying alluvial sediments and underlying volcanic rocks (groundwater occurs in both of these rock types). The occurrence of these rock materials is laterally and vertically variable due to the nature of their origin and the nature of the volcanic terrane. The availability and movement of groundwater in these rock materials surrounding the project site are based on the ability of the local earth materials at and beneath the site to store, transmit, and yield groundwater to wells for beneficial use. In the area of the project site, such groundwater can be controlled by the presence of pores in shallow alluvial sediments or by fractures in the much more widespread underlying volcanic rocks. In the region of the project site, the shallow alluvium is referred to as the “Upper Aquifer System” while the underlying volcanic rocks are known as the “Lower Aquifer System”, which is hydraulically connected to the aquifer from which Big Springs flows. Groundwater under the project site flows to the south, along Spring Hill and to the west, bending to the west-southwest, west of and south of Spring Hill. The groundwater underflow through the area of the project site converts to a total yearly volume of an estimated 873 acre-feet per year (AF/yr) of underflow (RCS, 2016). Groundwater recharge to the aquifer system is generally from infiltration of direct precipitation on the land surface and from infiltration of surface water runoff along local streams and creeks. Another basic source of recharge is from precipitation and/or the melting of the snowfields at the higher elevations of Mt. Shasta, to the east/northeast. A small amount of recharge would also occur from subsurface sewage disposal systems within the recharge area, where such systems are in direct contact with the alluvium. The recharge area for the aquifer system underlying the project site is estimated to be approximately 7.2 square miles (RCS, 2016).
-
Upload
vuongnguyet -
Category
Documents
-
view
214 -
download
0
Transcript of 4.8 HYDROLOGY AND WATER QUALITY - Siskiyou … Hydrology and... · occurrence of these rock...
4.8 Hydrology and Water Quality
AES 4.8-1 Crystal Geyser Bottling Plant Project January 2017 Draft Environmental Impact Report
4.8 HYDROLOGY AND WATER QUALITY
4.8.1 INTRODUCTION
This section addresses the potential for the Proposed Project to cause impacts related to hydrology and
water quality. Following an overview of the environmental setting in Section 4.8.2 and the relevant
regulatory setting in Section 4.8.3, project-related impacts and recommended mitigation measures are
presented in Section 4.8.4 and Section 4.8.5, respectively.
4.8.2 ENVIRONMENTAL SETTING
Groundwater
A detailed discussion of the basic hydrologic and hydrogeologic conditions is included in the
Hydrogeologic Evaluation (RCS, 2016) included as Appendix P. The following is a summary of that
discussion.
The project site lies south of the Shasta Valley Groundwater Basin (Basin No 1-4) in the North Coast
Hydrologic Region, as defined by the California Department of Water Resources (DWR; DWR Bulletin
118 Online Update 2004). However, the project site is not located within a particular groundwater basin
or subbasin, as delineated in the DWR Bulletin 118 (DWR, 2013a), but rather within volcanic rocks
emplaced by the volcanism of Mt. Shasta that occurred within the last 10,000 years (RCS, 2016).
The hydrogeologic system in the vicinity of the Plant generally consists of two rock types: overlying
alluvial sediments and underlying volcanic rocks (groundwater occurs in both of these rock types). The
occurrence of these rock materials is laterally and vertically variable due to the nature of their origin and
the nature of the volcanic terrane. The availability and movement of groundwater in these rock materials
surrounding the project site are based on the ability of the local earth materials at and beneath the site to
store, transmit, and yield groundwater to wells for beneficial use. In the area of the project site, such
groundwater can be controlled by the presence of pores in shallow alluvial sediments or by fractures in
the much more widespread underlying volcanic rocks. In the region of the project site, the shallow
alluvium is referred to as the “Upper Aquifer System” while the underlying volcanic rocks are known as
the “Lower Aquifer System”, which is hydraulically connected to the aquifer from which Big Springs flows.
Groundwater under the project site flows to the south, along Spring Hill and to the west, bending to the
west-southwest, west of and south of Spring Hill. The groundwater underflow through the area of the
project site converts to a total yearly volume of an estimated 873 acre-feet per year (AF/yr) of underflow
(RCS, 2016).
Groundwater recharge to the aquifer system is generally from infiltration of direct precipitation on the land
surface and from infiltration of surface water runoff along local streams and creeks. Another basic source
of recharge is from precipitation and/or the melting of the snowfields at the higher elevations of Mt.
Shasta, to the east/northeast. A small amount of recharge would also occur from subsurface sewage
disposal systems within the recharge area, where such systems are in direct contact with the alluvium.
The recharge area for the aquifer system underlying the project site is estimated to be approximately 7.2
square miles (RCS, 2016).

4.8 Hydrology and Water Quality
AES 4.8-2 Crystal Geyser Bottling Plant Project January 2017 Draft Environmental Impact Report
Groundwater Quality
Groundwater quality in the Sacramento River Basin is generally of good quality typically meeting
requirements for municipal and agricultural uses (USGS, 2000). Groundwater for urban and agricultural
uses tend to be below national drinking water guidelines with respect to pesticides, nitrates, and volatile
organic compounds (VOCs). Domestic supply wells tend to be the same, however, radon is generally
higher than health-related guidelines for drinking water (USGS, 2000). Total dissolved solids (TDS)
levels tend to be lower than 300 parts per million (ppm; USGS, 2000).
The Basin Plan has designated beneficial uses of groundwater resources in the region as municipal,
agricultural, and industrial process and service supply (CVRWQCB, 2016). Based on these beneficial
uses, the Basin Plan established groundwater limitations, as well as the general limitation of affecting
taste, imparting odor, or increasing toxicity that would create a nuisance or impair designated beneficial
uses.
Table 4.8-1 provides the California Maximum Contaminant Levels (MCLs), as well as the average of
constituent concentrations detected in samples collected from monitoring wells MW-1 and MW-2, which
are located within the project site directly adjacent to the on-site leach field, and from DEX-6 located in
the northern section of the project site (see Figure 4.8-1).
TABLE 4.8-1
GROUNDWATER CONSTITUENT CONCENTRATIONS
Constituent Unit CA MCL Shallow Groundwater
Concentration1 DEX-62
TDS mg/L 1,000 110 110
COD mg/L -- 3.5 (ND) 0
Na mg/L -- 7.6 11
Cl mg/L 250 0.8 1.5
SO4 mg/L 250 1.2 0.61
B mg/L -- 0.0059 0.025 (ND)
Notes: TDS = total dissolved solids; COD = chemical oxygen demand; Na = sodium; Cl = chlorine; SO4 = sulfate; B = boron; mg/l : milligrams per liter μg/L: micrograms per liter ND: Not detected.
CA MCL: California Maximum Contaminant Level for drinking water; MCLs for TDS, Cl, and SO4 are secondary standards. 1 - Based on average of constituent concentrations detected in samples collected from MW-1 and MW-2 on March 16, 2016 and June
22, 2016. COD in the monitoring wells was reported to be <7 mg/L, consequently, half of the reporting limit (3.5 mg/l) was chosen for the modeling input for COD.
2 - Constituent concentration detected in sample collected from DEX-6 in 2012. B concentration in DEX-6 was reported to be <0.050 mg/L, consequently, half of the reporting limit (0.025 mg/L) was chosen for modeling input for B. COD concentration was not analyzed and was assumed to be zero.
Source: Geosyntec, 2016.
On-site Groundwater Wells
Domestic Well and DEX-6 Well
Figure 4.8-1 shows the location of wells and piezometers, which measure pressure or depth of
groundwater, located within the project site. Of the wells located on the project site, there are two wells
that are currently equipped to pump water for use on the project site, the Domestic Well and the

!A!A
!A
!́!́!́!́
!A
!A!A
!A
!A!A
!A
!A
!A
Plant Building
ProductionWell DEX-6
Leach Field Area
Mount Shasta
2M05
Butte Ave
Oakway Rd
Shasta Ave
Rasb
erry
Way
Red Bud Dr
Redwood Rd
2M16
Fee Rd
Cr ispiRd
Nixon Rd
Carm
en D
r
OmShasta Path
Reginato R d
Morri
sSt
2M010
P-03 P-02P-04
MW-03
MW-02
MW-01(Lower)P-01
DOM-01
OB-3
OB-2OB-1
DEX-7
DEX-2
DEX-3BDEX-3A
Figure 4.8-1On-site Groundwater Wells
SOURCE: Richard C. Slade & Associates LLC, 2016; Geosyntec Consultants, 2014; AES, 1/5/2017 Crystal Geyser Draft Environmental Impact Report / 216537
LEGEND
0 250 500
Feet
!¢ÐNORTH
Project Site
!A Monitoring Well
!́ Piezometer!A Production Well

4.8 Hydrology and Water Quality
AES 4.8-4 Crystal Geyser Bottling Plant Project January 2017 Draft Environmental Impact Report
production well (DEX-6). The Domestic Well is perforated within both the Upper and Lower Aquifer
System while the DEX-6 is perforated in just the deeper Lower Aquifer System (RCS, 2016).
The static water level in the on-site Domestic Well is 85.6 feet below reference point (ft brp; top of the
casing), and in DEX-6 is 202.0 ft brp. Each of the pumping wells (DEX-6 and the on-site Domestic Well)
have been equipped with totalizing and instantaneous flow meters, and the pumped volumes from these
wells can be recorded by plant personnel. In addition, these two wells and the groundwater monitoring
wells have also been equipped with data logging systems that can continuously record water level
changes over time.
Figure 4.8-2 illustrates the seasonal and long-term changes in static water levels in DEX-6, in
comparison to the accumulated departure of monthly precipitation (rainfall and snowmelt combined)1. As
depicted on Figure 4.8-2, between 2004 and mid-2016, the response of water levels to the seasonal and
yearly changes in precipitation is generally correlated. That is, as precipitation changed seasonally and
yearly, water levels rose or declined, and followed the precipitation trends accordingly. Seasonal
fluctuations of the static water levels range between 0.5 and 1.0 foot. Given the relationship between the
groundwater levels and precipitation, the recent drought has contributed to a decline in static water levels
at DEX-6; however, the decrease is only approximately one foot from the time that the drought began in
2012.
Groundwater Monitoring Wells
In addition to the Domestic Well and DEX-6, multiple groundwater wells are located within the project site
that are not suitable for production. These wells were installed between 1987 and 1998 by either Coca-
Cola Dannon (CCDA Waters) or previous owners. Some of these wells, including DEX-7, were initially
drilled as potential production wells, but were subsequently not used; while others were installed
specifically for monitoring purposes, including MW-1, MW-2, and MW-3, which were used to monitor
water quality effects of the leach field under Waste Discharge Requirement (WDR) Order 5-01-233 (see
Section 3.2). Hydrogeological reports as well as groundwater elevation data based on some of these
wells have been used to analyze the hydrogeologic conditions of the project site, which are described
above (RCS, 2016). Details on the information used to determine the hydrogeologic conditions are
included in the Hydrogeologic Evaluation (RCS, 2016) included as Appendix P. As described therein,
the groundwater parameters which have been measured and/or monitored on site include:
Well production rate;
Chemical composition of pumped groundwater;
Transmissivity and storativity indicating unconfined groundwater conditions;
Water level drawdown impacts on adjacent wells;
Depth to groundwater and seasonal fluctuations;
Age of groundwater;
Groundwater gradient direction;
1 Accumulated departure of monthly precipitation shows the difference between the long-term average precipitation for a certain time period (in this case 1997 through 2016) and the accumulated monthly precipitation. The purpose of the information is to permit analysis of possible trends in the static water level of wells to trends in monthly precipitation patterns.

-3,500
-2,500
-1,500
-500
500
1,500
2,500
3,500
3,570
3,571
3,572
3,573
3,574
3,575
3,576
3,577
3,578
3,579
3,580
1997 1998 1999 2000 2001 2002 2003 2004 2005 2006 2007 2008 2009 2010 2011 2012 2013 2014 2015 2016 2017
Reported groundwaterelevation on January 21, 1998(SECOR, 1998). Ground surfaceelevation used as reference.
Plant in Operation (2001 - 2010)
New InstrumentInstalled
Gro
un
dw
ate
r E
levati
on
(ft
, m
sl)
Accu
mu
late
d D
ep
art
ure
of
Pre
cip
itati
on
(%
)
Year
Crystal Geyser Draft Environmental Impact Report / 216537
Figure 4.8-2Water Level Hydrograph for Well DEX-6
SOURCE: RCS, October 2016; AES, 11/8/2016
4.8 Hydrology and Water Quality
AES 4.8-6 Crystal Geyser Bottling Plant Project January 2017 Draft Environmental Impact Report
Groundwater flow rate; and
TDS.
The existing groundwater wells could be used to monitor these groundwater parameters in the future, if
necessary.
Surface Water
Regional
The project site lies within the Sacramento River Basin. The Sacramento River Basin covers
approximately 27,000 square miles (17.3 million acres) (Sacramento River Watershed Program, 2016).
The region includes all or large portions of Modoc, Siskiyou, Lassen, Shasta, Tehama, Glenn, Plumas,
Butte, Colusa, Sutter, Yuba, Sierra, Nevada, Placer, Sacramento, El Dorado, Yolo, Solano, Lake, and
Napa counties. Small areas of Alpine and Amador counties are also within the region. Geographically,
the region extends south from the Modoc Plateau and Cascade Range at the Oregon border to the
Sacramento-San Joaquin Delta (Delta). The Sacramento Valley, which forms the core of the region, is
bounded to the east by the crest of the Sierra Nevada and southern Cascades and to the west by the
crest of the Coast Range and Klamath Mountains. Other significant features include major river systems
such as the Sacramento River, the longest river system in California. Major tributaries of the Sacramento
River system include the Pit, Feather, and American rivers (Sacramento River Watershed Program,
2016).
The project site is located approximately 3 miles north of the Sacramento River and within the Northeast
Subregion of the Sacramento River Basin (Sacramento River Watershed Program, 2016), as shown on
Figure 4.8-3a and 4.8-3b. The Northeast Subregion tends to contain habitat for recreational sport
fishing; important habitat for big game, waterfowl, and other wildlife species; commercial timberland and
public land; and source waters for farms and cities throughout the Sacramento and San Joaquin valleys
(Sacramento River Watershed Program, 2016).
Local
The primary surface-water feature in the area of the project site is Big Springs Creek that emanates from
Big Springs, which is a system of multiple springs that issue from the base of the south-facing slope of
Spring Hill, approximately 0.4 miles west of the existing facility (Figure 3-2). The recharge area for these
springs includes the fractured andesite that is the source of water for the project site wells; however, the
actual area of groundwater supplying the flow to Big Springs is much greater than the cross sectional
area through which the on-site wells obtain their groundwater supply. As of May 2015, Big Springs had
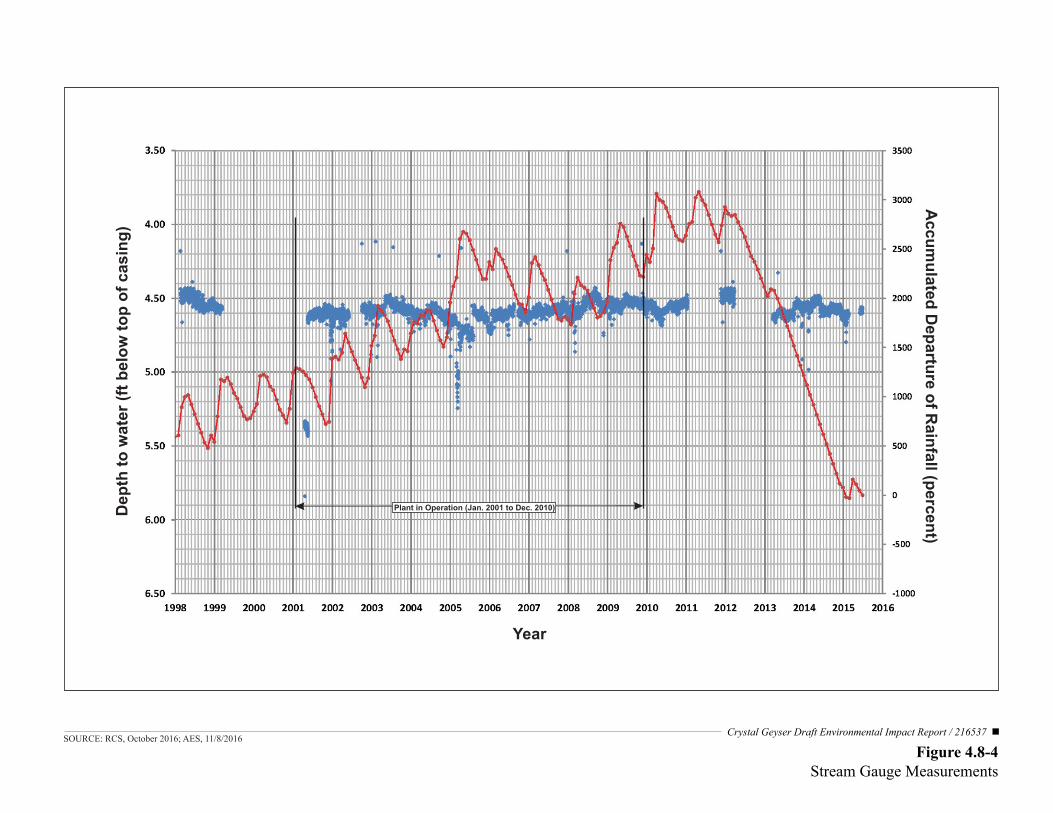
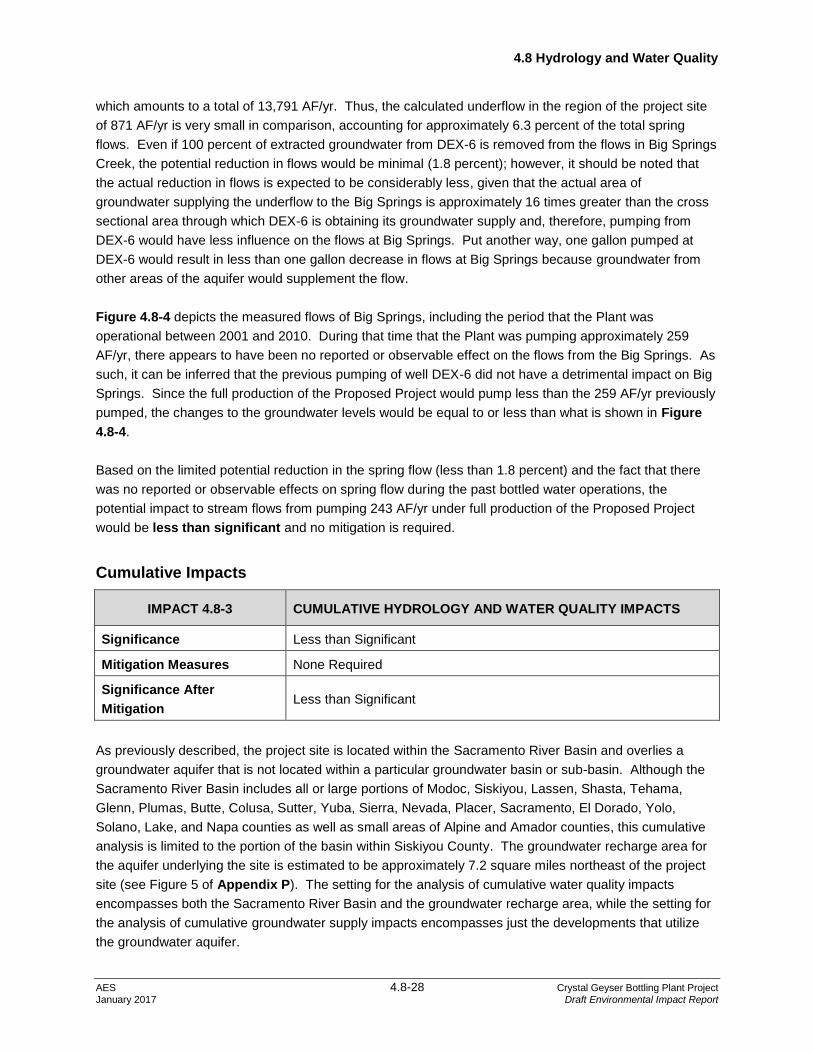
an estimated combined flow rate of approximately 8,550 gallons per minute (gpm). Figure 4.8-4 shows
the measured water levels in what is known as a “Stilling Well” in comparison to the accumulated
departure of monthly rainfall. The Stilling Well is a stream gage that is located at a culvert that runs
beneath Interstate Highway 5 (see Figures 4.8-3a and 4.8-3b). The depth of the water level in the
Stilling Well varies with the amount of the Big Springs flow over time. In other words, the greater the
springs flow, the higher the water surface in Big Springs Creek and water levels in the Stilling Well. As
depicted in Figure 4.8-4, the Big Springs has generally been flowing at a steady, constant rate with
relatively little response to local rainfall events or seasonal variations in rainfall and the stream flows. This

Project Site
Sacram
ento
River
Clair Eagle Lake
Lake Shasta
Lake Siskiyou
§̈¦5
§̈¦5
£¤97
UV3
UV89
UV299
Figure 4.8-3aWatershed Map
SOURCE: USGS National Hydrological Dataset, 2011; California Interagency Watershed Map of 1999, 2006; AES, 1/5/2017
Crystal Geyser Draft Environmental Impact Report / 216537
LEGEND
Modoc Co.Siskiyou Co.
Lassen Co.Shasta Co.Trinity Co.
Tehama Co.
Northeast Subregion
Sacramento RiverHydrologic Region
0 3 6
Miles
!¢ÐNORTH
Project SiteSacramento Headwaters Watershed
Northeast SubregionSacramento River Hydrologic Region

F
!A
Project Site
Lake Siskiyou
Sacrament o River
Mt. Shasta Fish Hatchery
Sacramento River
Wagon Creek
Big SpringsCreekWagon Creek
§̈¦5
Old Stage Rd
Lake St
Pine St
Lassen Ln
Ream
Ave
MountShasta BlvdChestnut St
Alpine St
Nor th Shore Rd
Cold Creek
Wagon C reek
Wagon C reek
Stilling Well
Figure 4.8-3bWatershed Map Detail
SOURCE: USGS National Hydrological Dataset, 2011; California Interagency Watershed Map of 1999, 2006; AES, 11/8/2016
Crystal Geyser Draft Environmental Impact Report / 216537
LEGEND
0 1,600 3,200
Feet
!¢ÐNORTH
Project SiteF Mt. Shasta Fish Hatchery
!A Stilling Well
USGS Blueline StreamsSacramento Headwaters WatershedNortheast Subregion
Sacramento HeadwatersWatershed
Dep
th to
wat
er (f
t bel
ow to
p of
cas
ing)
Year
Plant in Operation (Jan. 2001 to Dec. 2010)
Accum
ulated Departure of R
ainfall (percent)
Crystal Geyser Draft Environmental Impact Report / 216537
Figure 4.8-4Stream Gauge Measurements
SOURCE: RCS, October 2016; AES, 11/8/2016

4.8 Hydrology and Water Quality
AES 4.8-10 Crystal Geyser Bottling Plant Project January 2017 Draft Environmental Impact Report
indicates that the primary source of the Big Springs flow is regional in nature and primarily influenced by
the precipitation on or near the summit of Mount Shasta.
As shown on Figures 4.8-3a and 4.8-3b, Big Springs Creek flows south, where it joins with Wagon
Creek. Wagon Creek feeds into Lake Siskiyou, which drains into the Sacramento River, south of the
project site. Wagon Creek runs north to south parallel to Big Springs Creek approximately 1.4 miles west
of the project site and west of Big Springs Creek. Streamflows are diverted from Big Springs Creek for
agricultural use and for the Mt. Shasta Fish Hatchery, which is located approximately 1.5 miles south of
Big Springs. The Mt. Shasta Fish Hatchery typically diverts approximately 15 cubic feet per second (cfs;
Jones, 2016), which represents most of the creek's total flow. This flow is then re-introduced to the creek
downstream of Mt. Shasta Fish Hatchery. Mt. Shasta Fish Hatchery utilizes solids treatment, and plans to
utilize additional treatment components, to ensure high water quality (DWR, 2016).
Additionally Cold Spring is the primary source of water for the City of Mt. Shasta (City) and is located
approximately two miles southeast of the project site. Cold Spring is not hydraulically connected to Big
Springs (CVRWQCB, 2001).
Flooding
Regional flooding in the area is associated with stormwater overflow from local waterways, including
creeks and unnamed tributaries. The Siskiyou County Flood Control and Water Conservation District
ensures that flooding is minimized, particularly around Lake Siskiyou. The District allows winter
drawdown of Lake Siskiyou to provide flood control for downstream residents (County of Siskiyou,
2016b). The Box Canyon Dam is the closest dam to the project site, located on Lake Siskiyou. The Box
Canyon Dam was constructed in 1970 for flood control, and, between August 1, 2016, and September 30,
2016, released a constant 45 cfs of water into the Sacramento River (County of Siskiyou, 2016c). As of
September 2016, the water level of Lake Siskiyou is below the maximum capacity, and below the winter
lake level setting (County of Siskiyou, 2016d).
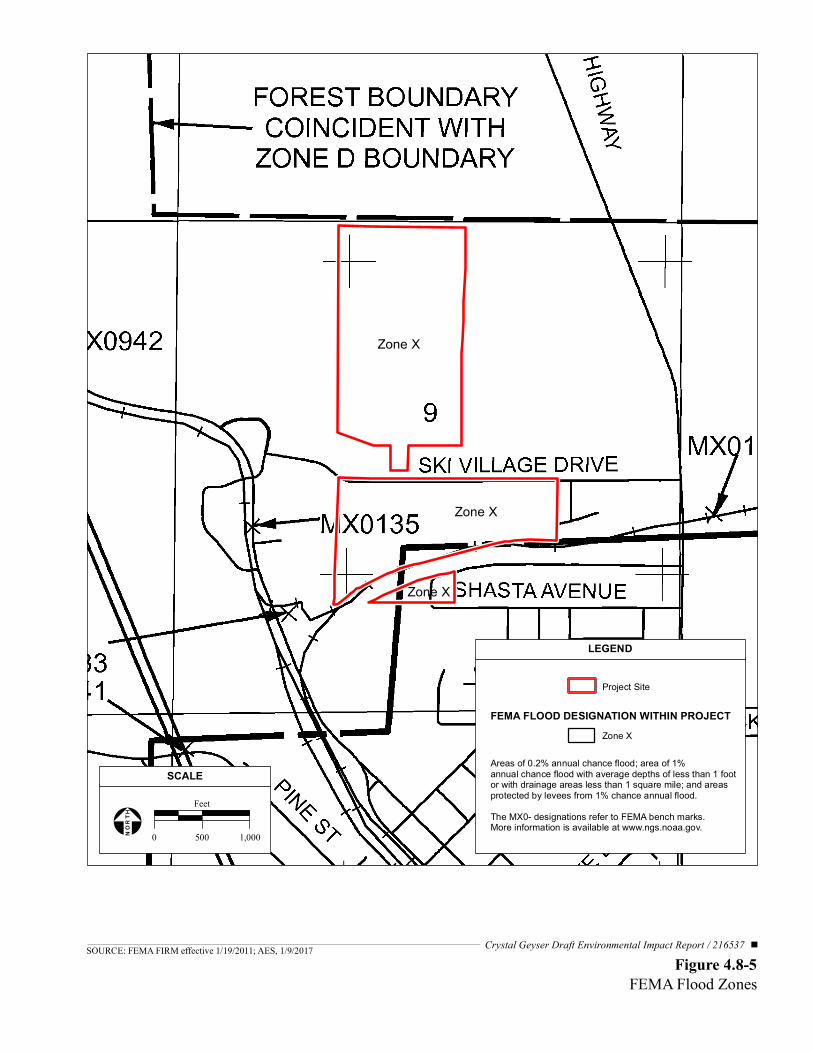
The Box Canyon Dam reduces flooding in the Sacramento River by controlling the release of water from
Lake Siskiyou. Flooding upstream of the dam would only occur during significant rainfall events. The
project site is located in an area designated Zone X on the Federal Emergency Management Agency
(FEMA) Flood Insurance Rate Map (FIRM) number 06093C3025D effective January 19, 2011, shown in
Figure 4.8-5. The MX0- designations shown in Figure 4.8-5 refer to FEMA bench marks. More
information is available at www.ngs.noaa.gov. Zone X is defined as “areas determined to be outside the
0.2 percent annual chance floodplain,” (FEMA, 2011). The closest floodplain surrounds Lake Siskiyou,
southwest of the project site. The project site lies outside of the floodplain.
Drainage and Stormwater
Regionally, drainage is provided by the upper Sacramento River watershed which discharges south into
Lake Shasta. Stormwater flows from Ski Village Drive, as well as the project site itself, and drains
through a series of stormwater collection lines into a detention basin located on the southwestern portion
of the central project site. The detention basin empties via a 5-inch line into the Field Street ditch to the
west of Mt. Shasta Boulevard along the McCloud Railway Company rail line, eventually draining into
North Fork Cold Creek, and finally Lake Siskiyou (CVRWQCB, 2001).
Zone X
Zone X
Zone X
Figure 4.8-5FEMA Flood Zones
SOURCE: FEMA FIRM effective 1/19/2011; AES, 1/9/2017 Crystal Geyser Draft Environmental Impact Report / 216537
SCALE
0 500 1,000
Feet
!¢ÐNORTH
Project Site
LEGEND
Areas of 0.2% annual chance flood; area of 1% annual chance flood with average depths of less than 1 footor with drainage areas less than 1 square mile; and areas protected by levees from 1% chance annual flood.The MX0- designations refer to FEMA bench marks.More information is available at www.ngs.noaa.gov.
FEMA FLOOD DESIGNATION WITHIN PROJECTZone X
4.8 Hydrology and Water Quality
AES 4.8-12 Crystal Geyser Bottling Plant Project January 2017 Draft Environmental Impact Report
Surface Water Quality
The upper Sacramento River watershed provides water for a variety of uses, including domestic,
industrial, and recreational water supply, as well as providing important fish and wildlife habitat. Water
quality in the upper Sacramento River watershed and its tributaries is generally very good (Sacramento
River Watershed Program, 2016). The upper Sacramento River or tributaries north of the Keswick Dam
is not listed as impaired (CVRWQCB, 2013).
Beneficial uses of sources to the Box Canyon Reservoir (Lake Siskiyou), as indicated in the Central
Valley Regional Water Quality Control Board’s (CVRWQCB) Water Quality Control Plan (Basin Plan),
include agriculture, recreation, freshwater habitat for cold species, and wildlife habitat (CVRWQCB,
2016).
4.8.3 REGULATORY CONTEXT
Federal
Clean Water Act (CWA)
The Clean Water Act (CWA; 33 United States Code [USC] § 1251-1376), as amended by the Water
Quality Act of 1987, is the major federal legislation governing water quality. The objective of the CWA is
“to restore and maintain the chemical, physical, and biological integrity of the Nation’s waters” (33 USC
1251, Section 101[a]). Important sections of the Act are as follows:
Sections 303 and 304 provide for water quality standards, criteria, and guidelines.
Section 401 (Water Quality Certification) requires an applicant for any federal permit that
proposes an activity, which may result in a discharge to waters of the United States to obtain
certification from the state that the discharge will comply with other provisions of the Act.
Section 402 establishes the National Pollutant Discharge Elimination System (NPDES), a
permitting system for the discharge of any pollutant (except for dredged or fill material) into
waters of the United States. This permit program is administered by the State Water Resources
Control Board (SWRCB) and is discussed in detail below.
Section 404 establishes a permit program for the discharge of dredged or fill material into waters
of the United States. This permit program is jointly administered by the United States Army
Corps of Engineers (USACE) and the United States Environmental Protection Agency (USEPA).
Federal Anti-degradation Policy
The federal anti-degradation policy is designed to protect water quality and water resources. The policy
directs states to adopt a statewide policy that includes the following primary provisions: (1) existing
instream uses and the water quality necessary to protect those uses shall be maintained and protected;
(2) where existing water quality is better than necessary to support fishing and swimming conditions, that
quality shall be maintained and protected unless the state finds that allowing lower water quality is
necessary for important local economic or social development; and (3) where high-quality waters
constitute an outstanding national resource, such as waters of national and state parks, wildlife refuges,

4.8 Hydrology and Water Quality
AES 4.8-13 Crystal Geyser Bottling Plant Project January 2017 Draft Environmental Impact Report
and waters of exceptional recreational or ecological significance, that water quality shall be maintained
and protected (40 Code of Federal Regulations [CFR] 131.12[a]).
Safe Drinking Water Act (SDWA)
Under the Safe Drinking Water Act (SDWA; Public Law 93-523), passed in 1974 and amended in 1996,
USEPA regulates contaminants of concern to domestic water supply. Contaminants of concern relevant
to domestic water supply are defined as those that pose a public health threat or that alter the aesthetic
acceptability of the water. These types of contaminants are regulated by USEPA primary and secondary
MCLs. MCLs and the process for setting these standards are reviewed every six years.
Federal Emergency Management Agency
Siskiyou County (County) is a participant in the National Flood Insurance Program (NFIP), a Federal
program administered by the FEMA. Participants in the NFIP must satisfy certain mandated floodplain
management criteria. The National Flood Insurance Act of 1968 adopted a desired level of protection that
would protect developments from floodwater damage associated with an Intermediate Regional Flood
(IRF), a flood which is defined as a flood having an average frequency of occurrence on the order of once
in 100 years, although such a flood may occur in any given year.
State
Porter-Cologne Water Quality Control Act
The Porter-Cologne Water Quality Control Act (California Water Code Section 13000 et seq.) provides the
basis for water quality regulation within California. The Act requires a “Report of Waste Discharge” for
any discharge of waste (liquid, solid, or otherwise) to land or surface waters that may impair a beneficial
use of surface or groundwater of the state. The Regional Water Quality Control Board (RWQCB)
implements WDRs identified in the Report.
State Water Resources Control Board and Regional Water Quality Control Board
The SWRCB administers water rights, water pollution control, and water quality functions throughout the
state, while the RWQCBs conduct planning, permitting, and enforcement activities. The Proposed Project
area lies within the jurisdiction of the CVRWQCB.
The CVRWQCB uses planning, permitting, and enforcement authorities to meet this responsibility, and
has adopted the Fourth Edition of the Water Quality Control Plan (Basin Plan) for the Sacramento River
and San Joaquin River Basins (CVRWQCB, 2016) to implement plans, policies, and provisions for water
quality management. The Basin Plan was prepared in compliance with the CWA and the Porter-Cologne
Water Quality Control Act. The Basin Plan establishes beneficial uses for major surface waters and their
tributaries, water quality objectives that are intended to protect the beneficial uses, and implementation
programs to meet stated objectives.

4.8 Hydrology and Water Quality
AES 4.8-14 Crystal Geyser Bottling Plant Project January 2017 Draft Environmental Impact Report
National Pollution Discharge Elimination System Program
Construction Activity
The NPDES program regulates municipal and industrial stormwater discharges under the requirements of
the CWA. California is authorized to implement a state industrial stormwater discharge permitting
program, with the SWRCB as the permitting agency.
Projects must comply with the requirements of the most recent version of the NPDES permit for
Discharges of Stormwater Runoff associated with Construction Activity (Order No. 99-08-DWQ). The
General Construction permit was updated and became effective on July 17, 2012 (Construction General
Permit, Order No. 2009-0009-DWQ). This permit regulates discharges from construction sites that disturb
one acre or more of total land area. By law, all stormwater discharges associated with construction
activity where clearing, grading, and excavation results in soil disturbance must comply with the
provisions of this NPDES permit. The permitting process requires the development and implementation
of an effective Stormwater Pollution Prevention Plan (SWPPP). Crystal Geyser Water Company (CGWC)
must submit a Notice of Intent (NOI) to the SWRCB to be covered by a NPDES permit and prepare the
SWPPP prior to the beginning of construction. The SWPPP must include Best Management Practices
(BMPs) to reduce pollutants and any more stringent controls necessary to meet water quality standards.
Dischargers must also comply with water quality objectives as defined in the Basin Plan. If Basin Plan
objectives are exceeded, corrective measures would be required.
Waste Discharge Requirements Program
In general, the WDR Program (sometimes also referred to as the "Non Chapter 15 [Non 15] Program")
regulates point discharges that are exempt pursuant to Subsection 20090 of Title 27 and not subject to
the Federal Water Pollution Control Act. Exemptions from Title 27 may be granted for nine categories of
discharges (e.g., sewage, wastewater, etc.) that meet, and continue to meet, the preconditions listed for
each specific exemption. The scope of the WDRs Program also includes the discharge of wastes
classified as inert, pursuant to section 20230 of Title 27. Several SWRCB programs are administered
under the WDRs Program, including the Sanitary Sewer Order and recycled water programs (CalEPA,
2012).
The CVRWQCB typically requires a WDR permit for any facility or person discharging or proposing to
discharge waste that could affect the quality of the waters of the State, other than into a community sewer
system. Those discharging pollutants (or proposing to discharge pollutants) into surface waters, must
obtain an NPDES permit from the CVRWQCB. The NPDES permit serves as the WDR permit. For other
types of discharges, such as those affecting groundwater or in a diffused manner (e.g., erosion from soil
disturbance or waste discharges to land) a Report of Waste Discharge must be filed with the CVRWQCB
in order to obtain a WDR permit (CalEPA, 2012).
State Nondegradation Policy
In 1968, as required under the federal antidegradation policy described previously, the State Water Board
adopted a nondegradation policy aimed at maintaining high quality for waters in California. The
nondegradation policy states that the disposal of wastes into state waters shall be regulated to achieve
4.8 Hydrology and Water Quality
AES 4.8-15 Crystal Geyser Bottling Plant Project January 2017 Draft Environmental Impact Report
the highest water quality consistent with maximum benefit to the people of the state and to promote the
peace, health, safety, and welfare of the people of the state. The policy provides as follows:
a. Where the existing quality of water is better than required under existing water quality control
plans, such quality would be maintained until it has been demonstrated that any change would be
consistent with maximum benefit to the people of the state and would not unreasonably affect
present and anticipated beneficial uses of such water.
b. Any activity which produces waste or increases the volume or concentration of waste and which
discharges to existing high-quality waters would be required to meet waste discharge
requirements which would ensure (1) pollution or nuisance would not occur and (2) the highest
water quality consistent with the maximum benefit to the people of the state would be maintained
(SWRCB Resolution No. 68-16).
California Toxics Rule (CTR)
In May 2000, the SWRCB adopted and USEPA approved the California Toxics Rule (CTR), which
establishes numeric water quality criteria for priority pollutant trace metals and organic compounds. The
SWRCB subsequently adopted its State Implementation Plan (SIP) of Toxics Standards for Inland
Surface Waters, Enclosed Bays, and Estuaries. The SIP outlines procedures for NPDES permitting for
toxic pollutant objectives that have been adopted in Basin Plans and in the CTR.
Sustainable Groundwater Management Act (SGMA)
The intent of the Sustainable Groundwater Management Act (SGMA; Water Code §10720 et seq.) is to
“enhance local management of groundwater consistent with rights to use or store groundwater… [and] to
preserve the security of water rights in the state to the greatest extent possible consistent with the
sustainable management of groundwater.” The SGMA states that “any local agency or combination of
local agencies overlying a groundwater basin may elect to be a groundwater sustainability agency for that
basin” (Water Code §10723). A groundwater sustainability agency will be formed within each
groundwater basin to prepare and implement a plan for long-term groundwater sustainability. The project
site is not within a defined basin subject to SGMA.
Local
County of Siskiyou Conservation Element
The County of Siskiyou General Plan was adopted in 1980 and was last amended in 1997. The
conservation plan was authored in June of 1973. The General Plan serves as the overall guiding policy
document for conservation within the County. The General Plan goals and policies related to water
resources are included below:
Conservation Element
Objective H To preserve the quality of the existing water supply in Siskiyou County and adequately
plan for the expansion and retention of valuable water supplies for future generations and
to provide for a comprehensive program for sustained multiple use of watershed lands

4.8 Hydrology and Water Quality
AES 4.8-16 Crystal Geyser Bottling Plant Project January 2017 Draft Environmental Impact Report
through reduction of fire hazards, erosion control, and typeconversion of vegetation
where desirable and feasible.
Policy H-1 Provide for the safety and welfare of the residents of the county by flood control efforts on
a regional scale.
Policy H-3 Every precaution must be maintained to eliminate the danger of any pollution to the
streams and lakes as well as recharge areas through human and industrial waste and
agricultural run-off.
Policy H-6 Utilize latest scientific techniques towards reclamation and recycling of wastewater.
Policy H-7 Use of watershed or recharge lands for urban or second home purposes should be
permitted only under rigid controls.
City of Mt. Shasta General Plan
Although the project site is not within the City’s jurisdiction, relevant local goals and polices are listed
below as they relate to adjacent and cumulative development in the City.
Conservation Element
The following General Plan guiding and implementation policies associated with hydrological resources
are applicable to the Proposed Project.
Goal OC-10 Protect the drinking water of Mt. Shasta residents.
Policy OC-10.1 Maintain a safe drinking water supply.
Implementation Measure OC-10.1(a): Comply with drinking water standards.
Policy OC-10.2 Protect the City’s drinking water sources from contamination.
Implementation Measure OC-10.2(a): When reviewing development proposals for
projects with the potential to contaminate drinking water supplies, ensure that the
environmental and project review process incorporates appropriate measure to avoid
drinking water contamination.
Implementation Measure OC-10.2(b): Enforce provisions of the building code requiring
anti-siphon devices on nonresidential structures to prevent backflow of contaminated
water into the drinking water supply.

4.8 Hydrology and Water Quality
AES 4.8-17 Crystal Geyser Bottling Plant Project January 2017 Draft Environmental Impact Report
4.8.4 IMPACTS
Method of Analysis
As discussed in Section 4.0, to provide a conservative analysis, this Environmental Impact Report (EIR)
evaluates impacts resulting from all modifications undertaken and proposed by CGWC to operate the
proposed bottling facilities; therefore, the environmental impacts of construction activities occurring prior
to the publication of the NOP in June 2016, proposed future construction activities, and operation are
evaluated below. The environmental setting as it existed in 2013, when CGWC purchased the property,
forms the baseline from which impacts associated with prior construction activities are measured and
evaluated, and the existing environmental setting (2016) forms the baseline from which proposed
construction activities and operation is measured. Because the facilities previously installed by CGWC
were installed within paved, graveled, or landscaped areas of the project site, and little to no growth has
occurred in the project area, the environmental setting related to hydrology and water quality areas has
not changed appreciably between 2013 and June 2016 and in these cases, no distinction is drawn in the
text.
An examination of the project site, project components, and published information regarding the water
resources in the project area was conducted to determine impacts to hydrology and water quality. The
analysis was based in part on information from the Hydrogeologic Evaluation (RCS, 2016; Appendix P)
and Technical Memorandum regarding effluent-groundwater mixing simulations for Wastewater
Treatment Option 3 (Geosyntec, 2016; Appendix H). The analysis addresses impacts under all four
options for wastewater treatment; where the impacts of all options would be the same, no distinction
between the options is drawn in the text.
The potential for impacts to hydrology and water quality resulting from off-site sewer improvements in
South Old Stage Road is addressed below. The potential for environmental impacts from the off-site
improvements described in Section 3.7 that would serve the Proposed Project, but would occur with or
without the Proposed Project, is analyzed in Section 4.12, Utilities. Environmental effects from the
planned City of Mt. Shasta State-Mandated Wastewater Treatment and Outfall Improvement Project are
discussed in Section 4.12.1, Impact 4.12-4. Environmental effects from the proposed Lassen Substation
Project are discussed in Section 4.12.3, Impact 4.12-7.
Thresholds of Significance
Criteria for determining the significance of impacts to hydrology and water quality have been developed
based on Appendix G of the California Environmental Quality Act’s (CEQA) Guidelines. Impacts to
hydrology and water quality would be considered significant if the Proposed Project would:
violate any water quality standards or waste discharge requirements;
substantially deplete groundwater supplies or interfere substantially with groundwater
recharge such that there would be a net deficit in aquifer volume or a lowering of the local
groundwater table;
4.8 Hydrology and Water Quality
AES 4.8-18 Crystal Geyser Bottling Plant Project January 2017 Draft Environmental Impact Report
substantially alter the existing drainage pattern of the site or area, including through the
alteration of the course of a stream or river, in a manner that would result in substantial
pollution on or off site;
substantially alter the existing drainage pattern of the site or area, including through the
alteration of the course of a stream or river, or substantially increase the rate or amount of
surface runoff in a manner that would result in flooding on or off site;
create or contribute runoff water that would exceed the capacity of existing or planned
stormwater drainage systems or provide substantial additional sources of polluted runoff;
otherwise substantially degrade water quality;
place housing within a 100-year flood hazard area as mapped on a federal Flood Hazard
Boundary or Flood Insurance Rate Map or other flood hazard delineation map;
place within a 100-year flood hazard area structures that would impede or redirect flood
flows; or
expose people or structures to a significant risk of loss, injury, or death involving flooding,
including flooding as a result of the failure of a levee or dam or inundation by seiche, tsunami,
or mudflow.
Effects Found Not to be Significant
The Proposed Project would not substantially alter the existing drainage pattern of the project site or
result in a significant increase in impervious surfaces that would create or contribute runoff water that
would exceed the capacity of existing or planned stormwater drainage systems or provide substantial
additional sources of polluted runoff. Additionally, the project site is outside the 100 year floodplain
(FEMA, 2011) and would not expose people or structures to a significant risk of loss, injury, or death
involving flooding. Therefore, as discussed in the Initial Study (Appendix C), these effects are not
discussed further in this EIR.
Project Impacts
IMPACT 4.8-1 VIOLATE ANY WATER QUALITY STANDARDS OR WASTE
DISCHARGE REQUIREMENTS
Significance Less than Significant
Mitigation Measures None Required
Significance After
Mitigation Less than Significant
The potential for the Proposed Project and off-site sewer improvements in South Old Stage Road to result
in impacts to water quality during construction as a result of increased erosion or use of hazardous
materials on site is addressed in Impacts 4.5-2 and 4.7-1. As discussed therein, this would be a less-
than-significant impact with the implementation of Mitigation Measures 4.5-1 and 4-7.1. The following

4.8 Hydrology and Water Quality
AES 4.8-19 Crystal Geyser Bottling Plant Project January 2017 Draft Environmental Impact Report
is a discussion of the potential impacts to water quality from the operation of the Proposed Project under
each of the wastewater treatment options.
All Options - Domestic Wastewater
The domestic wastewater generated by the Proposed Project from faucets, drinking fountains, sinks,
bathrooms, etc., would continue to be discharged into the City’s sewer system and treated at the City’s
wastewater treatment plant (WWTP) under each of the wastewater treatment options described in
Section 3.5.8.3. As described in Section 4.12.1.1, discharges from the City’s WWTP are currently
regulated by WDR Order No. R5-2012-086 and Time Schedule Order No. R5-2012-0087 issued by the
CVRWQCB. The requirements include limitations and provisions for wastewater discharge that were
established pursuant to the CWA and the water quality objectives set forth in the Basin Plan, including
limits on ammonia, copper, zinc, biochemical oxygen demand, total suspended solids, and pH levels.
Compliance with the WDR would ensure that impacts to water quality from domestic wastewater
generated by the Proposed Project would be less than significant and no mitigation is required.
The potential for the City’s WWTP to exceed wastewater treatment requirements of the CVRWQCB as a
result of the treatment of domestic wastewater generated by the Proposed Project is analyzed in Section
4.12.1, Impact 4.12-1. As described therein, the domestic wastewater generated by the Proposed
Project would not contain harmful levels of toxins that are regulated by the CVRWQCB (such as large
quantities of pesticides, herbicides, oil, grease, and other chemicals that are typical and require separate
permitting for agricultural and industrial uses) and all effluent would comply with the wastewater treatment
standards of the CVRWQCB. This analysis concludes that the Proposed Project would result in less-
than-significant impacts related to the wastewater treatment requirements of the CVRWQCB and no
mitigation is required. Therefore potential impacts to water quality from the treatment and disposal of
domestic wastewater generated by the Proposed Project under each of the wastewater treatment options
is would be less than significant and no mitigation is required.
Options 1 and 2 - Industrial Wastewater Treated and Discharged from the City’s WWTP
Industrial process and rinse wastewater would be discharged into the City’s sewer system under
Wastewater Treatment Option 1 and industrial process wastewater would be discharged into the City’s
sewer system under Wastewater Treatment Option 2 (Section 3.5.8.3). As discussed above, the City’s
WWTP compliance with the WDR and Time Schedule Order would ensure that impacts to water quality
would be less than significant.
The potential for the City’s WWTP to exceed wastewater treatment requirements of the CVRWQCB as a
result of the treatment of industrial wastewater generated by the Proposed Project is analyzed in Section
4.12.1, Impact 4.12-1. As discussed therein, the City has issued a draft of the Permit for Industrial
Wastewater Discharge for the Proposed Project (Appendix I) which, as required by the City’s Code,
includes conditions and sampling and testing protocols for the Proposed Project that are designed to
ensure that the City’s WWTP will be able to comply with the requirements set forth in the WDR Order and
Time Schedule Order issued to the City by the CVRWQCB. The analysis concludes that compliance with
the Permit for Industrial Wastewater Discharge, once issued by the City, would ensure that the Proposed
Project would result in less-than-significant impacts related to the wastewater treatment requirements of
the CVRWQCB and no mitigation is required. Therefore potential impacts to water quality from the

4.8 Hydrology and Water Quality
AES 4.8-20 Crystal Geyser Bottling Plant Project January 2017 Draft Environmental Impact Report
treatment and disposal of industrial wastewater generated by the Proposed Project under Wastewater
Treatment Options 1 and 2 would be less than significant and no mitigation is required.
Options 2, 3, and 4 - Industrial Wastewater discharged on the Project Site
As described in Section 3.5.8.3, industrial rinse wastewater would be disposed of on site under
Wastewater Treatment Option 2 and industrial process and rinse wastewater would be disposed of on
site under Wastewater Treatment Options 3 and 4.
Wastewater Treatment Option 2
Under Wastewater Treatment Option 2, industrial rinse water would be discharged into the Plant’s on-site
leach field located south of the plant building as currently permitted by the CVRWQCB under WDR Order
5-01-233. The potential impacts of discharging rinse water through the on-site leach field were previously
addressed in the IS/MND for the On-site Leach Field and Facility Expansion Project for the Dannon
Natural Spring Water Bottling Facility (Dannon IS/MND), which is incorporated into this EIR by reference
(see Section 1.4).
As concluded within the Dannon IS/MND and summarized in Table 4.8-2, aside from a small amount of
inert dust, rinse water from the bottling process is substantially the same quality as water withdrawn from
the aquifer by the on-site production well (DEX-6).
TABLE 4.8-2
WATER QUALITY ANALYSIS SUMMARY DATA
Analyte Raw Water
Result Rinsewater
Result Units
Minimum Detection Limit
Drinking Water Standards
Silver, total ND ND mg/L 0.01 0.01
Arsenic, total 1.2 1.2 µg/L 1.0 10
Beryllium, total ND ND mg/L 0.001 0.004
Cadmium, total ND ND mg/L 0.005 0.005
Chemical Oxygen Demand ND ND mg/L 5.0
Chromium, total ND ND mg/L 0.01 0.1
Copper, total ND ND mg/L 0.01 1.3
Specific conductance 93 95 µmho/cm 4.0
Mercury ND ND µg/L 0.2 2.0
Nickel, total ND ND mg/L 0.02
Lead, total ND ND µg/L 0.5 15.0
Lab pH 7.2 7.2 units 0.001
Antimony, total ND ND µg/L 1.0 6.0
Selenium, total ND ND µg/L 5.0 50.0
Total dissolved solid 130 100 mg/L 10.0
Thallium, total ND ND µg/L 1.0 2.0
Zinc, total ND ND mg/L 0.02
Notes: ND = not detectable; µg/L= micrograms per liter; µgmho/cm = micromhos per centimeter Source: CVRWQCB, 2001; USEPA, 2016a.
4.8 Hydrology and Water Quality
AES 4.8-21 Crystal Geyser Bottling Plant Project January 2017 Draft Environmental Impact Report
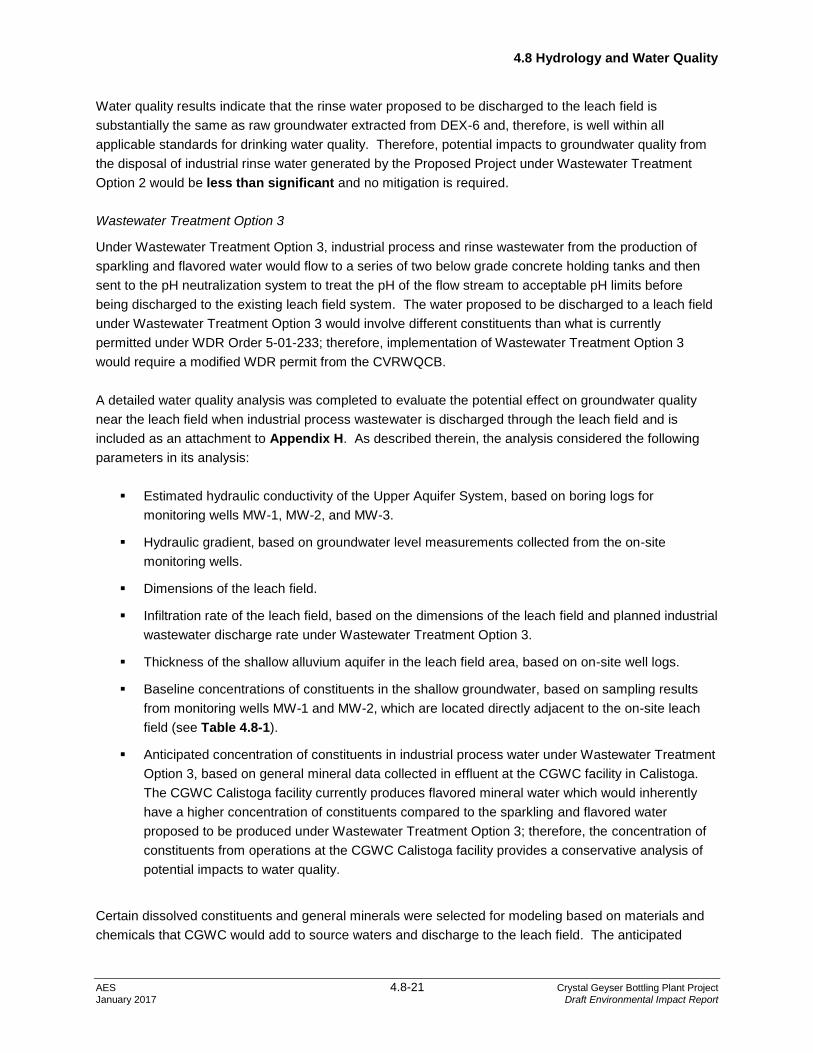
Water quality results indicate that the rinse water proposed to be discharged to the leach field is
substantially the same as raw groundwater extracted from DEX-6 and, therefore, is well within all
applicable standards for drinking water quality. Therefore, potential impacts to groundwater quality from
the disposal of industrial rinse water generated by the Proposed Project under Wastewater Treatment
Option 2 would be less than significant and no mitigation is required.
Wastewater Treatment Option 3
Under Wastewater Treatment Option 3, industrial process and rinse wastewater from the production of
sparkling and flavored water would flow to a series of two below grade concrete holding tanks and then
sent to the pH neutralization system to treat the pH of the flow stream to acceptable pH limits before
being discharged to the existing leach field system. The water proposed to be discharged to a leach field
under Wastewater Treatment Option 3 would involve different constituents than what is currently
permitted under WDR Order 5-01-233; therefore, implementation of Wastewater Treatment Option 3
would require a modified WDR permit from the CVRWQCB.
A detailed water quality analysis was completed to evaluate the potential effect on groundwater quality
near the leach field when industrial process wastewater is discharged through the leach field and is
included as an attachment to Appendix H. As described therein, the analysis considered the following
parameters in its analysis:
Estimated hydraulic conductivity of the Upper Aquifer System, based on boring logs for
monitoring wells MW-1, MW-2, and MW-3.
Hydraulic gradient, based on groundwater level measurements collected from the on-site
monitoring wells.
Dimensions of the leach field.
Infiltration rate of the leach field, based on the dimensions of the leach field and planned industrial
wastewater discharge rate under Wastewater Treatment Option 3.
Thickness of the shallow alluvium aquifer in the leach field area, based on on-site well logs.
Baseline concentrations of constituents in the shallow groundwater, based on sampling results
from monitoring wells MW-1 and MW-2, which are located directly adjacent to the on-site leach
field (see Table 4.8-1).
Anticipated concentration of constituents in industrial process water under Wastewater Treatment
Option 3, based on general mineral data collected in effluent at the CGWC facility in Calistoga.
The CGWC Calistoga facility currently produces flavored mineral water which would inherently
have a higher concentration of constituents compared to the sparkling and flavored water
proposed to be produced under Wastewater Treatment Option 3; therefore, the concentration of
constituents from operations at the CGWC Calistoga facility provides a conservative analysis of
potential impacts to water quality.
Certain dissolved constituents and general minerals were selected for modeling based on materials and
chemicals that CGWC would add to source waters and discharge to the leach field. The anticipated
4.8 Hydrology and Water Quality
AES 4.8-22 Crystal Geyser Bottling Plant Project January 2017 Draft Environmental Impact Report
water quality of the effluent during the production of sparkling and flavored water was based on the
measured effluent from the Crystal Geyser Plant in Calistoga. Constituents that will be discharged
include the chemicals that will be used for sanitation of their equipment: hydrogen peroxide, peroxyacetic
acid, acetic acid, nitric acid, bleach or chlorine (NaClO), hydrochloric acid, vinegar, caustic soda (NaOH
and NaCl), sodium xylene sulfonate, and cocamine oxide. Other constituents that will be added include
fruit flavoring extracts. Based on the chemical makeup of these chemicals, the following constituents and
general minerals were selected for modeling: TDS, Chemical Oxygen Demand (COD), sodium (Na),
chloride (Cl), sulfate (SO4), and boron (B). Because all chemicals used in CGWC processes are food
grade products, no priority pollutants such as listed VOCs, semi-volatile organic compounds, or Title 22
metals would be contained in the products used by CGWC. In addition, the food grade acids used in the
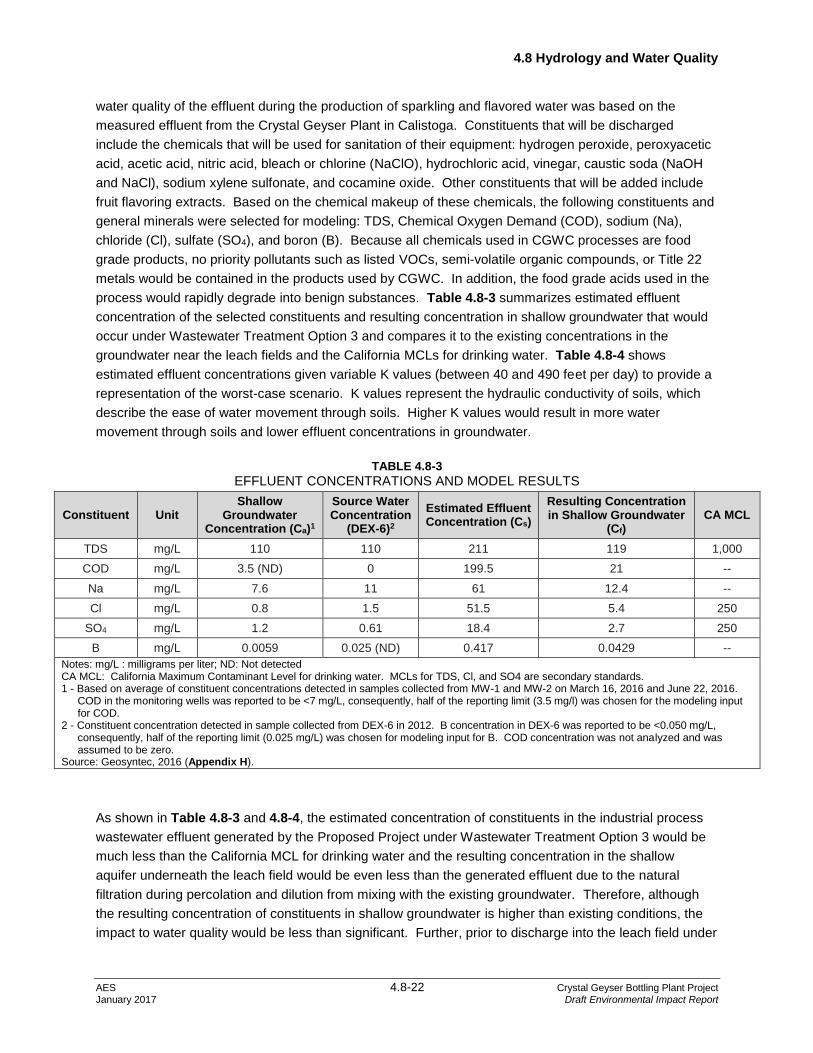
process would rapidly degrade into benign substances. Table 4.8-3 summarizes estimated effluent
concentration of the selected constituents and resulting concentration in shallow groundwater that would
occur under Wastewater Treatment Option 3 and compares it to the existing concentrations in the
groundwater near the leach fields and the California MCLs for drinking water. Table 4.8-4 shows
estimated effluent concentrations given variable K values (between 40 and 490 feet per day) to provide a
representation of the worst-case scenario. K values represent the hydraulic conductivity of soils, which
describe the ease of water movement through soils. Higher K values would result in more water
movement through soils and lower effluent concentrations in groundwater.
TABLE 4.8-3
EFFLUENT CONCENTRATIONS AND MODEL RESULTS
Constituent Unit Shallow
Groundwater Concentration (Ca)1
Source Water Concentration
(DEX-6)2
Estimated Effluent Concentration (Cs)
Resulting Concentration in Shallow Groundwater
(Cf) CA MCL
TDS mg/L 110 110 211 119 1,000
COD mg/L 3.5 (ND) 0 199.5 21 --
Na mg/L 7.6 11 61 12.4 --
Cl mg/L 0.8 1.5 51.5 5.4 250
SO4 mg/L 1.2 0.61 18.4 2.7 250
B mg/L 0.0059 0.025 (ND) 0.417 0.0429 --
Notes: mg/L : milligrams per liter; ND: Not detected CA MCL: California Maximum Contaminant Level for drinking water. MCLs for TDS, Cl, and SO4 are secondary standards. 1 - Based on average of constituent concentrations detected in samples collected from MW-1 and MW-2 on March 16, 2016 and June 22, 2016.
COD in the monitoring wells was reported to be <7 mg/L, consequently, half of the reporting limit (3.5 mg/l) was chosen for the modeling input for COD.
2 - Constituent concentration detected in sample collected from DEX-6 in 2012. B concentration in DEX-6 was reported to be <0.050 mg/L, consequently, half of the reporting limit (0.025 mg/L) was chosen for modeling input for B. COD concentration was not analyzed and was assumed to be zero.
Source: Geosyntec, 2016 (Appendix H).
As shown in Table 4.8-3 and 4.8-4, the estimated concentration of constituents in the industrial process
wastewater effluent generated by the Proposed Project under Wastewater Treatment Option 3 would be
much less than the California MCL for drinking water and the resulting concentration in the shallow
aquifer underneath the leach field would be even less than the generated effluent due to the natural
filtration during percolation and dilution from mixing with the existing groundwater. Therefore, although
the resulting concentration of constituents in shallow groundwater is higher than existing conditions, the
impact to water quality would be less than significant. Further, prior to discharge into the leach field under

4.8 Hydrology and Water Quality
AES 4.8-23 Crystal Geyser Bottling Plant Project January 2017 Draft Environmental Impact Report
Wastewater Treatment Option 3, a modified WDR would be obtained from the CVRWQCB which, similar
to the current WDR permit, would include monitoring and reporting requirements to ensure impacts to
groundwater quality are minimized. Potential impacts to groundwater quality from the disposal of
industrial rinse and process wastewater generated by the production of sparkling and flavored water
under Wastewater Treatment Option 3 would be, therefore, less than significant and no mitigation is
required.
TABLE 4.8-4
EFFLUENT CONCENTRATIONS FOR VARIABLE K VALUES1,2
Constituent Unit Cf
K = 40 ft/day Cf
K = 265 ft/day Cf
K = 490 ft/day CA MCL
TDS mg/L 140 119 115 1,000
COD mg/L 62.6 21 13.9 --
Na mg/L 23.7 12.4 10.4 --
Cl mg/L 16.1 5.4 3.5 250
SO4 mg/L 6.4 2.7 2.1 250
B mg/L 0.1298 0.0429 0.0277 -- Notes: mg/L = milligrams per liter; Cf = Resulting concentration in shallow groundwater 1 – Inputs other than K and the calculated mixing zone thickness (m) remain the same as present in Table 4.8-3. 2 – Note that the calculated mixing zone thickness (m) for K = 40 ft/day is 28.49 ft, m for K = 265 ft/day is 18.77 ft, and m for
K = 490 ft/day is 17.93 ft. Source: Geosyntec, 2016 (Appendix H).
Wastewater Treatment Option 4
Under Wastewater Treatment Option 4, industrial rinse water would be discharged into the Plant’s on-site
leach field, as described in Wastewater Treatment Option 2, while industrial process wastewater would be
treated on site before being discharged into the Plant’s existing on-site leach field, which would be
expanded to accommodate additional flows, or the proposed on-site irrigation system. The water
proposed to be discharged to a leach field under Wastewater Treatment Option 4 would involve different
constituents than what is currently permitted under WDR Order 5-01-233; therefore, implementation of
Wastewater Treatment Option 4 would require a modified WDR permit from the CVRWQCB.
The proposed on-site wastewater treatment system (WWTS) described in Appendix C and Section
3.5.8.3, was designed based on the estimated wastewater flow rates and anticipated water quality of the
effluent produced during each production run (sparkling water, tea, juice) of the Proposed Project as well
as the expected effluent requirements. The anticipated water quality of the effluent during the production
of sparkling and flavored water was based on the measured effluent from the Crystal Geyser Plant in
Calistoga and the anticipated water quality of the effluent during the production of tea and juice was
based on the measured effluent from the Crystal Geyser Plant in Bakersfield. The anticipated
concentration of constituents under each type of production run is detailed in Attachment A of Appendix
C.
As discussed previously, implementation of Wastewater Treatment Option 4 would require a modified
WDR permit from the CVRWQCB. Because this permit has not yet been issued, the exact effluent
requirements are not known at this time; therefore, the WWTS was designed so that the effluent would be

4.8 Hydrology and Water Quality
AES 4.8-24 Crystal Geyser Bottling Plant Project January 2017 Draft Environmental Impact Report
treated to a similar water quality level as the groundwater located below the existing leach field. The
concentration of constituents in the groundwater located below the existing leach field is detailed in
Attachment A of Appendix C.
By comparing the anticipated concentration of constituents under each type of production run and the
concentration of constituents in the groundwater located below the existing leach field, identified
constituents were found in higher concentrations in the effluent than the groundwater. The WWTS was
designed to reduce the concentration of these constituents in the effluent to levels similar to those
groundwater. As described in detail in Appendix C, the on-site WWTS would consist of a membrane
bioreactor (MBR) followed by reverse osmosis (RO). The basis of the WWTS’s design is provided in
Table 4.8-5.
TABLE 4.8-5
BASIS OF DESIGN FOR THE WWTS
Parameter Influent
Target Effluent Minimum Maximum
Flow Rate (gpd) 20,000 60,000 NA
COD (mg/L) 50 330 < 5
BOD (mg/L) 10 240 < 3
TSS (mg/L) 5 50 < 2
TDS (mg/L) 260 1,100 100
Notes: Average value presented as opposed to minimum. Original capacity will be 60,000 gpd, system will be easily expandable to 120,000 gpd.
Source: CH2M Hill, 2016a (Appendix D).
Once treated at the proposed on-site WWTS the water quality of the effluent to be discharged via the
leachfields or the proposed on-site irrigation system would be similar to the water quality of the
groundwater under the project site. The water quality of the effluent would be further improved through
the natural filtration during percolation and dilution from mixing with the existing groundwater. Further,
prior to discharge into the leach field under Wastewater Treatment Option 3, a modified WDR would be
obtained from the CVRWQCB which, similar to the current WDR permit, would include monitoring and
reporting requirements to ensure impacts to groundwater quality are minimized. Potential impacts to
groundwater quality from the disposal of industrial rinse and process wastewater generated by the under
Wastewater Treatment Option 4 would be, therefore less than significant and no mitigation is required.
4.8 Hydrology and Water Quality
AES 4.8-25 Crystal Geyser Bottling Plant Project January 2017 Draft Environmental Impact Report
IMPACT 4.8-2
SUBSTANTIALLY DEPLETE GROUNDWATER SUPPLIES OR
INTERFERE SUBSTANTIALLY WITH GROUNDWATER RECHARGE
SUCH THAT THERE WOULD BE A NET DEFICIT IN AQUIFER
VOLUME OR A LOWERING OF THE LOCAL GROUNDWATER
TABLE
Significance Less than Significant
Mitigation Measures None Required
Significance After
Mitigation Less than Significant
The total pumping demand for full production (two bottling lines) under the Proposed Project is 243 AF/yr
(216,788 gpd) and would occur under each of the wastewater treatment options. As described in Section
3.5.2, the Proposed Project would result in the operation of two existing wells on the project site, one for
domestic supply and some operational uses and one to supply water to the Plant to produce beverage
products (DEX-6). The projected demand on the Domestic Well from the full production of the Proposed
Project would be approximately 16.9 AF/yr (7 percent of the total demand), which would average to a
pumping rate of 11 gpm (15,840 gpd) if the pump is run continuously 24 hours per day, 365 days a year.
The projected demand on DEX-6 from the full production of the Proposed Project would be approximately
226.1 AF/yr (93 percent of the total demand), which would average to a pumping rate of 139 gpm
(200,160 gpd) if the pump is run continuously 24 hours per day, 365 days a year. An assessment of
possible impacts of pumping of the on-site wells on the local aquifer systems (storage and underflow) and
on the amount of flow from the existing Big Springs was conducted and is included as Appendix P.
Although the Domestic Well is perforated within both the Upper and Lower Aquifer System, it is most
likely obtaining its water supply from the Lower Aquifer System because the water quality between DEX-6
and the Domestic well is essentially the same and because the lower aquifer has a much higher yield
rate; therefore, the groundwater assessment analyzed groundwater impacts based on both wells drawing
from the Lower Aquifer System.2 The following is a summary of that analysis.
Groundwater Withdrawal Impact to Groundwater Supplies
As described above, static groundwater levels for DEX-6 are influenced by seasonal and yearly changes
in precipitation within the 7.2-square-mile groundwater recharge area. Figure 4.8-2 includes the period
that the Plant was operational between 2001 and 2010. During that time the former Plant was pumping
approximately 259 AF/yr (which is 16 AF/yr more than would occur under the Proposed Project). As
shown in Figure 4.8-2, during the period of former plan operations the static groundwater levels in DEX-6
continued to fluctuate between 0.5 and 1.0 foot on a seasonal basis, but overall static groundwater levels
were not significantly lowered. As such, it can be inferred that the previous pumping of well DEX-6 did
2 It should be noted that the level of drawdown at a well is related to the rate at which the well is being pumped, with higher rates resulting in greater drawdown. During a pump test of the Domestic Well that consisted of pumping at 500 gpm for 6 hours, the drawdown at the Domestic Well was approximately 2 feet (RCS, 2016; Appendix P). If the
Domestic Well is pumped at the proposed rate of 11 gpm, the drawdown at the well would be much smaller than the 2 feet that resulted from the pump test. Therefore, regardless of which aquifer the Domestic Well is pulling water from, which is most likely the Lower Aquifer System, the impact on groundwater levels from pumping the Domestic Well will be insignificant.
4.8 Hydrology and Water Quality
AES 4.8-26 Crystal Geyser Bottling Plant Project January 2017 Draft Environmental Impact Report
not have a detrimental impact on groundwater levels in the groundwater aquifer system. Since the full
production of the Proposed Project (243 AF/yr) would pump less than the 259 AF/yr previously pumped,
the changes to the groundwater levels would be expected to be equal to or less than what is shown in
Figure 4.8-2. Therefore, the potential impact to groundwater supplies from pumping 243 AF/yr under full
production of the Proposed Project would be less than significant and no mitigation is required.
Groundwater Withdrawal Impact to Adjacent Users
Proximal to the site are residential/commercial areas. On the north, south, and west, these residential
areas are served via the City’s water supply and sanitary sewer systems. However, on the east, each
residence has its own water well and subsurface septic/leach field system. Figure 4.8-6 shows the
locations of wells that are closest to the project site. An evaluation of the potential impact of
simultaneously pumping DEX-6 and the Domestic Well at full plant capacity on water levels on these
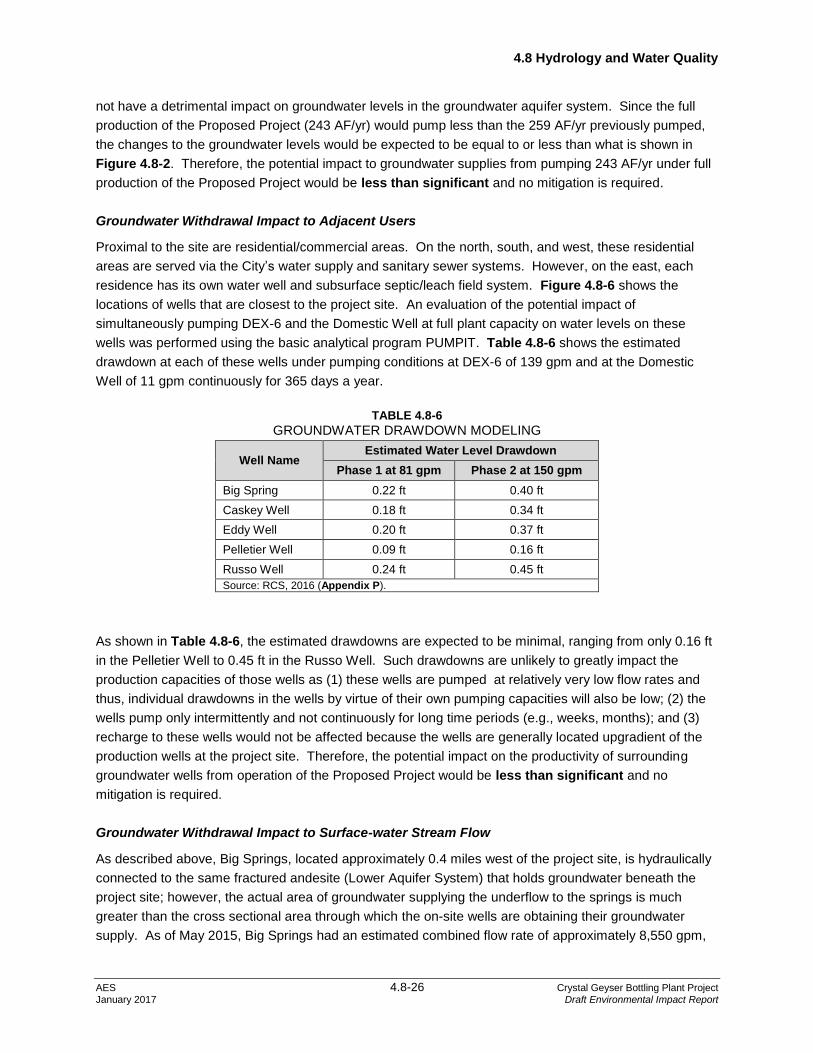
wells was performed using the basic analytical program PUMPIT. Table 4.8-6 shows the estimated
drawdown at each of these wells under pumping conditions at DEX-6 of 139 gpm and at the Domestic
Well of 11 gpm continuously for 365 days a year.
TABLE 4.8-6
GROUNDWATER DRAWDOWN MODELING
Well Name Estimated Water Level Drawdown
Phase 1 at 81 gpm Phase 2 at 150 gpm
Big Spring 0.22 ft 0.40 ft
Caskey Well 0.18 ft 0.34 ft
Eddy Well 0.20 ft 0.37 ft
Pelletier Well 0.09 ft 0.16 ft
Russo Well 0.24 ft 0.45 ft
Source: RCS, 2016 (Appendix P).
As shown in Table 4.8-6, the estimated drawdowns are expected to be minimal, ranging from only 0.16 ft
in the Pelletier Well to 0.45 ft in the Russo Well. Such drawdowns are unlikely to greatly impact the
production capacities of those wells as (1) these wells are pumped at relatively very low flow rates and
thus, individual drawdowns in the wells by virtue of their own pumping capacities will also be low; (2) the
wells pump only intermittently and not continuously for long time periods (e.g., weeks, months); and (3)
recharge to these wells would not be affected because the wells are generally located upgradient of the
production wells at the project site. Therefore, the potential impact on the productivity of surrounding
groundwater wells from operation of the Proposed Project would be less than significant and no
mitigation is required.
Groundwater Withdrawal Impact to Surface-water Stream Flow
As described above, Big Springs, located approximately 0.4 miles west of the project site, is hydraulically
connected to the same fractured andesite (Lower Aquifer System) that holds groundwater beneath the
project site; however, the actual area of groundwater supplying the underflow to the springs is much
greater than the cross sectional area through which the on-site wells are obtaining their groundwater
supply. As of May 2015, Big Springs had an estimated combined flow rate of approximately 8,550 gpm,

!>
!>
!>
!>
!>
!>
Plant Building
Russo
DOM-01
DEX-06
Eddy Well
Caskey Well
Pelletier
§̈¦5
Everitt Memorial Hwy
Mount Sha sta BlvdPine St
Lassen Ln
Chestnut St
Wash
ington
Dr
Lake S
t
Ski Village Dr
Ivy St
2M05
Butte Ave
Oakway Rd
Shasta Ave
Rockfellow Dr
Jessie St
Alma St
Vista
Dr
Birch St
2M010
Rasb
erry W
ay
Carm
en D
r
Ski B
owl D
r
Hinckley St
Red Bud Dr
Nixon RdCa
roline
Ave
Field St Spruce St
Kin gston Rd
Alder St
2M16
P ine R idgeA
v e
Ke nneth Way
Wertz
Rd
Cedar St
Bear Ln
Hercules Dr
Smith Rd
Marjorie St
Fee Rd
Crispi Rd
Terry Lynn Ave
2M 0 15
Kenne d yDr
Hinkley St
Om Shasta Path
Black Butte Dr
Morris
St
Reginato Rd
Steller Way
Galle
tti Pl
Big Springs
Figure 4.8-6On-Site and Nearby Groundwater Production Wells
SOURCE: Geosyntec Consultants, 2014; AES, 12/2/2016 Crystal Geyser Draft Environmental Impact Report / 216537
LEGEND
0 500 1,000
Feet
!¢ÐNORTH
Project Site!> Off-Site Wells
!> On-Site WellsOff-Site Spring
4.8 Hydrology and Water Quality
AES 4.8-28 Crystal Geyser Bottling Plant Project January 2017 Draft Environmental Impact Report
which amounts to a total of 13,791 AF/yr. Thus, the calculated underflow in the region of the project site
of 871 AF/yr is very small in comparison, accounting for approximately 6.3 percent of the total spring
flows. Even if 100 percent of extracted groundwater from DEX-6 is removed from the flows in Big Springs
Creek, the potential reduction in flows would be minimal (1.8 percent); however, it should be noted that
the actual reduction in flows is expected to be considerably less, given that the actual area of
groundwater supplying the underflow to the Big Springs is approximately 16 times greater than the cross
sectional area through which DEX-6 is obtaining its groundwater supply and, therefore, pumping from
DEX-6 would have less influence on the flows at Big Springs. Put another way, one gallon pumped at
DEX-6 would result in less than one gallon decrease in flows at Big Springs because groundwater from
other areas of the aquifer would supplement the flow.
Figure 4.8-4 depicts the measured flows of Big Springs, including the period that the Plant was
operational between 2001 and 2010. During that time that the Plant was pumping approximately 259
AF/yr, there appears to have been no reported or observable effect on the flows from the Big Springs. As
such, it can be inferred that the previous pumping of well DEX-6 did not have a detrimental impact on Big
Springs. Since the full production of the Proposed Project would pump less than the 259 AF/yr previously
pumped, the changes to the groundwater levels would be equal to or less than what is shown in Figure
4.8-4.
Based on the limited potential reduction in the spring flow (less than 1.8 percent) and the fact that there
was no reported or observable effects on spring flow during the past bottled water operations, the
potential impact to stream flows from pumping 243 AF/yr under full production of the Proposed Project
would be less than significant and no mitigation is required.
Cumulative Impacts
IMPACT 4.8-3 CUMULATIVE HYDROLOGY AND WATER QUALITY IMPACTS
Significance Less than Significant
Mitigation Measures None Required
Significance After
Mitigation Less than Significant
As previously described, the project site is located within the Sacramento River Basin and overlies a
groundwater aquifer that is not located within a particular groundwater basin or sub-basin. Although the
Sacramento River Basin includes all or large portions of Modoc, Siskiyou, Lassen, Shasta, Tehama,
Glenn, Plumas, Butte, Colusa, Sutter, Yuba, Sierra, Nevada, Placer, Sacramento, El Dorado, Yolo,
Solano, Lake, and Napa counties as well as small areas of Alpine and Amador counties, this cumulative
analysis is limited to the portion of the basin within Siskiyou County. The groundwater recharge area for
the aquifer underlying the site is estimated to be approximately 7.2 square miles northeast of the project
site (see Figure 5 of Appendix P). The setting for the analysis of cumulative water quality impacts
encompasses both the Sacramento River Basin and the groundwater recharge area, while the setting for
the analysis of cumulative groundwater supply impacts encompasses just the developments that utilize
the groundwater aquifer.

4.8 Hydrology and Water Quality
AES 4.8-29 Crystal Geyser Bottling Plant Project January 2017 Draft Environmental Impact Report
Water Quality
The potential for the Proposed Project to result in cumulative impacts to water quality during construction
as a result of increased erosion or use of hazardous materials on site is addressed in Impacts 4.5-5 and
4.7-3. As discussed therein, this would be a less-than-significant cumulative impact with the
implementation of Mitigation Measures 4.5-1 and 4-7.1. The following is a discussion of the potential
cumulative impacts to water quality from the operation of the Proposed Project under each of the
wastewater treatment options.
Implementation of the Proposed Project, in combination with other reasonably foreseeable projects (see
Section 5.2.1), would contribute to a cumulative degradation of water quality from wastewater disposal,
which could result in cumulative water quality impacts to both surface water and groundwater supplies.
As described under Impact 4.7-1, the Proposed Project, as well as the City WWTP and any projects in
the area that would independently discharge treated wastewater, would be subject to WDR Orders issued
by the CVRWQCB. These orders include limitations and provisions for wastewater discharge that were
established pursuant to the CWA and the water quality objectives set forth in the Basin Plan, as well as
monitoring and reporting requirements to ensure impacts to groundwater quality are minimized.
Continued enforcement of state and local regulations related to wastewater discharge and water quality
protection would minimize impacts on surface water and groundwater resources from new development.
Therefore, cumulative impacts to water quality from wastewater treatment and disposal are less than
significant and no mitigation is required.
Groundwater Supply
The following discussion assesses the extent to which other reasonably foreseeable projects would affect
the same groundwater aquifer as the Proposed Project, potentially resulting in a cumulative impacts;
presents the cumulative impact; and evaluates the proposed project’s contribution to that impact.
Development within the City would not affect the groundwater aquifer from which the project would draw
water, as the City obtains its water from Cold Creek, two miles south east of the project site, or from wells
located within the city limits which is in a separate watershed from the project site.
The proposed McCloud Artesian Spring Water Company Bottling Plant, described in Section 5.2.1, is
located in McCloud, California which lies within the McCloud Area Groundwater Basin (Basin No 5-35) in
the Sacramento River Hydrologic Region (DWR, 2013b). The McCloud Plant would draw from a
delineated groundwater basin in a different hydrologic region than the Proposed Project and would not
affect the groundwater aquifer utilized by the Proposed Project.
In the vicinity of the Plant, there are no other large-scale production wells that pump from the fractured
aquifer system (Lower Aquifer System). A few small-capacity residential wells exist, and these are
located east of the proposed bottling facility and screened to depths that would allow them to extract their
groundwater supply from the Upper Aquifer System (RCS, 2016). There are approximately 82 residences
located northeast, east, and southeast of the project site. For a usage of 60 gallons per capita per day
(gal/c/d) then for a household of four persons, the daily use would be about 240 gpd per dwelling. This
amounts to 87,600 gallons per year (gal/y). Multiplied by the approximate number of residences (82), the
total local residential groundwater demand is approximately 7,183,200 gal/y or 22 AF/yr; this volume is

4.8 Hydrology and Water Quality
AES 4.8-30 Crystal Geyser Bottling Plant Project January 2017 Draft Environmental Impact Report
only a small fraction (2.5 percent) of the total underflow in the area (RCS, 2016). The pumping from
existing residential development in the area is captured in the existing conditions of the groundwater
aquifer and Big Springs.
Due to the local topography and residential zoning of adjacent properties to the north east, there are no
other reasonably foreseeable developments that would significantly utilize the groundwater aquifer for
water supply. Therefore, cumulative impacts associated with groundwater supply are less than
significant and no mitigation is required.
4.8.5 MITIGATION MEASURES
As described above, the Proposed Project would result in less-than-significant impacts to hydrology and
water quality; therefore, no mitigation measures are required.