
47 DAVID SUTTON PICTURES PHARYNX AND LARYNX THE NECK
76
47 THE PHARYNX AND LARYNX: THE NECK DAVID SUTTON
-
Upload
muhammad-bin-zulfiqar -
Category
Education
-
view
302 -
download
1
Transcript of 47 DAVID SUTTON PICTURES PHARYNX AND LARYNX THE NECK
47THE PHARYNX AND LARYNX:
THE NECK
DAVID SUTTON
DAVID SUTTON PICTURES
DR. Muhammad Bin Zulfiqar PGR-FCPS III SIMS/SHL
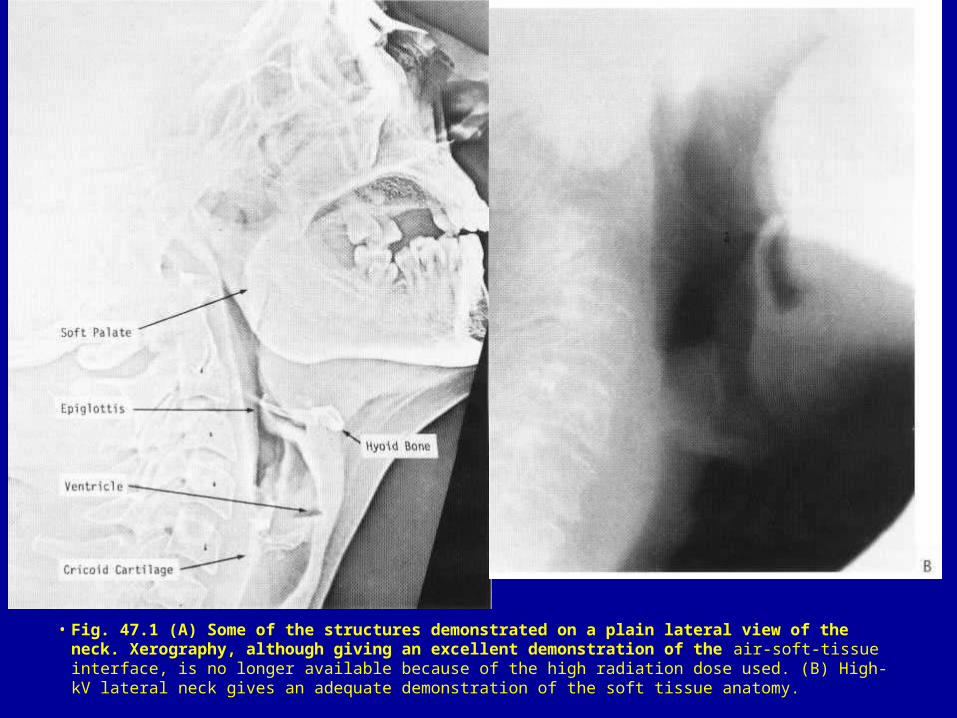
• Fig. 47.1 (A) Some of the structures demonstrated on a plain lateral view of the neck. Xerography, although giving an excellent demonstration of the air-soft-tissue interface, is no longer available because of the high radiation dose used. (B) High-kV lateral neck gives an adequate demonstration of the soft tissue anatomy.
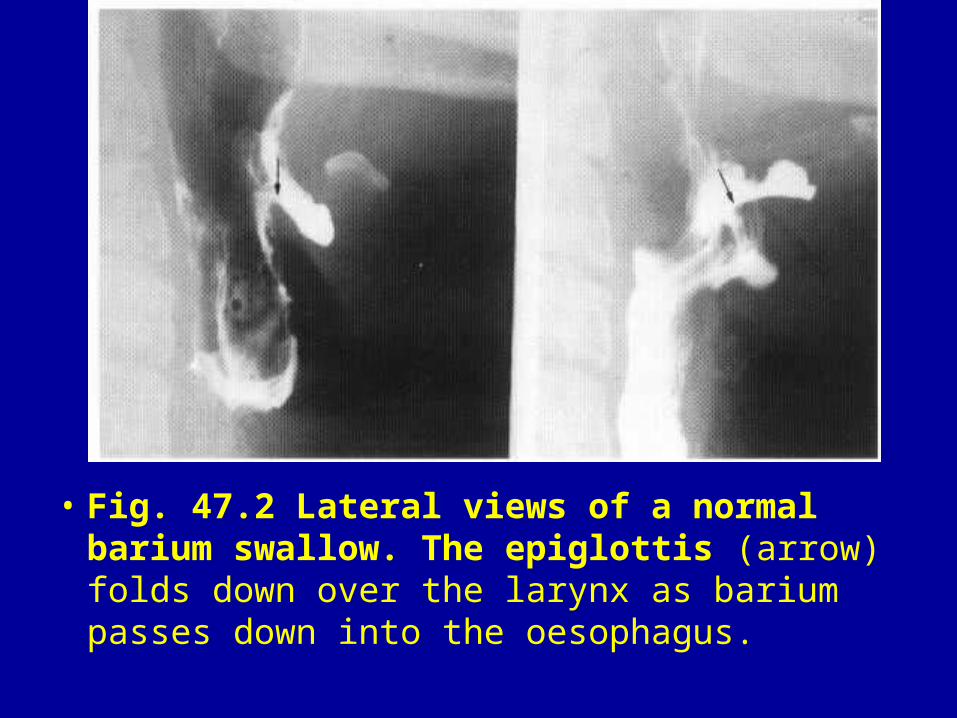
• Fig. 47.2 Lateral views of a normal barium swallow. The epiglottis (arrow) folds down over the larynx as barium passes down into the oesophagus.
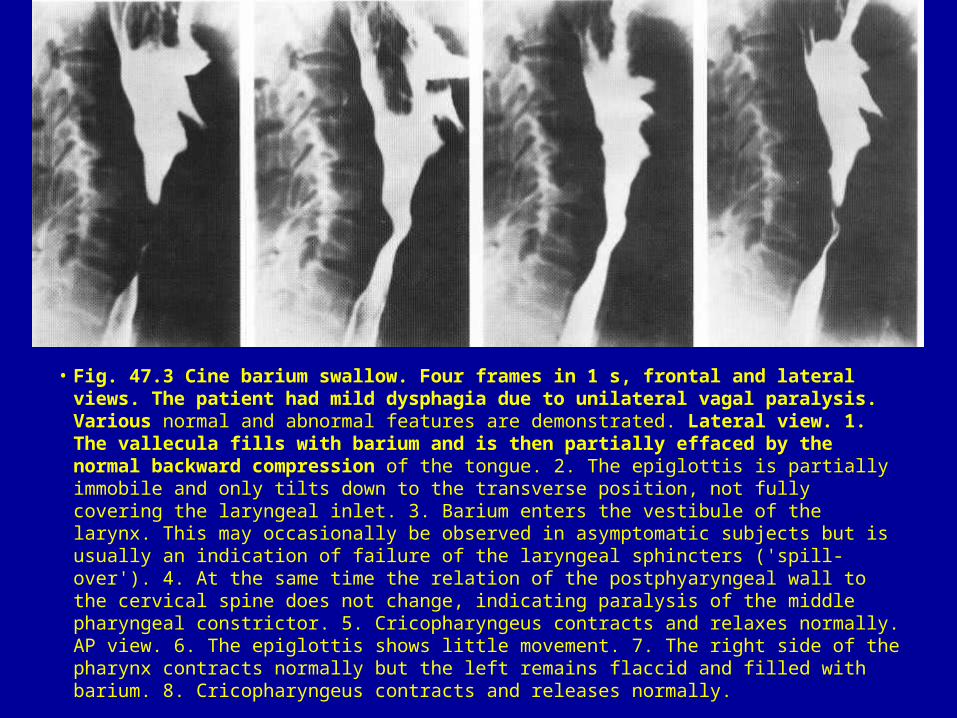
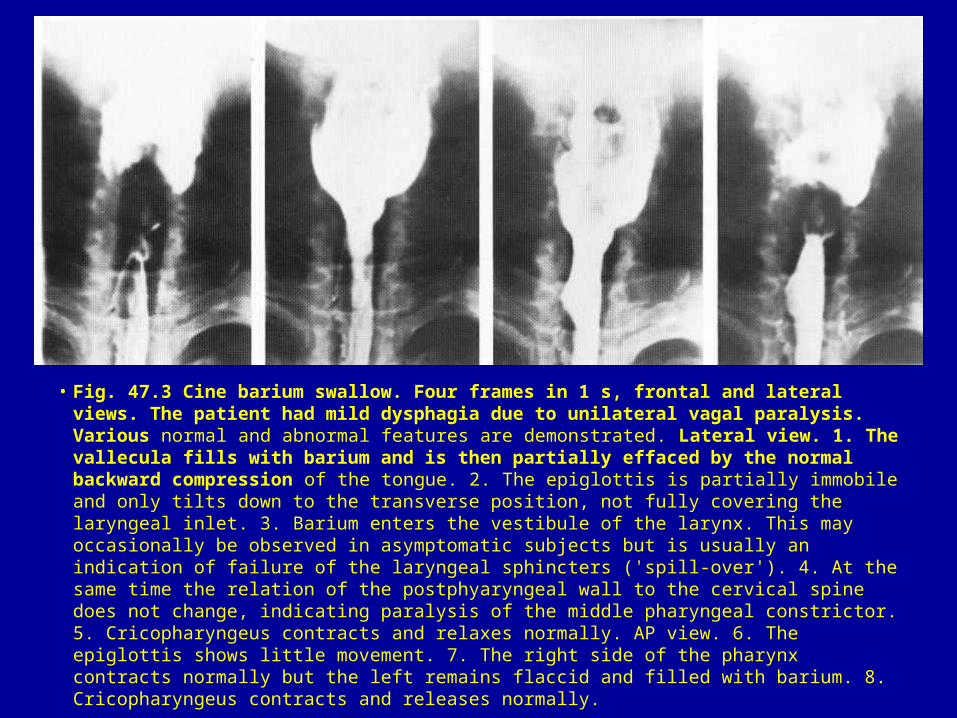
• Fig. 47.3 Cine barium swallow. Four frames in 1 s, frontal and lateral views. The patient had mild dysphagia due to unilateral vagal paralysis. Various normal and abnormal features are demonstrated. Lateral view. 1. The vallecula fills with barium and is then partially effaced by the normal backward compression of the tongue. 2. The epiglottis is partially immobile and only tilts down to the transverse position, not fully covering the laryngeal inlet. 3. Barium enters the vestibule of the larynx. This may occasionally be observed in asymptomatic subjects but is usually an indication of failure of the laryngeal sphincters ('spill-over'). 4. At the same time the relation of the postphyaryngeal wall to the cervical spine does not change, indicating paralysis of the middle pharyngeal constrictor. 5. Cricopharyngeus contracts and relaxes normally. AP view. 6. The epiglottis shows little movement. 7. The right side of the pharynx contracts normally but the left remains flaccid and filled with barium. 8. Cricopharyngeus contracts and releases normally.
• Fig. 47.3 Cine barium swallow. Four frames in 1 s, frontal and lateral views. The patient had mild dysphagia due to unilateral vagal paralysis. Various normal and abnormal features are demonstrated. Lateral view. 1. The vallecula fills with barium and is then partially effaced by the normal backward compression of the tongue. 2. The epiglottis is partially immobile and only tilts down to the transverse position, not fully covering the laryngeal inlet. 3. Barium enters the vestibule of the larynx. This may occasionally be observed in asymptomatic subjects but is usually an indication of failure of the laryngeal sphincters ('spill-over'). 4. At the same time the relation of the postphyaryngeal wall to the cervical spine does not change, indicating paralysis of the middle pharyngeal constrictor. 5. Cricopharyngeus contracts and relaxes normally. AP view. 6. The epiglottis shows little movement. 7. The right side of the pharynx contracts normally but the left remains flaccid and filled with barium. 8. Cricopharyngeus contracts and releases normally.

• Fig. 47.4 Axial CT of soft tissues below the skull base. (A) Normal section through antra and postnasal space. The arrowheads indicate the openings of the eustachian tubes. m = ramus of mandible; s = styloid process; p = pterygoid muscles. (B) Section at a slightly lower level passes through the soft palate (sp). Tensor and levator palatini blend with the pharyngeal constrictors (c) to give a dense muscle mass. The enlarged but otherwise normal parotid gland has a lower attenuation, i.e. appears darker, than the masseter muscle in front of it but not as dark as the fatty tissue in the parapharyngeal space. Thus the medial limit of the deep parotid lobe can be defined (arrowhead). These features are best shown by MRI.
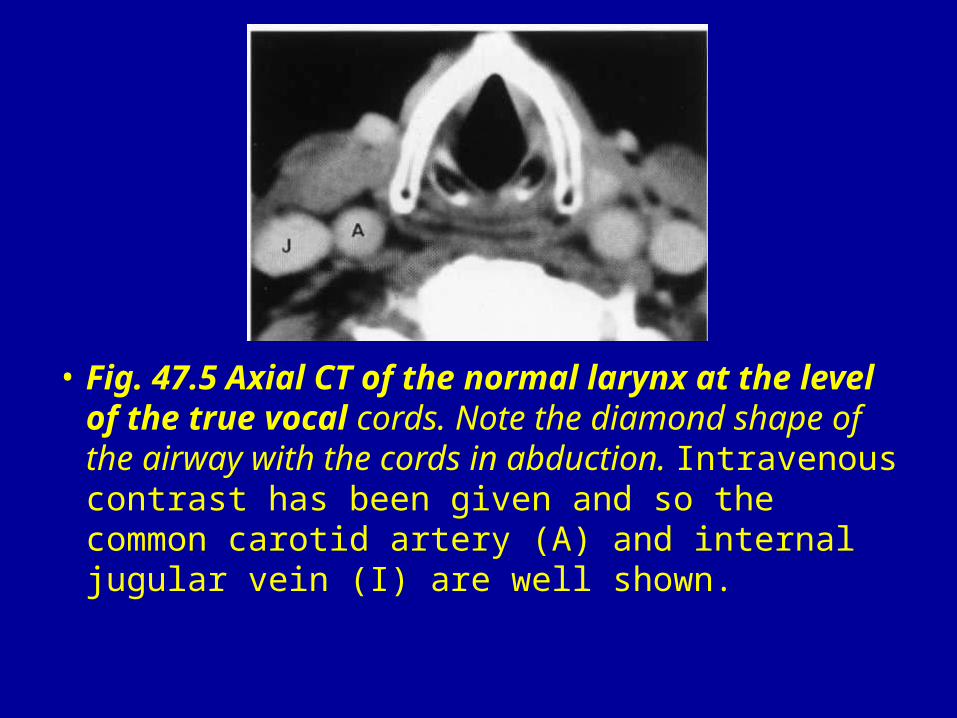
• Fig. 47.5 Axial CT of the normal larynx at the level of the true vocal cords. Note the diamond shape of the airway with the cords in abduction. Intravenous contrast has been given and so the common carotid artery (A) and internal jugular vein (I) are well shown.
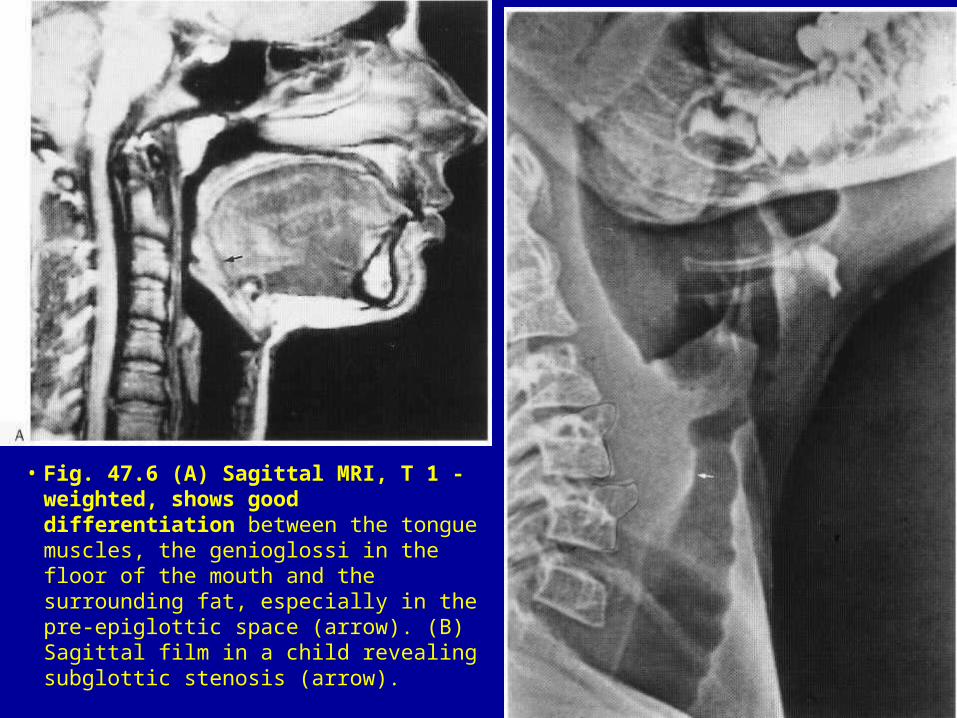
• Fig. 47.6 (A) Sagittal MRI, T 1 -weighted, shows good differentiation between the tongue muscles, the genioglossi in the floor of the mouth and the surrounding fat, especially in the pre-epiglottic space (arrow). (B) Sagittal film in a child revealing subglottic stenosis (arrow).
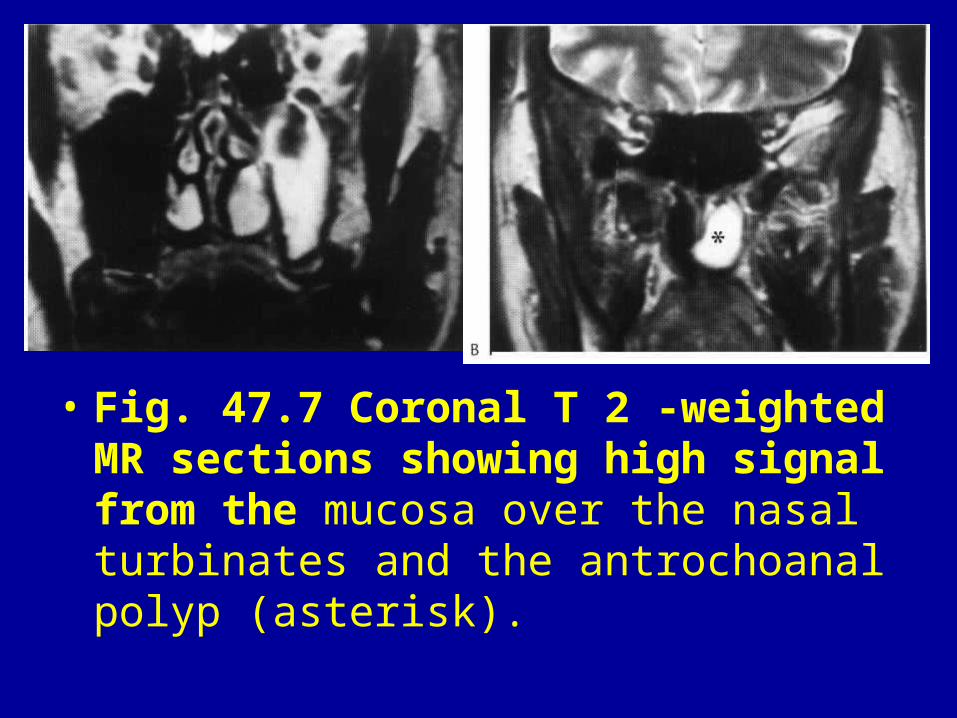
• Fig. 47.7 Coronal T 2 -weighted MR sections showing high signal from the mucosa over the nasal turbinates and the antrochoanal polyp (asterisk).
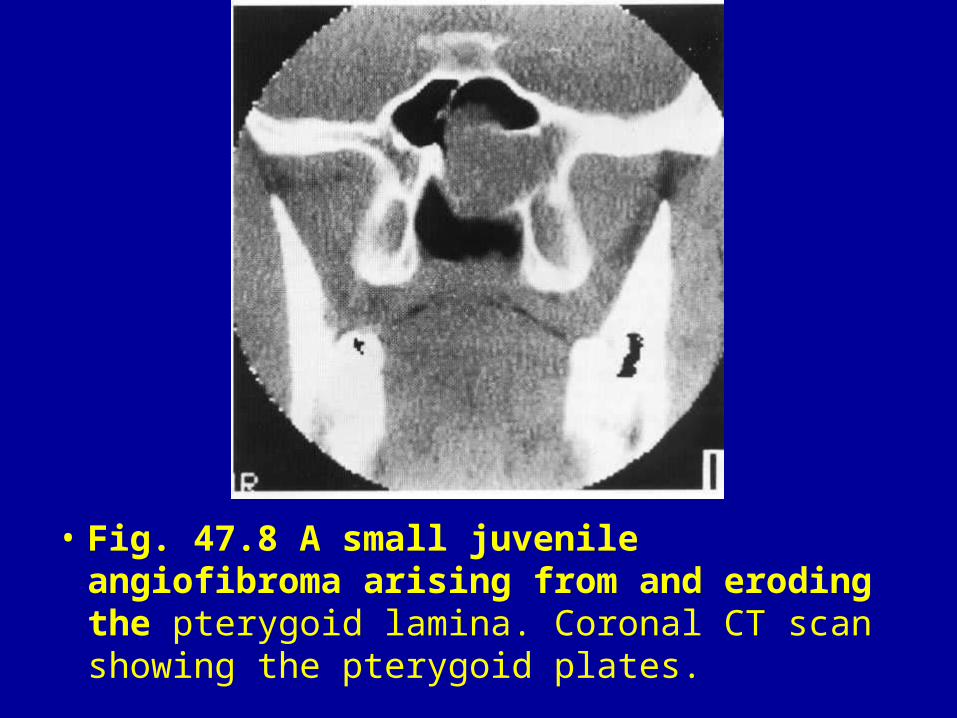
• Fig. 47.8 A small juvenile angiofibroma arising from and eroding the pterygoid lamina. Coronal CT scan showing the pterygoid plates.
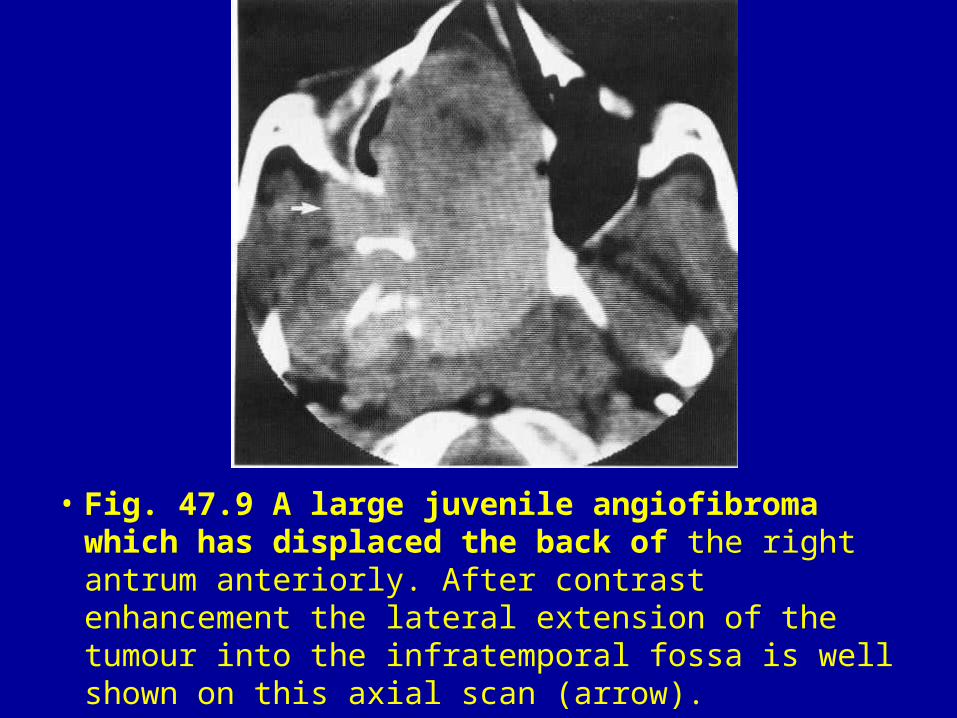
• Fig. 47.9 A large juvenile angiofibroma which has displaced the back of the right antrum anteriorly. After contrast enhancement the lateral extension of the tumour into the infratemporal fossa is well shown on this axial scan (arrow).
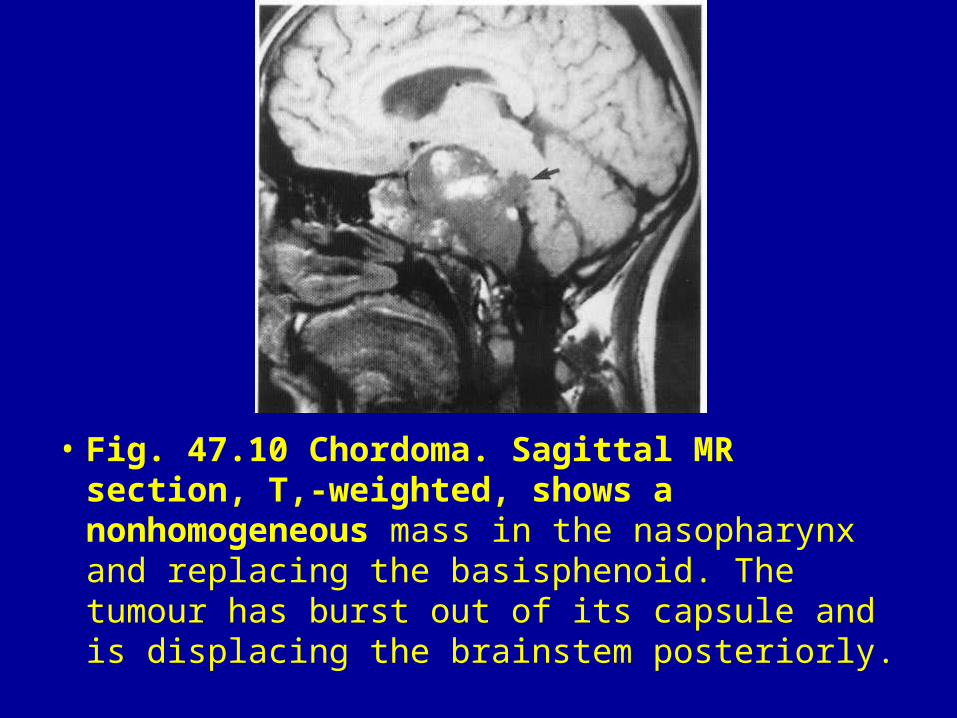
• Fig. 47.10 Chordoma. Sagittal MR section, T,-weighted, shows a nonhomogeneous mass in the nasopharynx and replacing the basisphenoid. The tumour has burst out of its capsule and is displacing the brainstem posteriorly.
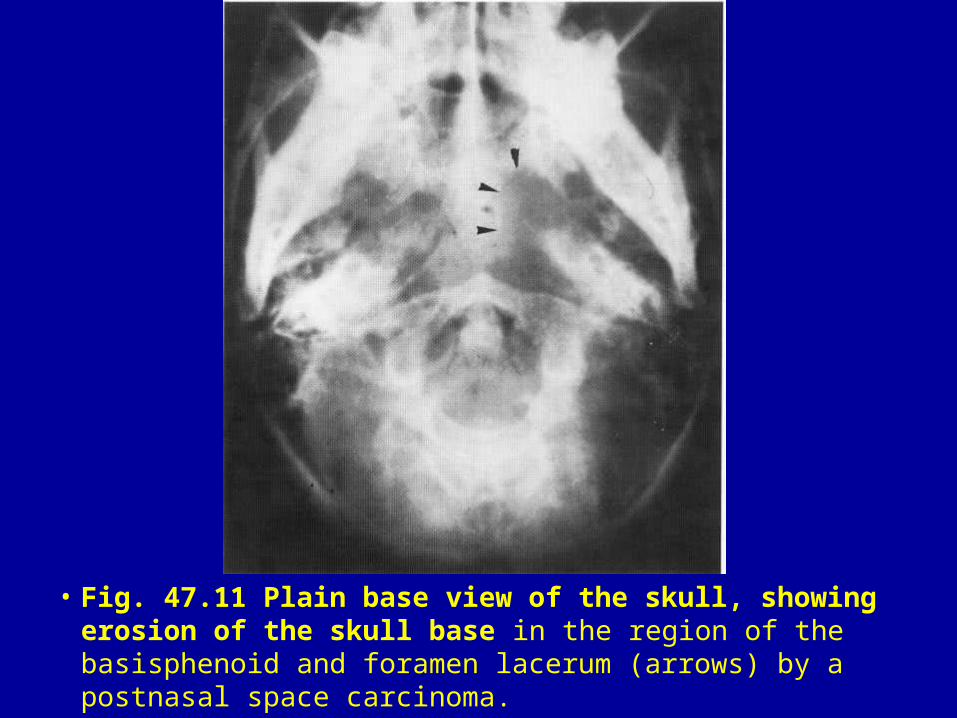
• Fig. 47.11 Plain base view of the skull, showing erosion of the skull base in the region of the basisphenoid and foramen lacerum (arrows) by a postnasal space carcinoma.
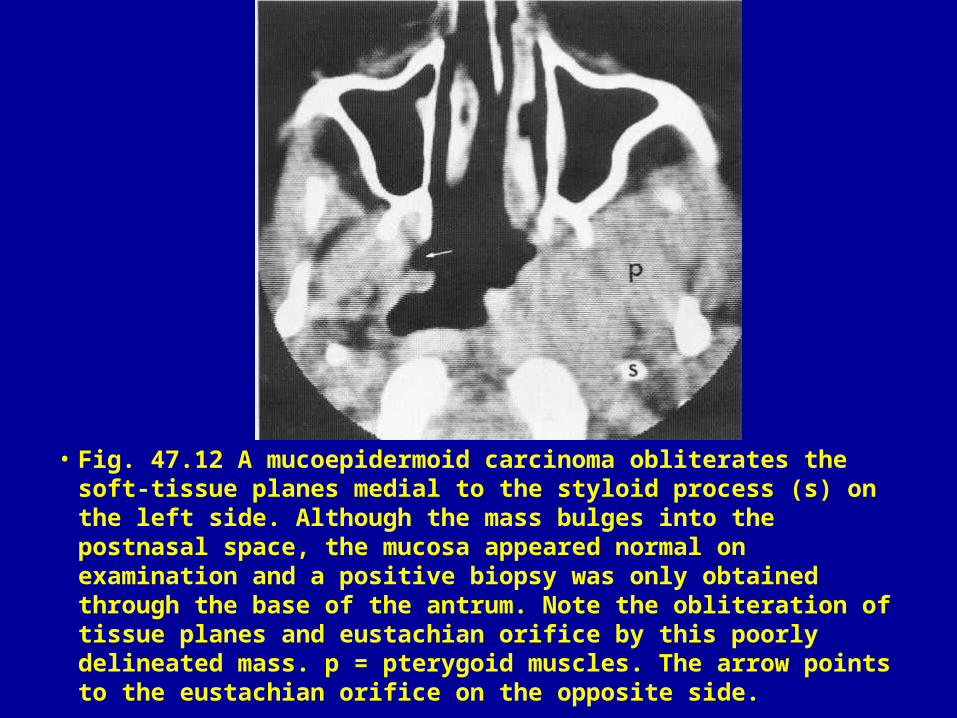
• Fig. 47.12 A mucoepidermoid carcinoma obliterates the soft-tissue planes medial to the styloid process (s) on the left side. Although the mass bulges into the postnasal space, the mucosa appeared normal on examination and a positive biopsy was only obtained through the base of the antrum. Note the obliteration of tissue planes and eustachian orifice by this poorly delineated mass. p = pterygoid muscles. The arrow points to the eustachian orifice on the opposite side.
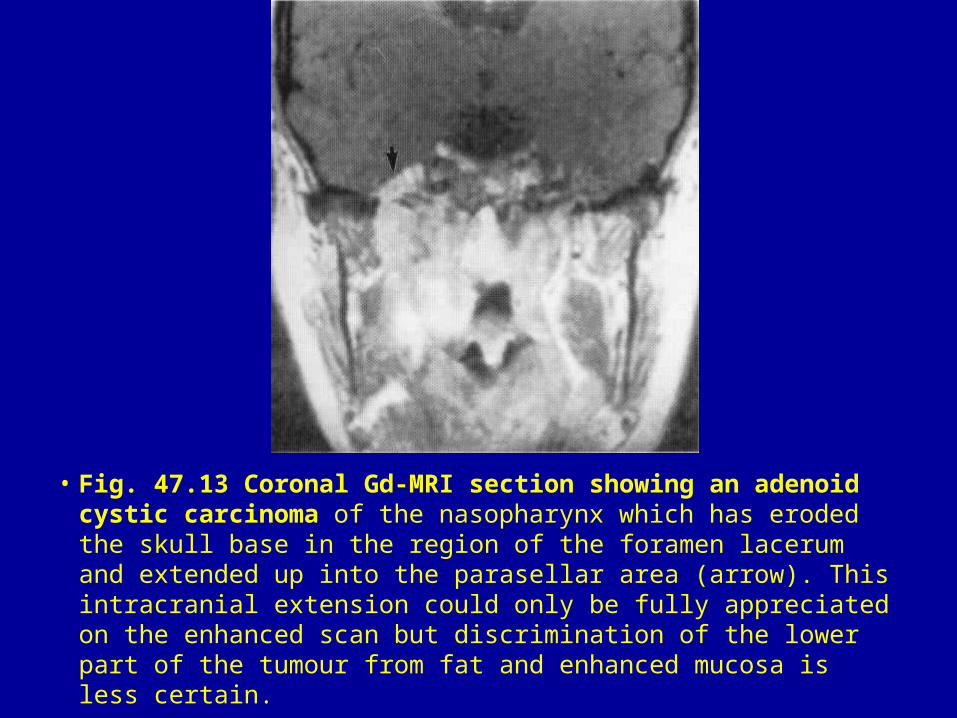
• Fig. 47.13 Coronal Gd-MRI section showing an adenoid cystic carcinoma of the nasopharynx which has eroded the skull base in the region of the foramen lacerum and extended up into the parasellar area (arrow). This intracranial extension could only be fully appreciated on the enhanced scan but discrimination of the lower part of the tumour from fat and enhanced mucosa is less certain.

• Fig. 47.14 Coronal fat-suppressed (STIR) section showing infiltration of the pterygoid muscles by a carcinoma of the nasopharynx (asterisk). The patient had severe tinnitus.
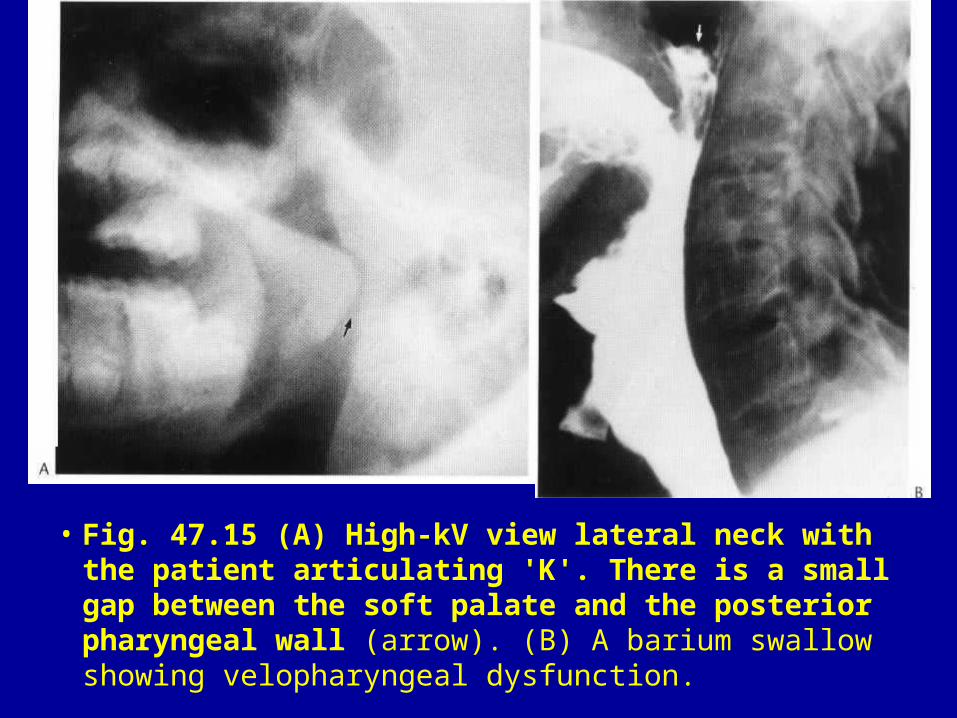
• Fig. 47.15 (A) High-kV view lateral neck with the patient articulating 'K'. There is a small gap between the soft palate and the posterior pharyngeal wall (arrow). (B) A barium swallow showing velopharyngeal dysfunction.
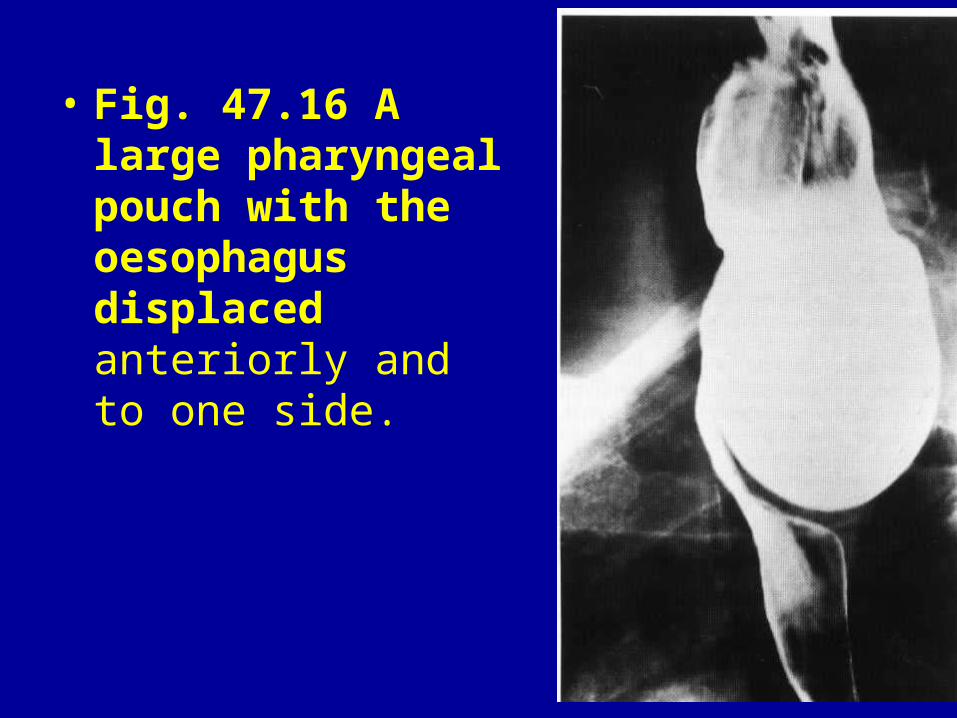
• Fig. 47.16 A large pharyngeal pouch with the oesophagus displaced anteriorly and to one side.
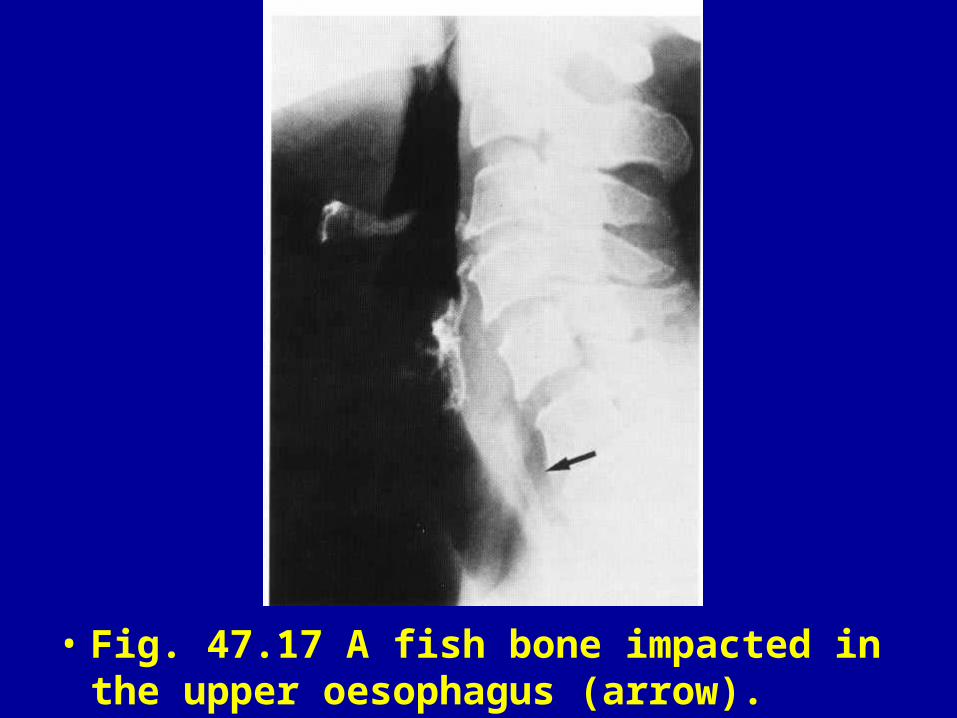
• Fig. 47.17 A fish bone impacted in the upper oesophagus (arrow).
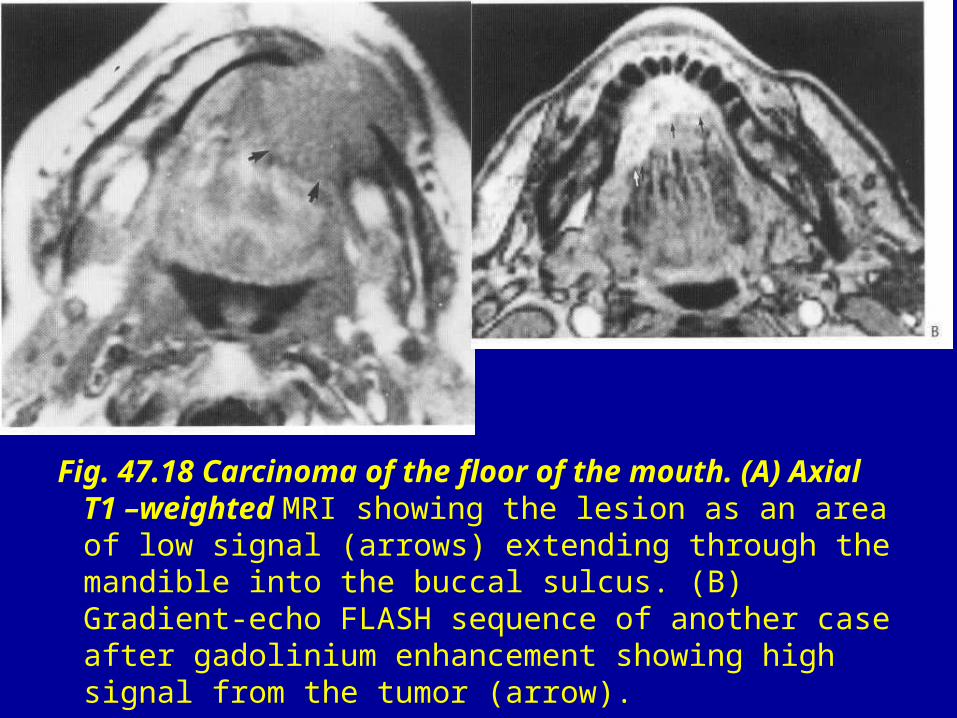
Fig. 47.18 Carcinoma of the floor of the mouth. (A) Axial T1 –weighted MRI showing the lesion as an area of low signal (arrows) extending through the mandible into the buccal sulcus. (B) Gradient-echo FLASH sequence of another case after gadolinium enhancement showing high signal from the tumor (arrow).
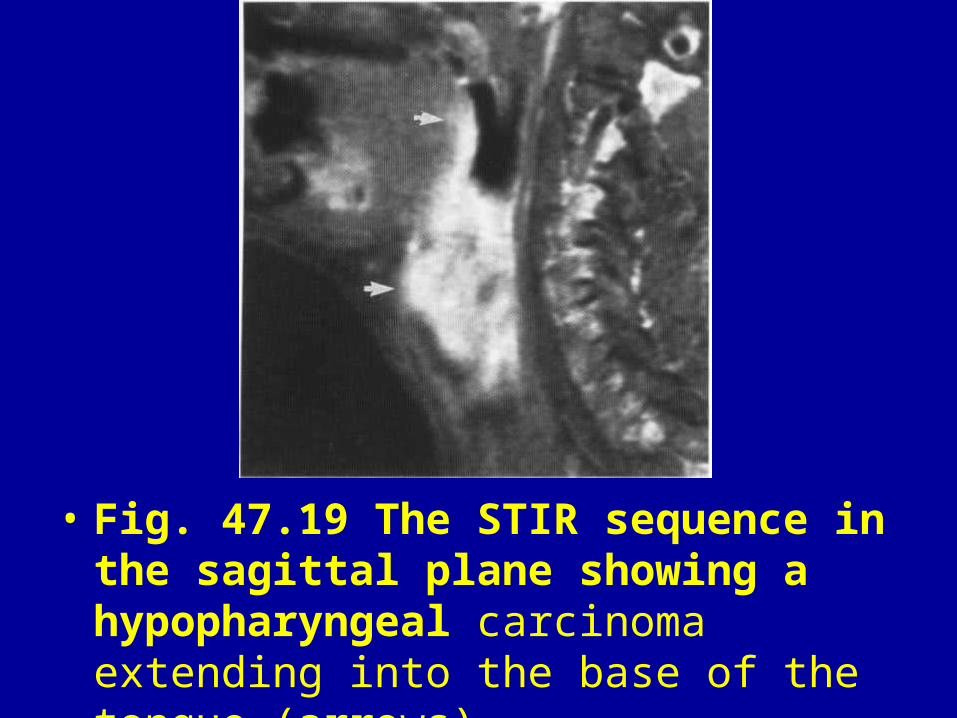
• Fig. 47.19 The STIR sequence in the sagittal plane showing a hypopharyngeal carcinoma extending into the base of the tongue (arrows).

• Fig. 47.20 An anterior web in the upper oesophagus in a patient with the Paterson-Brown Kelly syndrome.
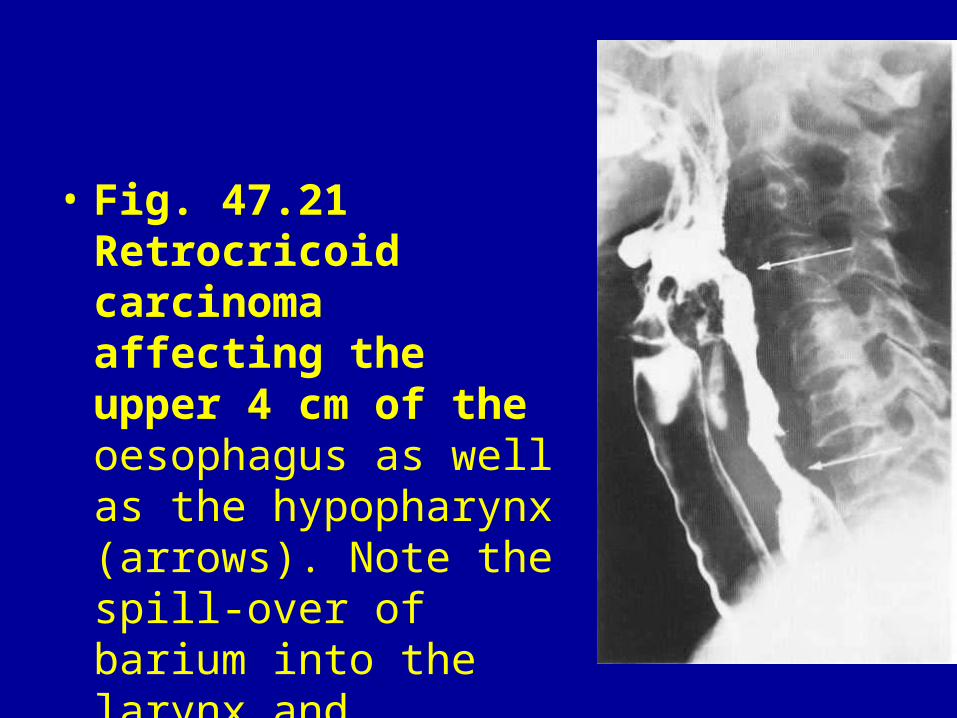
• Fig. 47.21 Retrocricoid carcinoma affecting the upper 4 cm of the oesophagus as well as the hypopharynx (arrows). Note the spill-over of barium into the larynx and trachea.
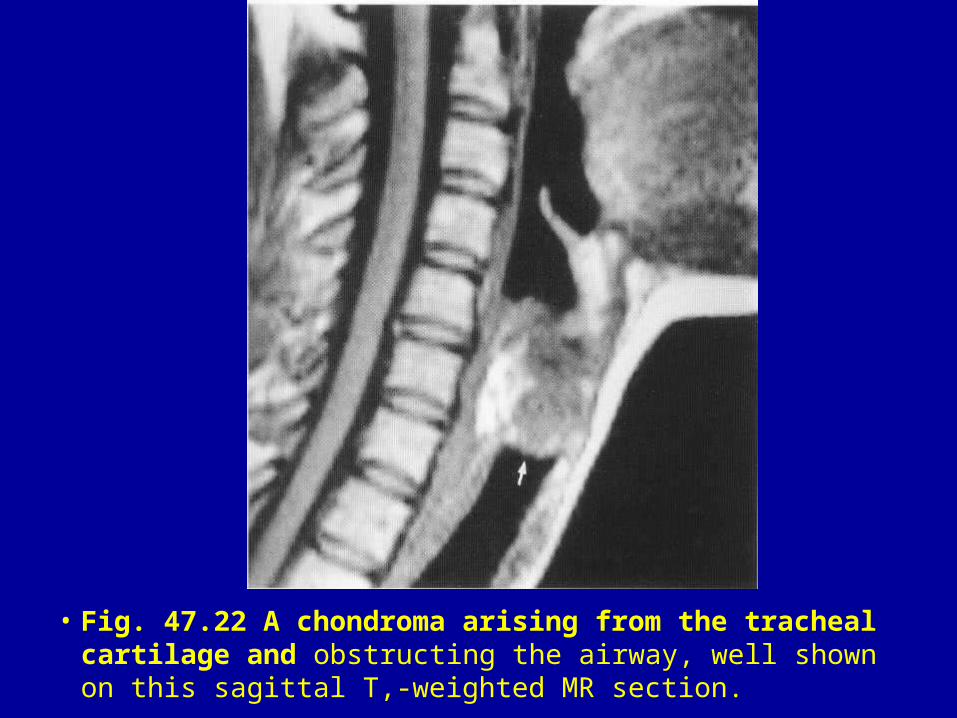
• Fig. 47.22 A chondroma arising from the tracheal cartilage and obstructing the airway, well shown on this sagittal T,-weighted MR section.
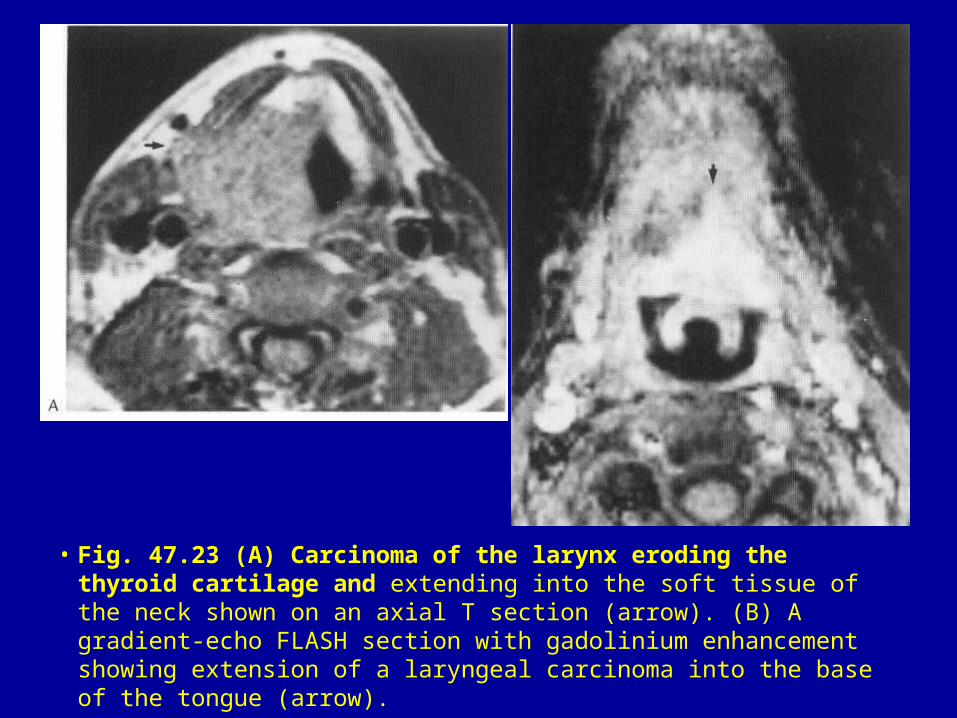
• Fig. 47.23 (A) Carcinoma of the larynx eroding the thyroid cartilage and extending into the soft tissue of the neck shown on an axial T section (arrow). (B) A gradient-echo FLASH section with gadolinium enhancement showing extension of a laryngeal carcinoma into the base of the tongue (arrow).
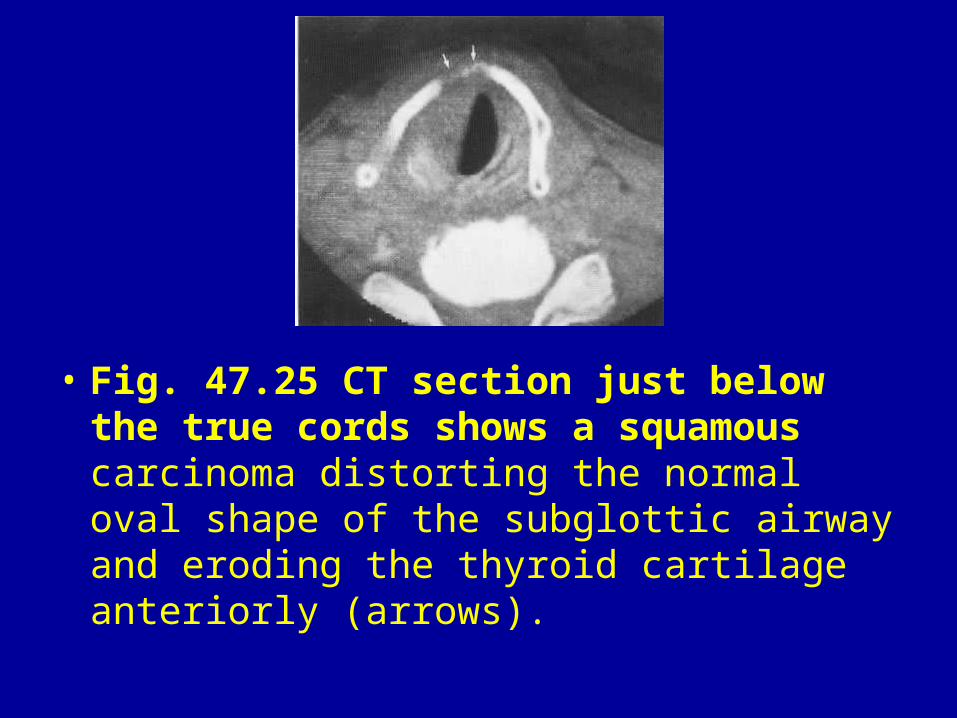
• Fig. 47.25 CT section just below the true cords shows a squamous carcinoma distorting the normal oval shape of the subglottic airway and eroding the thyroid cartilage anteriorly (arrows).
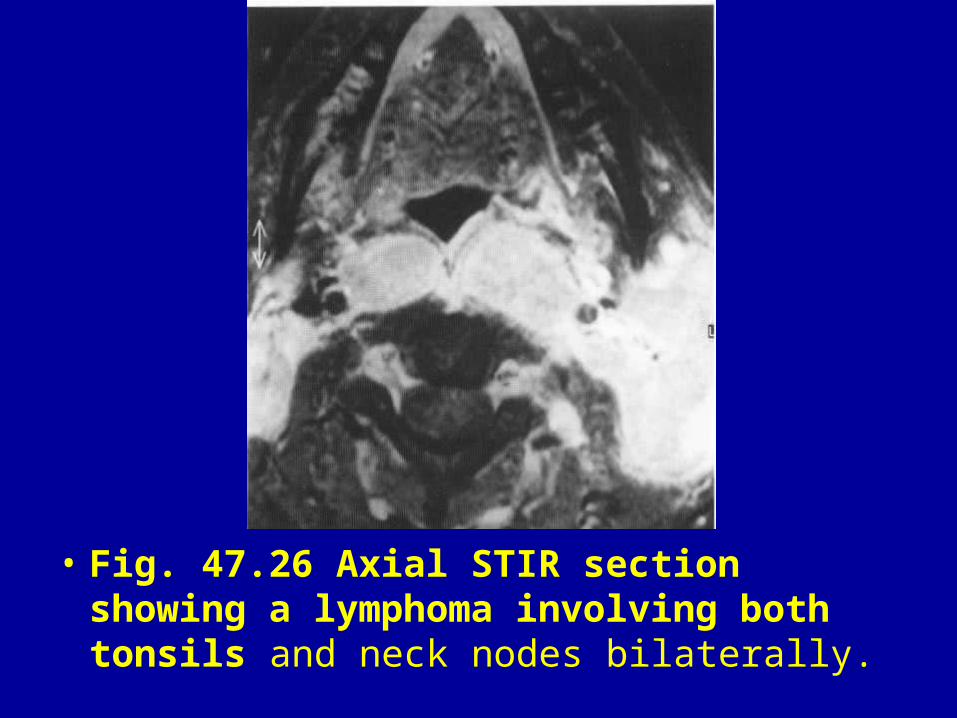
• Fig. 47.26 Axial STIR section showing a lymphoma involving both tonsils and neck nodes bilaterally.
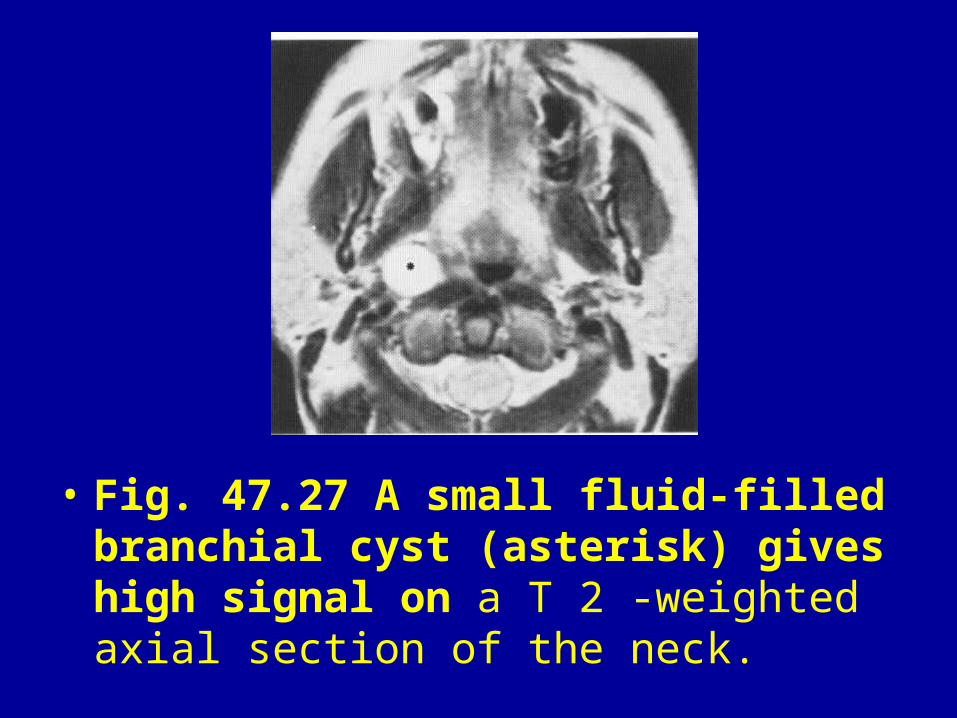
• Fig. 47.27 A small fluid-filled branchial cyst (asterisk) gives high signal on a T 2 -weighted axial section of the neck.
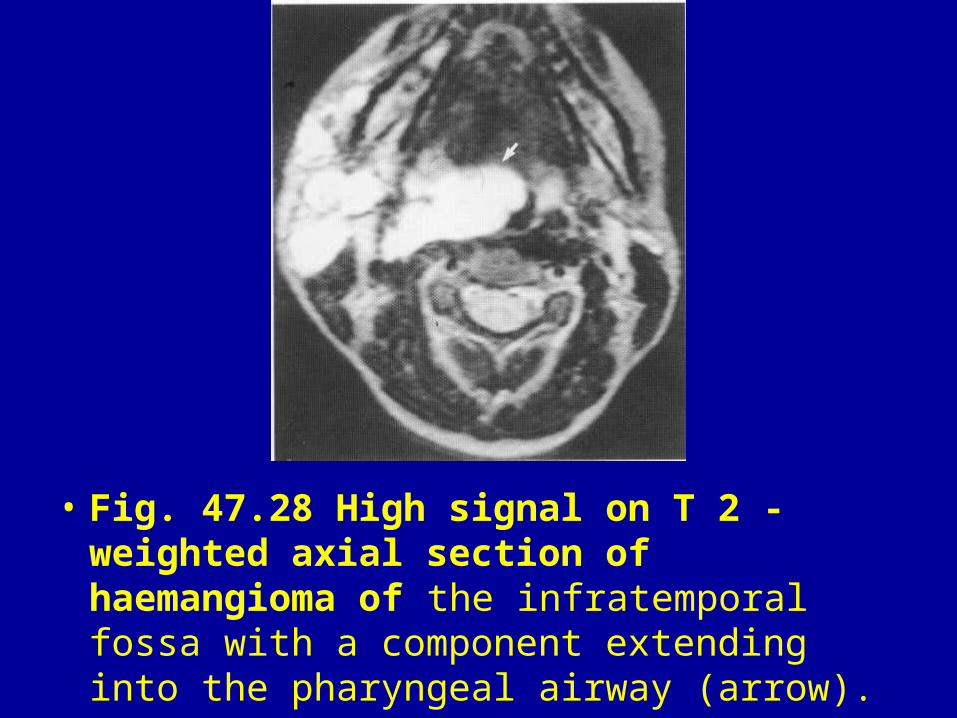
• Fig. 47.28 High signal on T 2 -weighted axial section of haemangioma of the infratemporal fossa with a component extending into the pharyngeal airway (arrow).
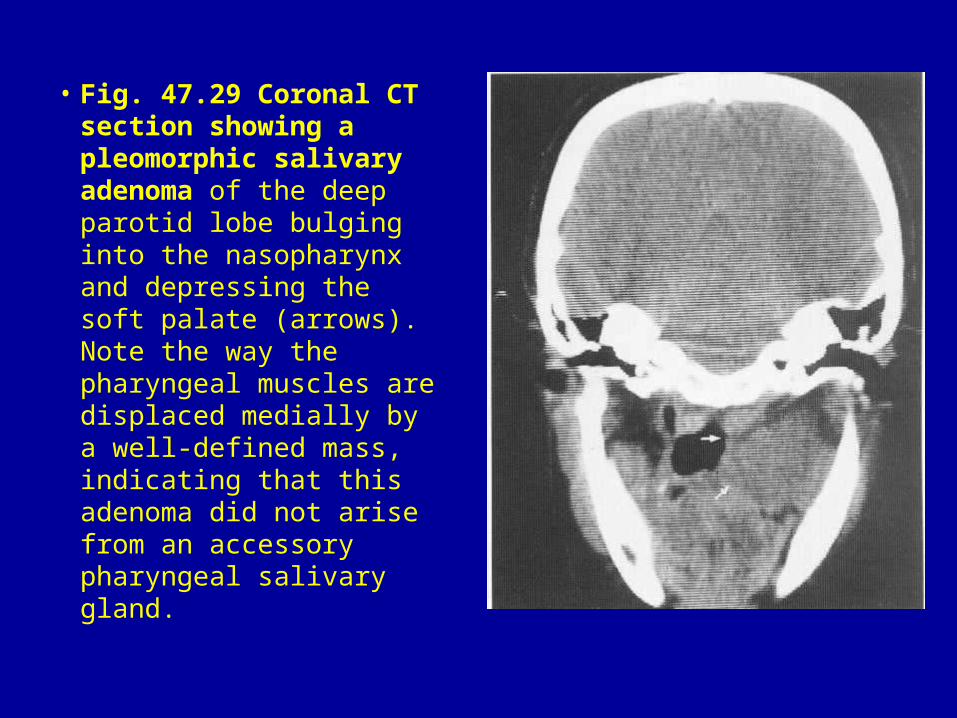
• Fig. 47.29 Coronal CT section showing a pleomorphic salivary adenoma of the deep parotid lobe bulging into the nasopharynx and depressing the soft palate (arrows). Note the way the pharyngeal muscles are displaced medially by a well-defined mass, indicating that this adenoma did not arise from an accessory pharyngeal salivary gland.
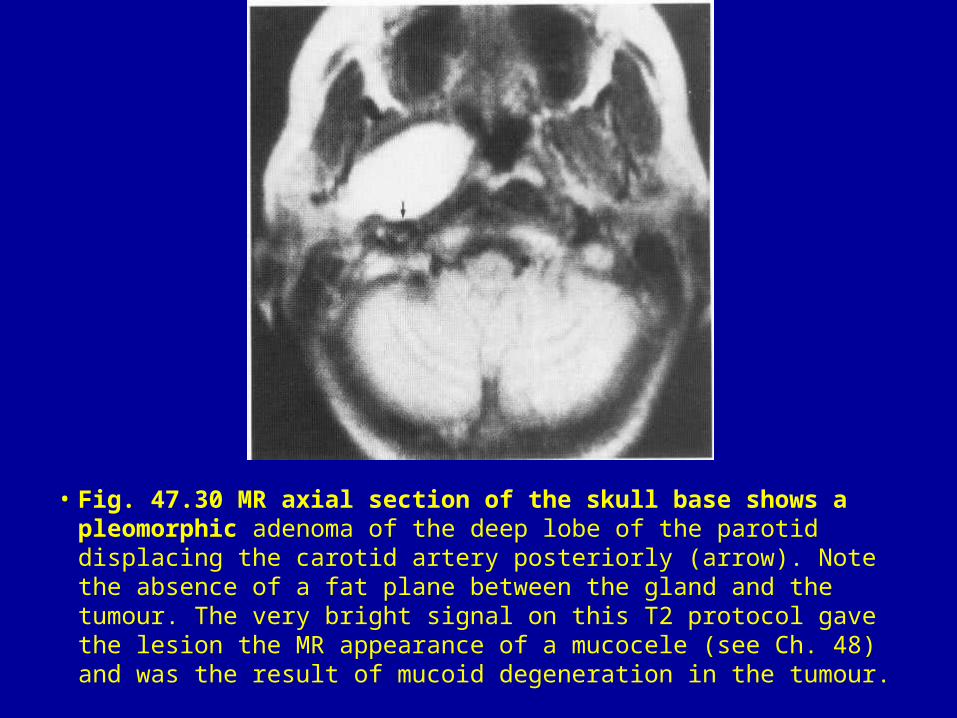
• Fig. 47.30 MR axial section of the skull base shows a pleomorphic adenoma of the deep lobe of the parotid displacing the carotid artery posteriorly (arrow). Note the absence of a fat plane between the gland and the tumour. The very bright signal on this T2 protocol gave the lesion the MR appearance of a mucocele (see Ch. 48) and was the result of mucoid degeneration in the tumour.
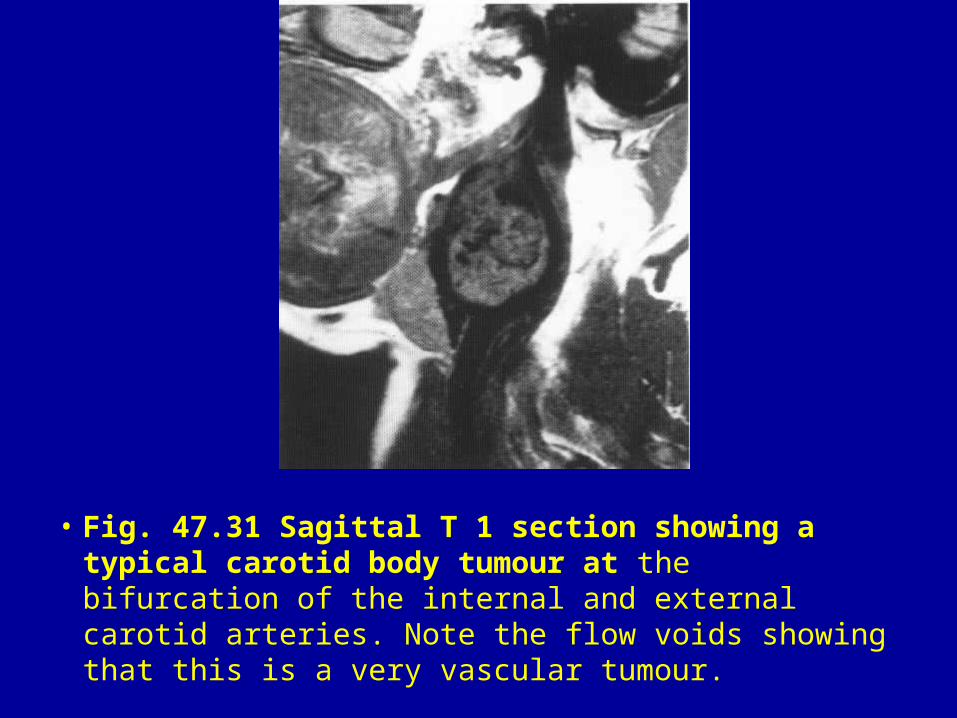
• Fig. 47.31 Sagittal T 1 section showing a typical carotid body tumour at the bifurcation of the internal and external carotid arteries. Note the flow voids showing that this is a very vascular tumour.
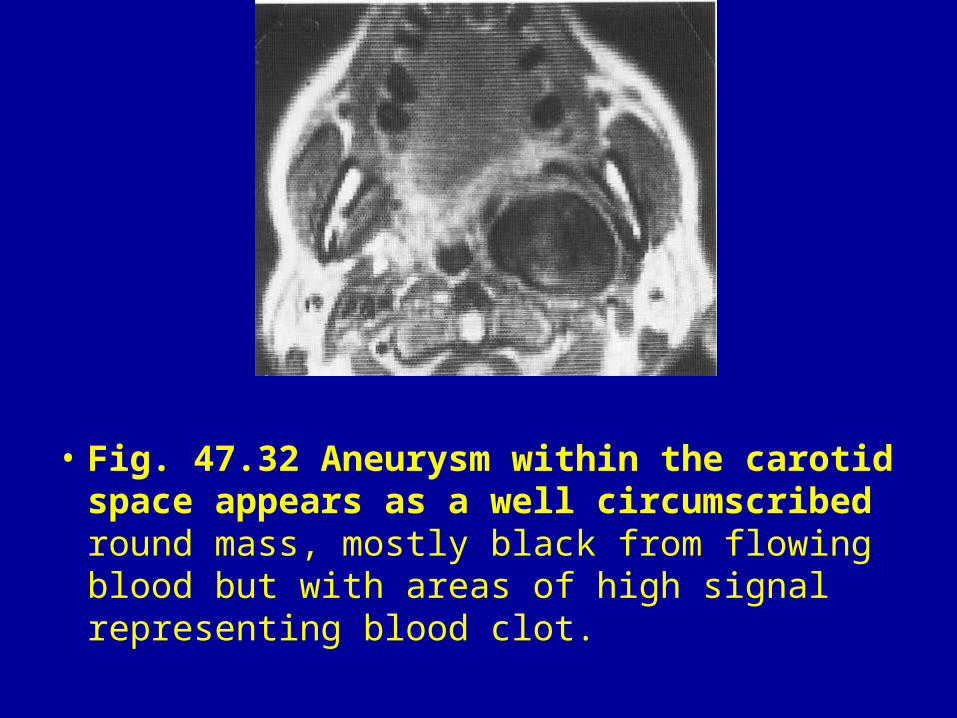
• Fig. 47.32 Aneurysm within the carotid space appears as a well circumscribed round mass, mostly black from flowing blood but with areas of high signal representing blood clot.
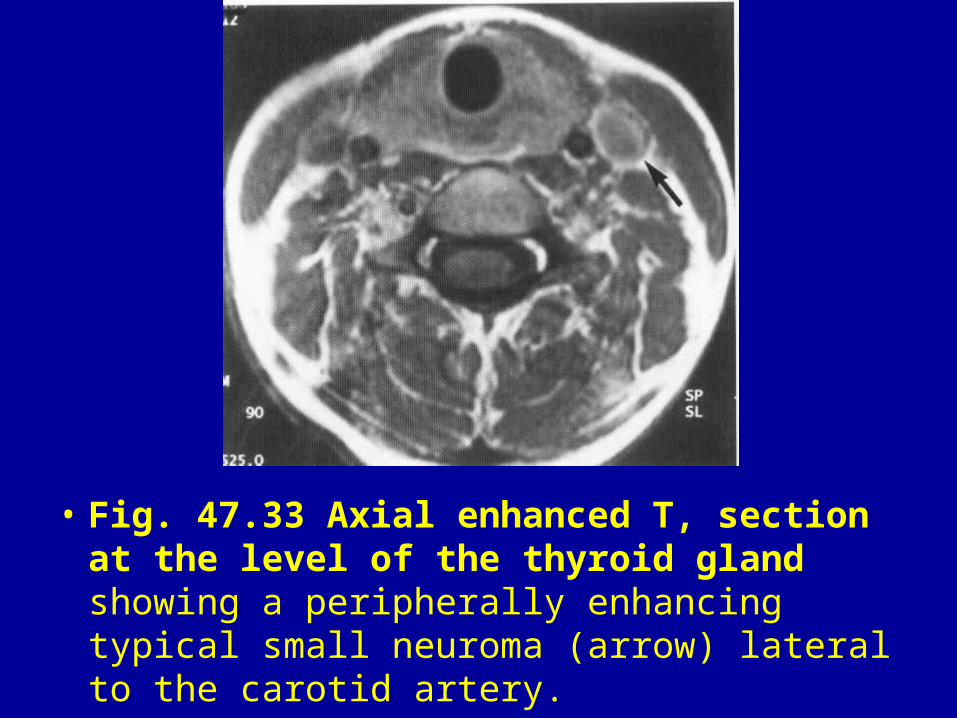
• Fig. 47.33 Axial enhanced T, section at the level of the thyroid gland showing a peripherally enhancing typical small neuroma (arrow) lateral to the carotid artery.
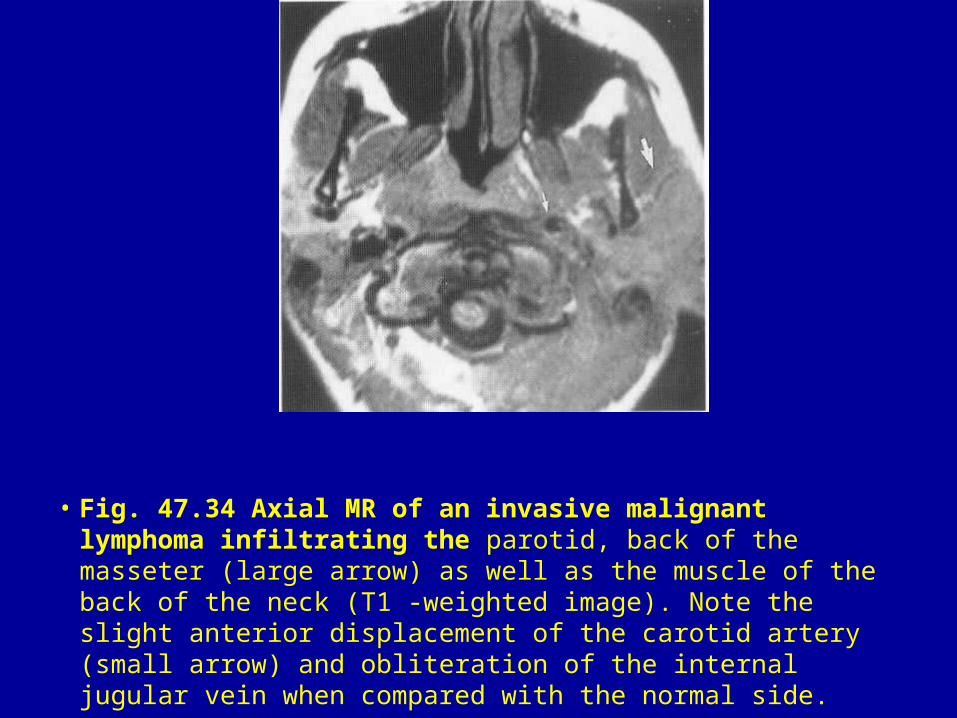
• Fig. 47.34 Axial MR of an invasive malignant lymphoma infiltrating the parotid, back of the masseter (large arrow) as well as the muscle of the back of the neck (T1 -weighted image). Note the slight anterior displacement of the carotid artery (small arrow) and obliteration of the internal jugular vein when compared with the normal side.
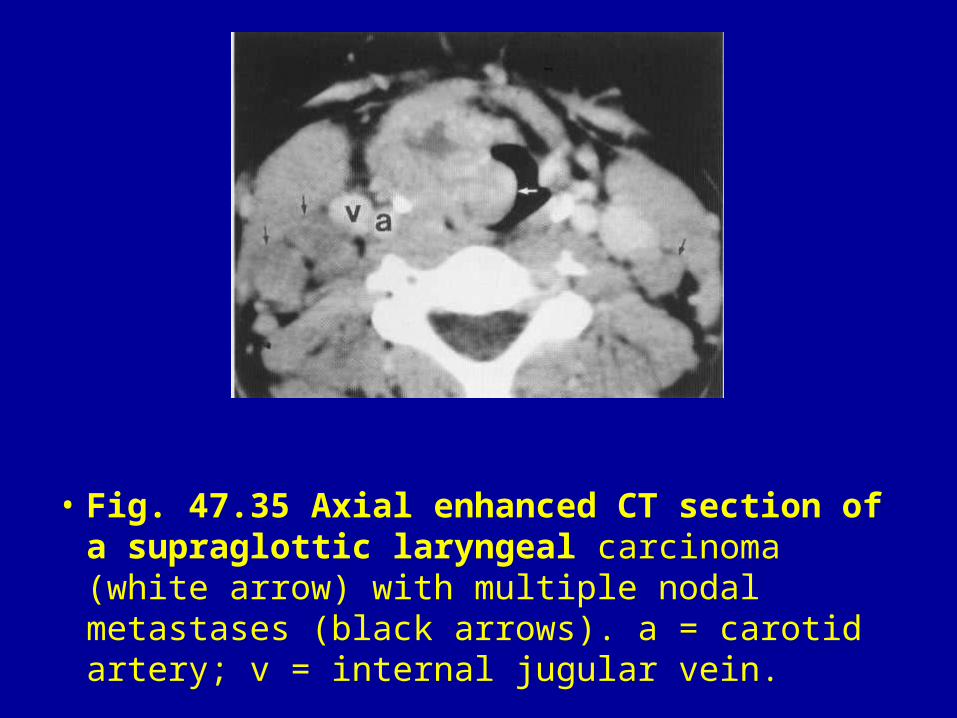
• Fig. 47.35 Axial enhanced CT section of a supraglottic laryngeal carcinoma (white arrow) with multiple nodal metastases (black arrows). a = carotid artery; v = internal jugular vein.
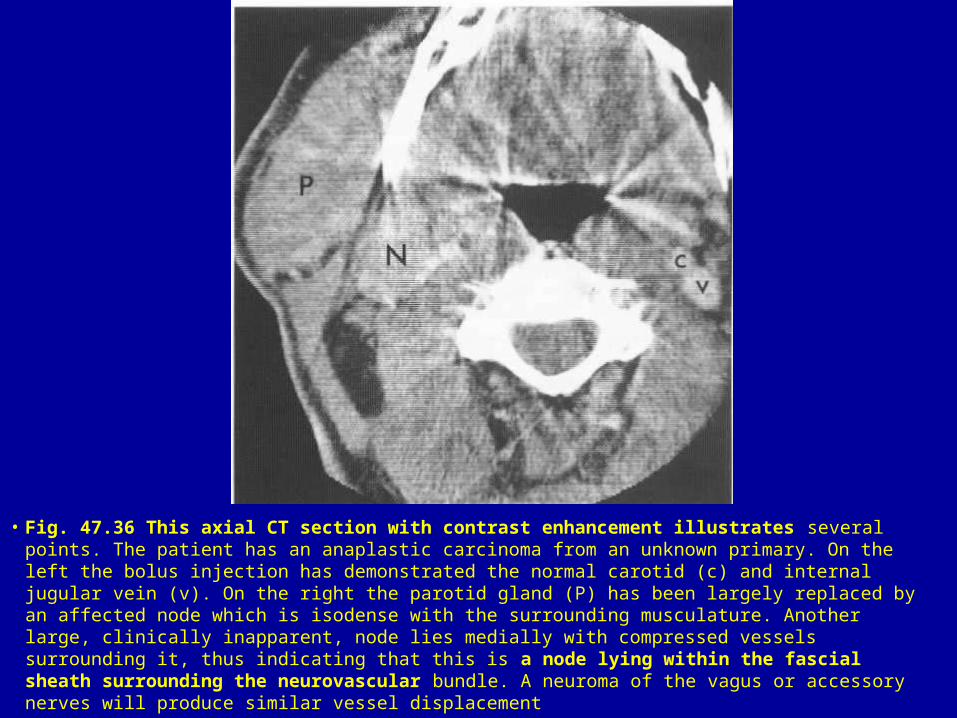
• Fig. 47.36 This axial CT section with contrast enhancement illustrates several points. The patient has an anaplastic carcinoma from an unknown primary. On the left the bolus injection has demonstrated the normal carotid (c) and internal jugular vein (v). On the right the parotid gland (P) has been largely replaced by an affected node which is isodense with the surrounding musculature. Another large, clinically inapparent, node lies medially with compressed vessels surrounding it, thus indicating that this is a node lying within the fascial sheath surrounding the neurovascular bundle. A neuroma of the vagus or accessory nerves will produce similar vessel displacement
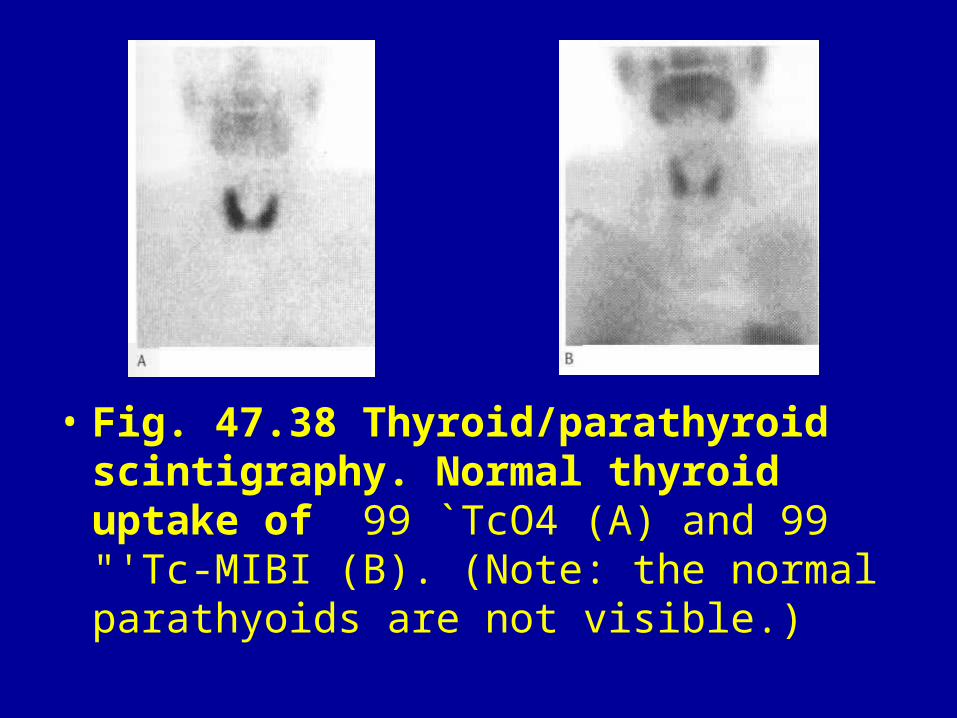
• Fig. 47.38 Thyroid/parathyroid scintigraphy. Normal thyroid uptake of 99 `TcO4 (A) and 99 "'Tc-MIBI (B). (Note: the normal parathyoids are not visible.)
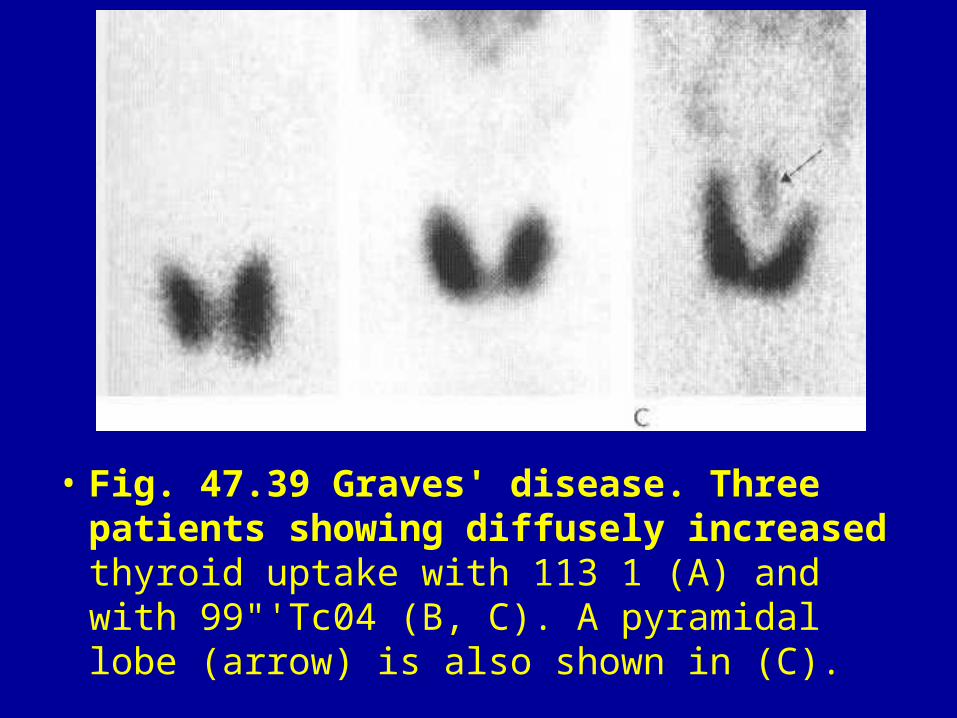
• Fig. 47.39 Graves' disease. Three patients showing diffusely increased thyroid uptake with 113 1 (A) and with 99"'Tc04 (B, C). A pyramidal lobe (arrow) is also shown in (C).
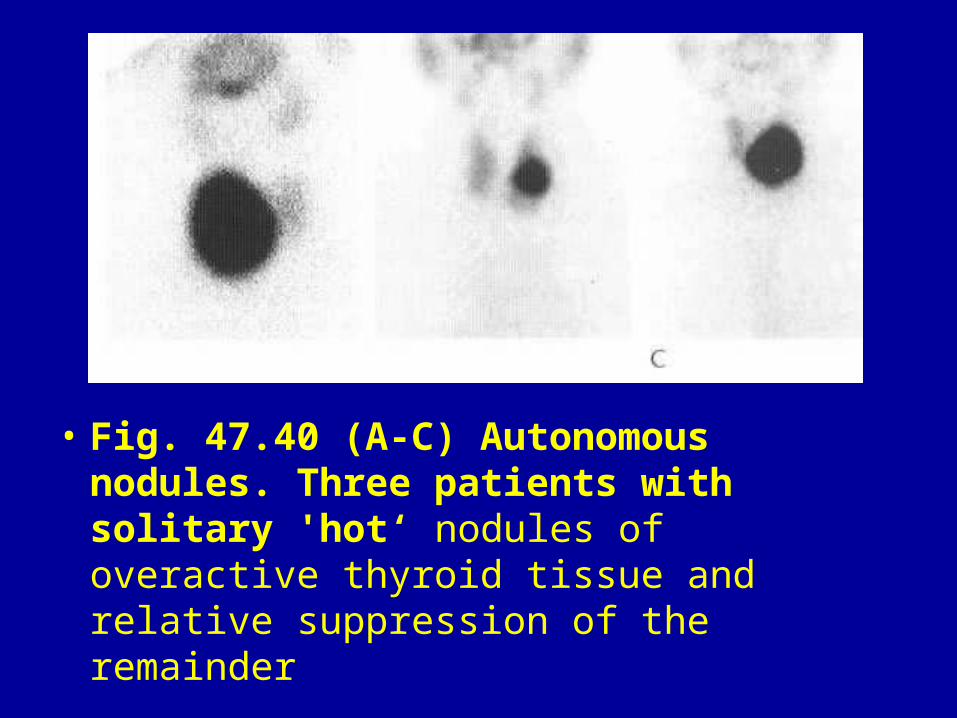
• Fig. 47.40 (A-C) Autonomous nodules. Three patients with solitary 'hot‘ nodules of overactive thyroid tissue and relative suppression of the remainder
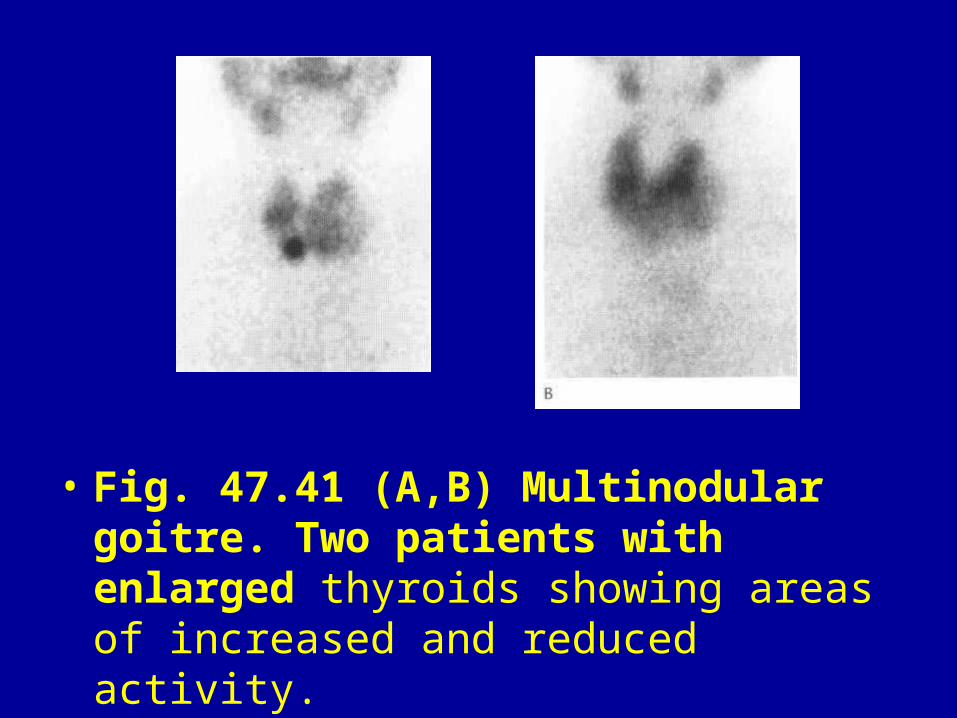
• Fig. 47.41 (A,B) Multinodular goitre. Two patients with enlarged thyroids showing areas of increased and reduced activity.
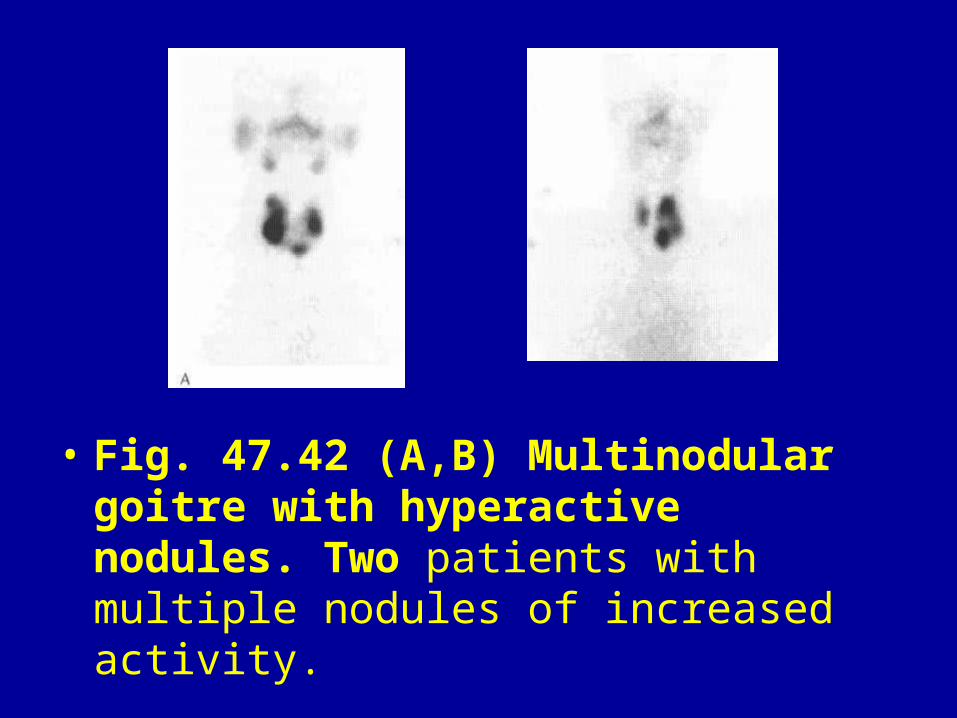
• Fig. 47.42 (A,B) Multinodular goitre with hyperactive nodules. Two patients with multiple nodules of increased activity.
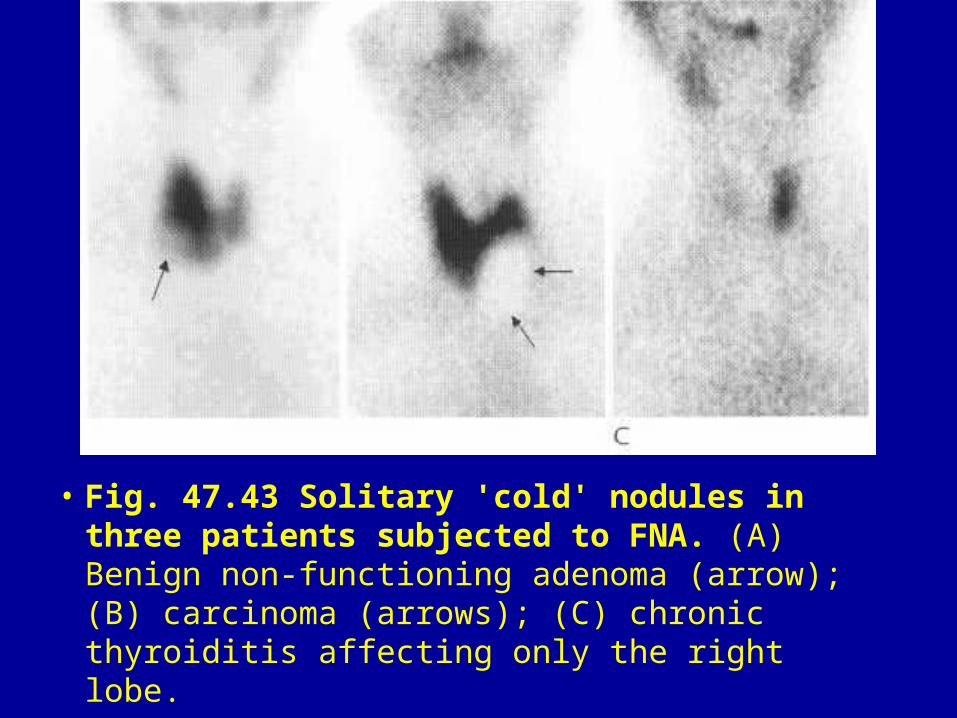
• Fig. 47.43 Solitary 'cold' nodules in three patients subjected to FNA. (A) Benign non-functioning adenoma (arrow); (B) carcinoma (arrows); (C) chronic thyroiditis affecting only the right lobe.
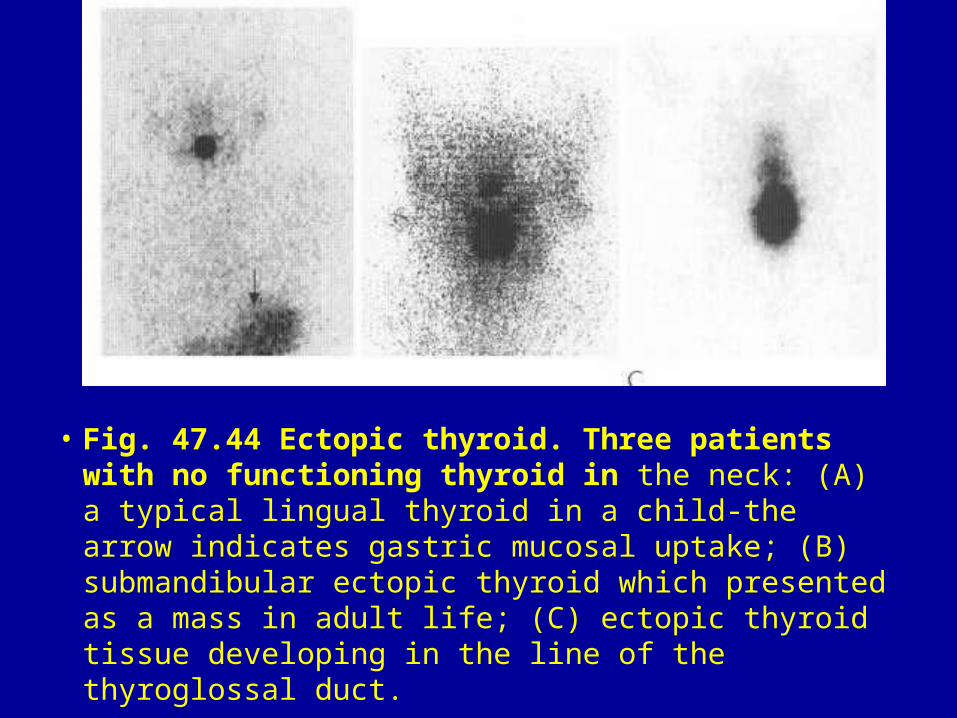
• Fig. 47.44 Ectopic thyroid. Three patients with no functioning thyroid in the neck: (A) a typical lingual thyroid in a child-the arrow indicates gastric mucosal uptake; (B) submandibular ectopic thyroid which presented as a mass in adult life; (C) ectopic thyroid tissue developing in the line of the thyroglossal duct.
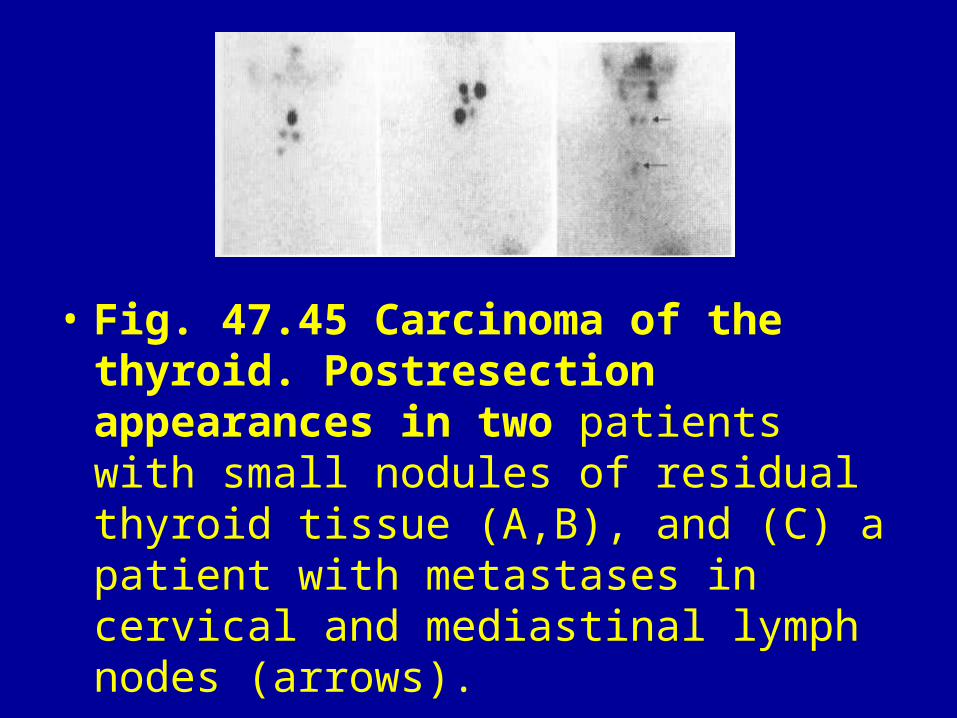
• Fig. 47.45 Carcinoma of the thyroid. Postresection appearances in two patients with small nodules of residual thyroid tissue (A,B), and (C) a patient with metastases in cervical and mediastinal lymph nodes (arrows).

• Fig. 47.46 Parathyroid adenoma. 99 "'Tc-MIBI images at 10 min (A) and 3 h (B) showing a persistent focus of activity inferior to the right lobe of the thyroid; °°^'TcO, image (C) shows normal thyroid uptake but the adenoma is not visualised.
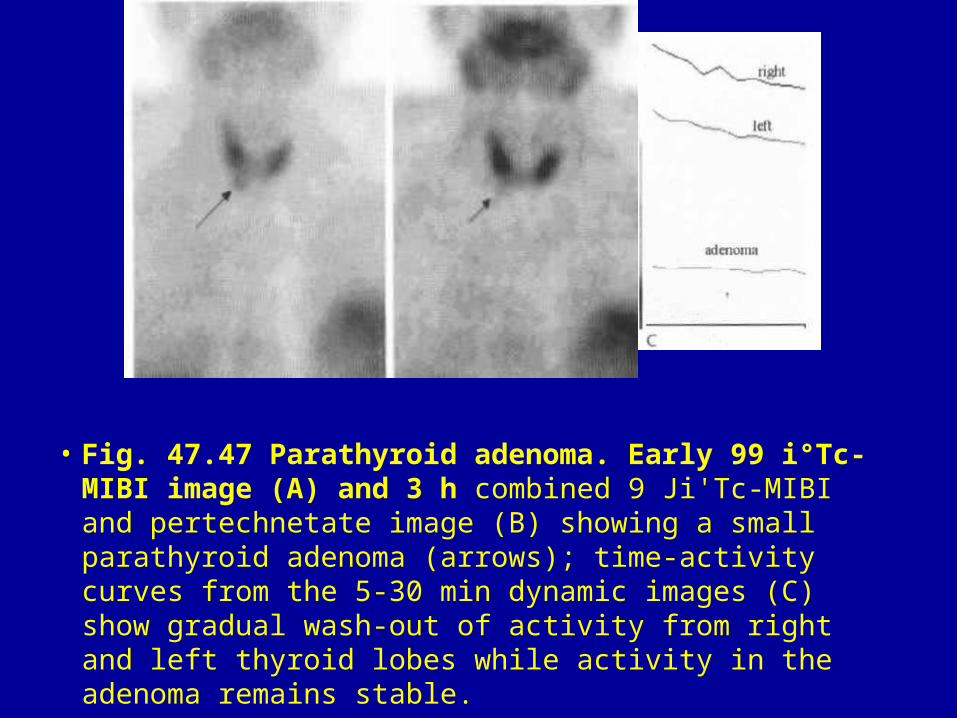
• Fig. 47.47 Parathyroid adenoma. Early 99 i°Tc-MIBI image (A) and 3 h combined 9 Ji'Tc-MIBI and pertechnetate image (B) showing a small parathyroid adenoma (arrows); time-activity curves from the 5-30 min dynamic images (C) show gradual wash-out of activity from right and left thyroid lobes while activity in the adenoma remains stable.
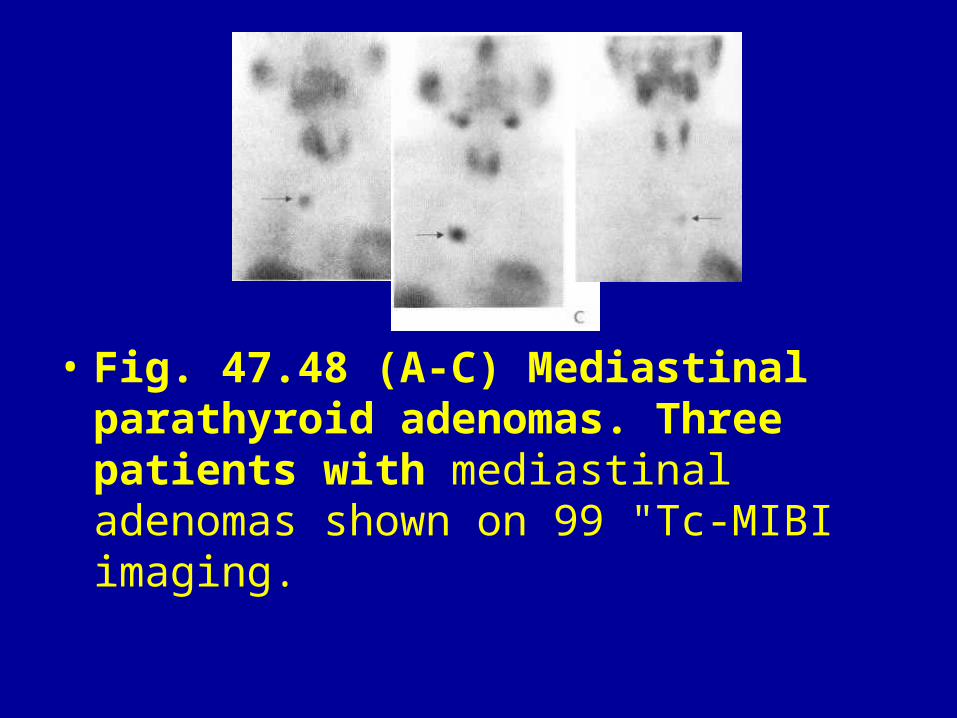
• Fig. 47.48 (A-C) Mediastinal parathyroid adenomas. Three patients with mediastinal adenomas shown on 99 "Tc-MIBI imaging.
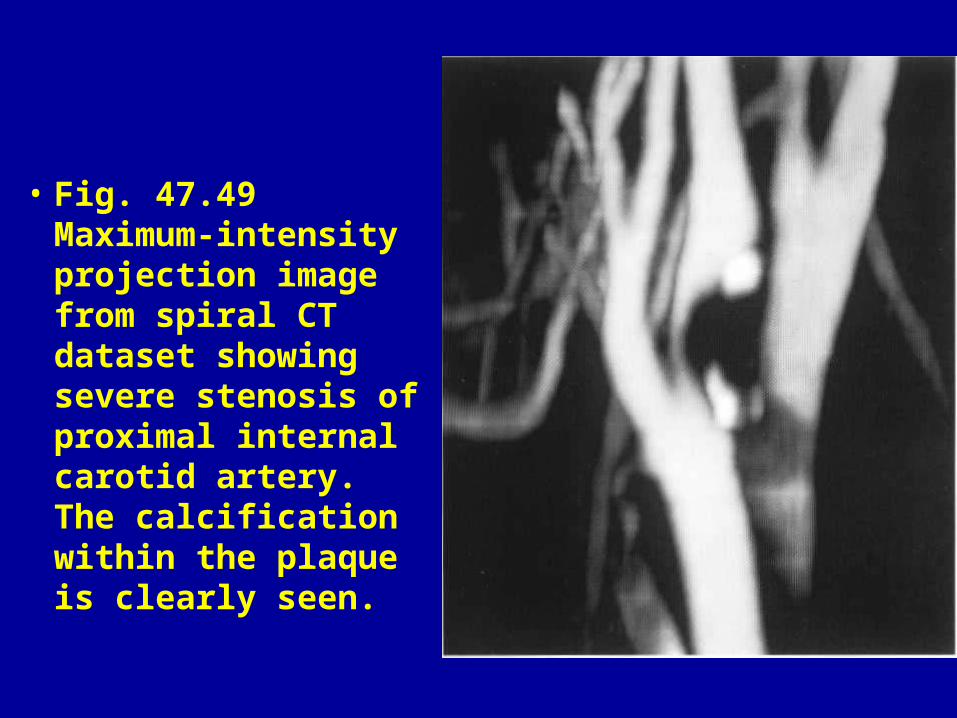
• Fig. 47.49 Maximum-intensity projection image from spiral CT dataset showing severe stenosis of proximal internal carotid artery. The calcification within the plaque is clearly seen.
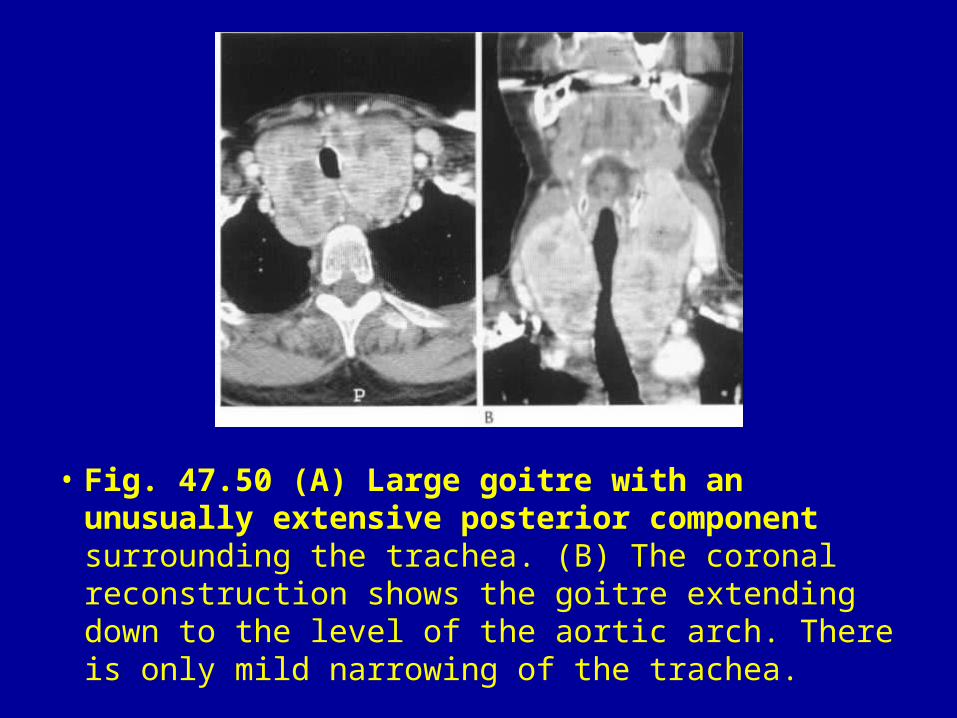
• Fig. 47.50 (A) Large goitre with an unusually extensive posterior component surrounding the trachea. (B) The coronal reconstruction shows the goitre extending down to the level of the aortic arch. There is only mild narrowing of the trachea.
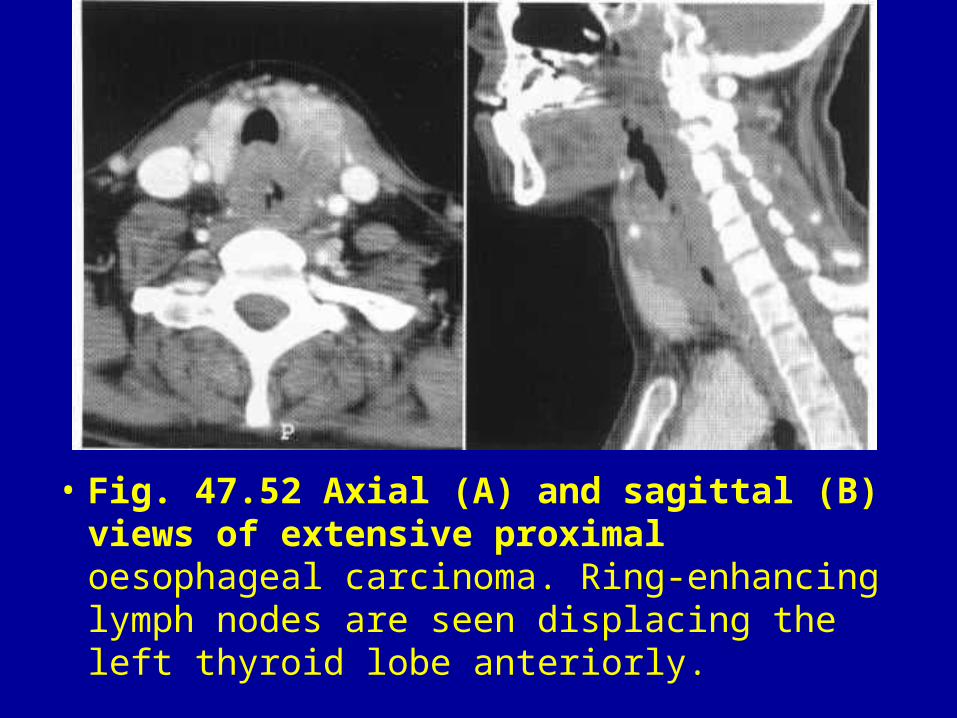
• Fig. 47.52 Axial (A) and sagittal (B) views of extensive proximal oesophageal carcinoma. Ring-enhancing lymph nodes are seen displacing the left thyroid lobe anteriorly.
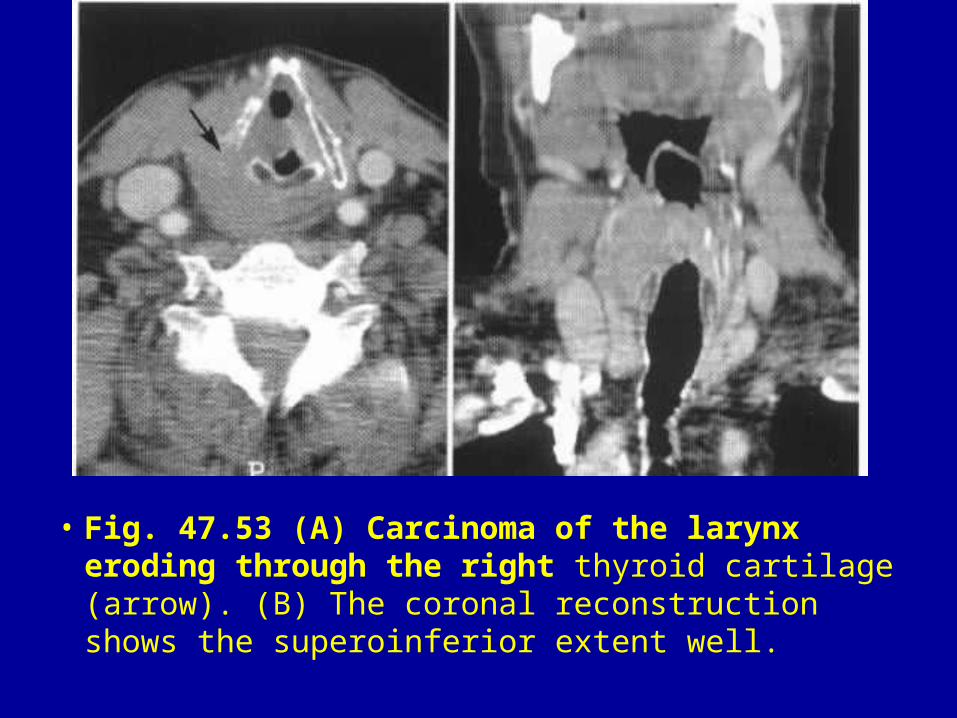
• Fig. 47.53 (A) Carcinoma of the larynx eroding through the right thyroid cartilage (arrow). (B) The coronal reconstruction shows the superoinferior extent well.
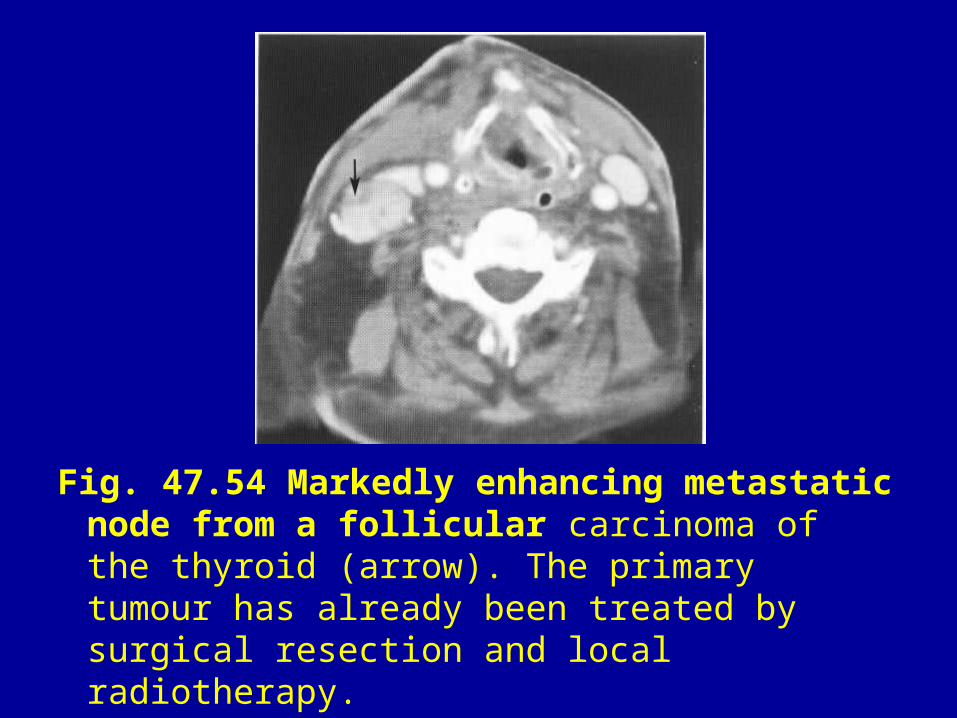
Fig. 47.54 Markedly enhancing metastatic node from a follicular carcinoma of the thyroid (arrow). The primary tumour has already been treated by surgical resection and local radiotherapy.
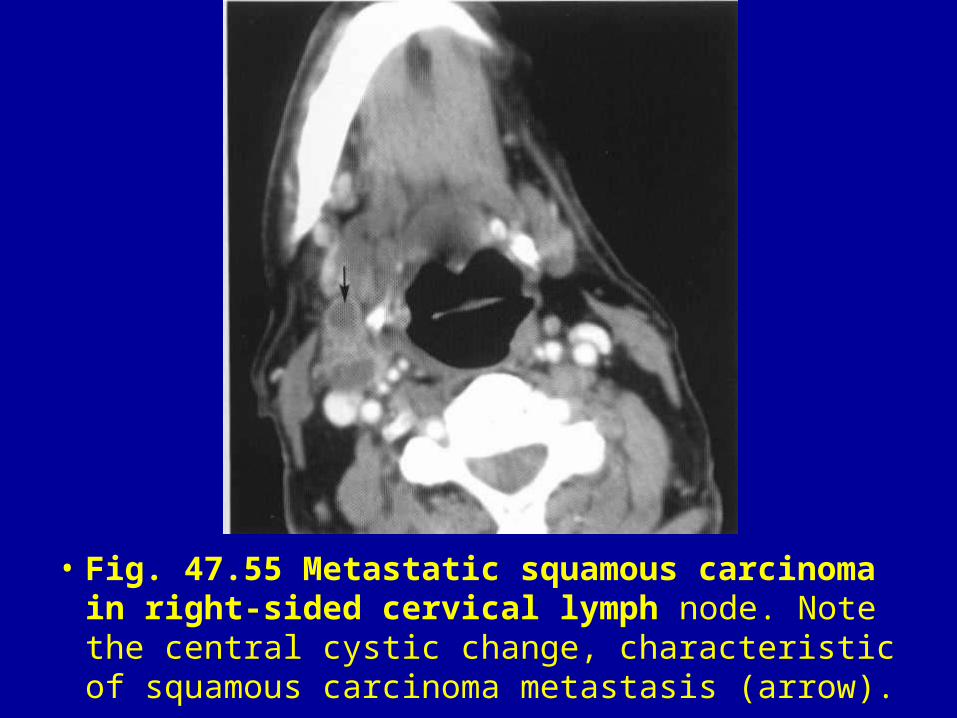
• Fig. 47.55 Metastatic squamous carcinoma in right-sided cervical lymph node. Note the central cystic change, characteristic of squamous carcinoma metastasis (arrow).
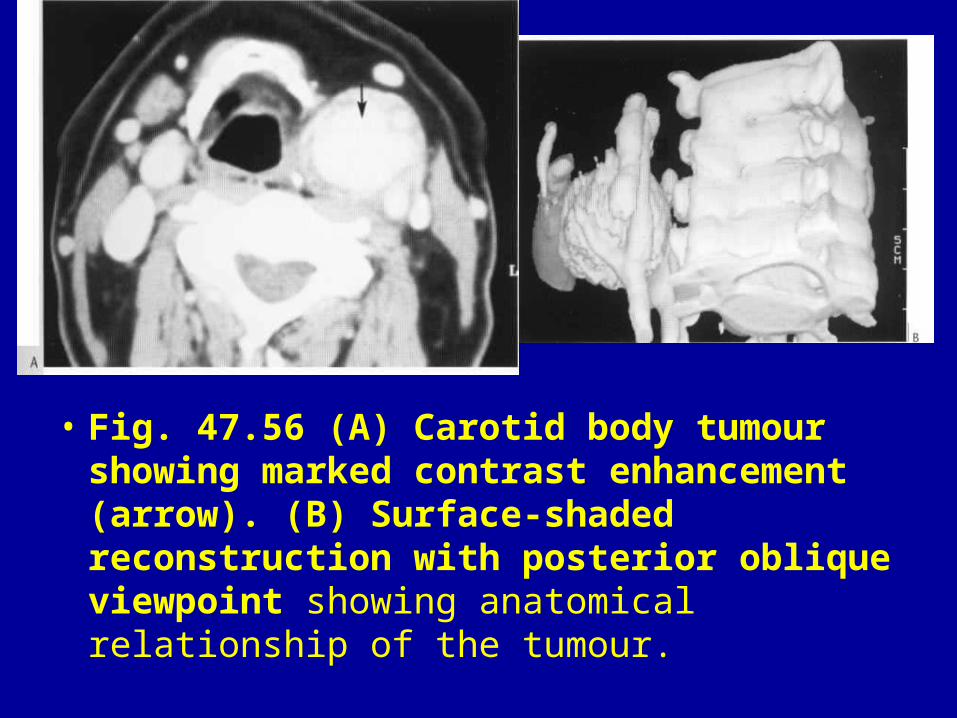
• Fig. 47.56 (A) Carotid body tumour showing marked contrast enhancement (arrow). (B) Surface-shaded reconstruction with posterior oblique viewpoint showing anatomical relationship of the tumour.
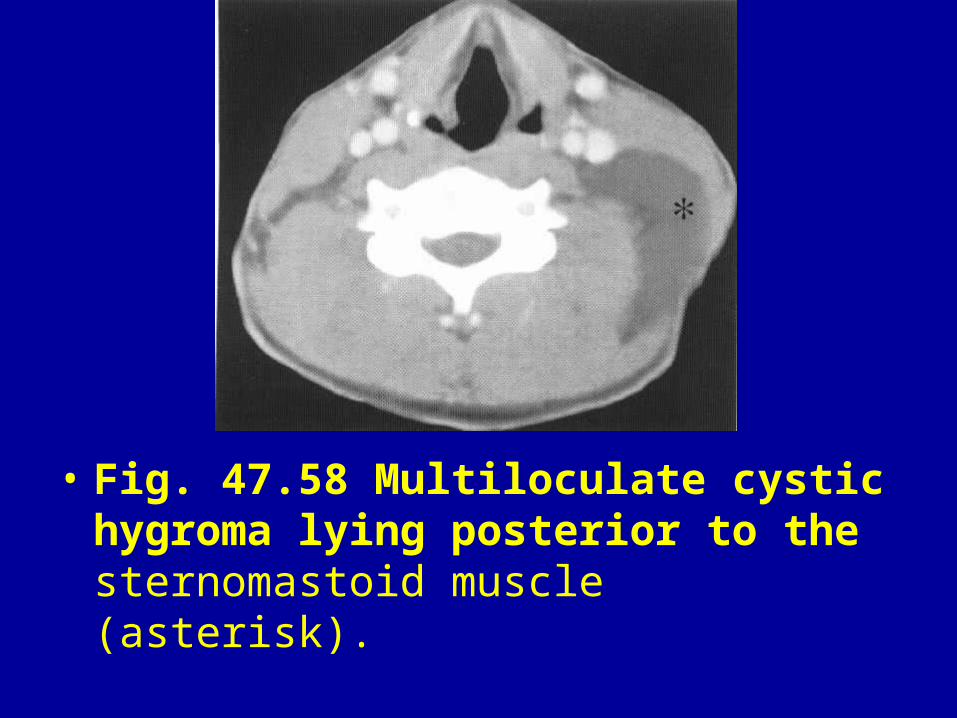
• Fig. 47.58 Multiloculate cystic hygroma lying posterior to the sternomastoid muscle (asterisk).
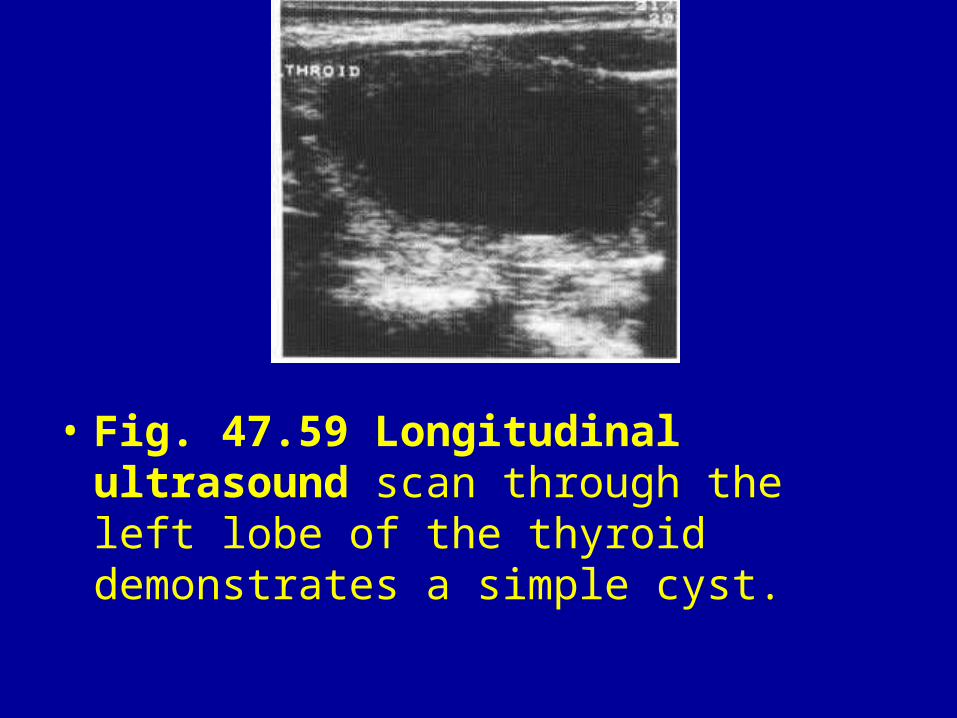
• Fig. 47.59 Longitudinal ultrasound scan through the left lobe of the thyroid demonstrates a simple cyst.
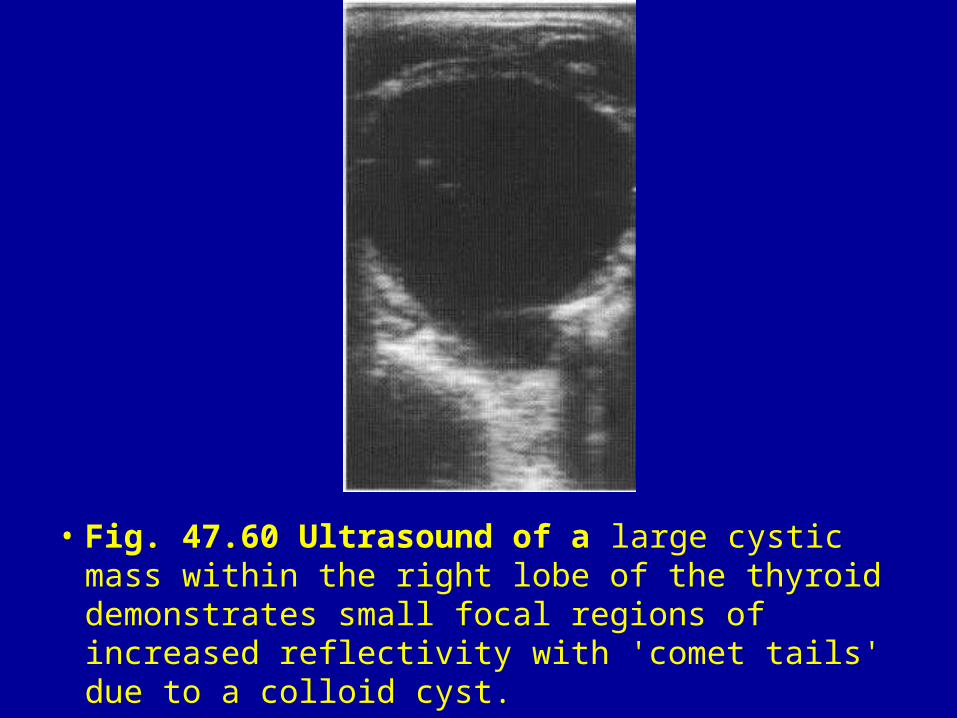
• Fig. 47.60 Ultrasound of a large cystic mass within the right lobe of the thyroid demonstrates small focal regions of increased reflectivity with 'comet tails' due to a colloid cyst.
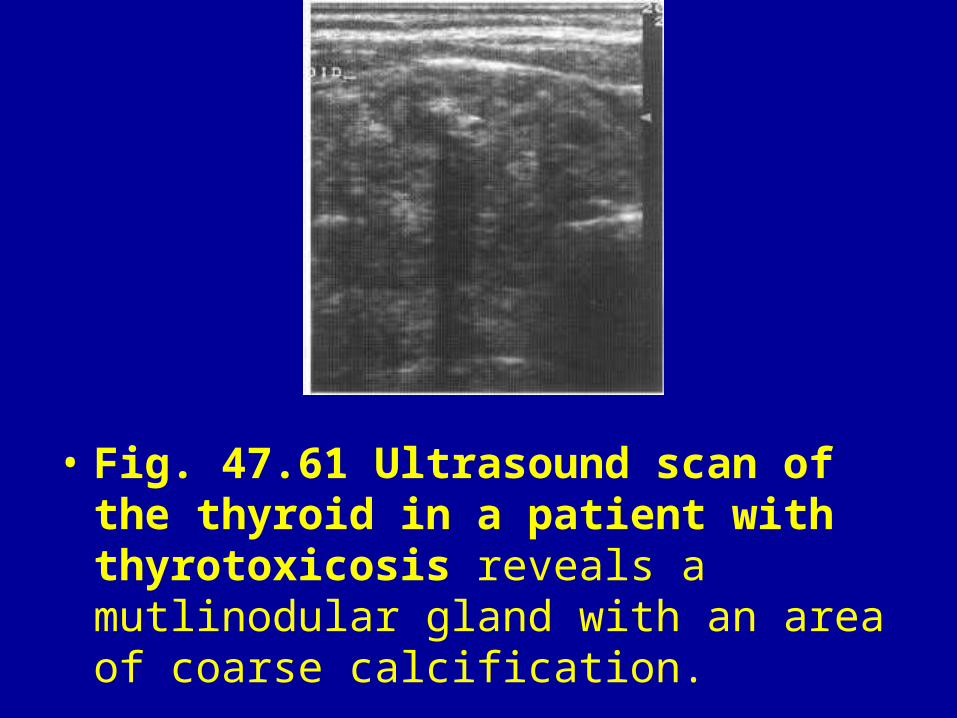
• Fig. 47.61 Ultrasound scan of the thyroid in a patient with thyrotoxicosis reveals a mutlinodular gland with an area of coarse calcification.
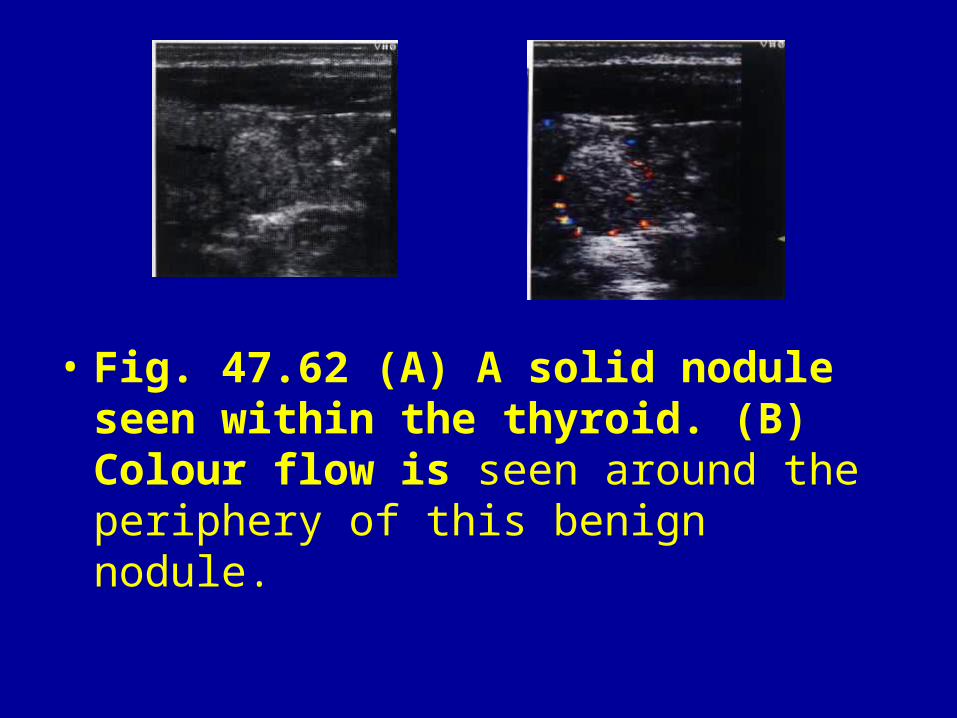
• Fig. 47.62 (A) A solid nodule seen within the thyroid. (B) Colour flow is seen around the periphery of this benign nodule.
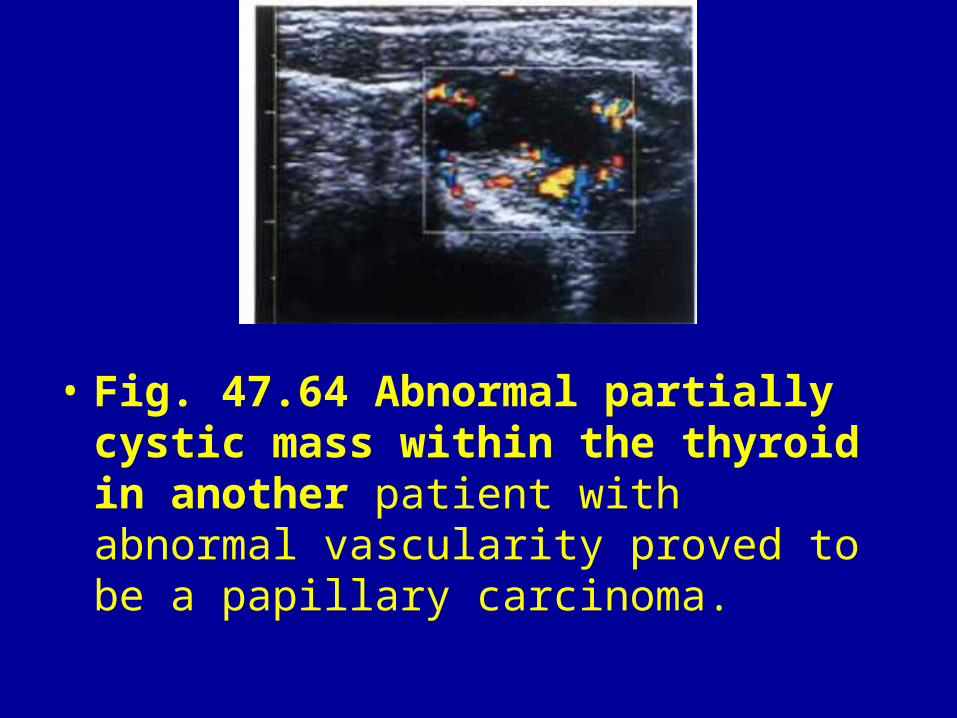
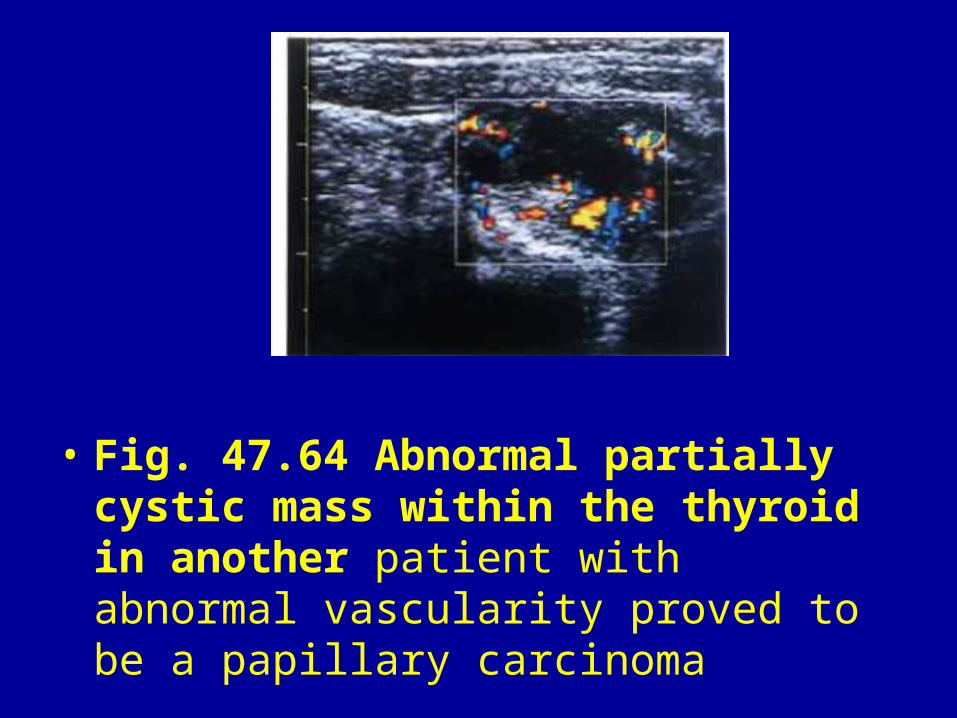
• Fig. 47.64 Abnormal partially cystic mass within the thyroid in another patient with abnormal vascularity proved to be a papillary carcinoma.
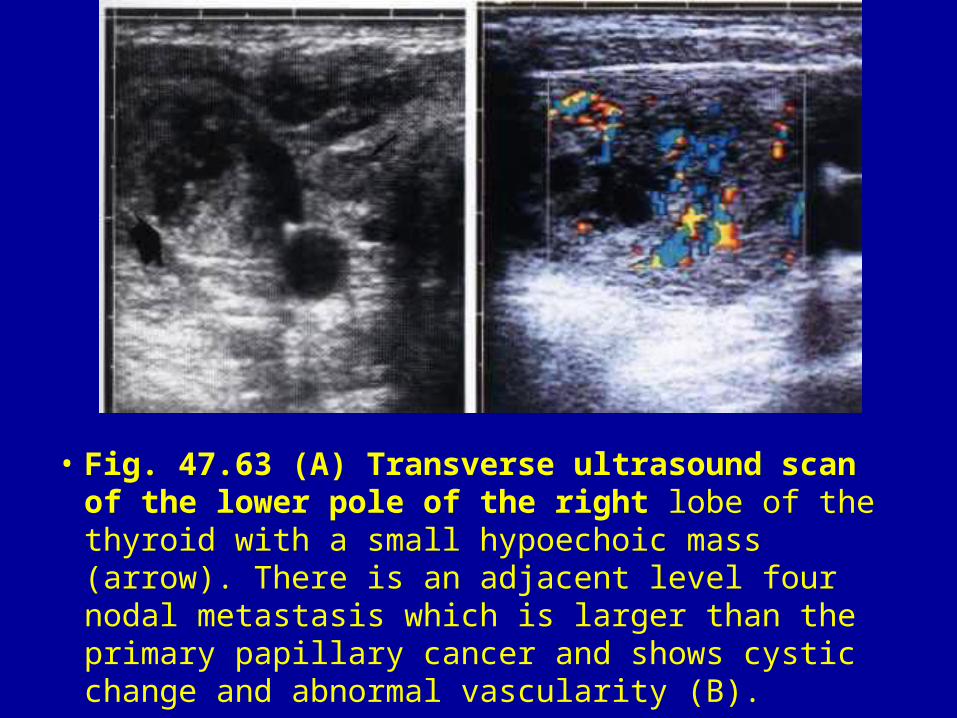
• Fig. 47.63 (A) Transverse ultrasound scan of the lower pole of the right lobe of the thyroid with a small hypoechoic mass (arrow). There is an adjacent level four nodal metastasis which is larger than the primary papillary cancer and shows cystic change and abnormal vascularity (B).
• Fig. 47.64 Abnormal partially cystic mass within the thyroid in another patient with abnormal vascularity proved to be a papillary carcinoma
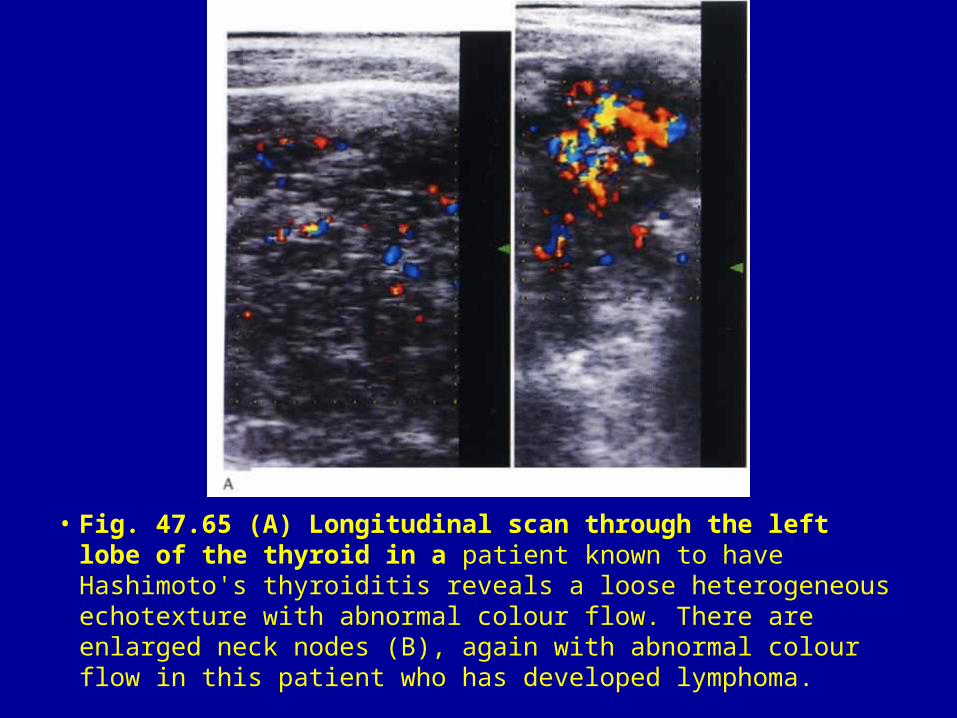
• Fig. 47.65 (A) Longitudinal scan through the left lobe of the thyroid in a patient known to have Hashimoto's thyroiditis reveals a loose heterogeneous echotexture with abnormal colour flow. There are enlarged neck nodes (B), again with abnormal colour flow in this patient who has developed lymphoma.
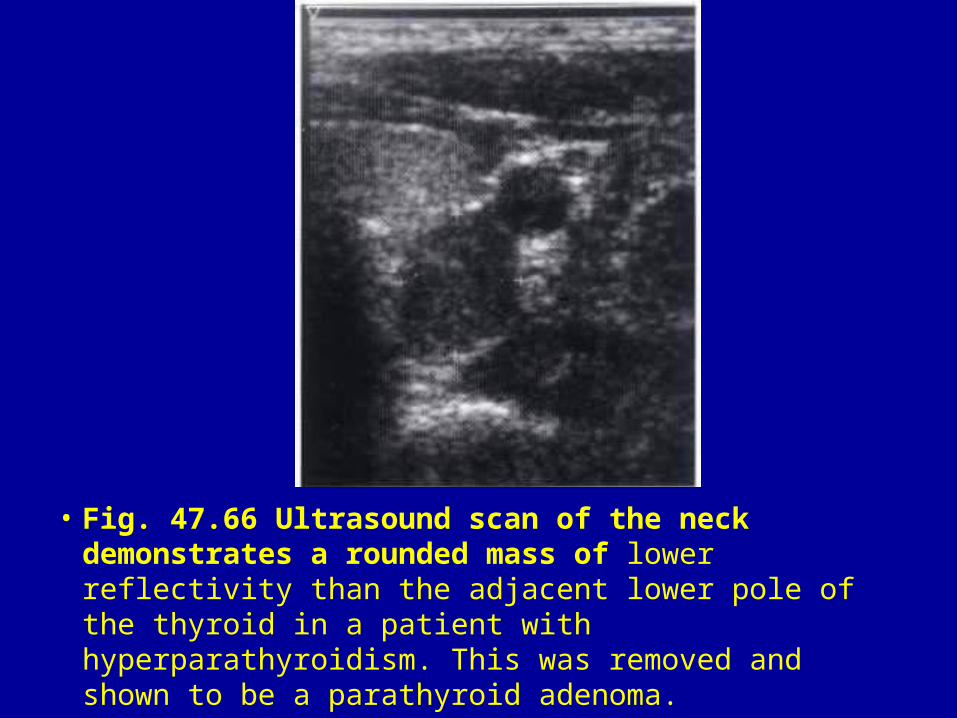
• Fig. 47.66 Ultrasound scan of the neck demonstrates a rounded mass of lower reflectivity than the adjacent lower pole of the thyroid in a patient with hyperparathyroidism. This was removed and shown to be a parathyroid adenoma.
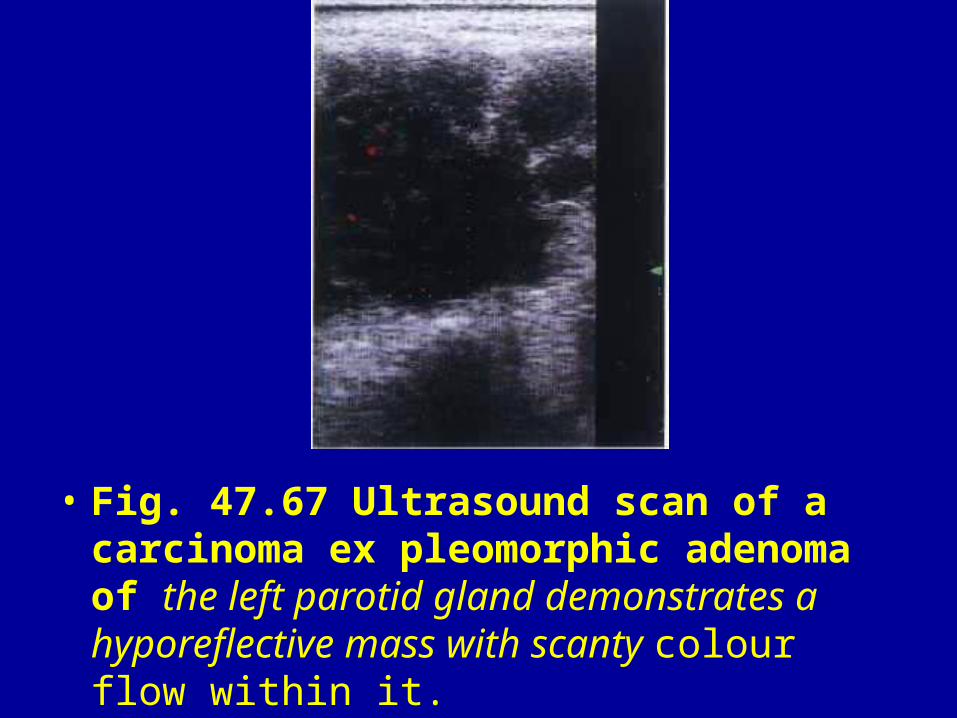
• Fig. 47.67 Ultrasound scan of a carcinoma ex pleomorphic adenoma of the left parotid gland demonstrates a hyporeflective mass with scanty colour flow within it.
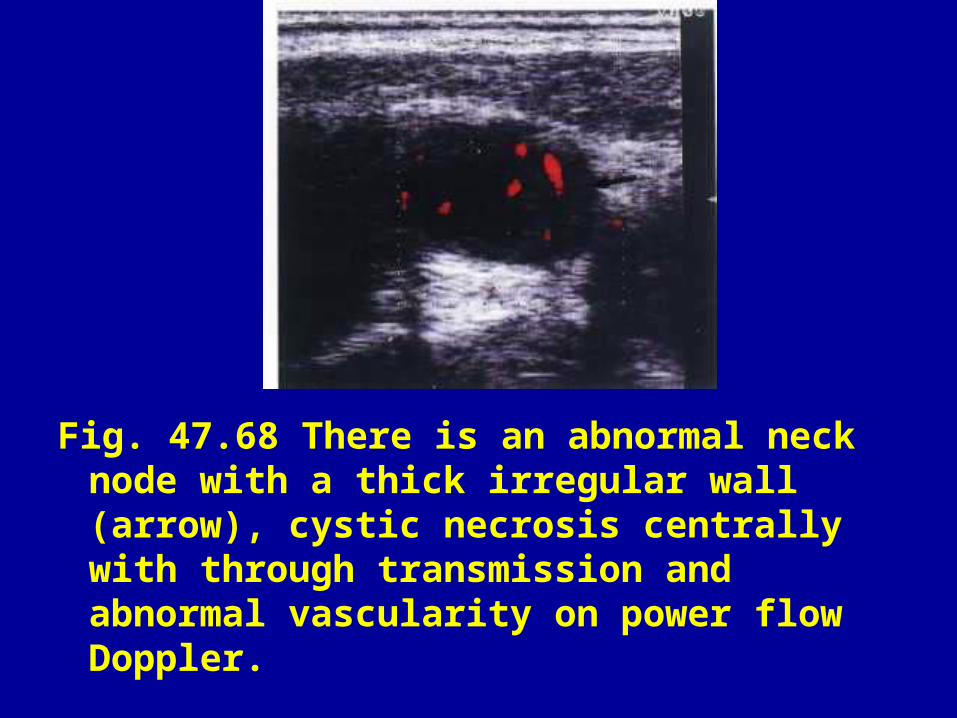
Fig. 47.68 There is an abnormal neck node with a thick irregular wall (arrow), cystic necrosis centrally with through transmission and abnormal vascularity on power flow Doppler.
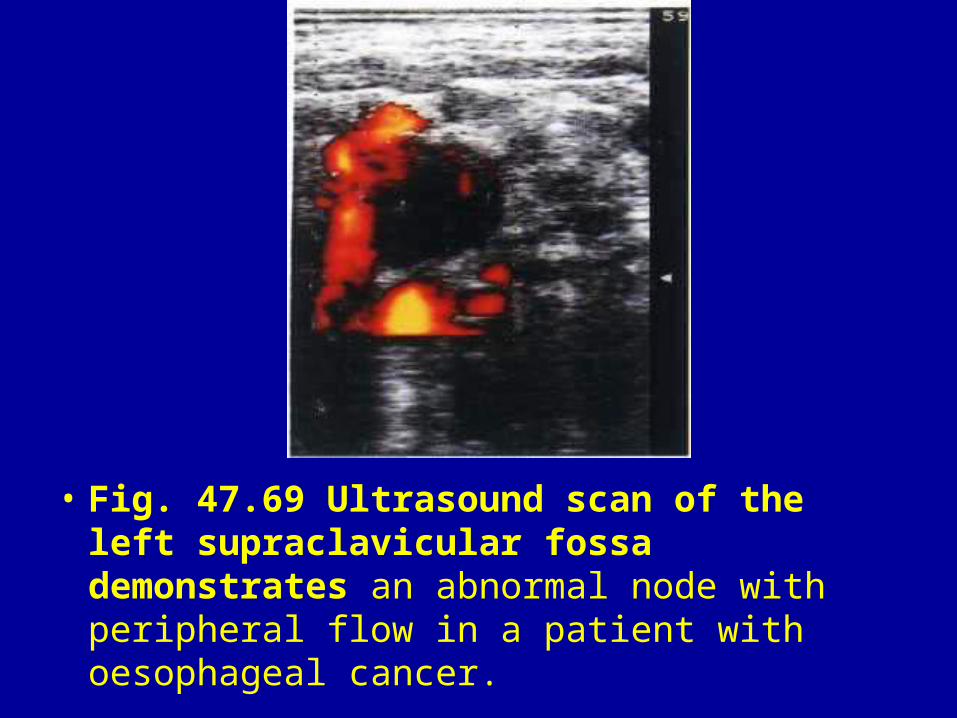
• Fig. 47.69 Ultrasound scan of the left supraclavicular fossa demonstrates an abnormal node with peripheral flow in a patient with oesophageal cancer.
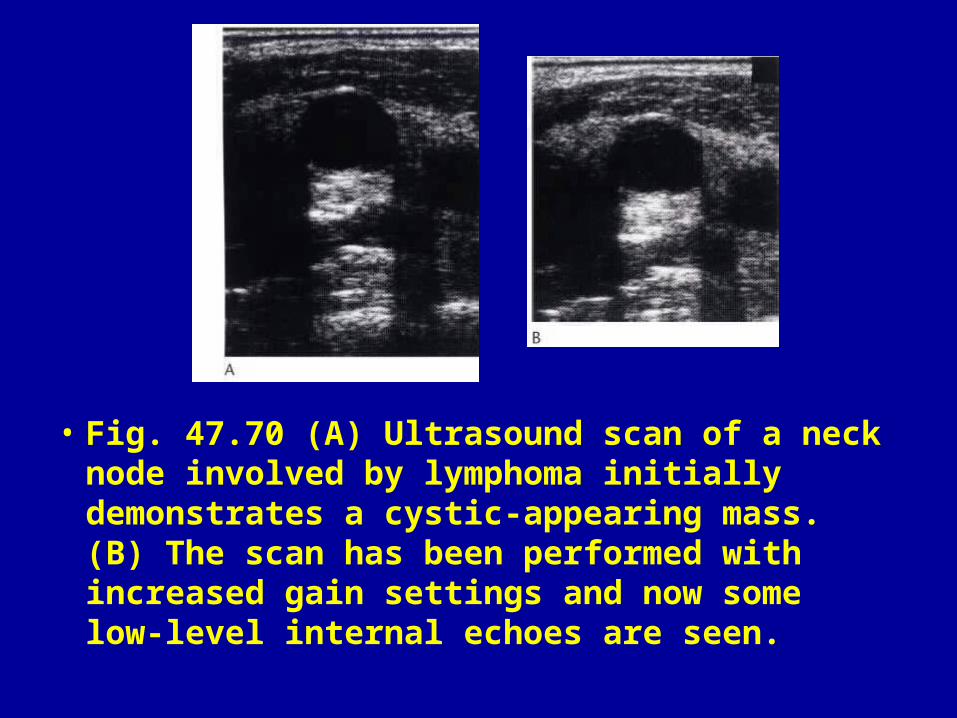
• Fig. 47.70 (A) Ultrasound scan of a neck node involved by lymphoma initially demonstrates a cystic-appearing mass. (B) The scan has been performed with increased gain settings and now some low-level internal echoes are seen.
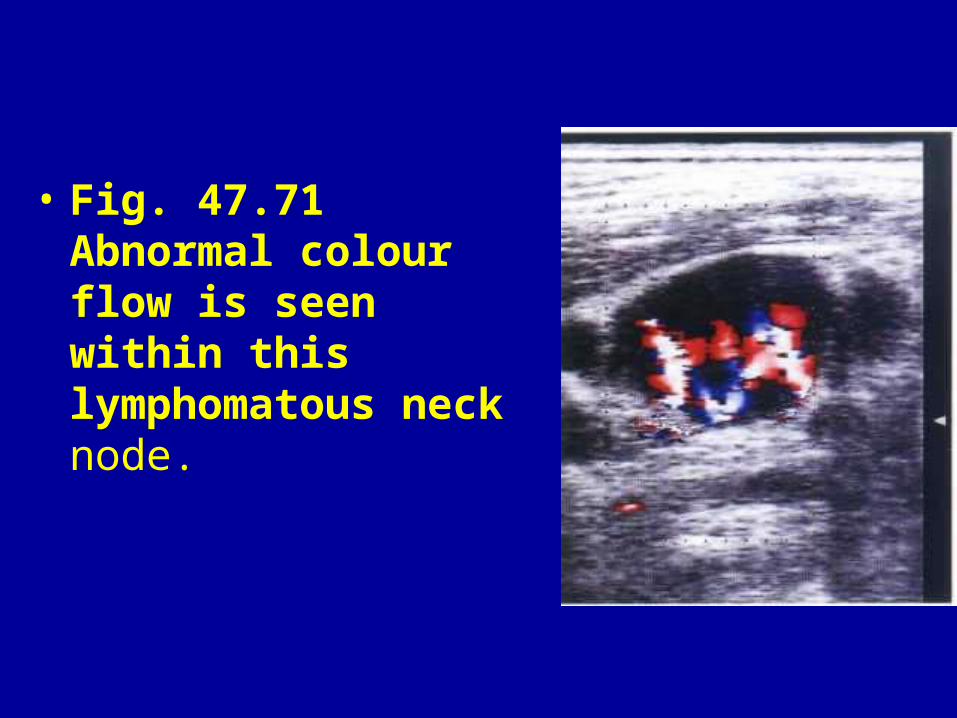
• Fig. 47.71 Abnormal colour flow is seen within this lymphomatous neck node.


