46,000 SQUARE FOOT RETAIL BUILDING AVAILABLE FOR...
23
Northridge, California 46,000 SQUARE FOOT RETAIL BUILDING AVAILABLE FOR SALE 8700 T A NEC T A d P th i St N th id CA The subject offering is a highly visible freestanding retail building located on a major signalized corner adjacent to Costco and situated amongst numerous regional and national retailers including Best Buy, Office Max, 24 Hour Fitness, Bed Bath & Beyond, Target, Kohl’s, Lowes and Northridge Fashion Center a 1.5 million Sq. Ft. regional mall. INVESTMENT SUMMARY 8700 T ampa Ave. NEC T ampa Ave. and Parthenia St. Northridge, CA Location: 8700 Tampa Ave., Northridge, CA NEC Tampa Ave. & Parthenia St. Offering Price: Best Offer Building GLA: 46,000 Sq.Ft. (44,199 Sq.Ft. ground floor +1,827 Sq.Ft. of mezz.) Land Area: 2.63 Acres APN#: 2784-003-061 Zoning: MR2-1VL and P-1VL Zoning: MR2 1VL and P 1VL Year Built: 1994 Construction: Concrete Block Parking: 187 Spaces Debt: Approx $6.5 Mil - 6.5% Fixed (due 4/1/2018) No Prepayment Penalty/Assumable Tenants: The existing tenant Sports Authority will be vacating on or before August 31, 2012 No warranty, express or implied, is made as to the accuracy of the information contained herein. This information is submitted subject to errors, omissions, change of price, rental or other conditions, withdrawal without notice, and is subject to any special listing conditions imposed by our principals. Cooperating brokers, buyers, tenants and other parties who receive this document should not rely on it, but should use it as a starting point of analysis, and should independently confirm the accuracy of the information contained herein through a due diligence review of the books, records, files and documents that constitute reliable sources of the information described herein. For information, please contact your exclusive listing agent: Steven H. Weiss Senior Vice President 818.905.2400 x134 [email protected] DRE Lic. #00680554 16001 Ventura Boulevard Suite 200 Encino, California 91436 fax 818 905 2400 www.naicapital.com
Transcript of 46,000 SQUARE FOOT RETAIL BUILDING AVAILABLE FOR...

Northridge, California
46,000 SQUARE FOOT RETAIL BUILDING AVAILABLE FOR SALE
8700 T A NEC T A d P th i St N th id CA
The subject offering is a highly visible freestanding retail building located on amajor signalized corner adjacent to Costco and situated amongst numerousregional and national retailers including Best Buy, Office Max, 24 Hour Fitness,Bed Bath & Beyond, Target, Kohl’s, Lowes and Northridge Fashion Center a1.5 million Sq. Ft. regional mall.
INVESTMENT SUMMARY
8700 Tampa Ave. NEC Tampa Ave. and Parthenia St. Northridge, CA
Location: 8700 Tampa Ave., Northridge, CA NEC Tampa Ave. & Parthenia St.
Offering Price: Best Offer
Building GLA: 46,000 Sq.Ft. (44,199 Sq.Ft. ground floor +1,827 Sq.Ft. of mezz.)
Land Area: 2.63 Acres
APN#: 2784-003-061
Zoning: MR2-1VL and P-1VLZoning: MR2 1VL and P 1VL
Year Built: 1994
Construction: Concrete Block
Parking: 187 Spaces
Debt: Approx $6.5 Mil - 6.5% Fixed (due 4/1/2018) No Prepayment Penalty/Assumable
Tenants: The existing tenant Sports Authority will be vacating on or before August 31, 2012
No warranty, express or implied, is made as to the accuracy of the information contained herein. This information is submitted subject to errors, omissions, change of price, rental or other conditions, withdrawal without notice, and is subject to any special listing conditions imposed by our principals. Cooperating brokers, buyers, tenants and other parties who receive this document should not rely on it, but should use it as a starting point of analysis, and should independently confirm the accuracy of the information contained herein through a due diligence review of the books, records, files and documents that constitute reliable sources of the information described herein.
For information, please contact your exclusive listing agent:
Steven H. WeissSenior Vice President818.905.2400 [email protected] Lic. #00680554
16001 Ventura BoulevardSuite 200Encino, California 91436fax 818 905 2400www.naicapital.com
8700 Tampa Ave. Northridge, California
46,000 SQUARE FOOT RETAIL BUILDING AVAILABLE FOR SALE
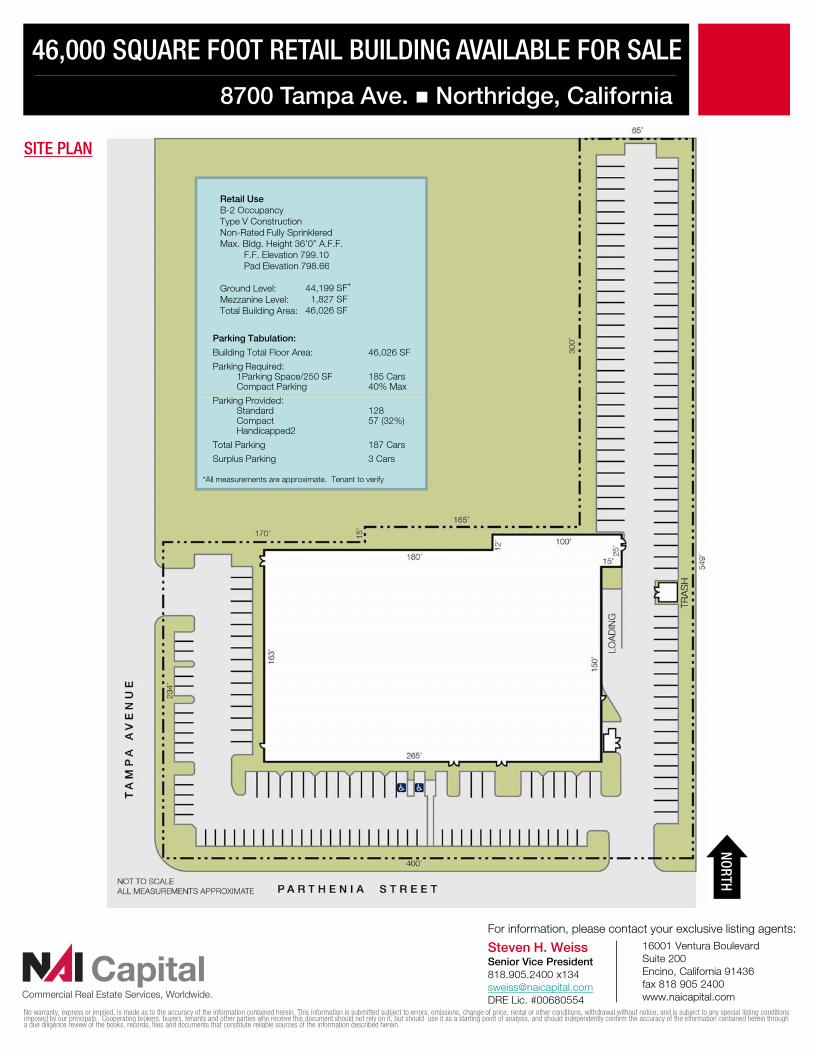
SITE PLAN
Retail UseB-2 OccupancyType V ConstructionNon-Rated Fully SprinkleredMax. Bldg. Height 36’0” A.F.F.
F.F. Elevation 799.10P d El ti 798 66Pad Elevation 798.66
Ground Level:Mezzanine Level:Total Building Area:
44,199 SF1,827 SF
46,026 SF
Parking Tabulation:
Building Total Floor Area: 46,026 SF
Parking Required:1Parking Space/250 SF 185 CarsCompact Parking 40% Max
*
Parking Provided:Standard 128Compact 57 (32%)Handicapped2
Total Parking 187 Cars
Surplus Parking 3 Cars
*All measurements are approximate. Tenant to verify
NORTH
No warranty, express or implied, is made as to the accuracy of the information contained herein. This information is submitted subject to errors, omissions, change of price, rental or other conditions, withdrawal without notice, and is subject to any special listing conditions imposed by our principals. Cooperating brokers, buyers, tenants and other parties who receive this document should not rely on it, but should use it as a starting point of analysis, and should independently confirm the accuracy of the information contained herein through a due diligence review of the books, records, files and documents that constitute reliable sources of the information described herein.
For information, please contact your exclusive listing agents:
Steven H. WeissSenior Vice President818.905.2400 [email protected] Lic. #00680554
16001 Ventura BoulevardSuite 200Encino, California 91436fax 818 905 2400www.naicapital.com

8700 Tampa Ave. Northridge, California
46,000 SQUARE FOOT RETAIL BUILDING AVAILABLE FOR SALE
PLAT MAP
*
No warranty, express or implied, is made as to the accuracy of the information contained herein. This information is submitted subject to errors, omissions, change of price, rental or other conditions, withdrawal without notice, and is subject to any special listing conditions imposed by our principals. Cooperating brokers, buyers, tenants and other parties who receive this document should not rely on it, but should use it as a starting point of analysis, and should independently confirm the accuracy of the information contained herein through a due diligence review of the books, records, files and documents that constitute reliable sources of the information described herein.
For information, please contact your exclusive listing agents:
Steven H. WeissSenior Vice President818.905.2400 [email protected] Lic. #00680554
16001 Ventura BoulevardSuite 200Encino, California 91436fax 818 905 2400www.naicapital.com

8700 Tampa Ave. Northridge, California
46,000 SQUARE FOOT RETAIL BUILDING AVAILABLE FOR SALE
AERIALS
*
No warranty, express or implied, is made as to the accuracy of the information contained herein. This information is submitted subject to errors, omissions, change of price, rental or other conditions, withdrawal without notice, and is subject to any special listing conditions imposed by our principals. Cooperating brokers, buyers, tenants and other parties who receive this document should not rely on it, but should use it as a starting point of analysis, and should independently confirm the accuracy of the information contained herein through a due diligence review of the books, records, files and documents that constitute reliable sources of the information described herein.
For information, please contact your exclusive listing agent:
Steven H. WeissSenior Vice President818.905.2400 [email protected] Lic. #00680554
16001 Ventura BoulevardSuite 200Encino, California 91436fax 818 905 2400www.naicapital.com

8700 Tampa Ave. Northridge, California
46,000 SQUARE FOOT RETAIL BUILDING AVAILABLE FOR SALE
AERIALS
No warranty, express or implied, is made as to the accuracy of the information contained herein. This information is submitted subject to errors, omissions, change of price, rental or other conditions, withdrawal without notice, and is subject to any special listing conditions imposed by our principals. Cooperating brokers, buyers, tenants and other parties who receive this document should not rely on it, but should use it as a starting point of analysis, and should independently confirm the accuracy of the information contained herein through a due diligence review of the books, records, files and documents that constitute reliable sources of the information described herein.
For information, please contact your exclusive listing agent:
Steven H. WeissSenior Vice President818.905.2400 [email protected] Lic. #00680554
16001 Ventura BoulevardSuite 200Encino, California 91436fax 818 905 2400www.naicapital.com

8700 Tampa Ave. Northridge, California
46,000 SQUARE FOOT RETAIL BUILDING AVAILABLE FOR SALE
PHOTO
No warranty, express or implied, is made as to the accuracy of the information contained herein. This information is submitted subject to errors, omissions, change of price, rental or other conditions, withdrawal without notice, and is subject to any special listing conditions imposed by our principals. Cooperating brokers, buyers, tenants and other parties who receive this document should not rely on it, but should use it as a starting point of analysis, and should independently confirm the accuracy of the information contained herein through a due diligence review of the books, records, files and documents that constitute reliable sources of the information described herein.
For information, please contact your exclusive listing agent:
Steven H. WeissSenior Vice President818.905.2400 [email protected] Lic. #00680554
16001 Ventura BoulevardSuite 200Encino, California 91436fax 818 905 2400www.naicapital.com

Site MapTampa Ave and Parthenia St, Northridge, CA, 91324Tampa Ave & Parthenia St, Northridge, CA, 91324 Latitude: 34.22823Ring: 1, 2, 3 Miles Longitude: -118.55355
February 06, 2012
Made with Esri Business Analyst©2012 Esri www.esri.com/ba 800-447-9778 Try it Now! Page 1 of 1

Market ProfileTampa Ave and Parthenia St, Northridge, CA, 91324Tampa Ave & Parthenia St, Northridge, CA, 91324 Latitude: 34.22823Rings: 1, 2, 3 miles radii Longitude: -118.55355
1 mile 2 miles 3 milesPopulation Summary
2000 Total Population 18,838 96,916 225,0352000 Group Quarters 152 1,065 4,546
2010 Total Population 20,566 103,818 241,607
2015 Total Population 21,086 105,711 246,1692010-2015 Annual Rate 0.50% 0.36% 0.38%
Household Summary2000 Households 5,619 31,558 74,352
2000 Average Household Size 3.33 3.04 2.972010 Households 6,013 32,723 77,271
2010 Average Household Size 3.39 3.14 3.072015 Households 6,147 33,114 78,249
2015 Average Household Size 3.41 3.16 3.092010-2015 Annual Rate 0.44% 0.24% 0.25%
2000 Families 4,166 22,338 52,0912000 Average Family Size 3.76 3.53 3.48
2010 Families 4,441 23,173 54,1772010 Average Family Size 3.84 3.65 3.60
2015 Families 4,518 23,350 54,6212015 Average Family Size 3.86 3.68 3.632010-2015 Annual Rate 0.34% 0.15% 0.16%
Housing Unit Summary2000 Housing Units 5,769 32,377 76,536
Owner Occupied Housing Units 58.2% 52.5% 50.9%Renter Occupied Housing Units 39.4% 44.9% 46.3%Vacant Housing Units 2.4% 2.5% 2.8%
2010 Housing Units 6,190 33,799 80,011Owner Occupied Housing Units 56.3% 51.1% 49.4%Renter Occupied Housing Units 40.8% 45.7% 47.1%Vacant Housing Units 2.9% 3.2% 3.4%
2015 Housing Units 6,361 34,406 81,492Owner Occupied Housing Units 56.6% 50.9% 49.2%Renter Occupied Housing Units 40.0% 45.4% 46.9%Vacant Housing Units 3.4% 3.8% 4.0%
Median Household Income2000 $48,096 $46,117 $45,3742010 $61,800 $58,788 $57,3192015 $70,873 $66,740 $65,127
Median Home Value2000 $195,307 $198,436 $194,1092010 $351,146 $355,280 $349,8062015 $454,348 $461,252 $453,954
Per Capita Income2000 $17,960 $19,654 $19,8712010 $22,118 $23,432 $23,7212015 $25,895 $26,986 $27,015
Median Age2000 31.9 32.8 32.62010 33.0 33.9 33.82015 33.2 34.3 33.9
Data Note: Household population includes persons not residing in group quarters. Average Household Size is the household population divided by total households.Persons in families include the householder and persons related to the householder by birth, marriage, or adoption. Per Capita Income represents the income received byall persons aged 15 years and over divided by the total population. Detail may not sum to totals due to rounding.
February 06, 2012
Made with Esri Business Analyst©2012 Esri www.esri.com/ba 800-447-9778 Try it Now! Page 1 of 8
Source: U.S. Bureau of the Census, 2000 Census of Population and Housing. Esri forecasts for 2010 and 2015.

Market ProfileTampa Ave and Parthenia St, Northridge, CA, 91324Tampa Ave & Parthenia St, Northridge, CA, 91324 Latitude: 34.22823Rings: 1, 2, 3 miles radii Longitude: -118.55355
1 mile 2 miles 3 miles2000 Households by Income
Household Income Base 5,554 31,566 74,313<$15,000 14.4% 13.6% 13.5%$15,000 - $24,999 12.8% 12.7% 12.6%$25,000 - $34,999 10.6% 11.6% 12.0%$35,000 - $49,999 13.6% 15.7% 16.2%$50,000 - $74,999 19.4% 20.0% 19.9%$75,000 - $99,999 12.7% 11.7% 11.4%$100,000 - $149,999 12.0% 10.1% 9.6%$150,000 - $199,999 3.0% 2.6% 2.6%$200,000+ 1.6% 2.1% 2.2%
Average Household Income $59,110 $59,088 $59,295
2010 Households by IncomeHousehold Income Base 6,011 32,724 77,270
<$15,000 8.9% 9.3% 9.4%$15,000 - $24,999 8.4% 8.4% 8.7%$25,000 - $34,999 9.9% 9.6% 10.1%$35,000 - $49,999 11.8% 14.2% 14.5%$50,000 - $74,999 22.2% 22.6% 22.5%$75,000 - $99,999 16.2% 15.6% 14.9%$100,000 - $149,999 14.6% 12.4% 11.9%$150,000 - $199,999 4.8% 4.4% 4.5%$200,000+ 3.2% 3.3% 3.5%
Average Household Income $74,806 $73,044 $72,9262015 Households by Income
Household Income Base 6,147 33,115 78,249<$15,000 6.4% 6.9% 7.1%$15,000 - $24,999 6.3% 6.5% 6.8%$25,000 - $34,999 7.3% 7.2% 7.7%$35,000 - $49,999 9.3% 10.9% 11.2%$50,000 - $74,999 23.6% 24.9% 25.0%$75,000 - $99,999 16.8% 16.1% 15.5%$100,000 - $149,999 19.4% 17.1% 16.3%$150,000 - $199,999 6.0% 5.7% 5.7%$200,000+ 4.9% 4.7% 4.7%
Average Household Income $88,012 $84,650 $83,6022000 Owner Occupied Housing Units by Value
Total 3,281 17,026 38,880<$50,000 4.3% 2.5% 3.5%$50,000 - $99,999 1.3% 3.2% 3.8%$100,000 - $149,999 14.4% 14.6% 14.2%$150,000 - $199,999 33.4% 30.7% 32.3%$200,000 - $299,999 34.5% 32.5% 27.3%$300,000 - $499,999 10.9% 13.8% 15.1%$500,000 - $999,999 0.9% 2.6% 3.5%$1,000,000 + 0.2% 0.2% 0.3%
Average Home Value $214,518 $226,175 $228,5702000 Specified Renter Occupied Housing Units by Contract RentTotal 2,293 14,482 35,418
With Cash Rent 97.0% 97.8% 97.9%No Cash Rent 3.0% 2.2% 2.1%
Median Rent $658 $666 $663Average Rent $710 $711 $709
Data Note: Income represents the preceding year, expressed in current dollars. Household income includes wage and salary earnings, interest dividends, net rents,pensions, SSI and welfare payments, child support, and alimony. Specified Renter Occupied Housing Units exclude houses on 10+ acres. Average Rent excludes unitspaying no cash.
February 06, 2012
Made with Esri Business Analyst©2012 Esri www.esri.com/ba 800-447-9778 Try it Now! Page 2 of 8
Source: U.S. Bureau of the Census, 2000 Census of Population and Housing. Esri forecasts for 2010 and 2015.

Market ProfileTampa Ave and Parthenia St, Northridge, CA, 91324Tampa Ave & Parthenia St, Northridge, CA, 91324 Latitude: 34.22823Rings: 1, 2, 3 miles radii Longitude: -118.55355
1 mile 2 miles 3 miles2000 Population by AgeTotal 18,840 96,916 225,032
0 - 4 8.0% 7.3% 7.3%5 - 9 8.6% 7.9% 7.8%10 - 14 7.6% 7.0% 6.9%15 - 24 14.9% 15.0% 15.2%25 - 34 15.9% 16.6% 16.6%35 - 44 15.5% 16.1% 16.2%45 - 54 12.2% 12.4% 12.2%55 - 64 7.3% 7.6% 7.5%65 - 74 5.4% 5.5% 5.5%75 - 84 3.7% 3.6% 3.5%85 + 1.0% 1.0% 1.2%
18 + 71.5% 73.7% 74.0%2010 Population by AgeTotal 20,564 103,818 241,607
0 - 4 8.1% 7.4% 7.4%5 - 9 7.8% 7.1% 7.0%10 - 14 7.0% 6.5% 6.5%15 - 24 15.4% 15.1% 15.8%25 - 34 14.5% 15.5% 15.1%35 - 44 13.8% 14.2% 14.0%45 - 54 13.3% 13.8% 13.8%55 - 64 9.9% 10.0% 9.9%65 - 74 5.2% 5.4% 5.3%75 - 84 3.5% 3.5% 3.5%85 + 1.5% 1.5% 1.6%18 + 72.4% 74.6% 74.7%
2015 Population by AgeTotal 21,084 105,708 246,171
0 - 4 8.2% 7.4% 7.4%5 - 9 7.8% 7.1% 7.0%10 - 14 7.1% 6.6% 6.5%15 - 24 14.7% 14.4% 15.1%25 - 34 14.7% 15.5% 15.4%35 - 44 12.8% 13.4% 13.1%45 - 54 12.5% 12.8% 12.7%55 - 64 10.8% 11.0% 10.9%65 - 74 6.5% 6.7% 6.6%75 - 84 3.4% 3.5% 3.4%85 + 1.6% 1.6% 1.7%18 + 72.9% 75.1% 75.3%
2000 Population by SexMales 50.8% 49.5% 49.5%Females 49.2% 50.5% 50.5%
2010 Population by SexMales 50.5% 49.5% 49.4%Females 49.5% 50.5% 50.6%
2015 Population by SexMales 50.3% 49.5% 49.4%Females 49.7% 50.5% 50.6%
February 06, 2012
Made with Esri Business Analyst©2012 Esri www.esri.com/ba 800-447-9778 Try it Now! Page 3 of 8
Source: U.S. Bureau of the Census, 2000 Census of Population and Housing. Esri forecasts for 2010 and 2015.

Market ProfileTampa Ave and Parthenia St, Northridge, CA, 91324Tampa Ave & Parthenia St, Northridge, CA, 91324 Latitude: 34.22823Rings: 1, 2, 3 miles radii Longitude: -118.55355
1 mile 2 miles 3 miles2000 Population by Race/EthnicityTotal 18,837 96,917 225,036
White Alone 54.4% 55.5% 57.4%Black Alone 3.9% 4.7% 4.7%American Indian Alone 0.8% 0.6% 0.7%Asian or Pacific Islander Alone 12.4% 15.4% 13.5%Some Other Race Alone 22.6% 17.9% 18.1%Two or More Races 5.9% 5.9% 5.6%
Hispanic Origin 42.8% 36.0% 36.9%Diversity Index 84.1 82.0 81.32010 Population by Race/EthnicityTotal 20,566 103,818 241,606
White Alone 50.1% 50.6% 52.6%Black Alone 3.6% 4.2% 4.2%American Indian Alone 0.7% 0.6% 0.6%Asian or Pacific Islander Alone 14.4% 17.7% 15.6%Some Other Race Alone 24.9% 20.5% 20.8%Two or More Races 6.3% 6.3% 6.1%
Hispanic Origin 47.3% 41.1% 42.3%Diversity Index 86.3 85.1 84.52015 Population by Race/EthnicityTotal 21,087 105,712 246,169
White Alone 48.1% 48.5% 50.5%Black Alone 3.4% 4.0% 4.0%American Indian Alone 0.7% 0.6% 0.6%Asian or Pacific Islander Alone 15.3% 18.8% 16.6%Some Other Race Alone 26.1% 21.7% 22.0%Two or More Races 6.5% 6.5% 6.3%
Hispanic Origin 49.4% 43.5% 44.7%Diversity Index 87.2 86.2 85.72000 Population 3+ by School EnrollmentTotal 17,806 92,835 215,320
Enrolled in Nursery/Preschool 1.4% 1.5% 1.7%Enrolled in Kindergarten 2.1% 1.7% 1.7%Enrolled in Grade 1-8 14.3% 12.5% 12.6%Enrolled in Grade 9-12 7.4% 6.6% 6.2%Enrolled in College 6.4% 8.0% 8.2%Enrolled in Grad/Prof School 1.1% 1.4% 1.5%Not Enrolled in School 67.3% 68.3% 68.1%
2010 Population 25+ by Educational AttainmentTotal 12,695 66,365 153,027
Less Than 9th Grade 14.8% 10.3% 11.0%9th to 12th Grade, No Diploma 11.0% 9.1% 8.6%High School Graduate 20.4% 22.9% 23.7%Some College, No Degree 18.2% 19.8% 19.7%Associate Degree 6.6% 7.3% 7.3%Bachelor's Degree 20.8% 21.3% 20.6%Graduate/Professional Degree 8.3% 9.2% 9.1%
Data Note: Persons of Hispanic Origin may be of any race. The Diversity Index measures the probability that two people from the same area will be from differentrace/ethnic groups.
February 06, 2012
Made with Esri Business Analyst©2012 Esri www.esri.com/ba 800-447-9778 Try it Now! Page 4 of 8
Source: U.S. Bureau of the Census, 2000 Census of Population and Housing. Esri forecasts for 2010 and 2015.

Market ProfileTampa Ave and Parthenia St, Northridge, CA, 91324Tampa Ave & Parthenia St, Northridge, CA, 91324 Latitude: 34.22823Rings: 1, 2, 3 miles radii Longitude: -118.55355
1 mile 2 miles 3 miles2010 Population 15+ by Marital StatusTotal 15,864 82,020 191,203
Never Married 36.9% 37.5% 36.4%
Married 50.5% 49.7% 50.4%
Widowed 5.3% 4.9% 5.0%Divorced 7.3% 7.9% 8.2%
2000 Population 16+ by Employment StatusTotal 13,760 74,422 172,556
In Labor Force 65.1% 65.3% 64.8%Civilian Employed 59.1% 59.9% 59.1%Civilian Unemployed 5.9% 5.4% 5.7%In Armed Forces 0.1% 0.0% 0.0%
Not In Labor Force 34.9% 34.7% 35.2%2010 Civilian Population 16+ in Labor Force
Civilian Employed 84.5% 85.3% 86.3%Civilian Unemployed 15.5% 14.7% 13.7%
2015 Civilian Population 16+ in Labor Force Civilian Employed 87.0% 87.7% 88.5%Civilian Unemployed 13.0% 12.3% 11.5%
2000 Females 16+ by Employment Status and Age of ChildrenTotal 6,952 38,119 88,267
Own Children < 6 Only 7.1% 7.9% 7.8%Employed/in Armed Forces 4.3% 4.1% 4.1%Unemployed 0.7% 0.4% 0.3%Not in Labor Force 2.1% 3.4% 3.4%
Own Children <6 and 6-17 Only 10.2% 7.4% 7.6%Employed/in Armed Forces 3.7% 3.6% 3.8%Unemployed 1.3% 0.4% 0.4%Not in Labor Force 5.2% 3.4% 3.5%
Own Children 6-17 Only 16.3% 16.3% 16.3%Employed/in Armed Forces 10.4% 10.3% 10.3%Unemployed 0.6% 0.8% 0.7%Not in Labor Force 5.3% 5.2% 5.2%
No Own Children < 18 66.4% 68.4% 68.3%Employed/in Armed Forces 34.7% 34.9% 33.8%Unemployed 3.4% 3.5% 4.1%Not in Labor Force 28.4% 30.1% 30.4%
2010 Employed Population 16+ by IndustryTotal 8,346 43,825 101,524
Agriculture/Mining 0.1% 0.1% 0.1%Construction 5.5% 5.8% 5.5%Manufacturing 9.9% 9.1% 9.2%Wholesale Trade 2.8% 2.9% 3.4%Retail Trade 11.0% 11.4% 11.8%Transportation/Utilities 2.1% 2.7% 2.9%Information 4.3% 3.8% 3.8%Finance/Insurance/Real Estate 8.6% 10.4% 10.8%Services 53.7% 52.2% 50.7%Public Administration 1.7% 1.6% 1.7%
February 06, 2012
Made with Esri Business Analyst©2012 Esri www.esri.com/ba 800-447-9778 Try it Now! Page 5 of 8
Source: U.S. Bureau of the Census, 2000 Census of Population and Housing. Esri forecasts for 2010 and 2015.
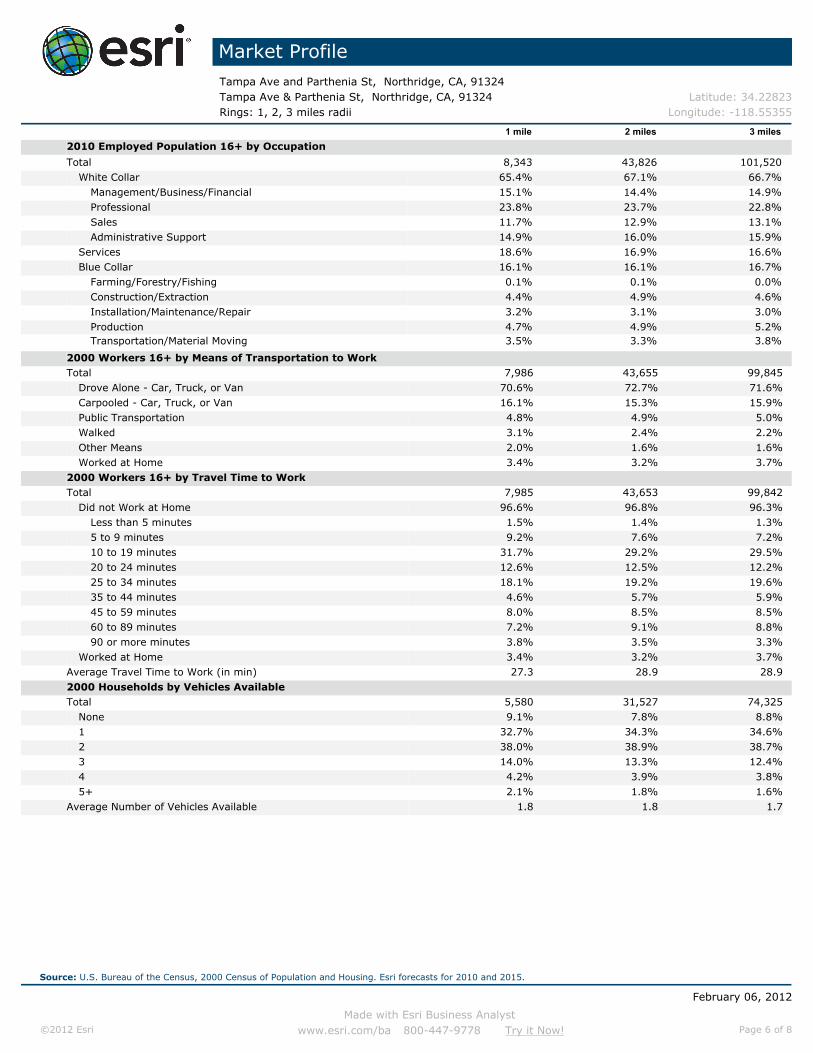
Market ProfileTampa Ave and Parthenia St, Northridge, CA, 91324Tampa Ave & Parthenia St, Northridge, CA, 91324 Latitude: 34.22823Rings: 1, 2, 3 miles radii Longitude: -118.55355
1 mile 2 miles 3 miles2010 Employed Population 16+ by Occupation
Total 8,343 43,826 101,520White Collar 65.4% 67.1% 66.7%
Management/Business/Financial 15.1% 14.4% 14.9%Professional 23.8% 23.7% 22.8%Sales 11.7% 12.9% 13.1%Administrative Support 14.9% 16.0% 15.9%
Services 18.6% 16.9% 16.6%Blue Collar 16.1% 16.1% 16.7%
Farming/Forestry/Fishing 0.1% 0.1% 0.0%Construction/Extraction 4.4% 4.9% 4.6%Installation/Maintenance/Repair 3.2% 3.1% 3.0%Production 4.7% 4.9% 5.2%Transportation/Material Moving 3.5% 3.3% 3.8%
2000 Workers 16+ by Means of Transportation to WorkTotal 7,986 43,655 99,845
Drove Alone - Car, Truck, or Van 70.6% 72.7% 71.6%Carpooled - Car, Truck, or Van 16.1% 15.3% 15.9%Public Transportation 4.8% 4.9% 5.0%Walked 3.1% 2.4% 2.2%Other Means 2.0% 1.6% 1.6%Worked at Home 3.4% 3.2% 3.7%
2000 Workers 16+ by Travel Time to WorkTotal 7,985 43,653 99,842
Did not Work at Home 96.6% 96.8% 96.3%Less than 5 minutes 1.5% 1.4% 1.3%5 to 9 minutes 9.2% 7.6% 7.2%10 to 19 minutes 31.7% 29.2% 29.5%20 to 24 minutes 12.6% 12.5% 12.2%25 to 34 minutes 18.1% 19.2% 19.6%35 to 44 minutes 4.6% 5.7% 5.9%45 to 59 minutes 8.0% 8.5% 8.5%60 to 89 minutes 7.2% 9.1% 8.8%90 or more minutes 3.8% 3.5% 3.3%
Worked at Home 3.4% 3.2% 3.7%Average Travel Time to Work (in min) 27.3 28.9 28.92000 Households by Vehicles AvailableTotal 5,580 31,527 74,325
None 9.1% 7.8% 8.8%1 32.7% 34.3% 34.6%2 38.0% 38.9% 38.7%3 14.0% 13.3% 12.4%4 4.2% 3.9% 3.8%5+ 2.1% 1.8% 1.6%
Average Number of Vehicles Available 1.8 1.8 1.7
February 06, 2012
Made with Esri Business Analyst©2012 Esri www.esri.com/ba 800-447-9778 Try it Now! Page 6 of 8
Source: U.S. Bureau of the Census, 2000 Census of Population and Housing. Esri forecasts for 2010 and 2015.

Market ProfileTampa Ave and Parthenia St, Northridge, CA, 91324Tampa Ave & Parthenia St, Northridge, CA, 91324 Latitude: 34.22823Rings: 1, 2, 3 miles radii Longitude: -118.55355
1 mile 2 miles 3 miles2000 Households by TypeTotal 5,619 31,557 74,352
Family Households 74.1% 70.8% 70.1%Married-couple Family 53.6% 51.4% 50.7%
With Related Children 31.1% 28.6% 28.2%Other Family (No Spouse) 20.5% 19.4% 19.4%
With Related Children 12.2% 11.4% 11.7%Nonfamily Households 25.9% 29.2% 29.9%
Householder Living Alone 18.3% 20.7% 21.7%Householder Not Living Alone 7.6% 8.5% 8.3%
Households with Related Children 43.2% 40.0% 39.9%Households with Persons 65+ 24.5% 21.8% 21.4%
2000 Households by SizeTotal 5,619 31,558 74,352
1 Person Household 18.3% 20.7% 21.7%2 Person Household 26.2% 28.0% 28.1%3 Person Household 16.4% 17.4% 17.1%4 Person Household 15.8% 15.7% 15.7%5 Person Household 10.0% 9.1% 8.8%6 Person Household 6.3% 4.5% 4.3%7 + Person Household 7.1% 4.5% 4.2%
2000 Households by Year Householder Moved InTotal 5,579 31,526 74,323
Moved in 1999 to March 2000 16.2% 20.7% 20.9%Moved in 1995 to 1998 33.2% 33.4% 34.6%Moved in 1990 to 1994 15.9% 14.7% 14.1%Moved in 1980 to 1989 14.3% 14.1% 13.6%Moved in 1970 to 1979 10.5% 9.4% 8.9%Moved in 1969 or Earlier 9.9% 7.7% 7.9%
Median Year Householder Moved In 1995 1995 19952000 Housing Units by Units in StructureTotal 5,723 32,347 76,531
1, Detached 64.3% 54.9% 51.9%1, Attached 5.5% 5.6% 5.5%2 0.6% 0.5% 0.4%3 or 4 3.7% 1.2% 1.1%5 to 9 3.0% 2.5% 2.9%10 to 19 7.0% 5.1% 5.5%20 + 13.2% 29.1% 31.0%Mobile Home 2.5% 1.0% 1.7%Other 0.2% 0.1% 0.0%
2000 Housing Units by Year Structure BuiltTotal 5,722 32,348 76,531
1999 to March 2000 0.0% 0.4% 0.4%1995 to 1998 2.6% 3.0% 2.4%1990 to 1994 1.8% 3.4% 3.3%1980 to 1989 7.2% 11.6% 11.4%1970 to 1979 19.3% 22.2% 22.8%1969 or Earlier 69.1% 59.4% 59.7%
Median Year Structure Built 1962 1966 1966
February 06, 2012
Made with Esri Business Analyst©2012 Esri www.esri.com/ba 800-447-9778 Try it Now! Page 7 of 8
Source: U.S. Bureau of the Census, 2000 Census of Population and Housing. Esri forecasts for 2010 and 2015.

Market ProfileTampa Ave and Parthenia St, Northridge, CA, 91324Tampa Ave & Parthenia St, Northridge, CA, 91324 Latitude: 34.22823Rings: 1, 2, 3 miles radii Longitude: -118.55355
1 mile 2 miles 3 milesTop 3 Tapestry Segments
1. Pleasant-Ville International Marketplace International Marketplace2. Urban Villages Urban Villages Urban Villages3. Urban Chic Pleasant-Ville Pleasant-Ville
2010 Consumer Spending Apparel & Services: Total $ $11,071,401 $59,565,320 $141,426,725
Average Spent $1,841.38 $1,820.31 $1,830.27Spending Potential Index 77 76 76
Computers & Accessories: Total $ $1,506,659 $8,157,334 $19,123,599Average Spent $250.59 $249.29 $247.49Spending Potential Index 114 113 112
Education: Total $ $7,571,895 $40,242,164 $97,131,263Average Spent $1,259.35 $1,229.80 $1,257.03Spending Potential Index 103 101 103
Entertainment/Recreation: Total $ $21,077,403 $111,954,513 $262,671,998Average Spent $3,505.57 $3,421.33 $3,399.37Spending Potential Index 109 106 105
Food at Home: Total $ $28,880,174 $155,264,509 $367,979,370Average Spent $4,803.32 $4,744.88 $4,762.21Spending Potential Index 107 106 106
Food Away from Home: Total $ $20,667,354 $111,100,298 $263,816,586Average Spent $3,437.37 $3,395.22 $3,414.18Spending Potential Index 107 105 106
Health Care: Total $ $21,219,698 $111,740,543 $264,383,811Average Spent $3,529.23 $3,414.79 $3,421.52Spending Potential Index 95 92 92
HH Furnishings & Equipment: Total $ $12,039,625 $63,702,852 $149,137,741Average Spent $2,002.42 $1,946.76 $1,930.07Spending Potential Index 97 95 94
Investments: Total $ $12,283,305 $63,979,628 $147,160,610Average Spent $2,042.94 $1,955.22 $1,904.48Spending Potential Index 117 112 109
Retail Goods: Total $ $150,743,315 $800,336,369 $1,885,996,024Average Spent $25,071.44 $24,458.25 $24,407.62Spending Potential Index 101 98 98
Shelter: Total $ $113,227,614 $601,895,099 $1,413,149,974Average Spent $18,831.88 $18,393.89 $18,288.28Spending Potential Index 119 117 116
TV/Video/Audio:Total $ $7,562,476 $40,778,184 $96,948,116Average Spent $1,257.78 $1,246.18 $1,254.65Spending Potential Index 101 100 101
Travel: Total $ $13,506,410 $70,825,371 $164,525,753Average Spent $2,246.37 $2,164.42 $2,129.21Spending Potential Index 119 114 112
Vehicle Maintenance & Repairs: Total $ $6,024,945 $32,164,618 $75,739,094Average Spent $1,002.06 $982.95 $980.18Spending Potential Index 106 104 104
Data Note: Consumer spending shows the amount spent on a variety of goods and services by households that reside in the area. Expenditures are shown by broadbudget categories that are not mutually exclusive. Consumer spending does not equal business revenue. Total and Average Amount Spent Per Household represent annualfigures. The Spending Potential Index represents the amount spent in the area relative to a national average of 100.Source: Consumer Spending data are derived from the 2006 and 2007 Consumer Expenditure Surveys, Bureau of Labor Statistics. Esri.
February 06, 2012
Made with Esri Business Analyst©2012 Esri www.esri.com/ba 800-447-9778 Try it Now! Page 8 of 8
Source: U.S. Bureau of the Census, 2000 Census of Population and Housing. Esri forecasts for 2010 and 2015.

Business SummaryTampa Ave and Parthenia St, Northridge, CA, 91324Tampa Ave & Parthenia St, Northridge, CA, 91324 Latitude: 34.22823Rings: 1, 2, 3 miles radii Longitude: -118.55355
Data for all businesses in area 1 mile 2 miles 3 milesTotal Businesses: 1,528 4,553 10,013Total Employees: 14,080 42,435 88,774Total Residential Population: 20,566 103,818 241,607Employee/Residential Population Ratio: 0.69 0.41 0.37
Businesses Employees Businesses Employees Businesses Employees
by SIC Codes Number Percent Number Percent Number Percent Number Percent Number Percent Number PercentAgriculture & Mining 10 0.7% 56 0.4% 51 1.1% 221 0.5% 134 1.3% 478 0.5%Construction 106 7.0% 435 3.1% 346 7.6% 1,479 3.5% 835 8.3% 3,755 4.2%Manufacturing 107 7.0% 1,391 9.9% 269 5.9% 5,172 12.2% 670 6.7% 16,010 18.0%Transportation 16 1.0% 39 0.3% 70 1.5% 550 1.3% 184 1.8% 1,476 1.7%Communication 13 0.9% 24 0.2% 34 0.7% 94 0.2% 74 0.7% 434 0.5%Utility 3 0.2% 9 0.1% 12 0.3% 22 0.1% 43 0.4% 109 0.1%Wholesale Trade 129 8.5% 1,236 8.8% 314 6.9% 2,852 6.7% 743 7.4% 6,484 7.3%
Retail Trade Summary 458 30.0% 5,813 41.3% 1,070 23.5% 10,776 25.4% 2,284 22.8% 20,285 22.9%Home Improvement 22 1.4% 299 2.1% 70 1.5% 506 1.2% 175 1.7% 1,141 1.3%General Merchandise Stores 10 0.7% 1,237 8.8% 20 0.4% 1,470 3.5% 48 0.5% 1,920 2.2%Food Stores 31 2.0% 301 2.1% 102 2.2% 894 2.1% 235 2.3% 2,265 2.6%Auto Dealers, Gas Stations, Auto Aftermarket 28 1.8% 172 1.2% 81 1.8% 721 1.7% 212 2.1% 1,792 2.0%Apparel & Accessory Stores 94 6.1% 1,053 7.5% 138 3.0% 1,260 3.0% 193 1.9% 1,617 1.8%Furniture & Home Furnishings 60 4.0% 407 2.9% 139 3.1% 1,142 2.7% 312 3.1% 2,286 2.6%Eating & Drinking Places 89 5.8% 1,556 11.1% 239 5.2% 2,991 7.0% 499 5.0% 5,492 6.2%Miscellaneous Retail 125 8.2% 788 5.6% 282 6.2% 1,792 4.2% 611 6.1% 3,772 4.2%
Finance, Insurance, Real Estate Summary 100 6.5% 967 6.9% 467 10.2% 2,799 6.6% 938 9.4% 4,707 5.3%Banks, Savings & Lending Institutions 33 2.1% 206 1.5% 115 2.5% 626 1.5% 216 2.2% 1,178 1.3%Securities Brokers 11 0.7% 306 2.2% 40 0.9% 464 1.1% 68 0.7% 523 0.6%Insurance Carriers & Agents 27 1.8% 124 0.9% 136 3.0% 527 1.2% 267 2.7% 1,074 1.2%Real Estate, Holding, Other Investment Offices 29 1.9% 331 2.4% 175 3.8% 1,183 2.8% 387 3.9% 1,932 2.2%
Services Summary 570 37.3% 4,065 28.9% 1,835 40.3% 18,289 43.1% 3,884 38.8% 33,241 37.4%Hotels & Lodging 2 0.1% 2 0.0% 5 0.1% 21 0.0% 11 0.1% 114 0.1%Automotive Services 98 6.4% 373 2.6% 295 6.5% 883 2.1% 662 6.6% 1,863 2.1%Motion Pictures & Amusements 34 2.3% 150 1.1% 122 2.7% 596 1.4% 281 2.8% 1,434 1.6%Health Services 46 3.0% 234 1.7% 232 5.1% 3,652 8.6% 431 4.3% 5,877 6.6%Legal Services 18 1.1% 78 0.6% 45 1.0% 124 0.3% 82 0.8% 247 0.3%Education Institutions & Libraries 35 2.3% 518 3.7% 90 2.0% 2,092 4.9% 184 1.8% 5,152 5.8%Other Services 338 22.1% 2,711 19.3% 1,046 23.0% 10,920 25.7% 2,234 22.3% 18,553 20.9%
Government 0 0.0% 9 0.1% 10 0.2% 93 0.2% 22 0.2% 1,139 1.3%Other 15 1.0% 35 0.3% 74 1.6% 88 0.2% 201 2.0% 656 0.7%
Totals 1,528 100% 14,080 100% 4,553 100% 42,435 100% 10,013 100% 88,774 100%
February 06, 2012
Made with Esri Business Analyst©2012 Esri www.esri.com/ba 800-447-9778 Try it Now! Page 1 of 2
Source: Business data provided by Infogroup, Omaha NE Copyright 2010, all rights reserved. Esri forecasts for 2010.

Business SummaryTampa Ave and Parthenia St, Northridge, CA, 91324Tampa Ave & Parthenia St, Northridge, CA, 91324 Latitude: 34.22823Rings: 1, 2, 3 miles radii Longitude: -118.55355
Businesses Employees Businesses Employees Businesses Employees
by NAICS Codes Number Percent Number Percent Number Percent Number Percent Number Percent Number PercentAgriculture, Forestry, Fishing & Hunting 2 0.2% 4 0.0% 5 0.1% 10 0.0% 11 0.1% 24 0.0%Mining 0 0.0% 0 0.0% 3 0.1% 9 0.0% 4 0.0% 10 0.0%Utilities 2 0.1% 7 0.1% 2 0.1% 9 0.0% 7 0.1% 25 0.0%Construction 112 7.3% 453 3.2% 371 8.2% 1,541 3.6% 909 9.1% 3,876 4.4%Manufacturing 118 7.7% 1,377 9.8% 301 6.6% 4,954 11.7% 727 7.3% 15,266 17.2%Wholesale Trade 125 8.2% 1,202 8.5% 307 6.7% 2,791 6.6% 728 7.3% 6,397 7.2%Retail Trade 354 23.1% 4,146 29.4% 788 17.3% 7,585 17.9% 1,687 16.8% 14,390 16.2%
Motor Vehicle & Parts Dealers 22 1.4% 142 1.0% 62 1.4% 650 1.5% 172 1.7% 1,631 1.8%Furniture & Home Furnishings Stores 27 1.8% 206 1.5% 50 1.1% 486 1.1% 103 1.0% 943 1.1%Electronics & Appliance Stores 27 1.8% 162 1.2% 70 1.5% 579 1.4% 170 1.7% 1,287 1.5%Bldg Material & Garden Equipment & Supplies Dealers 21 1.4% 292 2.1% 69 1.5% 499 1.2% 173 1.7% 1,131 1.3%Food & Beverage Stores 26 1.7% 236 1.7% 85 1.9% 869 2.0% 192 1.9% 2,123 2.4%Health & Personal Care Stores 28 1.8% 198 1.4% 68 1.5% 485 1.1% 144 1.4% 1,056 1.2%Gasoline Stations 6 0.4% 30 0.2% 18 0.4% 71 0.2% 40 0.4% 161 0.2%Clothing & Clothing Accessories Stores 107 7.0% 1,120 8.0% 156 3.4% 1,351 3.2% 228 2.3% 1,808 2.0%Sport Goods, Hobby, Book, & Music Stores 24 1.6% 215 1.5% 53 1.2% 466 1.1% 112 1.1% 716 0.8%General Merchandise Stores 10 0.7% 1,237 8.8% 20 0.4% 1,470 3.5% 48 0.5% 1,920 2.2%Miscellaneous Store Retailers 45 3.0% 275 2.0% 115 2.5% 537 1.3% 256 2.6% 1,267 1.4%Nonstore Retailers 10 0.6% 33 0.2% 21 0.5% 123 0.3% 50 0.5% 347 0.4%
Transportation & Warehousing 30 2.0% 73 0.5% 108 2.4% 511 1.2% 250 2.5% 1,410 1.6%Information 38 2.5% 724 5.1% 118 2.6% 1,681 4.0% 271 2.7% 3,305 3.7%Finance & Insurance 72 4.7% 639 4.5% 296 6.5% 1,636 3.9% 564 5.6% 2,825 3.2%
Central Bank/Credit Intermediation & Related Activities 29 1.9% 196 1.4% 99 2.2% 587 1.4% 198 2.0% 1,136 1.3%Securities, Commodity Contracts & Other Financial 16 1.0% 319 2.3% 59 1.3% 519 1.2% 94 0.9% 599 0.7%Insurance Carriers & Related Activities; Funds, Trusts & 27 1.8% 124 0.9% 138 3.0% 531 1.3% 272 2.7% 1,089 1.2%
Real Estate, Rental & Leasing 43 2.8% 420 3.0% 215 4.7% 1,767 4.2% 487 4.9% 3,412 3.8%Professional, Scientific & Tech Services 111 7.3% 509 3.6% 356 7.8% 2,110 5.0% 762 7.6% 4,392 4.9%
Legal Services 20 1.3% 98 0.7% 56 1.2% 160 0.4% 102 1.0% 296 0.3%Management of Companies & Enterprises 0 0.0% 3 0.0% 0 0.0% 29 0.1% 2 0.0% 87 0.1%Administrative & Support & Waste Management & Remediation 65 4.2% 660 4.7% 221 4.8% 1,456 3.4% 543 5.4% 3,656 4.1%Educational Services 40 2.6% 507 3.6% 109 2.4% 1,888 4.4% 233 2.3% 4,996 5.6%Health Care & Social Assistance 64 4.2% 853 6.1% 299 6.6% 8,325 19.6% 558 5.6% 11,593 13.1%Arts, Entertainment & Recreation 16 1.0% 49 0.4% 57 1.2% 241 0.6% 120 1.2% 672 0.8%Accommodation & Food Services 94 6.2% 1,580 11.2% 253 5.5% 3,043 7.2% 538 5.4% 5,696 6.4%
Accommodation 2 0.1% 2 0.0% 5 0.1% 21 0.0% 11 0.1% 114 0.1%Food Services & Drinking Places 92 6.0% 1,578 11.2% 247 5.4% 3,022 7.1% 527 5.3% 5,582 6.3%
Other Services (except Public Administration) 224 14.7% 802 5.7% 656 14.4% 2,616 6.2% 1,380 13.8% 4,873 5.5%Automotive Repair & Maintenance 73 4.8% 290 2.1% 219 4.8% 747 1.8% 481 4.8% 1,560 1.8%
Public Administration 0 0.0% 9 0.1% 10 0.2% 93 0.2% 22 0.2% 1,139 1.3%Unclassified Establishments 17 1.1% 64 0.5% 78 1.7% 141 0.3% 211 2.1% 729 0.8%
Total 1,528 100% 14,080 100% 4,553 100% 42,435 100% 10,013 100% 88,774 100%
February 06, 2012
Made with Esri Business Analyst©2012 Esri www.esri.com/ba 800-447-9778 Try it Now! Page 2 of 2
Source: Business data provided by Infogroup, Omaha NE Copyright 2010, all rights reserved. Esri forecasts for 2010.

City of Los AngelesDepartment of City Planning
09/08/2009PARCEL PROFILE REPORT
The contents of this report are bound by the User Agreement as described in the Terms and Conditions of this website. For more details, please refer to the Terms & Conditions link located at http://zimas.lacity.org.(*) - APN Area: LA County Assessor's Office is not the data provider for this item. The data source is from the Los Angeles County's Public Works, Flood Control, Benefit Assessment.
PROPERTY ADDRESSES8710 N TAMPA AVE8700 N TAMPA AVE19235 W PARTHENIA ST19249 W PARTHENIA ST19201 W PARTHENIA ST19229 W PARTHENIA ST19225 W PARTHENIA ST
ZIP CODES91324
RECENT ACTIVITYNone
CASE NUMBERSCPC-23880CPC-2000-2931-SP-TODCPC-1986-253-GPCORD-163915-SA1650ORD-145183ORD-106795ORD-101907ZA-1993-904-ZVZA-1987-932-CUB-CUXZA-1986-1280-PAB-PADZA-1978-480-CUBPMV-1153PMV-2898ENV-2000-2933-NDMND-93-343-ZV-SPRND-87-603-CUB-CUXND-79-2-CUZCFG-2000CFG-1500
Address/Legal InformationPIN Number: 195B117 135Lot Area (Calculated): 114,552.7 (sq ft)Thomas Brothers Grid: PAGE 530 - GRID G1Assessor Parcel No. (APN): 2784003061Tract: P M 2850Map Reference: BK 58-77Block: NoneLot: FR BArb (Lot Cut Reference): NoneMap Sheet: 195B117
Jurisdictional InformationCommunity Plan Area: NorthridgeArea Planning Commission: North ValleyNeighborhood Council: NoneCouncil District: CD 12 - Greig SmithCensus Tract #: 1153.02LADBS District Office: Van Nuys
Planning and Zoning InformationSpecial Notes: NoneZoning: MR2-1VL
P-1VLZoning Information (ZI): NoneGeneral Plan Land Use: Light ManufacturingPlan Footnote - Site Req.: 4Additional Plan Footnotes: NorthridgeSpecific Plan Area: NoneDesign Review Board: NoHistoric Preservation Review: NoHistoric Preservation Overlay Zone: NoneOther Historic Designations: NoneOther Historic Survey Information: NoneMills Act Contract: NonePOD - Pedestrian Oriented Districts: NoneCDO - Community Design Overlay: NoneNSO - Neighborhood Stabilization Overlay: NoneStreetscape: NoSign District: NoAdaptive Reuse Incentive Area: NoneCRA - Community Redevelopment Agency: NoneCentral City Parking: NoDowntown Parking: NoBuilding Line: None500 Ft School Zone: No500 Ft Park Zone: No
Assessor InformationAssessor Parcel No. (APN): 2784003061APN Area (Co. Public Works)*: 2.630 (ac)Use Code: Not AvailableAssessed Land Val.: $2,870,740Assessed Improvement Val.: $2,362,100Last Owner Change: 06/08/90Last Sale Amount: $2,920,029Tax Rate Area: 16Deed Ref No. (City Clerk): 738704
5866774-913

The contents of this report are bound by the User Agreement as described in the Terms and Conditions of this website. For more details, please refer to the Terms & Conditions link located at http://zimas.lacity.org.(*) - APN Area: LA County Assessor's Office is not the data provider for this item. The data source is from the Los Angeles County's Public Works, Flood Control, Benefit Assessment.
1024629Building 1: 1. Year Built: 1994 1. Building Class: Not Available 1. Number of Units: 0 1. Number of Bedrooms: 0 1. Number of Bathrooms: 0 1. Building Square Footage: 55,000.0 (sq ft)Building 2: 2. Year Built: 1994 2. Building Class: CX 2. Number of Units: 1 2. Number of Bedrooms: 0 2. Number of Bathrooms: 0 2. Building Square Footage: 44,188.0 (sq ft)Building 3: 3. Year Built: Not Available 3. Building Class: Not Available 3. Number of Units: 0 3. Number of Bedrooms: 0 3. Number of Bathrooms: 0 3. Building Square Footage: 0.0 (sq ft)Building 4: 4. Year Built: Not Available 4. Building Class: Not Available 4. Number of Units: 0 4. Number of Bedrooms: 0 4. Number of Bathrooms: 0 4. Building Square Footage: NoneBuilding 5: 5. Year Built: Not Available 5. Building Class: Not Available 5. Number of Units: 0 5. Number of Bedrooms: 0 5. Number of Bathrooms: 0 5. Building Square Footage: 0.0 (sq ft)
Additional InformationAirport Hazard: NoneCoastal Zone: NoneFarmland: Urban and Built-up LandVery High Fire Hazard Severity Zone: NoFire District No. 1: NoFire District No. 2: YesFlood Zone: NoneHazardous Waste / Border Zone Properties: NoMethane Hazard Site: NoneHigh Wind Velocity Areas: NoHillside Grading: NoOil Wells: NoneAlquist-Priolo Fault Zone: NoDistance to Nearest Fault: 7.83913 (km)Landslide: NoLiquefaction: Yes
Economic Development AreasBusiness Improvement District: NoneFederal Empowerment Zone: NoneRenewal Community: NoRevitalization Zone: NoneState Enterprise Zone: NoneTargeted Neighborhood Initiative: None
Public SafetyPolice Information: Bureau: Valley Division / Station: Devonshire Report District: 1787Fire Information:

The contents of this report are bound by the User Agreement as described in the Terms and Conditions of this website. For more details, please refer to the Terms & Conditions link located at http://zimas.lacity.org.(*) - APN Area: LA County Assessor's Office is not the data provider for this item. The data source is from the Los Angeles County's Public Works, Flood Control, Benefit Assessment.
District / Fire Station: 103 Batallion: 15 Division: 3 Red Flag Restricted Parking: No
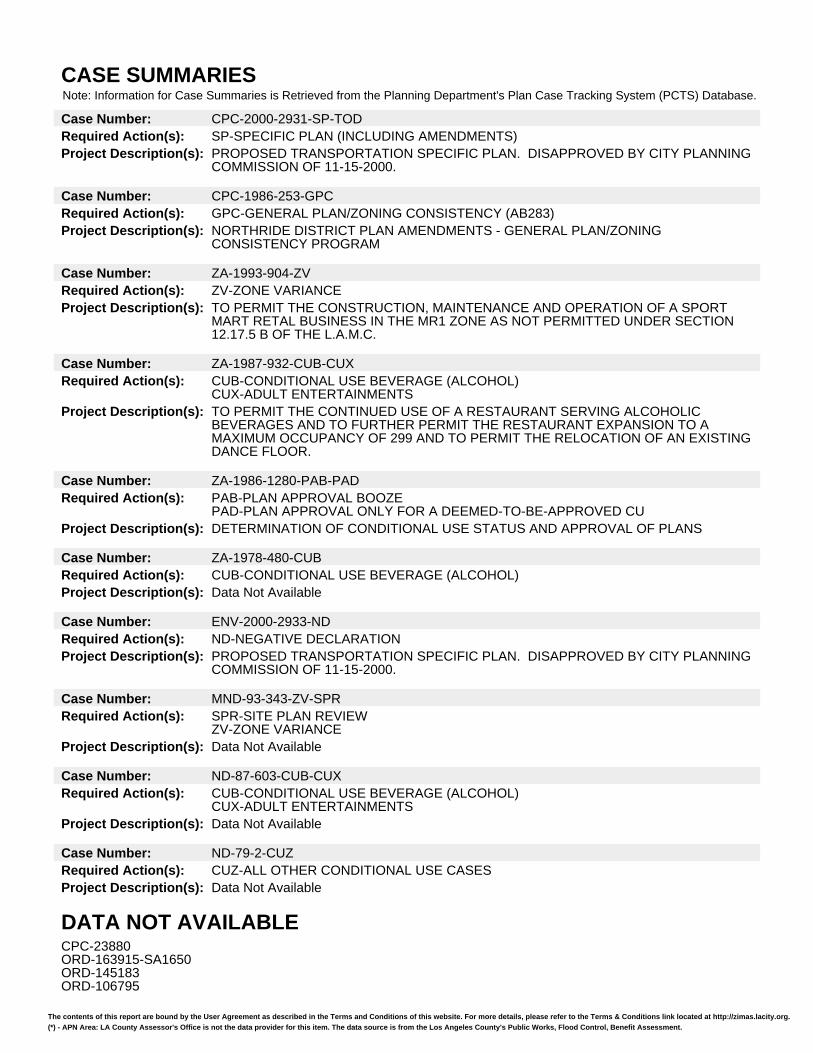
CASE SUMMARIESNote: Information for Case Summaries is Retrieved from the Planning Department's Plan Case Tracking System (PCTS) Database.
The contents of this report are bound by the User Agreement as described in the Terms and Conditions of this website. For more details, please refer to the Terms & Conditions link located at http://zimas.lacity.org.(*) - APN Area: LA County Assessor's Office is not the data provider for this item. The data source is from the Los Angeles County's Public Works, Flood Control, Benefit Assessment.
Case Number: CPC-2000-2931-SP-TODRequired Action(s): SP-SPECIFIC PLAN (INCLUDING AMENDMENTS)Project Description(s): PROPOSED TRANSPORTATION SPECIFIC PLAN. DISAPPROVED BY CITY PLANNING
COMMISSION OF 11-15-2000.
Case Number: CPC-1986-253-GPCRequired Action(s): GPC-GENERAL PLAN/ZONING CONSISTENCY (AB283)Project Description(s): NORTHRIDE DISTRICT PLAN AMENDMENTS - GENERAL PLAN/ZONING
CONSISTENCY PROGRAM
Case Number: ZA-1993-904-ZVRequired Action(s): ZV-ZONE VARIANCEProject Description(s): TO PERMIT THE CONSTRUCTION, MAINTENANCE AND OPERATION OF A SPORT
MART RETAL BUSINESS IN THE MR1 ZONE AS NOT PERMITTED UNDER SECTION12.17.5 B OF THE L.A.M.C.
Case Number: ZA-1987-932-CUB-CUXRequired Action(s): CUB-CONDITIONAL USE BEVERAGE (ALCOHOL)
CUX-ADULT ENTERTAINMENTSProject Description(s): TO PERMIT THE CONTINUED USE OF A RESTAURANT SERVING ALCOHOLIC
BEVERAGES AND TO FURTHER PERMIT THE RESTAURANT EXPANSION TO AMAXIMUM OCCUPANCY OF 299 AND TO PERMIT THE RELOCATION OF AN EXISTINGDANCE FLOOR.
Case Number: ZA-1986-1280-PAB-PADRequired Action(s): PAB-PLAN APPROVAL BOOZE
PAD-PLAN APPROVAL ONLY FOR A DEEMED-TO-BE-APPROVED CUProject Description(s): DETERMINATION OF CONDITIONAL USE STATUS AND APPROVAL OF PLANS
Case Number: ZA-1978-480-CUBRequired Action(s): CUB-CONDITIONAL USE BEVERAGE (ALCOHOL)Project Description(s): Data Not Available
Case Number: ENV-2000-2933-NDRequired Action(s): ND-NEGATIVE DECLARATIONProject Description(s): PROPOSED TRANSPORTATION SPECIFIC PLAN. DISAPPROVED BY CITY PLANNING
COMMISSION OF 11-15-2000.
Case Number: MND-93-343-ZV-SPRRequired Action(s): SPR-SITE PLAN REVIEW
ZV-ZONE VARIANCEProject Description(s): Data Not Available
Case Number: ND-87-603-CUB-CUXRequired Action(s): CUB-CONDITIONAL USE BEVERAGE (ALCOHOL)
CUX-ADULT ENTERTAINMENTSProject Description(s): Data Not Available
Case Number: ND-79-2-CUZRequired Action(s): CUZ-ALL OTHER CONDITIONAL USE CASESProject Description(s): Data Not Available
DATA NOT AVAILABLECPC-23880ORD-163915-SA1650ORD-145183ORD-106795

The contents of this report are bound by the User Agreement as described in the Terms and Conditions of this website. For more details, please refer to the Terms & Conditions link located at http://zimas.lacity.org.(*) - APN Area: LA County Assessor's Office is not the data provider for this item. The data source is from the Los Angeles County's Public Works, Flood Control, Benefit Assessment.
ORD-101907PMV-1153PMV-2898CFG-2000CFG-1500

ZIMAS INTERNET 09/08/2009 City of Los AngelesDepartment of City Planning
Address:8710 N TAMPA AVE
APN:2784003061
PIN #:195B117 135
Tract:P M 2850
Block:None
Lot:FR B
Arb:None
Zoning:MR2-1VL, P-1VL
General Plan:Light Manufacturing
Streets Copyright (c) Thomas Brothers Maps, Inc.