
46' - Massachusetts Institute of Technology
62
/46' a W"ORKING DRAF-IT TYPHOONS ON THE SOUTHEASTERN COAST OF CHINA AND FORMOSA Jean Kan Hl3ieh and Chiao-min Hisieh Note: This paper was made possible through a grant from the Office of Naval Researche 0 Neither that Office, nor the Center for International tuies, which has adrinistered the contract, assnumes any responsibility for the content of the paper, which rermains the personal responsibility of the author. Ra- production in whole or in part is periitted for any purpose by the Unite d States GErn; Center for International Studies 1assachusetts Institute of Taechnology Cambridge, Mcachustts Sptember 1955
Transcript of 46' - Massachusetts Institute of Technology

/46'
aW"ORKING DRAF-IT
TYPHOONS ON THE SOUTHEASTERN COAST OFCHINA AND FORMOSA
Jean Kan Hl3iehand
Chiao-min Hisieh
Note: This paper was made possible througha grant from the Office of Naval Researche0Neither that Office, nor the Center forInternational tuies, which has adrinisteredthe contract, assnumes any responsibility forthe content of the paper, which rermains thepersonal responsibility of the author. Ra-production in whole or in part is periittedfor any purpose by the Unite d States GErn;
Center for International Studies1assachusetts Institute of Taechnology
Cambridge, McachusttsSptember 1955

TABLE OF CONTENTS
Chapter Page
I. INTRODUCTION . . . . . . . . . . . . . . -
II. TYPHOONS IV GENERAL ., . . a 0 . . . e . . - 6
1. Theories on the Origin of Tphoons . . . .
2. Energy Supply and Structure of Typhoons . . . . . 10
3. Mean Tracks and Speed of Typhoons . . . . .
III. TYPHOONS ON THE SOUTHEASTERN COAST OF CHINA . .
1. Annual Frequency and MIonthly DiE tribution of
Typhoona . 0 . . . . .0 0 - 23
2. Typhoons and Rairfall Patternv . . . 32
3. Typhoons in Hog Kong .. .. . . . .0 . . .C " 38
IV. TYPHOONS ON FOROSA . . . . . . . * . - - 0 - 0 5
1. Monthly Distribution of Typhoons and TheirRelation to the Rainfall Type . . . .5
2. The Dstructivemss of Typhoons in Formosa . . 7
3. Typhoons and Rice Cultivation . . 9
Bibliography . . . c-- 6

IST OF FIGURES
Page
1 Horizontal and Vertical Section of the Eye of Typhoon"Marge" . . . . . . . . . . . . . . . . . 1k
2. The Relationship between the Eye of the Typhoon and theLowest Pressure . .. . . .. . . . . . .t . .1 . .e .. . . . 15
3. Mean Tracks of Typhoons (1884-1930) . . . 20
4. Annual Precipitation of China . . . . . . . . . 33
5. Monthly M4ean,. Absolute Maximua and boute Minimurm Amountsof Hong Kong Rainfall (55-year mean, 1388-1938) . .35
6. Five-day Means of RainDfa1l and Ty hoon Frequencies inSouthern China . . . 0 . . 36
7. Pressure in Hong Kong . . . . . 39
8. Sequences of Wind Direction in Hong Kong 4 3
9. Five-day Ieans of Rainfall a Typhoo n Frequencies in FovroS a 46
10. The Possible Darge to Rice Crops by Typhoons .5

LIST OF TABLES
Page
1. The Variation in the Annual Number of Typhoons Reportedby Different Authorities . I . . . . . . . . . . * * 23
2. Percentage of Monthly Distritution of Typhoons from VariousAuthorities . .. . . . . ..9 . .. .. . .. .. . . . . 25
3. The Number of Typhoons Recorded for Each Month in the Years1884 to 1941 and 1946 to 1949 . . .o . . . . . . . . . . . . . 27
4. Monthly Distribution of Typhoons on the Southeast Coast ofChina . 0 . . . . 29
5. Monthly Frequency of Typhoons in Southeastern China . . . 30
6. Number of Typhoons that Reached the Mainland of China afterBlowing over Formosa . . . . . . . . . . . . ... 31
7. The Monthly Distribution of Typhoons on Formosa from 1895to 1945 ....... - - -* * - . - - -. - - - - - 45
8. Causes of Damage to Rice Crops in Formosa and Average AreaDevastated Per Year (1919-1912) . . . . . 00000
9. The Damaged Area in Different Counties . . . . . . . . . 51
10. A Comparison of the Iarvest of the First and Second Croppingsof Native Rice and Horai Rice in Formosa (1924-1943) . . . " ,9
U Comparison of the Number of Growing Days Required by NativeRice and Horai Rice (1935-1939). .* . . . . . . . . . . . . . 52
iii

4, &'
I. INTROU CTION
Tropical cyclones of certain degrees of intensity are known as
"typhoons" in the Far East, as "hurricanes" in the Atlantic Ocean and
the West Indies, and as " cyclones" in the Indian Ocean. In the Philip-
pines these storms are locally called "bayuios" and in Australia,
"willy-willies ."
The Chinese name for typhoons is I chu-feng"/;j,) ., The charac-
ter "chu" is composed of . for i , i.e., all, whole, altogether,
and the radical "feng" ,'FC or wind, Thus "chu-feng" means "wind from
all quarters."
In the dialect of S-ratow, Amoy, and Formosa, a typhoon is called
"hong-thai," the character "hong" ) ,, meaning "wind," and "thai,"
-14which has the same sound and the same tone as "thai," 1'o meaning
"womb," Thus "hong-thai" means "the womb of the wind."t For this
Fukienese word, a new character, which is not found in old Chinese
dictionaries, has been formed. It is "thai"A'' , in which the radical
character for womb has been changed into the radical "wind." This new
character is now commonly used for the word tthai-feng,"t ice., typhoon
orjI, )t4 "big wind."
Despite the different nam.es, these tropical cyclones all have
essentially the same origin, structure, and behavior. They are small
1 Father E. S. J. Gherzi, The Meteorology of China, Macau, 1951.
b
2
low-pressure areas forming revolving storms and are very nearly circu-
lar in shape. They are the most violent storms experienced by the
mariner.
Typhoons in the Far East have been studied by Jose Algue and Louis
Froc, as well as Charles I. Deppermann, Gherzi, Y. ioriguti, Co-ching
Chu, and Hewpiood. Yet the exact cause of the origin of typhoons is
not perfectly clear at present. The structure, energy supply, and the
size and height of typhoons are still disputed subjects. In the first
part of this study the author has introduced different hypotheses con-
cerning the formation of typhoons, and has compared and evaluated them
with the intention of presenting current knowledge about the formation
of typhoons. The author has also collected different source material
to show the structure and the routes of typhoons.
The southeastern coasts of China and Formosa have been attacked
by typhoons very often. From the data gathered by the Royal Observa-
tory of Hong Kong, the Weather Bureau of Formosa, and the Weather
Bureau of Manila the author was able to calculate and analyze the
frequency of typhoons which have hit the southeast coast of China and
Formosa and draw certain conclusions, The relationship between the fre-
quency of typhoons and the rainfall patterns in southern China and
Formosa has been emphasized. Some notable destruction caused by
typhoons is described here.
The last part discusses the fact that Formosa has been considered
the "rice bowl" of the Far Eas t, but from time to time typhoons have
damaged the rice fields on the island. Using data covering a 51-year

3
period, the monthly distribution of typhoons in Formosa has been
indicated, and the relationship between rice planting in Formosa and
the possible damage by the typhoons has been studied, and some con-
crete suggestions have been made.

ft
II. TYPHOONS IN GENERAL
1. Theories on the Origin of Typhoons
The origin of typhoons is a controversial topic. Various hypoth-
eses have been propounded by meteorologists. They can be summarized
into three groups: convectional, mechanical, and frontal.
The Convectional Hypothesis
The convectional hypothesis of the origin of typhoons was appar-
ently first proposed by Espy. It received additional support from
Ferrel 2 and Davis,3 and it was generally accepted until the early
1930's. It was believed that the following series of events occurred
in the equatorial trough: the warm moist surface air rose because of
both insolation and widespread convergence, resulting in numerous
cumulo-nimbus clouds and widespread heavy showers. Then the pressure
began falling slowly (for reasons never very well explained) and the
cumulo-nimbus clouds gradually coalesced. Thus, according to this
hypothesis, the energy driving the typhoon is originally supplied by
the heat of the calm air in the doldrums, and is afterwards largely
1J. Espy, Te iBsp1yTofEtorms, Boston, 184l, p. 552.
2W. A. Ferrel, Popular Treatise of the Wind, New York, 1889, p. 313.
3 01. M. Davis, Elementary eteorology, Boston, 1894., pp. 206-208.
a
produced by the liberation of latent heat of condensation. The typhoon
then develops true cyclonic violence by means of the deflecting force
of the earth's rotation.
Now we know that typhoons do not as a rule develop close to the
equator, since the deflective force of the earth's rotation is so
slight in low latitudes that it does not favor the whirling motion
characteristic of cyclone circulation. Also, this theory ignores
certain factors in the genesis of cyclones and the very pronounced
seasonal frequency distribution of typhoons. Therefore, this theory
cannot be used to explain the origin of the typhoon.
Mechanical othesis
The first mechanical hypothesis appears to have been suggested by
Dave. It was supported by Meldrum,2 Doberck, and Fassig.4 This
hypothesis assumes that typhoons are analogous to the whirls frequently
set up by friction between opposing currents of water in streams. But
Jeffries5 points out that the whirls between opposing currents in
streams never reach a greater velocity than the main currents.
1H. W. Dave, Law of Storm, London, 1862.
C. Meldrum, "On the Rotation of Wind Between Oppositely DirectedCurrents of Air in the Southern Indian Ocean," Proc. Mlet, Soc. (London),Vol. IV (1869), pp. 322-294.
3 W. Doberck, The Low of Storms, 1st ed., Shanghai, 1887, hth ed,,Hong Kong, 1904.
4O. L. Fassig, Hurricanes of the West Indian Ocean, U.S. WeatherBureau, Bull. X, ashington, 1913, 2, -plates J-i2.
5Harold Jeffries, "Theories as to the Origin of Tropical Cyclones"in Netwhar's "Hurricanes and Tropical Revolving Storms," Air MinistryGeophys. Memo (London), 2201 (1922), p. 105.
A modification of the mechanical hypothesis has been emphasized
by Bjerknes. A ccording to him, typhoons are initiated by counter-
currents of different tempera tures. The colder air moves under the
warmer, causing the latter to rise, and this process commonly induces
condensation. The condensation of the water vapor then supplies the
energy necessary to aintain the storms for a considerable length of
time, once they are started.
A more recent addition to the mechanical or counter-current
hypothesis is outlined by Bowie, 2 who believes that cyclones always
originate between opposing winds.
Many Japanese scholars, such as foriguti and Okada, have always
held a more plausible modification of the mechanical hypothesis.
Okada 3 states that within a narrow belt lying between the 25th parallel
and the equator, and between the 120th and 150th meridians, easterly
and westerly winds prevail along the parallels of latitude making small
angles with each other. As high temperature and humidity are found in
the area under consideration and both currents converge here, an
ascending motion of air is produced. Since the counter-currents of
air are not stable, any disturbance causes these currents to break up
into several whirls. Many small whirls coalesce into a large whirl
1 J. Bjerknes, "Theory of the Polar Front," Monthly Weather Review,Vol. XLI (1921), pp. 95-99; Vol. XL (1914), pp. 53-7o.
2E.,H. Bowie, "Formation and Mlovement of West Indian Hurricanes,"Monthly Weather Review, Vol 0 L (1922), pp. 173--179,
3 T. Okada, "The Present Status of Typhoon Investigations in Japan,"Proceeding of 5th Pacific Congress (Canada), Vol. 3 (1933), pp. 2-981-1983.

7
which becomes in turn a typhoon, providing the conditions in the neigh-
borhood are favorable, and the center of the typhoon becomes deeper
and the isobars take on a circular form. The progressive motion of a
typhoon as a whole then is controlled by the air currents which give
birth to a tropical storm.
This theory seems to fit the observed facts, but it still has some
difficulty in illustrating many phenomena.c In order for a typhoon to
exist there must be an uplift over a considerable area, together with
an air stream moving in such a direction as to bring the center of
upheaval into a latitude where the force of the earth's rotation is
enough to start the spiraling of the air around the center.
Frontal Hypothesis
In recent times there has been a growing tendency toward general
agreement among eteorologists that typhoons are of frontal origin.
This concept is not a new one. It started from the theory of the
Norwegian School. Professor V. Bjerknes had studied this particular
theory and had already mentioned an "Equatorial Front" in a lecture
printed in Nature, June 24, 1920. Recently Bergeron published an
article entitled "On the Physics of Fronts." In the conclusion he
says, "All troposphereic cyclonic disturbances seem to be, directly or
indirectly, of frontal origin." Since the actual known facts concern..
ing them are relatively few, a great variety of opinion about the
origin of typhoons has arisen.
:T. Bergeron, "On the Physics of Fronts," Bull, Amer. Met. Soc.(1937), p.2750
8
Father Gherzis who has long studied typhoons along the China
coast, stated that a typhoon is a "disturbance" in a trade wind air
mass traveling with that air mass. In the Caroline Island region the
air is usually calm and consequently accumulates more and more heat
and humidity. lie found that the trade wind lies on the north side of
the long, warm, and damp air wall, and that a southwest monsoon, ar-
riving from the equatorial regions and from the southern hemisphere,
lies on the other side. Owing to the direction of light wind observed
over the Caroline Islands, the air overlying them belongs to the
trade wind and is greatly attenuated in its course by the geographical
influence. A freshening in the trade wind could perturb these almost
stagnant parts of the extreme southerD border of the trade wind mass
and so produce a whirl which would be driven away by the more active
part of the same trade wind mass on a westerly track. A typhoon,
therefore, would result. Although Father Ghersi does not believe the
Norwegian frontal theory of typhoon origin, he still recognizes the
existence of fronts.
Father C. E. Deppermann of the Manila Observatory has published a
series of books about typhoon origin and structure, At the present
time his theory seems more advanced than those of others and is rec-
ognized by many meteorologists. His tdea is based on V. J. Bjerknest
front theory0 Evidence of frontal origin is seen in the somewhat un-
equal distribution of rainfall and in the wind dis continuities which
he has observed in Philippine typhoons.2
1E. Gherzi, Typhoon and Front, Zi-Ka-Wei Observatory, Shanghai, 1933.C, F. Deppermann, Outlines of Philippine Frontology, Manila, 1936;
'Wind and Rainfall Distribution mi Seeced Philippine Typhoons, Manila, 1937.

9
According to Deppermann's experience, no case came under his
observation in the Philippine region where a typhoon did not originate
in a front. In no case did a typhoon clearly originate within a homo-
geneous air mass, even the moist southwest monsoon. When the typhoon
started, the southwest monsoon, which is very moist even in high alti-
tudes, met with the trade winds or another air mass at a considerable
angle, or at least a surge of the one caused a steeper pressure gradi-
ent between the two, and thus conditions were favorable for the forci-
ble uplifting of one air stream over the other. The front covered a
considerable area.
The southwest monsoon is generally more moist and is found at a
greater altitude than either the trades or the northern winds, both of
which usually become very dry above 1.5 km. As soon as the southwest
monsoon reaches the point of condensation, the latent heat is liberated,
The process tends to warm the air; thus the southwest monsoon seems to
be a rather warm air mass. In other words, the origin of typhoons is
coincident with a surge of southwest monsoons.
Typhoons owe their violence to enormous amounts of heat energy.
Therefore, they can develop only in the presence of the hot, moist,
and unstable air found in certain sections of the equatorial front.
A consideration of the three chief theories of the origin of
typhoons reveals that each is supported by eminent meteorologists.
However, it seems that the frontal theory is the most satisfactory of
the three, for it is capable of explaining the genesis of cyclones,
the source of energy, and the frequency and distribution of typhoons.
Since typhoons originate in the low latitudes and traverse remote
oceanic areas, the acquisition of data required for a conclusive evalu-
ation of many theories concerning their origin and structure and for a
solution of the forecast problem has been difficult or impossible.
This is especially true in respect to information about the upper air.2
However, the most recent and persuasive theories are not substan-
tiated. If a detailed observational program were initiated for short
periods of time in low latitudes during the typhoon season, the new
data would prove invaluable in deriving new ideas and further clues
about the origin and structure of typhoons.
2. Energy Supply and Structure of Typhoons
A typhoon is a violent tropical cyclone which has exceptionally
low pressure in the center. A large cyclone moving from low latitudes
to high latitudes requires an enormous amount of energy in order to
produce gales and torrential winds.
Where does this energy come from? There is still some question
regarding its origin, Horiguti 2 does not believe that discontinuity
of temperature exists in the typhoon area. He believes that the prin.
cipal source of energy is the heat liberated by the condensation of
water vapor. The water content in the atmosphere is supplied from the
ocean. The energy of the typhoon is lost through radiation and the
1Gordon E. Dunn, Tropical Cyclones, Compendium of Meteorology,1951, p. 900. -
2Yosiki Horiguti, "Some Notes on Typhoons," Proceedings of the 3rdPacific Science Congress (Tolo), Vol. 2 (1926), po 1421,

11
friction of the winds. Both the gain and the loss of energy have been
calculated, and the results coincide. A typhoon is, so to speak, a
complete heat engine, in which the heat is supplied through the water
vapor. The refrigerator is the upper atmosphere. The heat energy is
converted into mechanical energy in the form of winds, horizontal and
vertical.
Dines and Davis,2 who have advocated that condensation alone is
sufficient to provide the energy for a typhoon, apparently considered
the maintenance of a storm after the whirl is established rather than
the energy involved in setting the vast mass of air into rapid motion.
Once the whirl is well established, the energy requirements are far
less.
3Shaw states that the chief cause of the death of cyclones is
their failure to secure a sufficient supply of warm, moist air. The
condition is brought about when the typhoon moves too far from the
ocean or other source of moisture, or when it comes into too cold a
region where all the winds are cold,
Gherzi stated that the real and principal source of energy in a
cyclone resides in condensation with its released latent heat., He
believes that "rain caused wind to be formed."
14- H- Dines, "The Energy of Cyclones," Monthly Weather Review,Vol. 49 (1921)s pp. .U4.
2W. Nl Davis, Elementary Meteorology, Boston, 1894, p. 200.
3No Shaw, "The Birth and Death of Cyclones; Introduction to Newnham's'Hurricanes and Tropical Storms'," Geophysical emoirs, No. 19, eteoro-logical Office Publication 2201, London, 1922 (M. Visher's report).
Gherzi, The Meteorology of China, Macau, 1951, pp.249-50.

12
Deppermanni stated that in low latitudes, where temperature dif-
ferences in the air stream, at least at the surface, are almost negli-
gible, the main energy is derived from the condensation of water vapor
from the storehouses of humid air. This requires strong convection
upward rather than horizontal translation, i.e., the southwest monsoon
contributes the greatest share of the energy of the storm by the con-
densation of its abundant water vapor, The convergence is due not so
much to influence or lack of it from the earth's rotation but to the
decided upward convection resulting from condensation of profuse
amounts of water vapor present, especially in the southwest monsoon.
All opinions seem to agree with the frontal origin of typhoons.
According to direct observation at Manila, 2 the southwest monsoon has
great relative humidity all the way up, and does not show the tendency
for rapid decrease of wetness aloft that characterizes Np and Tm air
masses. Hence the latent power is stored in the southwest monsoon air
mass.
In the center of the typhoon circulation there is an area of rela-
tive or absolute calm known as the eye of the storm. The diameter of
the eye is variable. It may be three or four miles in a young typhoon
and it may increase from 40 to 80 miles in diameter, but usually it is
about 12 to 15 miles. During the passage of the typhoon, the calm may
last a few minutes or it may last more than an hour, depending upon
the dimensions of the eye and its speed of displacement. The eye of
C. E. Deppermann, Outline of Philippine Frontology, Manila, 1936,pp. 17-23.
Co E. Deppermann, The Upper Air at anila, Manila, 1934.

13
any well-developed storm generally decreases in diameter as the storm
intensifies.
The eye is characterized by a sudden decrease in wind speed from
a very high to a very low velocity. The air may even become calm in
the eye, but immediately surrounding the eye the winds are strong.
Sometimes patches of blue sky are observed from a station during the
passage of the eye.
In the eye of a well-developed typhoon like "Marge" in August
1951, the eye was clear, surrounded by a vast coliseum of cloud whose
walls rose to a height of 35,000 feet. Clouds in the undercast layer
were grouped in bands which spiraled cyclonically about the opening.
In the center of the eye the stratocumulus overcast bulged upward in a
dome-like fashion to a height of 8,000 feet (Figure 1).
The lowest pressure usually can be observed in the eye of the
typhoon (Figure 2), where rains usually stop or decrease to a light
drizzle. The few exceptions may be due to local or orographical in-
fluences. After the eye has passed, the pressure rises abruptly, ex-
tremely high winds begin blowing in the direction opposite to that
preceding the passing of the eye, heavy rains pour down, and low clouds
cover the sky again.
The temperature condition in the eye is very interesting. During
the passage of the center calm in the M1anila typhoon of October 18,
1882 the temperature rose suddenly from 24 0 to 31.5o Co The relative
humidity, which was almost 100 per cent immediately before and after
the calm, dropped to 49.7 per cent. The rise in temperature may be

14
VERTICAL CROSSSECTION OF
EYE
HORIZONTAL
Soft 5tra4 -form Clouds
SECTION
Strc.ocurnu -.-
IL/S tops Lthrus - -+-0 g000 t
OF EYE
,--Very heavy -furbulence
Edg e of eye
C/ear space
>Yard cau/iflowerj clouds
Lowest- Surjace. pressures
AFTIE R SiMPoN
Figure 1. Horizontal and Vertical Section of the Eye ofTyphoon "Marge"

I 0 IIf
111HI I
IHIUllfl1 E
:1m -- I I-
Figure 2. The Relationship Between the Eyeof the Typhoon and the LowestPressure (after U. S. Navy)
-- m
t NI IL tII H 1
IFIN 140! M R 144 44 444 # I
16
due to insolation according to Algue, but Hauritz states1 that in the
eye of the storm there is a downward current which brings warm and dry
air to the ground; both Deppermann 2 and Okada 3 have found that a warm
core is by no means an invariable feature. Warming by descent would
involve a decrease in relative humidity.
Heywood observed a typhoon on the afternoon of November 23, 1939.
When the center calm was directly over Hong Kong he found that
. . . the warming temperature was not due to an increase inincoming radiation, for the sky remained overcast throughoutthe calm. The rain ceased at this time, but the comparativecoolness of the air outside the calm cannot have been due tocooling by evaporation from falling rain, for on the peakthe air remained saturated throughout. The fact that similarchanges occurred on a mount-iintop and near sea level rulesout any local foehn effect.4
Gherzi5 explained that the slight increase in temperature is due
to the lack of evaporation following a decrease in wind or, during the
1 B. Haurwitz, "The Height of Tropical Cyclones and the Eye of theStorms, " Monthly Weather Review, Vol. LXIII (February 1935), pp. 45-49.
C. Deppermann, Some Characteristics of Philippine Typhoons,Manila Observatory, 1939,
3 T. Okada, "On the Eye of the Storm," Mem. Imperial Marine Obser-vatory (Kobe), Vol. 1, p. 27.
4G. S. P. Heywood "Some Features of a Typhoon," Bull, of AmeroMet. Soc., Vol. 23 (19!2), p. 51.
5E. Gherzi, The Meteorology of China, Macau, 1951, pp.217-219.

17
day, the influence of the sun. He suggested that the temperature, of
the typhoon proper is between 250C. (770F.) and 270C. (80.6*F.). This
is why people feel cooler when a typhoon arrives in Shanghai, for the
mean temperature of July and August is 280C. (82h40F,) in Shanghai,
The same typhoon will give an impression of warmth in Japan, because
the mean temperature there is lower than the temperature of typhoons.
According to Simpsonts report1 on a mature typhoon of August 1951:
The walls of the eye on the west side were steep, eithervertical or overhanging, and had a soft stratiform appear-ance. On the east side, however, clouds were more a cumuli-form type with a hard cauliflowery appearance. In this sectorthe walls of the eye rose with a gradual concave slope to theupper rim. The overall appearance indicated that the axisof symmetry (in the vertical plane) was tilted to the eastor northeast.
This report gives a vivid impression of the shape of the eye.
Typhoons vary greatly in their size, extending from 50 to 1,000
miles in diameter, but the region of greatest destructiveness is a
strip from 10 to 30 miles wide on either side of the eye of the storm,
although the adjacent country on either side of the zone may suffer
almost as much. While storm damage by waves and wind may be limited
to a belt 30 to 50 miles wide, torrential rains may effect a wider
damage. The average size of typhoons also varies with the season.
Those of the main storm season are generally larger than those of the
less stormy months.
1 R. H. Simson, "Exploring the Eye of Typhoon 'Marget 1951,Bull, of the Amer. Mlet. Soc., Vol. 33 (1951), p. 290.

18
Early opinions often suggested that typhoons are very shallow
disturbances, The height of a typhoon was thought to be so low that
it could not cross a mountain range 3,000 feet high. Such opinions
were based on the observation that typhoons rapidly decrease in inten-
sity when they pass over land, particularly in crossing even a small
mountain range. Both Gherzi2 and Deppermann are auspicious of the
theory of mountain influence. Deppermann stated that "while a typhoon
does generally successfully pass over our mountain ranges, still it
suffers some los in minimum."
Many meteorologists have made estimates on the height of typhoons
based on calculations concerning temperature variations and on obser-
vations of clouds around a cyclone. They consider that a typhoon has
great vertical extent, at least 13,000 feet, and Selga has pointed out
that its height may reach six miles, or 31,680 feet.5
While the figures on the height of typhoons are still uncertain,
we can say that the height of some typhoons is around ten kilometers,
or about 31,000 feet.
1John Eliot, Handbook of Cyclonic Storms in the Bay of Bengal,Calcutta, 1900, p.-228.
E. Gherzi, The Meteorology of China, Macau, 1951, p. 222.
3 C. Depperman, ff. cit.
4B. flaurwitz, op. cit., p. 47; and G. S. P. Heywood, 2a. cit.,pp. 47-52.
5H. Selga, "The Height of the Typhoon," Proc. 3rd Pan-PacificScience Congress (Tokyo), Vol. 2 (1926), pp. 10i9-6.

19
3. Mean Tracks and Speed of Typhoons
The mean tracks of typhoons are hard to trace. There are many
differences of opinion concerning the classification of storms, and
what one authority considers to be just a severe storm, another may
regard as a typhoon. However, one can find many good charts illus-
trating the mean tracks of typhoons. Froc's atlas of the track& of
620 typhoons (Zi-Ka-wei Observatory) is an extremely valuable one, but
so many charts, each covered with a maze of tracks, are bewildering,
as he himself remarks.
Claxton's mapi covers the period from 1884 to 1930, and it is one
of the longest charted records we have. This chart shows the prev-
alence of typhoons in different regions of the Far East for each month
of the year* This is an excellent chart of areas affected, but it
does not show the actual tracks of typhoons. The information for
Figure 3 was obtained originally from Claxton's chart.
Typhoon tracks can be divided into two directions: (1) those
which move from east of the Philippines to the west or northwest and
into the southern part of the China Sea or to Indo-China and (2) those
which are parabolic in shape, moving first west and then north* Upon
crossing the latitudes 200 N. to 250 N., the latter typhoons recurve
to the east and northeast. These typhoons usually begin with a vari-
able direction and low velocity. After moving to the middle latitudes
and recurving their course, they begin to spread out and diminish in
intensity, although they may still be violent.
,TO F. Claxton, Isotypes, Hong Kong, 1932,

20
MEAN TRACKS OF TYPHOONS (1884-1930)
Figure 3. Mean Tracks of Typhoons (1884 - 1930)
21
The movement of a typhoon is controlled by the air mass to which
it is related, According to the frontal theory, at first the typhoon
often goes west or northwest along the equatorial front and then,
after it reaches the high latitudes, it turns northeast along the Np
or Tm front. Sometimes the typhoon goes directly to the west or the
northwest when the Tm air mass covers the area of southern China. In
winter when the continental air mass is strong enough to prevent the
advance of a typhoon, it often goes directly toward the west.
Typhoon movements generally follow a regular route. The path of
a storm is limited by the Siberian anti-cyclone on the one hand and by
the Pacific anti-cyclone on the other.
Typhoons vary greatly with respect to speed of travel. Some re-
main almost stationary for a day or two, while others have been known
to travel at the rate of fifty miles per hour, or 1,200 miles per day.
Their mean speed also varies with the seasons, particularly in cer-
tain portions of their courses. In general, the greatest speed is
achieved during the main typhoon season, from July to October, A
storm also travels much faster when it is going northeastward, after
recurving.
Formerly "stationary cyclones" were thought to occur, but the
studies of recent years indicate that, although many storms move very
slowly at first and sometimes while recurving, none are entirely sta-
tionary. Some oscillate back and forth, particularly while forming
and also while recurving. Some storm courses show loops, which give
the impression that the storm is stationary.

22
The unusually swift storms, those progressing more than 300 miles
a day in the tropics, or more than 600 miles a day after recurving,
apparently are related to a peculiar combination of chang'ing air pres-
sure conditions. Swift storms either move into an area of extremely
low pressure or are crowded forward by advancing areas of abnormally
high pressure.

23
III. TYPHOODS ON TiE SOU THEASTERN COAST OF CHINA
1. Annual Frequency and Monthly Distribution of Typhoons
There are several differences of opinion concerning the annual
frequency of typhoons, for a storm which one persons considers a true
typhoon may not be regarded as such by another. The variation in the
annual number of typhoons reported by different authorities for cer-
tain years is lis ted in the following table:
Table 1
No. of Total No, No. of StormsAuthor Period Years of Storms for Each Year
Algue 1880-1901 22 468 213
Froc 1893-1918 26 619 23.8
Visher 1880-1920 h1 917 22,4
Chu 1904-1915 12 247 20.5
Lu 1907-1936 30 637 21,2
Starbuck 188 -1896 50 989 19.7
Shih
1905-19391946-1947
1895-1945 51 875 17.1
From the foregoing list it appears that, on the average, the
annual frequency of typhoons is from 17.1 to 26,5. The figure varies
considerably and there is no indication of any cycle. As a rule, at
least twenty typhoons are detected each year in the Far East; however,

24
only a small number of these reach the southeastern coast of China.
In Hong Kong 74 typhoons were recorded during the 62 years from 1884
to 1941 and 1946 to 194941 Thus typhoons have occurred there on an
average of a little oftener than once a year.
As to monthly distribution, typhoons are most frequent from July
to October. This four-month period is commonly called the typhoon
season in the Far East. The frequency of typhoons in each month is
expressed in percentages of the annual total in the following table
(Table 2).
As a whole these figures, which have been gathered from various
authorities, agree well in percentage, although there are a few dis-
crepancies which are mainly due to the differences in the years re-
corded. The maximum frequency is either in August or September, and
the minimum is in February, March, and April.
The frequency of typhoons is related to the air masses. In winter
the continental air mass controls most of the area in the Far East, and
typhoons occur less frequently. The only place where a few small
storms can be created is at the latitude 50 N., but these storms dis~
appear very quickly. In summer the southwest monsoon enters in the
low latitudes of the northern hemisphere, and the continental air mass
retreats to the northwest. The maximum frequency of typhoons is thus
from July to October, There is another interesting phenomenon here.
The temperature of the ocean is warmest in August and coolest in
1G. Po Heywood, Hong Kong Typhoons, Royal Observatory, Hong Kong,1950, p. 3.

25
Table 2
PERCENTAGE4 OF M4ONTHLY DISTRIBUTION OF TYPHOONSFROM VARIOUS AUTHORITIES*
Authorities and the Periods Covered by Them(no. of yrs. given in parentheses)
Algue1880-1901
Months (22)
Jan.
Feb.
Mar,-
Apr,
May
June
July
Aug.
Sept.
Oct.
Nov.
Dec.
2
0
1
2
5
9
16
17
19
114
11
5
Okada1897-1911(15)
0.14
0.0
1.2
0.8
3,6
14.5
11,7
22.3
22.7
21.1
8.9
2.8
Froc1893-1918(26)
5
3
3
2
5.5
5.5
114
15
18
16
8
5
Visher Chu1880-1920(41)
L.0
1.9
2.3
2.6
5.1
6.1
15.4
16. 0
18.3
14.4
8.6
5.2
1904-1934(31)
1.6
08
1.2
1.2
4.1
507
16.14
21.2
19.2
15.1
8.2
5.3
*Algue,
"The Present
Cyclones of the Far East, Manila, 1904, p. 86; T. Okada,
Status of Typhoon Investigation in Japan," Proceedings of
the Fifth Pacific Scientific Congress (Canada), Vol. 3 (1933), p. 1981;
Lu1907-1936(30)
1.9
0.9
0.8
2.0
3.5
5.5
16.2
19.2
18,6
15.6
10.3
5.5
Starbuck1884-961905-391946-47
(50)
0.9
0.3
0,7
1,2
4.4
6.2
17.9
20.1
19.9
19.5
9.7
14.1
Shih1895-1945(51)
4
6
19
22
21
14
9
5

Louis Froc, Atlas of the Tracks of 620 Typhoons, Zi-Ka-Wei Observa-
tory, Shang-hai, 1920; S. S. Visher, "Notes on Typhoons, with Charts
of Normal and Aberrant Tracks," Monthly Weather Review, Vol. L
(November, 1922), pp. 584-589; Co-Ching Chu, "Climatology of China,"
Meteorological Institute of China, Vol. 7 (1936); A Lu, "The Typhoons
of the Far East," The Meteorology Magazine, Vol. 14, No. 6 (1939),
p. 263; Hen-han Shih, "Typhoons Which Have Raided China within 51
Years," Hsueh-i Tsa-chih, No. 8 (1946), p. 5.

27
February, coinciding with the months of greatest and least frequency
of typhoons.
Taking Hong Kong as a representative station on the southeastern
coast of China, the number of typhoons recorded for each month in the
years 1884 to 1941 and 1946 to 1949 is as follows:
Table 3
J. F. M. A. . . J. J. A. S. 0. N. D. Total
o 0 0 0 0 2 16 20 25 8 3 0 74
Typhoons occur with greatest frequency in August and September.
As yet none have been recorded during the period from June to November
inclusive, and the great majority have occurred in the months of July
to October. But average figures are sometimes misleading, for typhoons
recur at extremely irregular intervals, and on several occasions as
many as three typhoons have occurred in a single month (September 1887,
September 1894, September 1906, and July 1923).
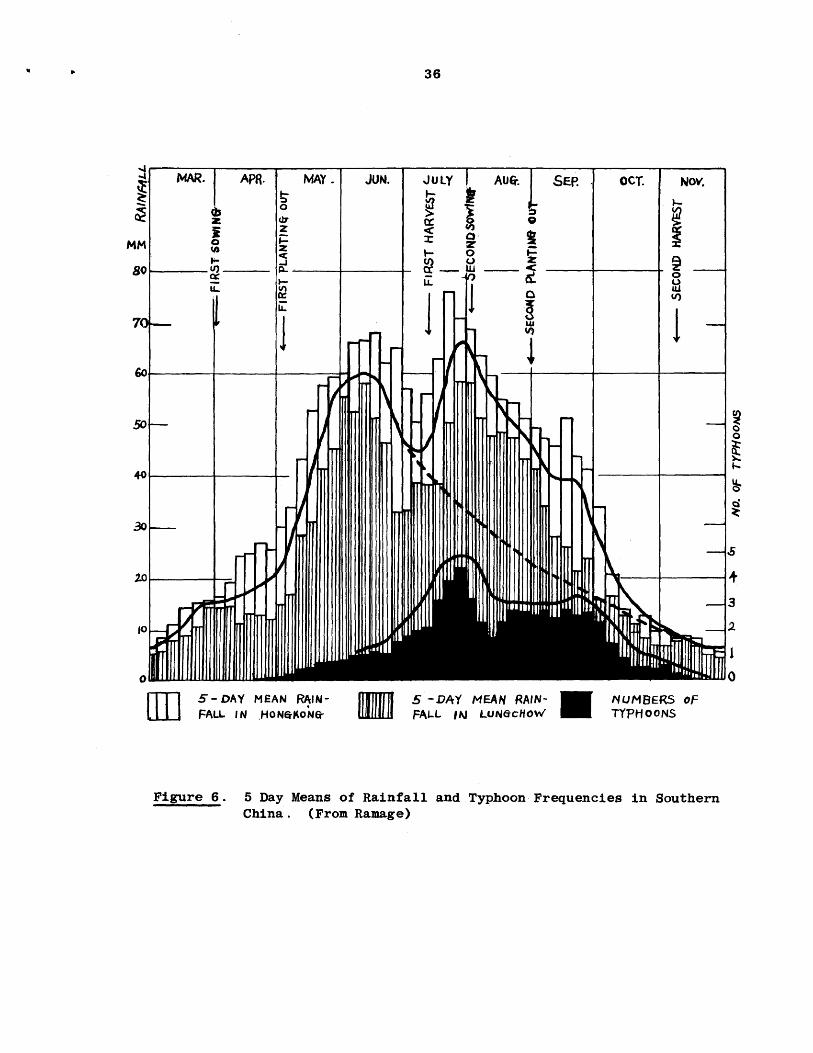
Figure 6 takes us a step further in the analysis of the fre-
quency of typhoons, showing the number of typhoons recorded at Hong
Kong in each five-day period. Typhoons are rare in June and the first
half of July; then there is a sharp rise in the frequency curve during
the se cond half of July. This curve falls off about the middle of
August and rises again in September. In October the frequency dimin-
ishes steadily, and in November only an occasional typhoon is recorded.
The decrease of the curve in the middle of August is connected with
1lIbid.

28
the fact that at this time of year there is a tendency for typhoons to
pursue a northwesterly track toward the Eastern Sea or Japan so that
the number moving WNW toward the southeas tern coast of China is tem-
porarily diminished.
If we use the data recorded by the weather bureau of Formosa and
reported by Shih, we can analyze the frequency of typhoons on the
southeastern coast of China in more detail. According to this data,
within the 51-year period from 1895 to 19L5 there were 875 typhoons in
East Asia--an average of 17 per year. Most of the typhoons either
blew themselves out or remained over the ocean. Only 291 reached the
mainland of China, making an average of six storms per year, while
Formosa suffered 98 typhoons in all, an average of about two each year.
Dividing the mainland of China into four sections, namely, Hainan
Island, Kwangtung, Fukien, and Chekiang and the area north of it, the
number of typhoons which reached each section for 51 years in terms of
months is given in Table 4. According to this table, typhoons reached
the mainland of China in July, August, and September more frequently
than in other months. If we look at the July column we notice that
the southern areas, with the exception of Hainan Island, suffered more
typhoon storms than the northern areas.
In the month of August the number of typhoons which reached each
section was the same as in July. In September the southern sections
again were hit more frequently.
Y. N. Shih, "Typhoons Which Have Raided China within 51 rears,"Hsueh-i Tsa-chihe, No. 8 (1946).

29
Table 4
MONTHLY DISTRIBUTION OF TYPHOONS ON THE SOUTHEAST COAST OF CHINA1
Chekiang and Number of typhoonsArea North of which reached theChekiang Fukien Kwangtung Hainan Is. mainland of China
May - 1 4 2 7
June - 4 7 4 15
July 19 29 35 10 93
Aug. 29 30 27 7 93
Sept. 5 21 22 9 57
Oct. 1 4 11 8 24
Nov. - - 2 2
51-yearTotal 89 108 40 291
Table 5 tells by per cents what proportion of the total number of
typhoons striking a given area occurred in a given month. From this
table we can draw these conclusions:
1. Eighty-four per cent of the total number of typhoons were
concentrated in the months of July, August, and September. This
figure includes the whole northeastern coast of China.
2. For the section of Chekiang and the area north of it, August
was the month in which there were the most typhoons, and July was
1 Computed from the data of the Wather tureau of Formosa andShih, op. cit.

30
Table 5
MONTHLY FREQUENCY OF TYPHOONS IN SOUTHE A STERN CHINA(in percentages)
Chekiang andArea North ofChekiang
35
54
9
2
100
Number of TyphoonsWhich Reached the
Fukien Kwangtung Hainan Is, Mainland of China
1 4 5 2
4 6 10 5
33 32 25 32
34 25 18 32
24 20 23 20
4 10 20 8
2 - 1
100 100 100
second, with 35 per cent, This area received over half of the total
annual typhoons suffered by China.
3. In Fukien and Kwangtung typhoons were most frequent in July,
August, and September. One-fourth or one-fifth of the total number of
typhoons for a whole year occurred during these three months,
4, Hainan Island suffered one-fifth of its total typhoons in
July, making that the month with the greatest frequency of typhoons,
Table 6 shows how typhoons behaved after hitting Foraosa. From
this information we may make the following five points:
May
June
July
Aug.
Sept
Oct.
Nov.
WholeYear

31
1. InMay Formosa had only one typhoon, which never reached the
mainland of China.
2. In June one-third of the typhoons which reached Formosa tended
to move to Fukien afterwards, the areas south and north of Fukien
escaping any encounter with them.
3. More than 80 per cent of the typhoons which blew over Formosa
in July and August proceeded to attack the continent. Most of them,
however, rushed upon Fukien and the region north of it.
4. Over 80 per cent of the typhoons in September traveled from
Formosa to China, but their main target was Fukien.
5. In October typhoons behaved as they had in June.
Table 6
NUMBER OF TYPHOONS THAT REACIED
OF CHINA AFTER BLOWING OVER
Destinationof TyphoonsleavingFormosa:
Chekiang andArea Northof It
Fukien
Kwangtung
Typhoons thatDisappearedin the Sea
Total No. ofTyphoons thatBlew OverFormosa
THE MAINLAND
FORMOSA1
WholeMay June July Aug Sept. Oct. Nov. Year
- - 2 5
- 2 22 25
.. - -
1W
15 1
1 5 1 6 6 2
1 7 35 36 25 3
- 7- 65
-4
1 22
1 98
1 Computedopo cit.
from the data of the weather bureau of Formosa and Shih,
-o -o

32
2. Tyhoons and Rainfall Patterns
From Father Gherzi t s map of annual precipitation in China it can
be noted that in southern China there are three areas of heavy rainfall
along the southeastern coast: one in Chekiang, another in northeastern
Kwangtung, and a third around Pakhoi (Figure 4). According to Alfred
J. Henry, the orographic influence does not seem to dominate in these
cases, because in Kweichow, where there are great mountains, the quan-
tity of rain received is well below that of the three zones mentioned
above. The abundant rainfall in the three regions mentioned seems to
be due to the effect of typhoons. 1
Yet a preliminary examination of the statistics concerning the
frequency of rainfall and typhoons reveals no apparent correlation.
Using data from Hong Kong, during the sixty years under consideration
35 typhoons occurred in years of less than average rainfall and 35 in
years having more than average rainfall. The average rainfall of Hong
Kong is 85.1 inches. The wettest and the driest years (1889 with
nearly 120 inches of rain and 1895 with less than 46 inches) each had
one typhoon. The year with the rainfall nearest the average had two
typhoons, Four typhoons occurred in each of the following years, all
of which were above average in rainfall: 1929, with 107 inches of
rain; 1894, with 104 inches; and 1893, with 100 inches. On the other
hand, three typhoons occurred in these years, all of which were below
1Alfred J. Henry, "Father E, Gherzi, S. J., on a 'Study of Rain-fall of China," Monthly Weather Review (January 1929), pp. 12-17 .
0

33
esg ss
%Soo
454
M. S
GfT
O ~/
Figure 4. Annual Precipitation of China. (After Gherzi)

average in rainfall: 1906, with 78 inches of rain; 1896, with 73
inches; and 1887, with 66 inches01
It appears, therefore, that on an average the total annual rain.
fall was largely independent of typhoon occurrences in Hong Kong or
southern China. This would indicate that several typhoons in any one
year do not necessarily mean that the total amount of rainfall for
that year will be excessive.
Although the wide variations in the amount of annual rainfall are
sufficient to mask any correlation between it and typhoon occurrences,
further investigation of monthly data shows that such a correlation
does exist. The data for average monthly rainfall in Hong Kong reveals
one maximum in June and July (Figure 5).
Using the five-day means of rainfall rather then- the monthly
means, however, we notice a peculiar double maximum, one peak occurring
in the middle of June, the other in the second half of July, with a
marked subsidiary minimum between them (Figure 6). (Rainfall in the
period from July 10 to July 14 is considerably less than that in the
succeeding five-day period, July 15 to July 19.) This significant
secondary minimum in the rainfall of Hong Kong usually occurs between
the fifth and tenth of July. The mean rainfall for the interval from
the fifth to the tenth of July is 50.5 mm,., compared with 65.5 mm. for
the period from the twentieth to the thirtieth of June, and 77 mm for
. Starbuck, A Statistical Survey of Typhoons and TropicalDepressions in the Niestern Pacirio ana Uina 3ea Area, 1004 To94y7(Hong Kong), Royal observatory of Hong Kong, 1951,~p. 9.

35
Ichas o4 geV80
20 -- i
0 .IZU
7
d
I
UU
UET~AMITAS OND~ MAX. MeULt N N.
Monthly Mean, Absolute Maximum and AbsoluteMinimum Amounts of Hong Kong Rainfall(55-year mean, 1884-1938) (From Starbuck)
Fiyure 5.
sol
36
5-DAY MEAN RAIN- 5 -DAY MEAN RAIN-FALL IN HoNEKoNEr FALL IAJ LUNecrHOw'
NUMBERS OFTYPHOONS
Figure 6. 5 Day Means of Rainfall and Typhoon Frequencies in SouthernChina. (From Ramage)
MM
0
37
the twentie th to the twenty-fifth of July. This apparent anomally in
the middle of the wet season marks the transition between two different
types of maxima of rainfall in Hong Kong.
In a recent paper Mr. C. S. Ramage pointed out that this secondary
minimum occurs not only in Hong Kong, which is typical of eastern
South China, but also elsewhere in southern China. For instance,
Lungchow, which is typical of western South China, has an even more
marked secondary summer minimum of rainfall than Hong Kong., (See
Figure 6.)
The five-day mean frequencies of typhoons affecting southern
China, illustrated by the same diagram, show a marked correlation with
the rainfall curve, subsidiary maxima and minima being generally coin-.
cident. It appears very probable, therefore, that the second maximum
of the rainfall curve is due to an added contribution of rain resulting
from typhoons.
It is significant also that of the 17 years when no typhoons
affected Hong Kong, 14 were proportionally deficient in rainfall for
the tjyphoon months (July to November); while of the seven years that
had either three or four typhoons each, six had a proportionately high
rainfall for the typhoon months.
The smoothed curve of five-day means (Figure 6) was extended from
the first maximum in June, interpolating the normal decrease in the
CS. Ramage, "Variation of Rainfall Over South China Throughthe Wet Season," Bulletin of the American Meteorological Society,Vol. 33 (1952), p. 309.

a
38
second half of that month and the first half of July to meet the curve
in the latter half of November. By subtraction, the rainfall attribu-
table to typhoons (shown by the dot-dash curve) amounts to about 20
per cent of the annual total. If this indeed be the case, a solitary
consoling factor emerges from southern China's susceptibility to
typhoon visitations: water supply in southern China, especially in
Hong Kong, would be a much greater problem.
The wet season of southeastern China may be conveniently divided
into six periods, each corresponding to the Chinese farming activities
(Figure 6).l
3. Typhoons in Hon
The Observatory of Hong Kong was founded in 1883, and from 1884
onward complete meteorological observation has been recorded continu-
ously, except during the war years 1942-1945 for which no records are
available. It is known, however, that no severe typhoons occurred
during these years. The following data on pressure, wind, and weather
in connection with typhoons in Hong Kong are summarized from the Obser-
vatory's report. 2
Pressure
Typical barograms illustrating the fall and rise of atmospheric
pressure during the passage of typhoons at distances of 5, 35, 70, and
100 miles from Hong Kong are shown in Figure 7. The curves vary widely.
1 Ibid.2G,~S. P. Heywood, Hong Kong Typhoons, 1950; L. Starbuck, op. cito

39
NOu$ K.1T.
Figure 7. Pressure in Hong Kong. (From Starbuck)

bi
40
A typhoon of moderate intensity passing at a considerable distance may
cause only a gradual fall and rise in the barometer (curve 1). On the
other hand, a well--developed typhoon, whose center passes close to the
observer, is characterized by a sharp V on the barogram (curve 5).
Three stages may be discerned in the fall of the barometer while a
typhoon is approaching; the sequence is 1lustrated in curve 5. In
the first stage (a-b) the fall is so gradual that the normal twice-
daily variation of atmospheric pressure is still evident. Perhaps six
hours before the passage of the center, the barometer begins to fall
more rapidly, and the diurnal variation of pressure is obscured (b-c).
Finally, a very steep fall sets in and continues until the center
passes (c-d), to be followed by ant equally steep rise. This sharp V
on the barogram corresponds with the core of violent winds around the
center of the typhoon. It is noteworthy that on the average the rise
in pressure after the passage of the center is more rapid than the
preceding fall, and the final reading of the barometer after the storm
has ended is some 3 mb higher than before it commenced,
Wind
Since the typhoons in the northern hemisphere rotate in an
anticlock-wise direction around the center, we see that when a typhoon
is approaching Hong Kong from ESE (the usual track) the wind sets. in
from the north or northeast, at first only lightly, but gradually in.
creasing in speed. Should Hong Kong lie to the right of the track so
that the center passes south of the island, the wind direction will
veer from northeast through east to southeast or south. On the other
of
4l
hand, if the center passes to the north or northeast of Hong Kong,
leaving it on the left of the track, the wind will back through north-
west to west or southwest.. The change in wind direction occurs at the
height of the storm when the center is nearest, and thereafter the wirri
begins to moderate. There is a third possibility--the calm center mzay
pass directly over the observer, in which case the wind, after reach-
ing its maximum violence from one direction, suddenly dies down almost
to a calm, only to set in again with equal force from the opposite di-
rection. The calm center has passed over Hong Kong only once since
records were commenced.
It is an ominous sign when a northerly Aind increases steadily in
force without any tendency to veer or back in direction, for this
means that the center of the storm is moving directly towards Hong
Kong. The highest hourly wind speed ever recorded was 69 knots during
the typhoon of July 29, 1896.
The wind reaches gale force when it attains a mean speed of 3L
knots (39 m.p.h., or force 8 on the Beaufort Scale). The duration of
typhoon gales is quite variable, depending on the speed at which the
storm is traveling and also on the extent of the gale area and the
distance at which the center passes the oserver. The longest gale
lasted for 27 hours, from October h to 6, 1891 ; it was causeda by a
rather slow-moving typhoon which approached from the southeast, re-
curved around Hong Kong, and moved away to the northeast after linger-
ing unpleasantly close for an unusually long time. On several occa-
sions the gale has lasted for only one hour; such a gale results from

42
tropical storms of small intensity or from storms passing at a con-
siderable distance from Hong Kong. The average duration of gales is
seven hours,
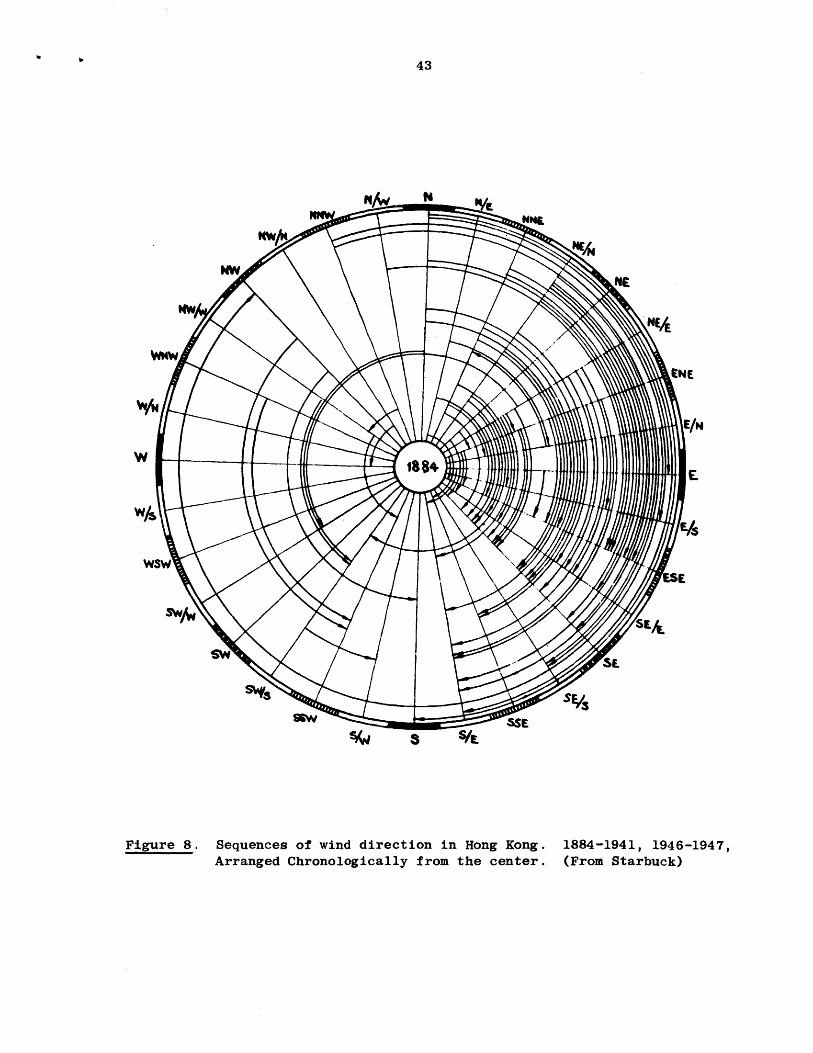
The sequence of wind directions during each gale is shown dia-
grammatically in Figure 8. Of the 74 typhoons that occurred in the
62-year period, 62 set in first from the northeast quadrant and twelve
veered in direction during the passage of the storm.
Weather
It is a striking fact that a snort spell of fine sunny weather
is almost always experienced in Hong Kong when an approaching typhoon
is entering the China Sea. The sky does not usually cloud over until
som 18 to 36 hours before the passage of the center, depending on the
size and speed of advance of the typhoon. The records show that fine
weather occurred in Hong Kong within 48 hours of the passage of 56 out
of the 73 typhoons for which reliable observations are available. Of
the 17 typhoons which were not preceded by a fine spell, several were
unusually slow moving and others did not approach from the southeast.
This characteristic good weather gave rise to the local saying that a
typhoon may be expected when the twin heads of Lantau peak are visible
The clear weather is probably due to the fact that the trade wind air~
stream aloft, after overtaking the typhoon on its northern side, tends
to diverge at some distance to the northwest of the center, with the
result that the air subsides and the clouds are dissipated.
The heaviest rainfall ever recorded in one hour during a typhoon
was 54.6 mm. (2.15 inches), which fell in the hour following the passage
43
S WE
Figure 8. Sequences of wind direction in Hong Kong. 1884-1941, 1946-1947,Arranged Chronologically from the center. (From Starbuck)

of the center during the typhoon of Soptember 2, 1937. The greatest
total rainfall ever recorded in 24 hours during a typhoon was 279.7 rm.
(11.01 inches) on the fifth and sixth of October, 1894); this typhoon
was the slow moving one alredy ICIt.one d as producing the most pro-
longed gale in Hong Kong, The : dries t" typhoon, which occurred on
October 12 and 13, 1890., produced r total of only 0.5 rmn..(0.2 inches) of
rain, However, it traveled apidly and passed well to the south of
Hong Kong.
It is of interest to not, that very heavy rainfall in Hong Kong
may have no connection whatever with a typhoon. The heaviest rain on
record occurred on July 19, 1926, when 100.7 mm. (3.97 inches) fell in
one hour and 53h.0 mm. (21.03 inches) fell in 24 hours during a pro-
longed and intense thunderstorm.

IV. TYPHOONS ON FORNOSA
1 Monthl qitribution of Typhoons and their Relationto the Rainfall Type
In a period of 51 years, 1895 to 1945 inclusive, 98 typhoons
struck Formosa causing varying degrees of damageo The distribution
of these typhoons, according to months, is as follows:
Table f1
Month: May June July August S Octo Nov 0 Whole Year
Number ofTyphoons: 1 7 25 36 25 3 1 98
The earliest month in which a typhoon visited Formosa was May and
the latest was November. For the five months from December to April,
there were no typhoons. About 36 per cent of Formosa typhoons were
concentrated in July, August, and September, one-third of the typhoons
occurring in August 0 One-f ourth of the typhoons came in July and
September, while another fourth occurred in the remaining months.
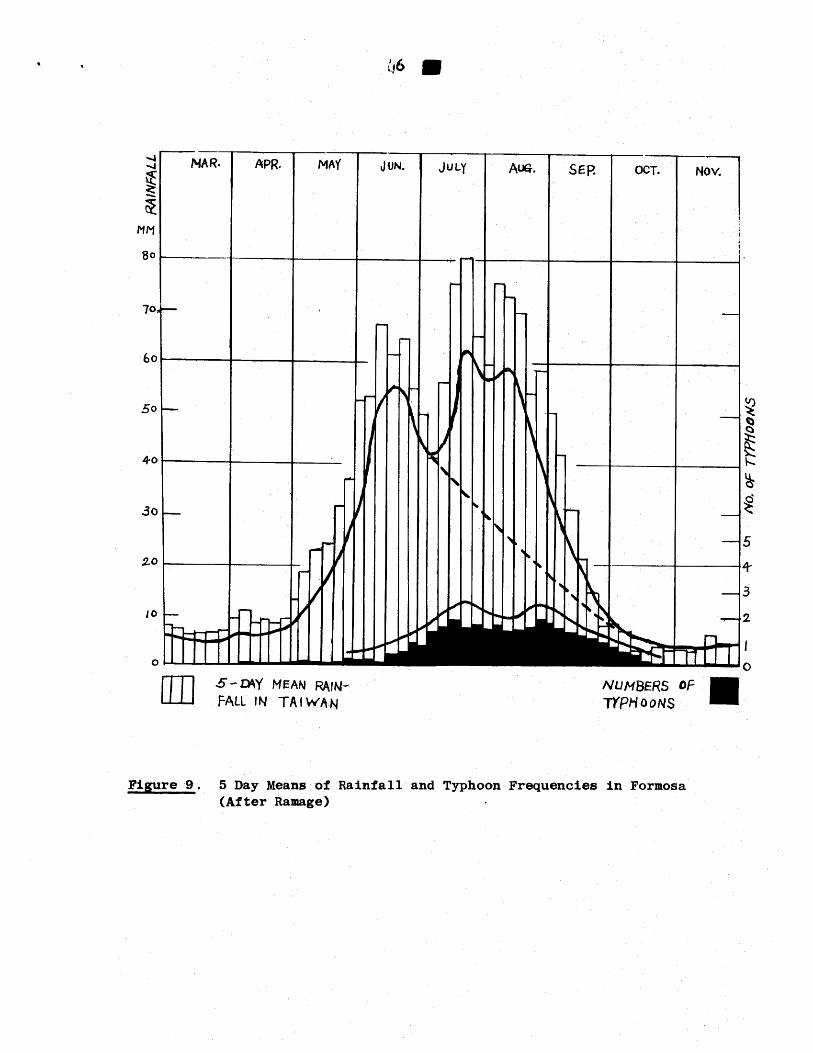
If we use the five-day means of rainfall for Formosa, as we did
with southeastern China, we notice peculiar double maxima, one peak
occurring in the middle cf June, the other in the second half of July,
with a marked subsidiary minimum between them (Figure 9). This sig-
nificant secondary minimum in the rainfall of Formosa usually occurs
1 0omputed from the Report of the eather Bureau of Formosa andShih, opo cit.
-44 NAR. APR. MAY JUN. JULY AUg. SEP. OCT.
so
180
70,
60
50-
4-0
30
20
S--DAY MEAN RAIN-- NUMBERS OFFALL IN TAIWAN TYPH00NS
Figure 9. 5 Day Means of Rainfall and Typhoon Frequencies in Formosa(After Ramage)
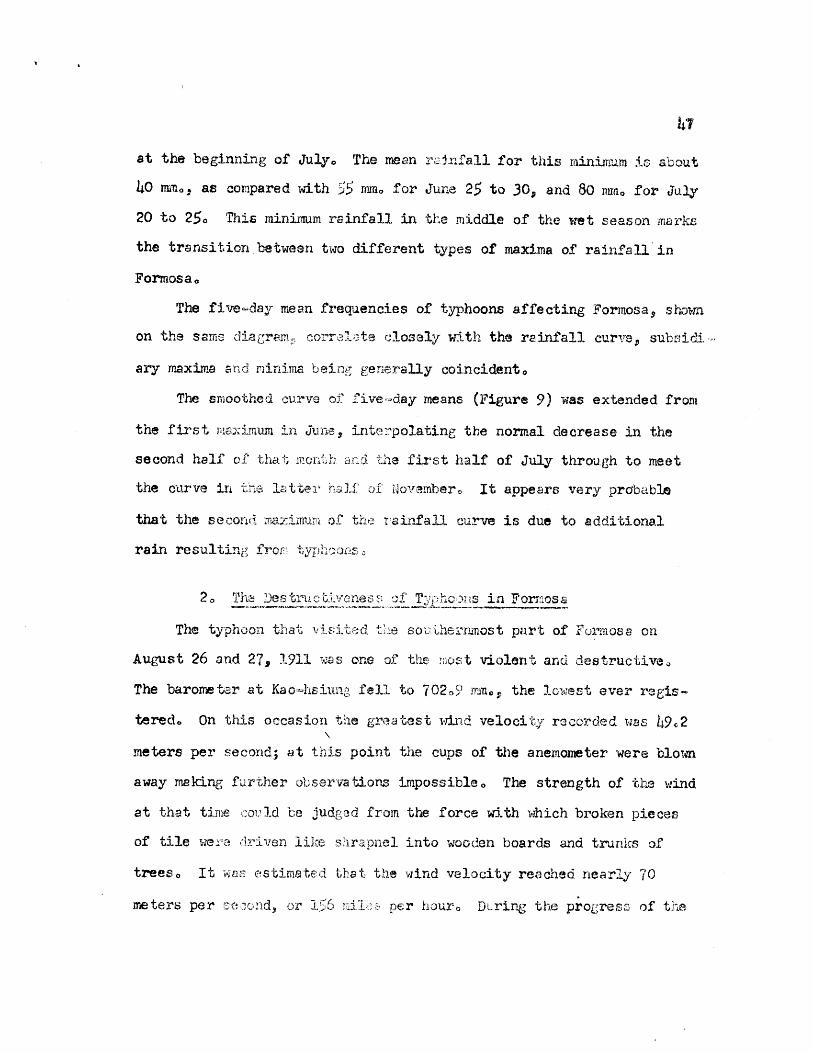
h7
at the beginning of July. The mean rinfall for this rinimum is about
40 mmr., as compared with S5 mmo for June 25 to 30, and 80 mmo for July
20 to 25. This minimum rainfall in the middle of the wet season marks
the transition between two different types of maxima of rainfall in
Formosa,
The five-day mean frecencies of typhoons affecting Formosa, shown
on the same dialgram correla cosely with the rainfall curve, sub~sidi
ary maxima and minima being generally coincident0
The smoothed curve of five-day means (Figure 9) was extended from
the first 4rinun in June, inteIpolating the normal decrease in the
second half of that month and the first half of July through to meet
the curve in the latter half of November 0 It appears very probable
that the secord maurimu of the r ainfal curve is due to additional
rain resulting fror t;yoons
2o TheDstru eness of Tyhns in Formosa
The typhoon that vUiLd the southernost part of Formosa on
August 26 and 27, 1911 was one of the ost violent and destructiv,
The baromter at Kao-hsiung fell to 702,,9 mrmjao, the lowest ever regis-
tered. On this occasion thie greatest wind velocity recorded was 49,2
meters per second; at this point the cups of the anemometer were bloun
away making further observa tions impossible0 The strength of the wind
at that time could be judged from the force with which broken pieces
of tile were- driven like shrapnnel into wooden boards and trunks of
trees0 It ws estimated that the wind velocity reached nearly 70
meters per pecnd, or 1j6 i e per houro Dring the projess of the

typhoon a velocity of 54,5 mm per second, or 122 miles per hour, wE
reached at Formosa. This storm inflicted terrible damage in the
southern part of the islnd. taking a toll of 305 human lives, witih 378
persons wounded, 190 missing, and more than 30,000 houses destroyed, 1
As an example, when the typhoon reached the district of Taitung -
the pressure fell to a low of 726.3 m, and the velocity of the uind
was registered at 46.3 mters per second, or 104 miles per hour, caus-
ing considerable damage to that district. However, when the storm ap-
peared on the west coast after crossing the central mountain range,
its strength had greatly decreased and its influence was scarcely felt
in that part of the island, In Formosa the barometer fell to 74546
mm0, but the wind velocity rche)- d only I8'S maters per second or homiles per hour2
The most violent and cestructive typhoon suffered by Formaos
struck the island on Septemer 25-26, 1964 The pressure of the center
fell to 703 mmo sE the storm approached the east coast of the island.
The average maximum wind velocity was i~O3 meters per second, and the
extreme maximum recorded was 55 meters per second. This great storm
destroyed 373.,748 houses, damnaged 56L,263 hectares of crops anid forest,
and 28,448 animals were reported lost, 154 persons killed, and 618"
persons injured03
1 The Climate, Typhoons and Earthquakes of the Island of Formosa,Taihokn- 71ftejo o gf~5ervatory ~T9R
2 Ibido3 jRep5ort of the weather bureau of Formosa, 1946.
49
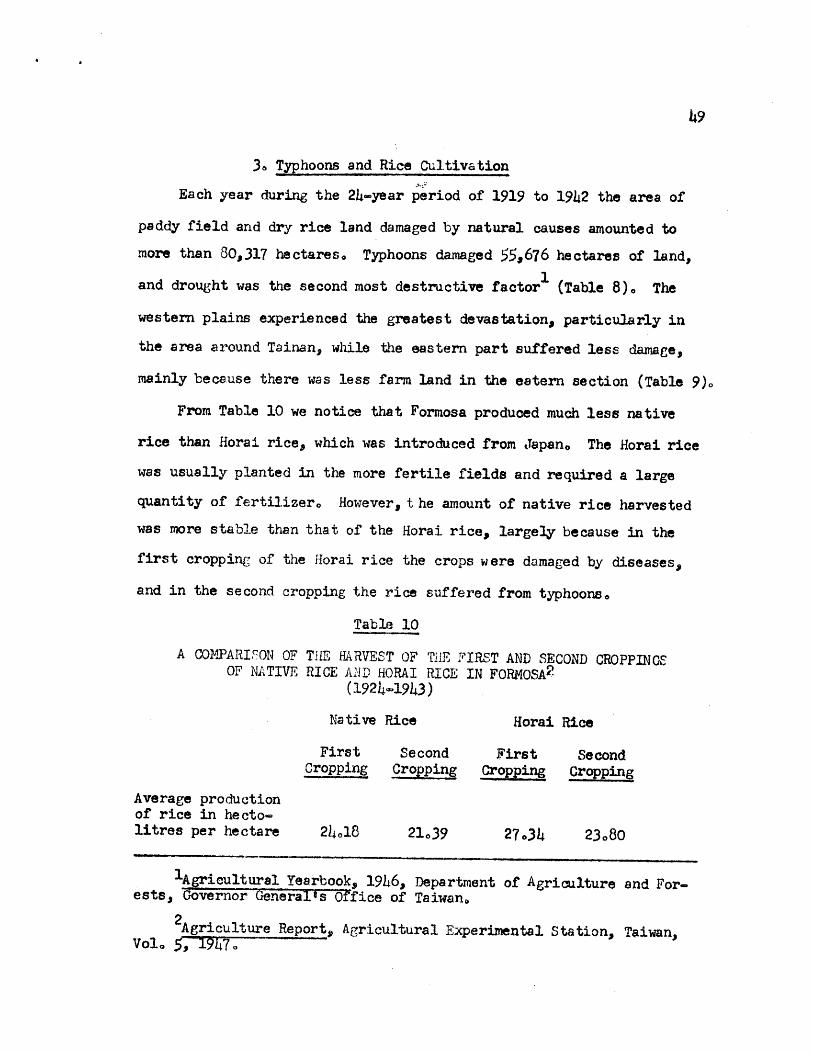
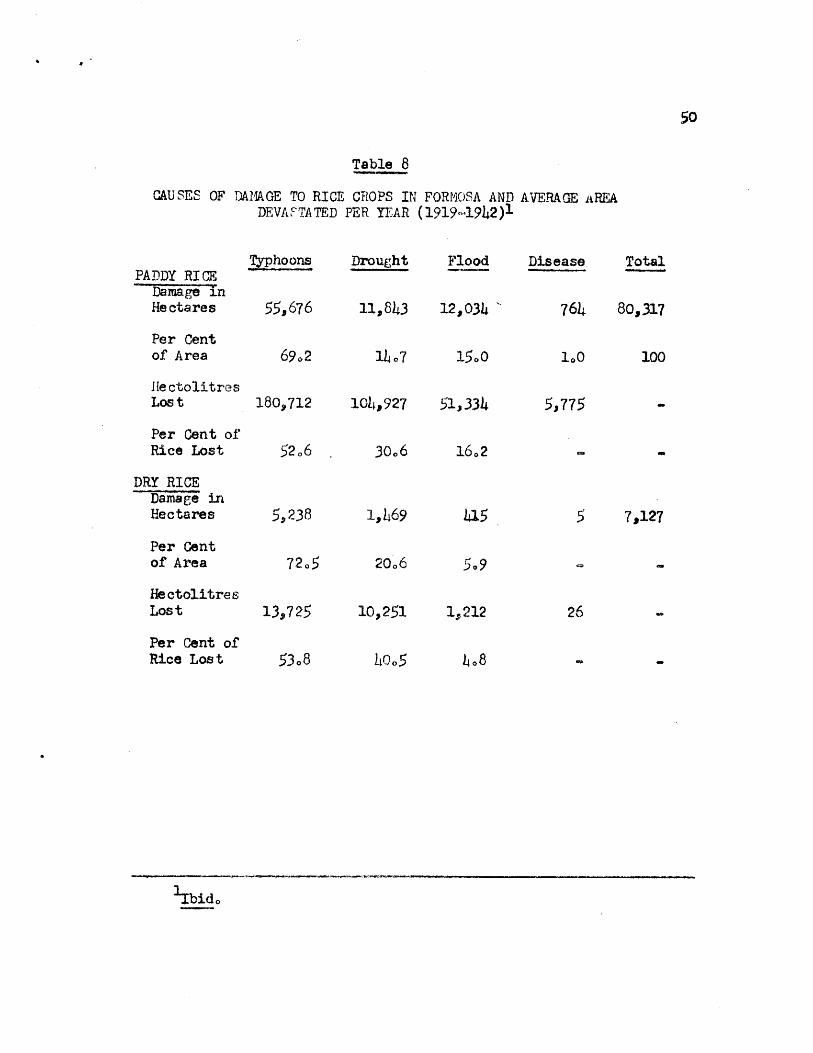
3. Typhoons and Rice Cultivation
Each year during the 24-year period of 1919 to 1942 the area of
paddy field and dry rice land damaged by natural causes amounted to
more than 80,317 hectares, Typhoons damaged 55,676 hectares of land,
and drought was the second most destructive factor1 (Table 8)o The
western plains experienced the greatest devastation, particularly in
the area around Tainan, while the eastern part suffered less damage,
mainly because there was less farm land in the eatern section (Table 9).
From Table 10 we notice that Formosa produced much less native
rice than Horai rice, which was introduced from Japan. The Horai rice
was usually planted in the more fertile fields and required a large
quantity of fertilizer. However, t he amount of native rice harvested
was more stable than that of the Horai rice, largely because in the
first cropping of the Horai rice the crops were damaged by diseases,
and in the second cropping the rice suffered from typhoons0
Table 10
A COMPARISON OF THE HA RVEST OF TiE FIRST AND SECOND CROPPINGSOF NATIVE RICE AND HORAI RICE IN FORMOSA 2
(1924-1943)
Na tive Rice Horai Rice
First Second First SecondCropping Cropping Cropping Cropping
Average productionof rice in hecto-litres per hectare 24,18 2139 27o34 23o8O
1Agricultural Yearbook, 1946, Department of Agriculture and For-.ests, Governor General's Office of Taiwan.
2Agriculture Report, Agricultural Experimental Station, Taiwan,Vol. 5, 1947.
so
Table 8
CAUSES OF DAMAGE TO RICE CROPS IN FORMOSA ANDDEVAFTA TED PER YEAR (1919-1942)1
AVERAGE 2dREA
PADDY RICEDamage inHectares
Per Centof Area
Ile ctolitresLos t
Per Cent ofRice Lost
DRY RICEDamage inHectares
Typhoons
55,676
69,2
180,712
52,6
5,238
Per Centof Area
HectolitresLos t
Per Cent ofRice Lost
13,725
5308
Drought Flood
11,843 12,034 '
lhe7 15,0
104,927 51,334
30.6
1,469
20,6
10,251
hoo5
Disease Total
764 80,317
100 100
5,775
16,2
5 7,127
5.9
1,212 26
1 Ibido
ho8

T )DA11AGED
Table 9
AE J-IN D1IFFERN COUNTIES 1
(1919-19h2)
Taichung
Tainan
Taipeh
Damaga3 insect res
17 ,893
17,633
13,392
Ka ohs iung
Hualien
Taitung
12 12
S1,93
Padd RicePer centof Area
33.2
21.9
16.7
1001
1 95
HectolitresLost73~662
71,957
89,801
52,710
41,573
6,1452
7,642
'Dr Rice
Hsinchu
Taichung
Tainarn
Taipeh
Kaohsiung
341 14C8
h,260
2.,316 32 5
13,569
9,613
Hualien
Taitunb
1Ibid e
Per centLost21"
21,0
26.2
15t,5
12.1
109
2.2
3108

If we compare the length of the growing periods of native rice and
Horai rice, we notice that the second crop of Horai rice matures earli-
or, as shown in the following table:
Table 11
COMPARISON OF THE NUMER OF GROWING DAYS IEQUIRED Bf NATIVE RICE ANDHORAI RIME (1935-1939)L
In Seed Beds Sprouting TotalSeed to to GroingBeds Sproutin Maturity
Native lst cropping )4.1 84.2 37.4 163.0Rice
2nd Cropping 32.5 75.2 34.5 142.5Horai'lci let Cropping 34.7 74.4 38.9 148.0
2nd Cropping 16.2 58.6 42.3 117.1
In the years 1933 to 1940 the second cropping of Horai rice usu-
ally sprouted in late September in northern and central Formosa, and in
mid-September in the southern part. As mentioned before, within a
period of 51 years (1895-1945 inclusive) there occurred 98 typhoons,
most of which struck in July, August, and September. One quarter of
the total number of typhoons occurred in September, and the fact that
September has frequent typhoons is extremely important because the
second croppig of Horai rice sprouts .in that month.
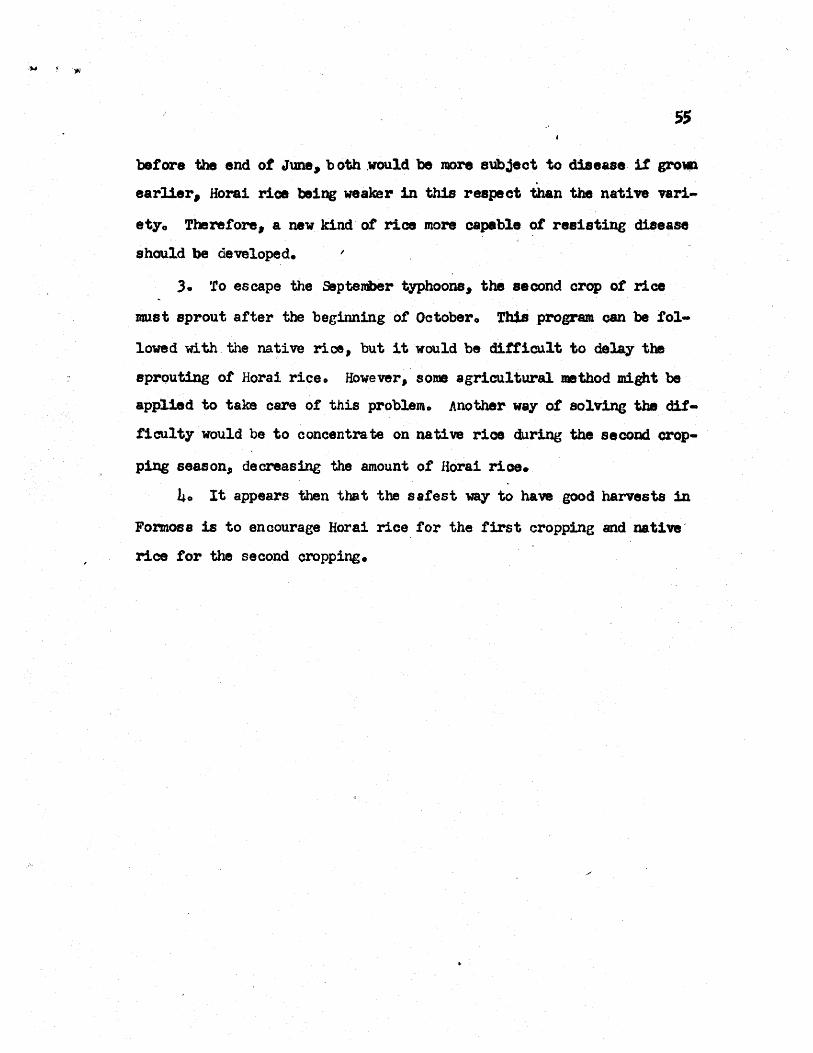
The amount of damage done to the rice crops by typhoons is closely
related to the stage of g:rowth of the rice at the time. Typhoons do
only slight harm to rice in the seed bed stage, and rice in the mature
1lbid. 4

53
stage does not suffer greatly from typhoons because it is strong enough
to resist such storms. The most serious damage results during the
sprouting stage, for at this point the rice is most adversely affected
by typhoons.
Figure 1C, which was prepared by an agronomist, illustrates this
point. If a typhoon were to strike when the rice was just in the
sprouting stage, 80 per cent of the crop would be destroyed, but if
the typhoon struck six days before the sprouting time, 25 per cent of
the crop would be destroyedo Moreover, if it struck two days after
the rice had sprouted, only 6 per cent of the crop would be destroyed.
Thus rice suffers the most dr~iamge during the sprouting stage. In
order to minimize the diastrous effects of typhoons, it appears
necessary to shift the time of planting the rice.
The following suggestions are offered in the interest of avoiding
typhoon damage:
l. Ths first crop of both native rice and Horai rice should be
started earlier so that the crop will mature before the end of June,
and the secon c. rop should be planted later so that its period of matu-
ration will fall in October 0 In this way the rice would not be in its
most vulnerable stage during the main typhoon season, from June to
September.
2, However, several problems arias While it is easily possible
for the first crooir-g of both native :rice and lorai rice to mature
Ibido

6000 70
40O0
-20
o 10
IL0
14 12 10 g 6 4 2 0 2 4 6 10 2 14
DAYS BEFORE SPROUTING DAYS AFTER SPROUTING
Figure 10. The Possible Damage to Rice Crops by Typhoons
1)
before the end of June, both would be more subject to disease if grom
earlier, Horai rice being weaker in this respect than the native vari-
ety. Therefore, a new kind of rice more capable of resisting disease
should be developed.
3. To escape the September typhoons, the second crop of rice
must sprout after the beginning of October. This program can be fol-
loved with the native rice, but it would be difficult to delay the
sprouting of Horai rice. However, some agricultural method might be
applied to take care of this problem. Another way of solving the dif-
ficulty would be to concentrate on native rice during the second crop-
ping season decreasing the amount of liorai rioe.
4. It appears then that the safest way to have good harvests in
Formosa is to encourage Horai rice for the first cropping and native
rice for the second cropping.

56
A SELECTED BIBLIOGRAPHI
Books
Claxton, T. F. Isotypes. Hong Kong, 1932.
Deppermann, C. E. Outline of Philippine Frontolo anila, 1936.
Some Character of Philippine Typhoons, Manila, 1939
Temperature in the Fye of Some Typhoons. Manila, 1937.
The Upper Air at Manila. Philippine Weather Bureau.
Manila, 1934.
Wind and Rainfall Distribution in Selected Philippine
Typhoons. Manila, 1937.
Froc, Louis, S. J. Zi-Ka-Wei Observatory Atlas of the Tracks of 620
Typhoons, 1893-1918.
Garbell, Maurice A. Tropical and Equatorial Meteorology. Ditman
Publ. Co., 1947.
Ghersi, E. The Meteorology of China. Macau, 1951.
Typhoons. in 1933. Shanghai, Z i-Ka-W8i, 1933.
fleywood, G. S. P. Hong Kong Typhoons. Hong Kong, 1950.
Malone, T. F. Compendium of Meteorology, American Meteorological
Society. Boston, 1951. pp. 859-916.
Starbuck, L. A Statistical Survey of Tyhoons and Tro ical Depressions
in the WIestern Pacific and China Sea Area. Hong Kong, 1951.

57
Periodicals
Bergeron, T. "On the Physics of the Fronts,." Bulletin of the American
Meteorological Society. Vol. 18, No. 9 (1937).
Chu, Co-Ching. "Climatology of China." Meteorological Institute of
China, Vol. 7 (in Chinese).
"A New Classification of Typhoons of the Far East,"
Monthly Weather Review, Vol. LII (1924).
Deppermann, C.E. "Typhoons and Depressions Originating to the Near
East of the Philippines0 " Bulletin of the American Meteorological
Society, Vol. 22, 19J1.
Ghersi, E. "On the Constitution of Typhoons." Bulletin of the Ameri-
can Meteorological Society, Vol. 19 (1938).
Haurwits, B. "The Height of Tropical Cyclones and the iye of the
Storm." Monthly Ieather Review, Vol. XIII (1935).
Lu, A. "Typhoons of the Far East." Meteorological Magazine of China
Vol. 14, No, 6 (in Chinese).
Okada, T. "On the Eye of the Storm." memoirs of the Imerial Marine
Observatory, Vol. 1.
Ramage, C. S. "Variation of Rainfall over South China through the itt
Season." Bulletin of the American Meteorological Society, Vol.
33 (1952)0
Scofield, Edna, "On the Origin of Tropical Cyclones." Bulletin of the
American Meteoroloical Soc:1t, Vol 0 19 (1938).
Selga, M. "The Height of Typhoons." Proceedings of the Third Psn..
Pacific Science Congress, 1926.

La i I
58
Shih, Y. H. "Typhoons which have raided China within 51 Years.l
Hsueh-i tea-chih, No. 8 (1946), (in Chinese).
Simpson, R. H. "Exploring the Eye of Typhoon 'Marge.'" Bulletin of
the American Meteorological Societ Vol. 33 "1951).
Tu, Chang-wang. "A Note on the Constitution of Typhoons." Bulletin
of the American Meteorological Vol. 20 (1939).
Goverrunent Publications
Agriculture Report, Agricultural Experimental Station, Taiwan, Vol. 5,1947.
Agriculture Year Book, Department of Agriculture and Forest, Governor
General's Office, Taiwan, 1946.
United States Navy0 Typhoons and Hurricanes, Aerology Series No. 10.
Carino, I. D. Tropical Cyclones of 1950, Manila Weather Bureau.
Flores, J. F. and J. J. Tecson, Tropicalyclones of 1949, Manila
isather Bureau.
Typhoons and Hurricanes, United States Navy Aerology Series No. 10,


