45th Annual Report 2015 BC M -...
51
BC M 45th Annual Report 2015 COTTON MILLS LIMITED BABRI
Transcript of 45th Annual Report 2015 BC M -...

BCM
45th
Annual Report
2015
COTTON MILLS LIMITEDBABRI

Pages
COMPANY’S PROFILE ...............................................................2
VISION & MISSION STATEMENT .............................................3
NOTICE OF ANNUAL GENERAL MEETING.............................4
DIRECTORS’ REPORT TO SHAREHOLDERS.........................5
SUMMARY OF KEY OPERATING & FINANCIAL DATA..........9
PATTERN OF SHAREHOLDING ................................................10
STATEMENT OF COMPLIANCE
WITH THE CODE OF CORPORATE GOVERNANCE ...........12
REVIEW REPORT ........................................................................14
AUDITORS’ REPORT ..................................................................15
BALANCE SHEET........................................................................16
PROFIT & LOSS ACCOUNT .......................................................17
CASH FLOW STATEMENT .........................................................18
STATEMENT OF CHANGES IN EQUITY.......................................19
NOTES TO THE FINANCIAL STATEMENTS ................................20
CONTENTS
ANNUAL REPORT 2015

2
COMPANY'S PROFILE
BOARD OF DIRECTORS
Mr. Raza Kuli Khan Khattak
Chief Executive
Mr. Ahmed Kuli Khan Khattak
Mrs. Zeb Gohar Ayub
Mrs. Shahnaz Sajjad Ahmad
Dr. Shaheen Kuli Khan Khattak -Chair Person
Mr. Muhammad Ayub
Ch. Sher Muhammad
Dr. Hamid Zeb Khan
AUDIT COMMITTEE
Mr. Ahmed Kuli Khan Khattak
Chairman
Mrs. Shahnaz Sajjad Ahmad
Member
Ch. Sher Muhammad
Member
Mr. Muhammad Ayub
Member
HUMAN RESOURCES
AND REMUNERATION COMMITTEE
Ch. Sher Muhammad
Chairman
Mr. Raza Kuli Khan Khattak
Member
Mr. Ahmed Kuli Khan Khattak
Member
Mr. Muhammad Ayub Member
COMPANY SECRETARY Mr. Ali Waqas , ACCA
CHIEF FINANCIAL OFFICER Mr. Ali Waqas , ACCA
INTERNAL AUDITOR
Mr. Nasir Ali Khan , ACCA
AUDITORS
M/s Hameed Chaudhri & Co.,
Chartered Accountants.
SHARE REGISTRARS
Hameed Majeed Associates (Pvt) Ltd.,
5th Floor, Karachi Chambers,
Hasrat Mohani Road,
Karachi
Tel : (021) 32424826, 32412754
Fax: (021) 32424835
BANKERS
National Bank of Pakistan
Saudi Pak Industrial and Agricultural
Investment Co. Ltd.
REGISTERED OFFICE & MILLS
Habibabad, Kohat
Tel : (0922) 862285 -
862292
Fax : (0922) 862283web site: www.bcm.com.pk.Email: [email protected].
ANNUAL REPORT 2015

3
To be market leaders in yarn, building company's image through innovation and competitiveness, ensuring satisfaction to customers and stakeholders and to fulfill social obligations.
As lead producers of quality yarn we will build on our core competencies and achieve excellence in performance. We aim at exceeding expectations of all stakeholders. We target to achieve technological advancements and to inculcate the most efficient, ethical and time tested business practices in our management.
ANNUAL REPORT 2015

4
NOTICE OF ANNUAL GENERAL MEETING
thNotice is hereby given that the 45 Annual General Meeting of the shareholders of Babri Cotton Mills Limited (the Company) will be held at the registered office of the Company at Habibabad, Kohat on 25 October, 2015 at 12.00 P.M to transact the following business:
1. To confirm minutes of the Annual General Meeting held on October 27th, 2014.
2. To receive, consider and adopt the audited accounts of the Company for the year ended June 30, 2015 together with the Directors' and Auditors' reports thereon.
3. To appoint Auditors for the year ending June 30, 2016 and to fix their remuneration.
4. To consider any other business with the permission of the Chair.
NOTES:
1. The share transfer books of the Company will remain closed from October 16, 2015 to October 23, 2015 (both days inclusive).
2. A member entitled to attend and vote at this meeting may appoint another member as his/her proxy to attend the meeting and vote for his/her behalf. Proxy instrument in order to be effective must be received at the registered office of the Company duly stamped and signed not less than 48 hours before the time of holding the meeting.
3. Individual shareholder/proxy shall produce his/her original national identity card or original passport at the time of attending the meeting and nominee of corporate entity shall produce the board of directors' resolution/power of attorney containing specimen signature of the nominee attending the meeting.
4. The shareholders registered on CDC are also requested to bring their Participants' ID numbers and accounts numbers in CDC. Further, CDC Account Holders will have to follow the guidelines as laid down in Circular 1 dated January 26, 2000 issued by Securities and Exchange Commission of Pakistan for attending the meeting and appointment of proxies.
5. Shareholders are requested to notify the change of their addresses, if any, to Share thRegistrar, M/s Hameed Majeed Associates (Pvt.) Limited, 5 Floor, Karachi Chamber,
Hasrat Mohani Road, Karachi. Tel No. 021-32424826
ANNUAL REPORT 2015
Kohat
Dated: September 28 , 2015
Ali Waqas Company Secretary

5
DIRECTORS' REPORT TO THE SHAREHOLDERS
The directors are pleased to present 45th annual report of your company together with audited financial statements and auditors' report thereon for the year ended June 30, 2015. The directors' report, prepared under section 236 of the companies ordinance, 1984 and clause of (xix) of the code of corporate governance will be put forward to members at the 45th annual general meeting of the company to be held on 25 October, 2015. Figures for the previous year ended June 30, 2014 are included for comparison.
General Overview
Textile sector contributes significant portion to the economy of Pakistan and currently it is facing grim challenges due to depressed market demand for yarn. Lower demand of yarn in local and international markets has severely affected the profitability during the fiscal year 2014-2015. Due to decline in yarn export abundant supply of yarn is available in local market which is major cause of decrease in yarn prices. With the grant of GSP+ status to the Pakistan by the European Union, it was expected the financial year 2014-2015 would bring in higher orders and better textile exports for the country. However the overall expected growth in textile exports was dampened by the slump in US and European markets. Resultantly, the textile export targets were not achieved as expected.
The current fiscal year has not been very good for the textile industry as a whole. Textile business is facing number of challenges and stiff competition. The previous three years had been excellent for the spinning sector as both the demand and margins were high. During the current financial year, the company has registered sales of Rs.1.758 billion as compared to Rs.1.927 billion of corresponding financial year ended 30 June, 2014. Main reason for heavy losses is due to high labor cost & increase in power tariff. Unfavorable market rates also affected the performance adversely.
Financial Results
Current year's results compared with previous year are given as under:
Year ended June 30,
2015 2014 (Rupees in thousands)
Sales
1,757,969
1,927,396
Gross Profit/(Loss)
(6,285)
233,713
Operating Profit/(Loss)
(76,329)
142,465
Finance Cost
(48,634)
41,421
Profit/(Loss) before Taxation
(123,803)
113,915
Profit/(Loss) after Taxation
(85,587)
82,020
----------Rupees----------
Earnings/(Loss) per share
(23.43)
22.46
ANNUAL REPORT 2015

6
The volume of yarn production has improved to 4,738,775 Kgs as compared to 4,704,560 Kgs during the last financial year, which is 34,215 Kgs (0.73%) higher than preceding year.
Due to this reason the management of the company has been making efforts to revive the operation
of the mill and is fully aware of the present challenges prevailing in the textile industry and is hopeful
that its efforts will be successful. The board of directors is cognizant of these facts and strives to take
all necessary steps to protect the interests of its stakeholders.
The company has also accounted for its share of profit of Janana De Malucho Textile Mills Limited (an Associated Company) amounting Rs.1.160 million during the current year as against profit of Rs.12.871 million in 2014.
The break-up value of company's share (excluding surplus on revaluation of fixed assets) stands at Rs.166.21 per share as at June 30, 2015 (2014: Rs.184.31 per share).
Status of Financial Facilities
During the year, the company has repaid whole liability against demand finances. A finance lease of Rs.63.00 million was obtained from Saudi Pak Industrial and agricultural investment company limited for lease of one generator and four simplex. Rs.12.614 million against subject to finance lease has been paid during the year.
The company has fulfilled all its financial commitments during the year under review and subsequently as well. The financial position of the company is sound as reflected by the current, debt/equity ratios and break-up value of share.
Future Prospects
Ongoing power shortage and increase in cost of electricity and gas prices are still playing havoc on the textile industry even after getting the GSP plus status, due to which the industry's export has reduced by 3.83 percent in the month of June, 2015. Incumbent government must initiate serious efforts in order to ensure benefits of GSP Plus status, smooth running and growth for textile industry by providing low cost un-interrupted power supply, better law and order situation and improved textile policy.
The management is fully abreast of the conditions it is being faced with and will strive to ensure continued growth, operational efficiency and optimum results for the company and its valued stake holders. In order to improve the quality of yarn we have imported compact system for 10 ring frame valuing Rs.15.476 million and a LC for Rs.18.279 million for import of one Automatic Cone Winder model Q-Pro has been opened.
Appropriation of dividend
Keeping in view the financial commitments of the company and difficult economic/ industry scenario, the board of directors has decided not to recommend any dividend for the year under review.
ANNUAL REPORT 2015

Contribution of Our Company towards Government and Social SectorWe would like to give here under our company's revenue contribution toward the government sector, bank and social sector during the year ended 30-06-2015.
1. Government Sector Rs. In Million
(i) Income/Sales Tax 68.736
(ii) Power & Fuel 212.006
(iii) Financial institution/Banks 48.653
2. Social Sector
Employees/Workers salaries/Wagesand other benefits 298.057
We are also providing employment to 1155 permanent workers (1155 families with an average 5 family member in the most affected area of KPK province) the employment cost of which will now be about Rs.315 million.
Reply to Auditors' ObservationthPosts of CFO & Company secretary were advertised in Dawn news paper dated April 20 2015. Due
to turbulent law and order situation in Khyber Pukhtun Khawa no positive response was received. However, now Mr. Ali Waqas has been appointed as CFO and Company Secretary.
Corporate and Financial Reporting Frame Work
The board regularly reviews the company's strategic direction and sets annual plans and performance targets. The targets are regularly checked to find out whether they are being achieved by the management. The board assures the share holders that the company is abiding with the provisions of code of corporate governance implemented through the listing regulations of the Karachi Stock Exchange Limited. The board further states that:
a) There has been no material departure from the best practices of the corporate governance, as detailed in the listing regulations of The Karachi Stock Exchange Limited.
b) The financial statements, prepared by the management of the company, presents fairly its state of affairs, the results of its operations, cash flows and changes in equity.
c) Appropriate accounting policies have been consistently applied in preparation of these financial statements and accounting estimates are based on reasonable and prudent judgments.
d) International accounting standards, as applied in Pakistan, have been followed in preparation
of these financial statements and departures there from have been adequately disclosed.
e) The system of internal controls is sound in design and has been effectively implemented and
monitored.
f) There are no significant doubts upon the company's ability to continue as a going concern.
g) Summary of key operating and financial data of the past seven years is annexed.
h) Pattern of share holdings of the company as at June 30, 2015 is annexed.
ANNUAL REPORT 2015
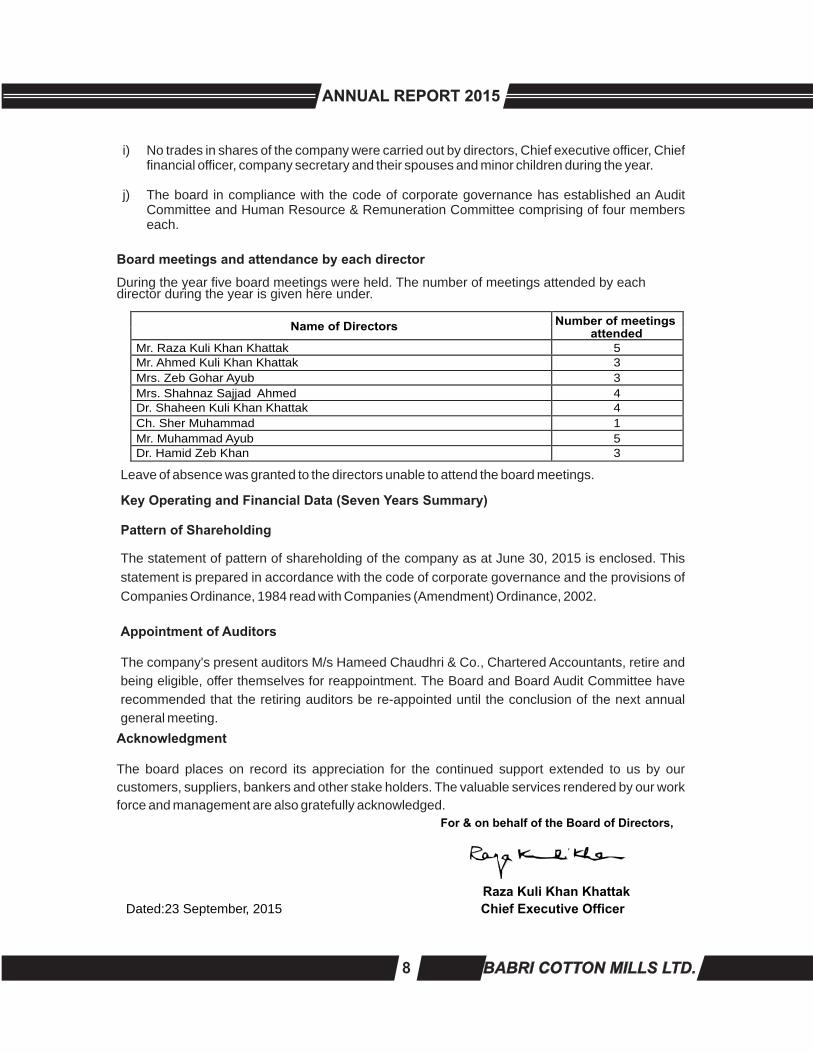
i) No trades in shares of the company were carried out by directors, Chief executive officer, Chief financial officer, company secretary and their spouses and minor children during the year.
j) The board in compliance with the code of corporate governance has established an Audit Committee and Human Resource & Remuneration Committee comprising of four members each.
Board meetings and attendance by each director
During the year five board meetings were held. The number of meetings attended by each director during the year is given here under.
Leave of absence was granted to the directors unable to attend the board meetings.
Key Operating and Financial Data (Seven Years Summary)
Pattern of Shareholding
The statement of pattern of shareholding of the company as at June 30, 2015 is enclosed. This statement is prepared in accordance with the code of corporate governance and the provisions of Companies Ordinance, 1984 read with Companies (Amendment) Ordinance, 2002.
Appointment of Auditors
The company's present auditors M/s Hameed Chaudhri & Co., Chartered Accountants, retire and being eligible, offer themselves for reappointment. The Board and Board Audit Committee have recommended that the retiring auditors be re-appointed until the conclusion of the next annual general meeting.
Acknowledgment
The board places on record its appreciation for the continued support extended to us by our customers, suppliers, bankers and other stake holders. The valuable services rendered by our work force and management are also gratefully acknowledged.
8
For & on behalf of the Board of Directors,
Raza Kuli Khan Khattak
Dated:23 September, 2015 Chief Executive Officer
Name of Directors
Number of meetings
attended
Mr. Raza Kuli Khan Khattak
5
Mr. Ahmed Kuli Khan Khattak
3
Mrs. Zeb Gohar Ayub 3 Mrs. Shahnaz Sajjad Ahmed 4 Dr. Shaheen Kuli Khan Khattak 4 Ch. Sher Muhammad
1
Mr. Muhammad Ayub
5
Dr. Hamid Zeb Khan
3
ANNUAL REPORT 2015

9
2009 2010 2011 2012 2013 2014 2015
CAPACITY AND PRODUCTIONSpindles installed Nos 44,400
53,040
53,040
53,040
53,040
53,040
53,040
Average spindles worked during the year Nos 44,094
49,285
51,314
52,103
51,690
51,905
50,777
Production for the year/periodLbs in million 7.438
8.322
8.735
9.341
9.970
10.372
10.447
Average count spun during the year/period60.41
56.52
56,057.00
53.66
51.11
51.30
49.08
PROFIT AND LOSS ACCOUNT
Net SalesRupees in million 746.961
1,195.591
1,705.170
1,663.021
2,064.442
1,927.396
1,757.969
Gross Profit / (Loss)Rupees in million 51.207
275.022
199.633
177.873
450.017
233.713
(6.285)
% 6.86
23.00
11.71
10.69
21.80
12.13
(0.36)
Operating Profit / (Loss)Rupees in million 25.333
234.337
143.820
115.641
331.442
142.465
(76.329)
% 3.39
19.60
8.43
6.95
16.05
7.39
(4.34)
Profit / (Loss) before taxationRupees in million (104.001)
154.897
131.960
61.963
302.336
113.915
(123.803)
% (11.07)
12.96
7.74
3.72
14.64
5.91
(7.04)
Profit / (Loss) after taxationRupees in million (73.683) 102.343 122.571 88.036 215.388 82.020
(85.587)
% (9.86) 8.56 7.19 5.29 10.43 4.26 (4.87)
Earming/ (loss) per share-restated Rupees (25.44)
30.73
35.24
24.11
58.98
22.46
(23.43) BALANCE SHEETShareholders' equity (excluding Rupeessurplus on revaluation of fixed assets in million 28.724
133.425
265.191
359.854
591.066
673.113
607.039
Term finance certificates - do- -
-
56.481
44.714
35.301
16.474
-
Demand finances/ bills payable - do- 217.250
217.250
214.467
183.368
54.422
23.323
-
Liabilties against assets subject to finance lease - do- 86.064
86.064
59.401
43.032
21.516
-
50.386
Operating fixed assets - do- 1,000.084
1,005.891
1,035.313
1,344.558
1,305.295
1,374.837
1,350.262
Additions in fixed assets - do- 15.607
39.930
70.369
49.024
12.204
120.706
37.328
Current assets - do- 349.881
349.792
434.382
391.668
437.584
698.576
407.179
Current liabilties - do- 526.995
404.356
436.013
329.883
299.397
571.684
346.710
OthersBreak up value per share Rupees 9.92
46.07
72.61
98.53
161.84
184.31
166.21
Employees at year end Nos. 879 1,143 1,078 965 1,110 1,285 1,195
SUMMARY OF KEY OPERATING AND FINANCIAL DATA
ANNUAL REPORT 2015

10
PATTERN OF SHARE HOLDING AS AT 30 JUNE, 2015
Number of ShareholdingShares Held Percentage
Shareholder
From
To
1,008
1
100
24,517
0.67
372
101
500
88,118
2.41
117
501
1,000
90,187
2.47
112
1,001
5,000
229,036
6.27
17
5,001
10,000
113,572
3.11
7
10,001
15,000
91,652
2.51
3
15,001
20,000
51,713
1.42
3
20,001
25,000
65,000
1.78
2
30,001
35,000
66,000
1.81
1
35,001
40,000
35,452
0.97
1
40,001
45,000
40,576
1.11
1
50,001
55,000
48,500
1.33
1
55,001
60,000
57,638
1.58
2
65,001
70,000
132,700
3.63
1
80,001
85,000
80,578
2.21
1
105,001
110,000
106,000
2.90
1
140,001
145,000
144,421
3.95
1
320,001
325,000
321,778
8.81
1
585,001
590,000
587,493
16.09
1
1,275,001
1,280,000
1,277,247
34.97
1,653
3,652,178
100.00
Categories of Shareholders
Shares
Percentage
Directors, Chief Executive Officer and their spouses and minor children 60,457 1.66 Associated Companies, Undertakings and Related Parties 2,066,799 56.59 NIT & ICP 82,062 2.25 Banks, Development Finance Institutions, Non- Banking Financial Institutions
391,567
10.72
Insurance Companies
57
0.00
Modarabas & Mutual Funds
1,150
0.03
General Public (Local)
1,020,767
27.95
Others Companies
27,591
0.76
Administrator Abandoned Properties
1,728
0.05
Ali Waqas Company Secretary
ANNUAL REPORT 2015

11
DETAIL OF PATTERN OF SHAREHOLDING AS PER REQUIREMENT OF CODE OF COPORATE
GOVERNANCE.
SR #
Categories
of Share Holders
Shares
Percentage
1
Directors, CEO and their spouses and minor children
Mr. Raza Kuli Khan Khattak
(Chief Executive)
13,982
0.383
Mr. Ahmed Kuli Khan Khattak
(Director)
13,981
0.383
Mr. Ch. Sher Muhammad
(Director)
2,875
0.079
Mr. Muhammad Ayub
(Director)
2,875
0.079
Dr. Hamid Zeb
(Director)
918
0.025
Mrs. Zeb Gohar Ayub
(Director)
11,842
0.324
Mrs. Shahnaz Sajjad Ahmad
(Director)
6,992
0.191
Dr. Shaheen Kuli Khan Khattak (Chair Person / Director)
6,992
0.191
2
Associated Companies, Undertaking and Related Parties
Bannu Woollen Mills Limited
144,421 3.954
Bibojee Services (Pvt) Limited
1,277,247 34.972
Janana De Maluc ho Textile Mills Limited
587,493 16.086
Waqf-e-Kuli Khan
57,638 1.578
3 NIT & ICP Investment Corporation of Pakistan 1,291 0.035 CDC- Trustee National Investment (Unit) Trust 80,578 2.206 IDBP (ICP UNIT) 193 0.005
4
Banks, Development Financial Institutions, Non Banking
Finance Institutions
391,567
10.721
5
Insurance Compaines
The New Jubilee Insurance Co Ltd
57
0.002
6
Modarabas & Mutual Funds
First UDL Modaraba
1,150
0.031
7
General Public (Local)
1,020,767
27.950
8
Others Companies
27,591
0.76
9
Administrator Abandoned Properties
1,728
0.047
10
Shareholders Holding 05% Or More
Bibojee Services (Pvt) Limited
1,277,247
34.972
Janana De Malucho Textile Mills Limited
Mr. Muhammad Ahmed
587,493
16.086
ANNUAL REPORT 2015
217,500 5.955

12
Statement of Compliance with the Code ofCorporate Governance
For the year ended 30 June, 2015This statement is being presented to comply with the Code of Corporate Governance contained in the listing regulations of Karachi Stock Exchange Limited for the purpose of establishing a framework of good governance, whereby a listed company is managed in compliance with the best practices of corporate governance.The company has applied the principles contained in the Code of Corporate Governance (CCG) in the following manner:1. The company encourages representation of independent non-executive directors and directors
representing minority interests on its board of directors. At present the board includes:
The independent directors meets the criteria of independence under clause i (b) of the CCG.
2. The directors have confirmed that none of them is serving as a director on more than seven listed companies, including this company (excluding the listed subsidiaries of listed holding companies where applicable).
3. All the resident directors of the company are registered as taxpayers and none of them has defaulted in payment of any loan to a banking company, a DFI or an NBFI or, being a member of a stock exchange, has been declared as a defaulter by that stock exchange.
4. No Casual vacancy occurred on the board during the year.
5. The company has prepared a “Code of Conduct” and has ensured that appropriate steps have been taken to disseminate it throughout the company along with its supporting policies and procedures.
6. The board has developed a vision/mission statement, overall corporate strategy and significant policies of the company. A complete record of particulars of significant policies along with the dates on which they were approved or amended has been maintained.
7. All the powers of the board have been duly exercised and decisions on material transactions, including appointment and determination of remuneration and terms and conditions of employment of the CEO, other executive and non-executive directors, have been taken by the board/shareholders.
8. The meetings of the board were presided over by the Chairman and the board met at least once in every quarter. Written notices of the board meetings, along with agenda and working papers, were circulated at least seven days before the meetings. The minutes of the meetings were appropriately recorded and circulated.
9. The board arranged no training program for its directors during the year as all the directors held adequate exposure to discharge their duties and responsibilities.
10. The board has approved appointment of CFO, Company Secretary and Head of Internal Audit, including their remuneration and terms and conditions of employment.
Category
Names
Independent Director
Mr. Muhammad Ayub
Executive Director
Mr. Raza Kuli Khan Khattak
Non-Executive Directors
Mr. Ahmed Kuli Khan Khattak
Mrs. Zeb Gohar Ayub
Mrs. Shahnaz Sajjad Ahmed
Dr. Shaheen Kuli Khan Khattak Ch. Sher Muhammad Dr. Hamid Zeb Khan
ANNUAL REPORT 2015

Kohat (Raza Kuli Khan Khattak)
Dated: September 23, 2015 Chief Executive Officer
11. The directors' report for this year has been prepared in compliance with the requirements of the CCG and fullydescribes the salient matters required to be disclosed.
12. The financial statements of the company were duly endorsed by CEO and CFO before approval of the board.
13. The directors, CEO and executives do not hold any interest in the shares of the company other than that disclosed in the pattern of shareholding.
14. The company has complied with all the corporate and financial reporting requirements of the CCG.
15. The board has formed an Audit Committee. It comprises four members, of whom three are non-executive directors including the chairman of committee and one is an independent director.
16. The meetings of the audit committee were held at least once every quarter prior to approval of interim and final results of the company and as required by the CCG. The terms of reference of the committee have been formed and advised to the committee for compliance.
17. The board has formed a Human Resource and Remuneration Committee. It comprises four members, of whom two are non-executive directors, one is executive director and one is an independent director.
18. The board has set up an effective internal audit function.
19. The statutory auditors of the company have confirmed that they have been given a satisfactory rating under the quality control review program of the ICAP, that they or any of the partners of the firm, their spouses and minor children do not hold shares of the company and that the firm and all its partners are in compliance with International Federation of Accountants (IFAC) guidelines on code of ethics as adopted by the ICAP.
20. The statutory auditors or the persons associated with them have not been appointed to provide other services except in accordance with the listing regulations and the auditors have confirmed that they have observed IFAC guidelines in this regard.
21. The 'closed period', prior to the announcement of interim/final results, and business decisions, which may materially affect the market price of company's securities, was determined and intimated to directors, employees and stock exchange.
22. Material/price sensitive information has been disseminated among all market participants at once through stock exchange.
23. We confirm that all other material principles enshrined in the CCG have been complied with, except for which are not yet applicable during the current financial year, toward which reasonable progress is being made by the company to seek compliance by the end of next accounting year.
ANNUAL REPORT 2015
HAMEED CHAUDHRI & CO.,
LAHORE; September 23, 2015 CHARTERED ACCOUNTANTS
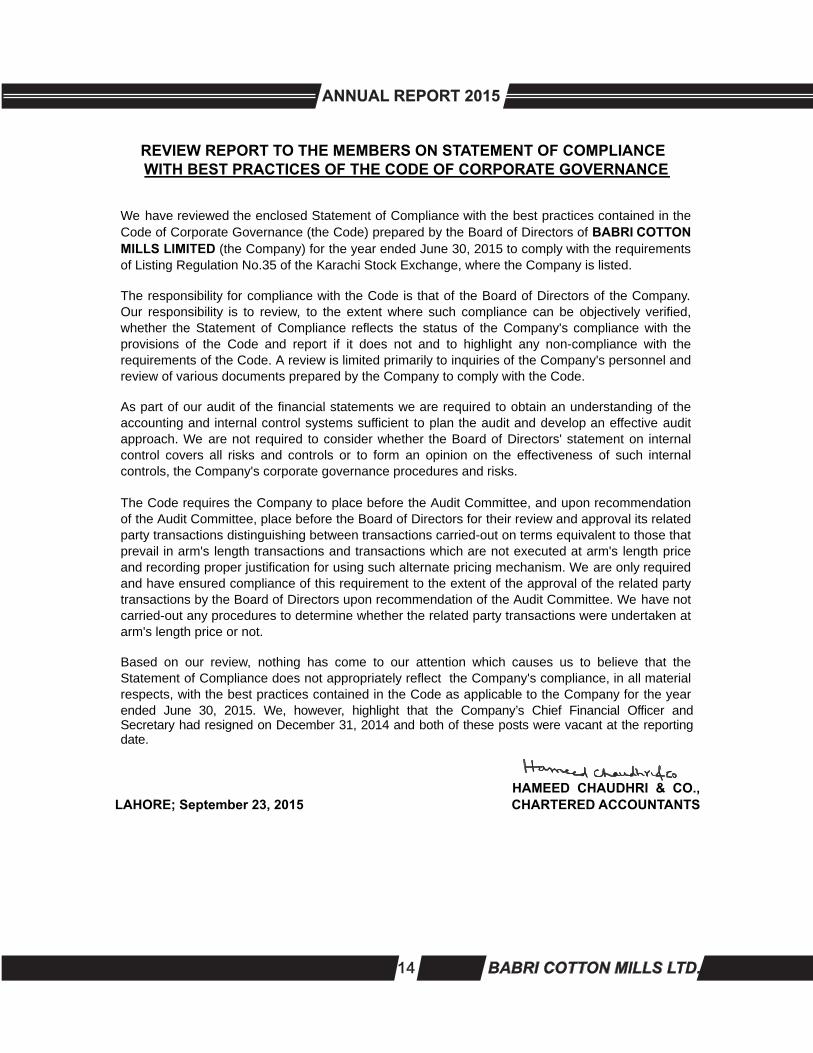
Based on our review, nothing has come to our attention which causes us to believe that theStatement of Compliance does not appropriately reflect the Company's compliance, in all materialrespects, with the best practices contained in the Code as applicable to the Company for the yearended June 30, 2015. We, however, highlight that the Company’s Chief Financial Officer and Secretary had resigned on December 31, 2014 and both of these posts were vacant at the reportingdate.
REVIEW REPORT TO THE MEMBERS ON STATEMENT OF COMPLIANCE WITH BEST PRACTICES OF THE CODE OF CORPORATE GOVERNANCE
We have reviewed the enclosed Statement of Compliance with the best practices contained in theCode of Corporate Governance (the Code) prepared by the Board of Directors of BABRI COTTON
MILLS LIMITED (the Company) for the year ended June 30, 2015 to comply with the requirementsof Listing Regulation No.35 of the Karachi Stock Exchange, where the Company is listed.
The responsibility for compliance with the Code is that of the Board of Directors of the Company.Our responsibility is to review, to the extent where such compliance can be objectively verified,whether the Statement of Compliance reflects the status of the Company's compliance with theprovisions of the Code and report if it does not and to highlight any non-compliance with therequirements of the Code. A review is limited primarily to inquiries of the Company's personnel andreview of various documents prepared by the Company to comply with the Code.
As part of our audit of the financial statements we are required to obtain an understanding of theaccounting and internal control systems sufficient to plan the audit and develop an effective auditapproach. We are not required to consider whether the Board of Directors' statement on internalcontrol covers all risks and controls or to form an opinion on the effectiveness of such internalcontrols, the Company's corporate governance procedures and risks.
The Code requires the Company to place before the Audit Committee, and upon recommendationof the Audit Committee, place before the Board of Directors for their review and approval its relatedparty transactions distinguishing between transactions carried-out on terms equivalent to those thatprevail in arm's length transactions and transactions which are not executed at arm's length priceand recording proper justification for using such alternate pricing mechanism. We are only requiredand have ensured compliance of this requirement to the extent of the approval of the related partytransactions by the Board of Directors upon recommendation of the Audit Committee. We have notcarried-out any procedures to determine whether the related party transactions were undertaken atarm's length price or not.
ANNUAL REPORT 2015

15
HAMEED CHAUDHRI & CO.,LAHORE; September 23, 2015 CHARTERED ACCOUNTANTS
(a)
(b) in our opinion
(i)
(ii)
(iii)
(c)
(d)
the expenditure incurred during the year was for the purpose of the Company'sbusiness; and
the business conducted, investments made and the expenditure incurred during theyear were in accordance with the objects of the Company;
in our opinion and to the best of our informationand according to the explanationsgiven tous, the balance sheet, profit and loss account, cash flow statement and statement ofchanges in equity together with the notes forming part thereof conform with approvedaccounting standards as applicable in Pakistan, and, give the information required by theCompanies Ordinance, 1984, in the manner so required and respectively give a true andfair view of the state of the Company's affairs as at June 30, 2015 and of the loss, its cashflows and changes in equity for the year then ended; and
in our opinion, no Zakat was deductible at source under the Zakat and Ushr Ordinance,1980 (XVIII of 1980).
the balance sheet and profit and loss account together with the notes thereon havebeen drawn up in conformity with the Companies Ordinance, 1984, and are inagreement with the books of account and are further in accordance with accountingpolicies consistently applied;
AUDITORS' REPORT TO THE MEMBERS
We have audited the annexed balance sheet of BABRI COTTON MILLS LIMITED (theCompany) as at June 30, 2015 and the related profit and loss account, cash flow statementand statement of changes in equity together with the notes forming part thereof, for the yearthen ended and we state that we have obtained all the information and explanationswhich, tothe best of our knowledge and belief, were necessary for the purposes of our audit.
It is the responsibility of the Company's management to establish and maintain a system ofinternal control, and prepare and present the above said statements in conformity with theapprovedaccounting standards and the requirements of the Companies Ordinance, 1984. Ourresponsibility is to express an opinion on these statements based on our audit.
We conducted our audit in accordance with the auditing standards as applicable in Pakistan.These standards require that we plan and perform the audit to obtain reasonable assuranceabout whether the above said statements are free of any material misstatement. An auditincludes examining, on a test basis, evidence supporting the amounts and disclosures in theabove said statements. An audit also includes assessing the accounting policies andsignificant estimates made by management, as well as, evaluatingthe overall presentation ofthe above said statements. We believe that our audit provides a reasonable basis for ouropinion and, after due verification, we report that:
in our opinion,proper books of account have been kept by the Company as required by theCompanies Ordinance, 1984;
ANNUAL REPORT 2015

16
ANNUAL REPORT 2015
BALANCE SHEET AS AT JUNE 30, 2015
2015 2014ASSETS Note
Non-current assets
Property, plant and equipment 5 1,350,262 1,374,837Investments in an Associated Company 6 74,415 73,430Long term loans 7 781 1,365Security deposits 1,151 1,151
1,426,609 1,450,783Current assets
Stores, spares and loose tools 8 18,177 19,299Stock-in-trade 9 309,812 609,172Trade debts 10 165 367Loans and advances 11 5,553 11,179Prepayments 609 535Due from Associated Companies 12 0 1,092Other receivables 13 6,007 2,832Sales tax refundable 16,017 15,500Income tax refundable, advance tax
and tax deducted at source 43,100 32,894Cash and bank balances 14 7,739 5,706
407,179 698,576
TOTAL ASSETS 1,833,788 2,149,359
EQUITY AND LIABILITIES
Equity
Authorised capital 15 250,000 250,000Issued, subscribed and paid-up capital 16 36,522 36,522Reserves 17 105,697 105,834Unappropriated profit 464,820 530,757
Shareholders' equity 607,039 673,113Term finance certificates 18 0 7,062Surplus on revaluation of property,
plant and equipment 19 595,508 606,387Deferred income 21.3 9,296 0Liabilities
Non-current liabilities
Liabilities against assets subject to finance lease 21 33,272 0Staff retirement benefits - gratuity 22 62,500 55,797Deferred taxation 23 179,463 235,316
275,235 291,113Current liabilities
Trade and other payables 24 115,557 138,152Accrued interest / mark-up 25 6,376 11,334Short term finances 26 193,653 380,546Current portion of non-current liabilities 27 17,114 32,736Taxation 28 14,010 8,916
346,710 571,684Total liabilities 621,945 862,797Contingencies and commitments 29
TOTAL EQUITY AND LIABILITIES 1,833,788 2,149,359
The annexed notes form an integral part of these financial statements.
(Rupees in thousand)
Raza Kuli Khan KhattakChief Executive
Dr. Shaheen Kuli Khan Khattak Director

17
2015 2014Note
Sales 30 1,757,969 1,927,396
Cost of Sales 31 1,764,254 1,693,683
Gross (Loss) / Profit (6,285) 233,713
Distribution Cost 32 9,451 9,644
Administrative Expenses 33 62,849 64,213
Other Expenses 34 5,391 22,848
Other Income 35 (7,647) (5,457)
70,044 91,248
(Loss) / Profit from Operations (76,329) 142,465
Finance Cost 36 48,634 41,421
(124,963) 101,044
Share of Profit of an
Associated Company 6 1,160 12,871
(Loss) / Profit before Taxation (123,803) 113,915
Taxation 37 (38,216) 31,895
(Loss) / Profit after Taxation (85,587) 82,020
Other Comprehensive (Loss) / Income
Items that will not be reclassified to profit or loss:
- gain / (loss) on remeasurement of staff retirement benefit obligation (net of deferred tax) 22 4,337 (3,528)
- share of other comprehensive income / (loss) of an Associated Company (net of taxation) 6 53 (1,150)
4,390 (4,678)
Total Comprehensive (Loss) / Income (81,197) 77,342
(Loss) / Earnings per Share 38 (23.43) 22.46
The annexed notes form an integral part of these financial statements.
------- Rupees -------
PROFIT AND LOSS ACCOUNT
FOR THE YEAR ENDED JUNE 30, 2015
(Rupees in thousand)
ANNUAL REPORT 2015
Raza Kuli Khan KhattakChief Executive
Dr. Shaheen Kuli Khan Khattak Director

18
2015 2014
Cash flow from operating activities
(Loss) / profit for the year - before taxation and share of profit of an Associated Company (124,963) 101,044
Adjustments for non-cash charges and other items:Depreciation 52,444 49,366Loss on disposal of fixed assets - net 5,391 13,427Deferred income credited (3,299) 0Unclaimed payable balances written-back (38) 0Amortisation of gain on forward foreign exchange contracts (137) (144)Amortisation of restructuring cost on demand finances (47) (63)Staff retirement benefits - gratuity (net) 11,040 8,718Finance cost 48,285 40,877
(Loss) / profit before working capital changes (11,324) 213,225
Effect on cash flow due to working capital changes
Decrease / (increase) in current assets:Stores, spares and loose tools 1,122 (3,671)Stock-in-trade 299,360 (261,145)Trade debts 202 10,661Loans and advances 5,626 (108)Prepayments (74) (201)Due from Associated Companies 1,092 (20)Other receivables (3,175) 1,542Sales tax refundable (517) (1,590)
(Decrease) / increase in trade and other payables (22,557) 6,245
281,079 (248,287)
Cash generated from / (used in) operations 269,755
(35,062)
Taxes paid (19,163) (15,434)
Long term loans - net 584 (599)
Net cash generated from / (used in) operating activities 251,176 (51,095)Cash flow from investing activities
Fixed capital expenditure - net (22,420) (135,614)Sale proceeds of operating fixed assets 1,755 3,279Security deposits 0 (88)Dividend received 1,023 0
Net cash used in investing activities (19,642) (132,423)Cash flow from financing activities
Term finance certificates redeemed (16,475) (18,826)Demand finances repaid (23,276) (31,036)Lease finances - net 50,386 (21,516)Short term finances - net (186,893) 292,225Finance cost paid (53,243) (36,409)
Net cash (used in) / generated from financing activities (229,501) 184,438
Net increase in cash and cash equivalents 2,033 920Cash and cash equivalents - at beginning of the year 5,706 4,786
Cash and cash equivalents - at end of the year 7,739 5,706
The annexed notes form an integral part of these financial statements.
CASH FLOW STATEMENT
(Rupees in thousand)
FOR THE YEAR ENDED JUNE 30, 2015
ANNUAL REPORT 2015
Raza Kuli Khan KhattakChief Executive
Dr. Shaheen Kuli Khan Khattak Director

19
Balance as at June 30, 2013 36,522 15,096 88,000 2,882 105,978 433,041 575,541
Total comprehensive income forthe year ended June 30, 2014:
- profit for the year 0 0 0 0 0 82,020 82,020
- other comprehensive loss 0 0 0 0 0 (4,678) (4,678)
0 0 0 0 0 77,342 77,342
Amortisation of gain on forward foreign exchange contracts 0 0 0 (144) (144) 0 (144)
Transfer from surplus on revaluationof property, plant and equipment(net of deferred taxation):
- on account of incremental depreciation for the year 0 0 0 0 0 13,383 13,383
- upon sale of revalued assets 0 0 0 0 0 4,707 4,707
Effect of items directly creditedin equity by an Associated Company 0 0 0 0 0 2,284 2,284
Balance as at June 30, 2014 36,522 15,096 88,000 2,738 105,834 530,757 673,113
Total comprehensive (loss) / income forthe year ended June 30, 2015:
- loss for the year 0 0 0 0 0 (85,587) (85,587)
- other comprehensive income 0 0 0 0 0 4,390 4,390
0 0 0 0 0 (81,197) (81,197)
Amortisation of gain on forward foreign exchange contracts 0 0 0 (137) (137) 0 (137)
Transfer from surplus on revaluationof property, plant and equipment(net of deferred taxation):
- on account of incremental depreciation for the year 0 0 0 0 0 12,645 12,645
- upon sale of revalued assets 0 0 0 0 0 1,820 1,820
Effect of items directly creditedin equity by an Associated Company 0 0 0 0 0 795 795
Balance as at June 30, 2015 36,522 15,096 88,000 2,601 105,697 464,820 607,039
The annexed notes form an integral part of these financial statements.
------------------------- Rupees in thousand -------------------------
Total
Reserves
Sub-
total
STATEMENT OF CHANGES IN EQUITY
FOR THE YEAR ENDED JUNE 30, 2015
Share
capital
Unappro-
priated
profit
Share
premium
reserve
General
reserve
Gain on
hedging
instru-
ments
ANNUAL REPORT 2015
Raza Kuli Khan KhattakChief Executive
Dr. Shaheen Kuli Khan Khattak Director

20
2. BASIS OF PREPARATION
2.1 Statement of compliance
2.2 Basis of measurement
2.3 Functional and presentation currency
2.4 Accounting estimates and judgments
(a) Property, plant and equipment
The preparation of financial statements in conformity with IFRS requires the use of certain critical accounting estimates. It also requires management to exercise its judgment in theprocess of applying the Company's accounting policies. Estimates and judgments arecontinually evaluatedand are based on historical experience and other factors, includingexpectations of future events that are believed to be reasonable under the circumstances.
The Company makes estimates and assumptions concerning the future. The resultingaccounting estimates will, by definition, seldom equal the related actual results. The are as where various assumptions and estimates are significant to the Company's financialstatements or where judgment was exercised in applicationof accounting policies are asfollows:
The Company reviews appropriateness of the rates of depreciation, useful lives andresidual values for calculation of depreciation on an on-going basis. Further, whereapplicable, an estimate of recoverable amount of asset is made if indicators ofimpairment are identified.
These financial statements are presented in Pak Rupee, which is the Company'sfunctional and presentation currency. All financial information presented in Pak Rupeeshas been rounded to the nearest thousand unless otherwise stated.
NOTES TO THE FINANCIAL STATEMENTS
FOR THE YEAR ENDED JUNE 30, 2015
1. LEGAL STATUS AND OPERATIONS
Babri Cotton Mills Limited (the Company) was incorporated in Pakistan on October 26,1970 as a Public Company. Its shares are quoted on Karachi Stock Exchange Limited. Itis principally engaged in manufacture and sale of yarn. The Company's registered officeand Mills are located at Habibabad, Kohat.
These financial statements have been prepared in accordance with the requirements ofthe Companies Ordinance, 1984 (the Ordinance) and the approved accounting standardsas applicable in Pakistan. Approvedaccounting standards comprise of such InternationalFinancial Reporting Standards (IFRS) issued by the InternationalAccounting StandardsBoard as are notified under the Ordinance, provisions of and directives issued under theOrdinance. Wherever the requirements of the Ordinance or directives issued bySecurities and Exchange Commission of Pakistan (SECP) differ with the requirements ofIFRS, the requirements of the Ordinance or the requirements of the said directivesprevail.
These financial statements have been prepared under the historical cost conventionexcept as disclosed in the accounting policy notes.
ANNUAL REPORT 2015
21
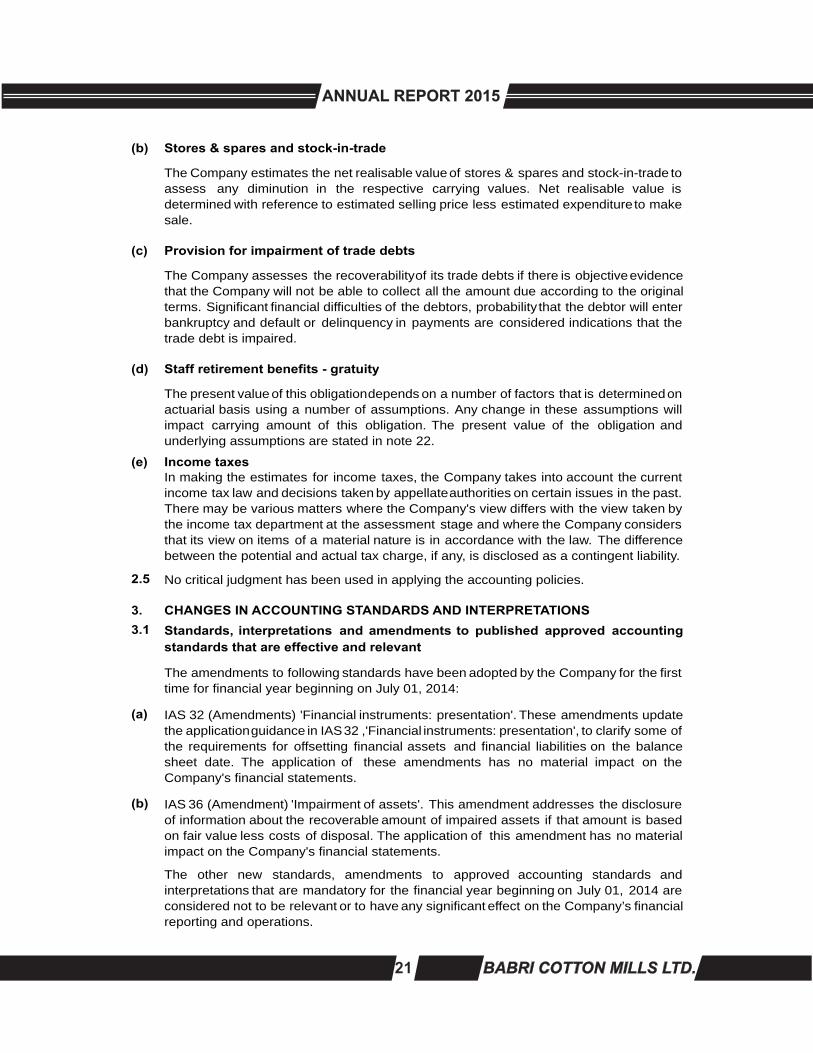
(b) Stores & spares and stock-in-trade
(c) Provision for impairment of trade debts
(d) Staff retirement benefits - gratuity
(e) Income taxes
2.5
3. CHANGES IN ACCOUNTING STANDARDS AND INTERPRETATIONS
3.1
(a)
(b)
The Company estimates the net realisable value of stores & spares and stock-in-trade toassess any diminution in the respective carrying values. Net realisable value isdetermined with reference to estimated selling price less estimated expenditureto makesale.
The Company assesses the recoverabilityof its trade debts if there is objectiveevidencethat the Company will not be able to collect all the amount due according to the originalterms. Significant financial difficulties of the debtors, probability that the debtor will enterbankruptcy and default or delinquency in payments are considered indications that thetrade debt is impaired.
The present value of this obligationdepends on a number of factors that is determinedonactuarial basis using a number of assumptions. Any change in these assumptions willimpact carrying amount of this obligation. The present value of the obligation andunderlying assumptions are stated in note 22.
In making the estimates for income taxes, the Company takes into account the currentincome tax law and decisions taken by appellateauthorities on certain issues in the past.There may be various matters where the Company's view differs with the view taken bythe income tax department at the assessment stage and where the Company considersthat its view on items of a material nature is in accordance with the law. The differencebetween the potential and actual tax charge, if any, is disclosed as a contingent liability.
The other new standards, amendments to approved accounting standards andinterpretations that are mandatory for the financial year beginning on July 01, 2014 areconsidered not to be relevant or to have any significant effect on the Company’s financialreporting and operations.
Standards, interpretations and amendments to published approved accounting
standards that are effective and relevant
The amendments to following standards have been adopted by the Company for the firsttime for financial year beginning on July 01, 2014:
IAS 32 (Amendments) 'Financial instruments: presentation'. These amendments updatethe applicationguidance in IAS32 ,'Financial instruments: presentation', to clarify some ofthe requirements for offsetting financial assets and financial liabilities on the balancesheet date. The application of these amendments has no material impact on theCompany's financial statements.
IAS 36 (Amendment) 'Impairment of assets'. This amendment addresses the disclosureof information about the recoverable amount of impaired assets if that amount is basedon fair value less costs of disposal. The application of this amendment has no materialimpact on the Company's financial statements.
No critical judgment has been used in applying the accounting policies.
ANNUAL REPORT 2015

22
3.2
(a)
(b)
(c)
(d)
4. SUMMARY OF SIGNIFICANT ACCOUNTING POLICIES
4.1 Property, plant and equipment and depreciation
Annual improvements 2014 applicable for annual periods beginning on or afterJanuary 01, 2016. These amendments include changes from the 2012-2014 cycle ofannual improvements project that affect four standards: IFRS 5, 'Non current assets heldfor sale and discontinued operations', IFRS 7 'Financial instruments: disclosures', IAS19'Employee benefits' and IAS 34,'Interim financial reporting'. The Company does not expect to have a material impact on its financial statements due to application of theseamendments.
IFRS 13 ‘Fair value measurement', aims to improve consistency and reduce complexityby providing a precise definition of fair value and a single source of fair valuemeasurement and disclosure requirements for use across IFRSs. The requirements donot extend the use of fair value accounting but provide guidance on how it should beapplied where its use is already required or permitted by other standards within IFRSs.The standard will affect the determination of fair value and its related disclosures in thefinancial statements of the Company.
There are number of other standards, amendments and interpretations to the approvedaccounting standards that are not yet effective and are also not relevant to the Companyand therefore have not been presented here.
Standards, interpretations and amendments to published approved accounting
standards that are not yet effective but relevant
The following are the new standards and amendments to existing approved accountingstandards that are effective for the periods beginningJanuary 01, 2015 that may have animpact on the financial statements of the Company:
IFRS 9 ‘Financial instruments - classification and measurement' is applicable onaccounting periods beginningon or after January 01, 2015. IFRS 9 replaces the parts ofIAS 39 'Financial instruments: recognition and measurement', that relate to classificationand measurement of financial instruments. IFRS 9 requires financial assets to beclassified into two measurement categories; those measured at fair value and thosemeasured at amortised cost. The Company does not expect to have a material impact onits financial statements due to application of this standard.
IFRS 12 ‘Disclosure of interests in other entities' includes the disclosure requirements forall forms of interests in other entities, including joint arrangements, associates, structuredentities and other off balance sheet vehicles. The standard will affect the disclosures inthe financial statements of the Company.
These, other than freehold land, buildingson freehold land, plant & machinery, generatorsand capital work-in-progress, are stated at cost less accumulated depreciation and anyidentified impairment loss. Freehold land is stated at revalued amount whereas buildingson freehold land, plant & machinery and generators are stated at revalued amounts lessaccumulated depreciation and any identifiedimpairment loss. Capital work-in-progress isstated at cost. Cost of some items of plant & machinery consists of historical cost andexchange fluctuation effects on foreign currency loans capitalised during prior years.Borrowing costs are also capitalised for the period upto the date of commencement ofcommercial productionof the respective plant & machinery, acquired out of the proceedsof such borrowings.
The significant accounting policies adopted in the preparation of these financialstatements are set-out below. These policies have been consistently applied to all theyears presented, unless otherwise stated.
ANNUAL REPORT 2015

23
Assets subject to finance lease
Finance cost and depreciation on leased assets are charged to income currently.Investments in Associated Companies
Lease where the Company has substantially all the risks and rewards of ownership isclassified as finance lease. Assets subject to finance lease are initiallyrecognised at thelower of present value of minimum lease payments under the lease agreements and fairvalue of the assets. Subsequently these assets are stated at cost less accumulateddepreciation and any identified impairment loss.The related rental obligations, net of finance charges, are included in liabilities againstassets subject to finance lease. The liabilities are classified as current and long-termdepending upon the timing of the payment.Each lease payment is allocated between the liability and finance charges so as toachieve a constant rate on the balance outstanding. The interest element of the rental ischarged to profit over the lease term.Depreciation on assets subject to finance lease is charged to income at the rates statedin note 5.1 applying reducing balance method to write-off cost of the assets over theirestimated remaining useful life in view of certainty of ownership of assets at the end oflease period.Depreciation on additions to leased assets is charged from the month in which an assetis acquired while no depreciation is charged for the month in which the asset is disposed-off
Investments in Associated Companies are accounted for by using equity basis ofaccounting, under which the investments in Associated Companies are initiallyrecognised at cost and the carrying amounts are increased or decreased to recognisethe Company's share of profit or loss of the Associated Companies after the date ofacquisition. The Company's share of profit or loss of the Associated Companies isrecognised in the Company's profit or loss. Distributions received from AssociatedCompanies reduce the carrying amount of investments. Adjustments to the carryingamounts are also made for changes in the Company's proportionate interest in theAssociated Companies arising from changes in the Associated Companies' equity thathave not been recognised in the Associated Companies' profit or loss. The Company'sshare of those changes is recognised directly in equity of the Company.
Freehold land, buildings on freehold land, plant & machinery and generators wererevalued during prior years. Surplus arisen on revaluation of these assets has beencredited to surplus on revaluationof property, plant and equipmentaccount in accordancewith the requirements of section 235 of the Companies Ordinance, 1984 and shall be held on the balance sheet till realisation. Revaluation is carried-out with sufficient regularity toensure that the carrying amount of assets does not differ materially from the fair value.The accumulated depreciation at the date of revaluation is eliminated against the grosscarrying amount of the asset and the net amount is restated to the revalued amount. Tothe extent of incremental depreciationcharged on the revaluedassets, the related surpluson revaluation of these assets (net of deferred taxation) is transferred directly to equity.Depreciation is taken to profit and loss account applying reducing balance method so asto write-off the depreciable amount of an asset over its remaining useful life at the ratesstated in note 5.1. The assets' residual values and useful lives are reviewed at eachfinancial year-end and adjusted if impact on depreciation is significant.Depreciation on additions to property, plant and equipment is charged from the month inwhich an asset is acquired or capitalised while no depreciation is charged for the monthin which the asset is disposed-off.Normal repairs and replacements are taken to profit and loss account. Majorimprovements and modifications are capitalised and assets replaced, if any, other thanthose kept as stand-by, are retired.Gain / loss on disposal of property, plant and equipment, if any, is taken to profit and lossaccount.
ANNUAL REPORT 2015
4.3
4.2

24
4.4 Stores, spares and loose tools
4.5 Stock-in-trade
Basis of valuation are as follows:
Particulars Mode of valuation
Raw materials- at mills - At lower of annual average cost and net realisable value.
- in transit - At cost accumulated to the balance sheet date.
Work-in-process - At cost.
Finished goods - At lower of cost and net realisable value.
Waste - At net realisable value.
-
-
-
4.6 Trade debts and other receivables
4.7 Cash and cash equivalents
4.8 Borrowings and borrowing costs
Trade debts are initially recognised at original invoice amount, which is the fair value ofconsideration to be received in future and subsequently measured at cost less provisionfor doubtful debts, if any. Carrying amounts of trade debts and other receivables areassessed at each reporting date and a provision is made for doubtful debts andreceivables when collection of the amount is no longer probable. Debts and receivablesconsidered irrecoverable are written-off.
Cash and cash equivalents are carried in the balance sheet at cost. For the purpose ofcash flow statement, cash and cash equivalents consist of cash-in-hand and balances with banks
Cost in relation to work-in-process and finished goods consists of prime cost andappropriate production overheads. Prime cost is allocated on the basis of moving average cost.
Provision for obsolete and slow moving stock-in-trade is determined based on themanagement's assessment regarding their future usability.
Net realisablevalue signifies the selling price in the ordinarycourse of business less costof completion and cost necessary to be incurred to effect such sale.
Borrowings are recognised initiallyat fair value, net of transaction costs incurred and aresubsequently measured at amortised cost using the effective interest method.
The carrying amount of investments is tested for impairment, by comparing itsrecoverable amount (higher of value in use and fair value less cost to sell) with itscarrying amount and loss, if any, is recognised in profit or loss.
Borrowing costs are recognised as an expense in the period in which these are incurredexcept to the extent of borrowing costs that are directly attributable to the acquisition,construction or production of a qualifying asset. Such borrowing costs, if any, arecapitalised as part of the cost of that asset.
Stores, spares and loose tools are stated at the lower of cost and net realisable value.The cost of inventoryis based on moving average cost. Items in transit are stated at costaccumulated upto the balance sheet date. The Company reviews the carrying amount ofstores, spares and loose tools on a regular basis and provision is made for identifiedobsolete and slow moving items.
ANNUAL REPORT 2015
25
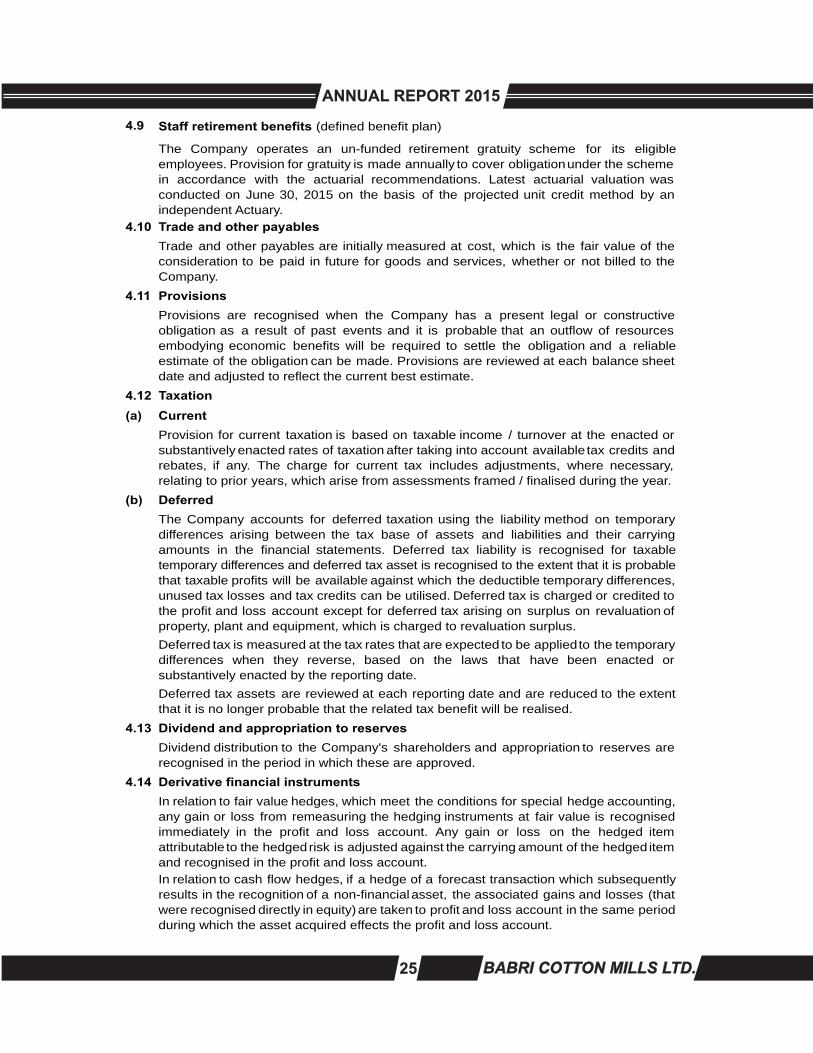
4.9 Staff retirement benefits (defined benefit plan)
4.10 Trade and other payables
4.11 Provisions
4.12 Taxation
(a) Current
(b) Deferred
4.13 Dividend and appropriation to reserves
4.14 Derivative financial instruments
In relation to fair value hedges, which meet the conditions for special hedge accounting,any gain or loss from remeasuring the hedging instruments at fair value is recognisedimmediately in the profit and loss account. Any gain or loss on the hedged itemattributable to the hedgedrisk is adjusted against the carrying amount of the hedged itemand recognised in the profit and loss account.In relation to cash flow hedges, if a hedge of a forecast transaction which subsequentlyresults in the recognition of a non-financialasset, the associated gains and losses (thatwere recognised directly in equity)are taken to profit and loss account in the same periodduring which the asset acquired effects the profit and loss account.
Deferred tax assets are reviewed at each reporting date and are reduced to the extentthat it is no longer probable that the related tax benefit will be realised.
The Company accounts for deferred taxation using the liability method on temporarydifferences arising between the tax base of assets and liabilities and their carryingamounts in the financial statements. Deferred tax liability is recognised for taxabletemporary differences and deferred tax asset is recognised to the extent that it is probable that taxable profits will be available against which the deductible temporary differences,unused tax losses and tax credits can be utilised. Deferred tax is charged or credited tothe profit and loss account except for deferred tax arising on surplus on revaluation ofproperty, plant and equipment, which is charged to revaluation surplus.
Provision for current taxation is based on taxable income / turnover at the enacted orsubstantively enacted rates of taxation after taking into account available tax credits andrebates, if any. The charge for current tax includes adjustments, where necessary,relating to prior years, which arise from assessments framed / finalised during the year.
Trade and other payables are initially measured at cost, which is the fair value of theconsideration to be paid in future for goods and services, whether or not billed to theCompany.
The Company operates an un-funded retirement gratuity scheme for its eligibleemployees. Provision for gratuity is made annually to cover obligationunder the schemein accordance with the actuarial recommendations. Latest actuarial valuation wasconducted on June 30, 2015 on the basis of the projected unit credit method by anindependent Actuary.
Deferred tax is measured at the tax rates that are expected to be appliedto the temporarydifferences when they reverse, based on the laws that have been enacted orsubstantively enacted by the reporting date.
Dividend distribution to the Company's shareholders and appropriation to reserves arerecognised in the period in which these are approved.
Provisions are recognised when the Company has a present legal or constructiveobligation as a result of past events and it is probable that an outflow of resourcesembodying economic benefits will be required to settle the obligation and a reliableestimate of the obligation can be made. Provisions are reviewed at each balance sheetdate and adjusted to reflect the current best estimate.
ANNUAL REPORT 2015
26
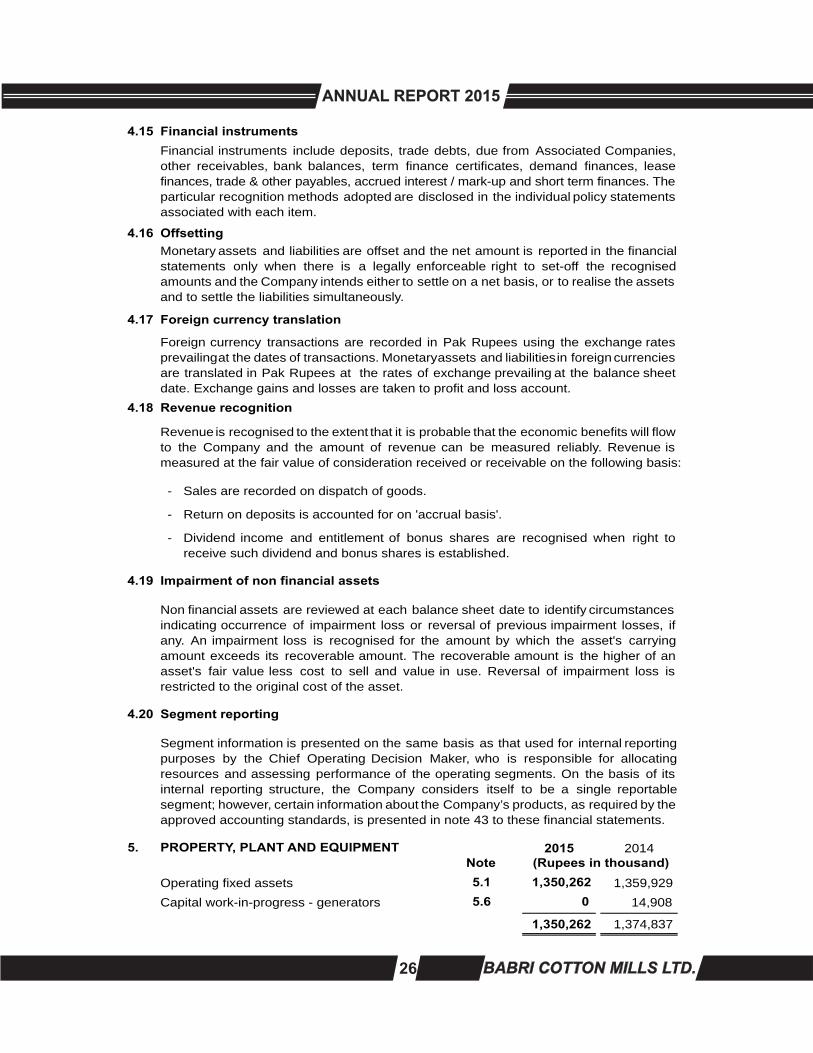
4.15 Financial instruments
4.16 Offsetting
4.17 Foreign currency translation
4.18 Revenue recognition
- Sales are recorded on dispatch of goods.
- Return on deposits is accounted for on 'accrual basis'.
-
4.19 Impairment of non financial assets
4.20 Segment reporting
5. PROPERTY, PLANT AND EQUIPMENT 2015 2014Note
Operating fixed assets 5.1 1,350,262 1,359,929
Capital work-in-progress - generators 5.6 0 14,908
1,350,262 1,374,837
Financial instruments include deposits, trade debts, due from Associated Companies,other receivables, bank balances, term finance certificates, demand finances, leasefinances, trade & other payables, accrued interest / mark-up and short term finances. The particular recognition methods adopted are disclosed in the individual policy statementsassociated with each item.
(Rupees in thousand)
Non financial assets are reviewed at each balance sheet date to identify circumstancesindicating occurrence of impairment loss or reversal of previous impairment losses, ifany. An impairment loss is recognised for the amount by which the asset's carryingamount exceeds its recoverable amount. The recoverable amount is the higher of anasset's fair value less cost to sell and value in use. Reversal of impairment loss isrestricted to the original cost of the asset.
Revenue is recognised to the extent that it is probable that the economic benefits will flowto the Company and the amount of revenue can be measured reliably. Revenue ismeasured at the fair value of consideration received or receivable on the following basis:
Dividend income and entitlement of bonus shares are recognised when right toreceive such dividend and bonus shares is established.
Monetary assets and liabilities are offset and the net amount is reported in the financialstatements only when there is a legally enforceable right to set-off the recognisedamounts and the Company intends either to settle on a net basis, or to realise the assetsand to settle the liabilities simultaneously.
Foreign currency transactions are recorded in Pak Rupees using the exchange ratesprevailingat the dates of transactions. Monetaryassets and liabilitiesin foreign currenciesare translated in Pak Rupees at the rates of exchange prevailing at the balance sheetdate. Exchange gains and losses are taken to profit and loss account.
Segment information is presented on the same basis as that used for internal reportingpurposes by the Chief Operating Decision Maker, who is responsible for allocatingresources and assessing performance of the operating segments. On the basis of itsinternal reporting structure, the Company considers itself to be a single reportablesegment; however, certain information about the Company’s products, as required by theapproved accounting standards, is presented in note 43 to these financial statements.
ANNUAL REPORT 2015

27
5.1 Operating fixed assets
As at June 30, 2013
Cost / Revaluation 355,320 120 134,762 14,105 1,011 14,637 698,397 31,748 1,822 3,377 2,069 0 144 17,897 49,801 75,000 1,400,210
Accumulated depreciation 0 102 6,686 705 50 3,466 34,825 27,333 1,155 1,409 764 0 20 9,505 2,491 6,404 94,915
Book value 355,320 18 128,076 13,400 961 11,171 663,572 4,415 667 1,968 1,305 0 124 8,392 47,310 68,596 1,305,295
Year ended
June 30, 2014:
Additions 0 0 13,888 819 0 0 36,252 67,329 0 484 591 1,343 0 0 0 0 120,706
Disposals:
Cost 0 0 0 0 0 0 (9,117) (15,000) 0 0 0 0 0 0 0 0 (24,117)
Depreciation 0 0 0 0 0 0 5,508 1,903 0 0 0 0 0 0 0 0 7,411
Transfer:
Cost 0 0 0 0 0 0 49,801 75,000 0 0 0 0 0 0 (49,801) (75,000) 0
Depreciation 0 0 0 0 0 0 (3,871) (8,405) 0 0 0 0 0 0 3,871 8,405 0
Depreciation forthe year 0 1 6,479 675 48 559 34,421 1,878 33 112 85 9 6 1,679 1,380 2,001 49,366
Book value 355,320 17 135,485 13,544 913 10,612 707,724 123,364 634 2,340 1,811 1,334 118 6,713 0 0 1,359,929
Year ended June 30, 2015:
Additions 0 0 1,069 0 0 0 18,398 17,323 299 177 38 24 0 0 30,000 40,000 107,328
Disposals:
Cost 0 0 0 0 0 0 0 (7,500) 0 0 (64) 0 0 (3,940) 0 0 (11,504)
Depreciation 0 0 0 0 0 0 0 979 0 0 4 0 0 3,375 0 0 4,358
Sale and lease-back of assets (note 21) :
Cost 0 0 0 0 0 0 (27,891) (29,995) 0 0 0 0 0 0 0 0 (57,886)
Depreciation 0 0 0 0 0 0 232 249 0 0 0 0 0 0 0 0 481
Depreciation forthe year 0 1 6,823 678 46 530 34,243 5,298 45 125 90 68 6 1,283 1,375 1,833 52,444
Book value 355,320 16 129,731 12,866 867 10,082 664,220 99,122 888 2,392 1,699 1,290 112 4,865 28,625 38,167 1,350,262
As at June 30, 2014
Cost / Revaluation 355,320 120 148,650 14,924 1,011 14,637 775,333 159,077 1,822 3,861 2,660 1,343 144 17,897 0 0 1,496,799
Accumulated depreciation 0 103 13,165 1,380 98 4,025 67,609 35,713 1,188 1,521 849 9 26 11,184 0 0 136,870
Book value 355,320 17 135,485 13,544 913 10,612 707,724 123,364 634 2,340 1,811 1,334 118 6,713 0 0 1,359,929
As at June 30, 2015
Cost / Revaluation 355,320 120 149,719 14,924 1,011 14,637 765,840 138,905 2,121 4,038 2,634 1,367 144 13,957 30,000 40,000 1,534,737
Accumulated depreciation 0 104 19,988 2,058 144 4,555 101,620 39,783 1,233 1,646 935 77 32 9,092 1,375 1,833 184,475
Book value 355,320 16 129,731 12,866 867 10,082 664,220 99,122 888 2,392 1,699 1,290 112 4,865 28,625 38,167 1,350,262
Depreciation rate (%) 5 5 5 5 5 5 5 5 5 5 5 5 5 20 5 5
Roads,
paths and
culverts
on
freehold
land
Office
equip-
ment
Arms
Tools
&
equip-
ment
Buildings on freehold land
officers
Plant &
machinery
Security
& survei-
llance
------------------------------------------------------------------------------------------------------- Rupees in thousand------------------------------------------------------------------------------------------------------
Plant &
machin-
eryworkers
Total
Leased
Vehic-
les
Owned
Freehold
land
Generat-
ors
Residential
Factory
Generat-
ors
Furnit-
ure &
fixtur-
es
Non -
factory
ANNUAL REPORT 2015

5.2
2015 2014
Owned
- freehold land 3,642 3,642- buildings on freehold land 65,080 67,433- plant & machinery 394,578 423,890- generators 98,657 120,158
561,957 615,123
5.3 Depreciation for the year has been
apportioned as under:
- cost of sales 50,473 47,097- administrative expenses 1,971 2,269
52,444 49,366
5.4 Disposal of operating fixed assets
5.5
5.6 Capital work-in-progress (Rupees in
thousand)
Balance as at June 30, 2014 - generators 14,908
Additions during the year:
- generators 978
- plant and machinery 15,476
16,454
Transferred to operating fixed assets during the year (31,362)
Balance as at June 30, 2015 0
Had the operating fixed assets been recognised under the cost model, the carryingamounts of each revalued class of operating fixed assets would have been as follows:
(Rupees in thousand)
These parts having book value of Rs. 6.521 million (2014: Rs.13.097 million) were written-off during the year after overhauling of the generators. These parts, due to continuoususe, had fully exhausted their useful life; accordingly, the management decided to write-offthise parts.
Generators
- gas generators' parts (note 5.5) 7,500 979 6,521 0 (6,521) Written-off.
Office equipment
- Laptop 64 4 60 60 0Ex-employee.
Vehicles
- Nissan Sunny 1,273 794 479 479 0
- Nissan Sunny 411 409 2 172 170
- Nissan Sunny 753 721 32 422 390
- Nissan Sunny 778 749 29 305 276
- Nissan Sunny 725 702 23 317 294
3,940 3,375 565 1,695 1,130
11,504
4,358
7,146
1,755
(5,391)
------- Rupees in thousand -------
- do -
- Mr. Umar Farooq, Employee.
- Mr. Rajab Khan, Kohat.
Particulars
Cost /
revaluat-
ion
Accum-
ulated
depre-
ciation
Book
value
Sale
pro-
ceeds
(Loss) /
gain
- Mr. Haris Dilawar, Kohat.
- Mr. Zakir Hussain, Karachi.
- Mr. Arshian Mahboob,
Sold through negotiation to:
28
ANNUAL REPORT 2015

29
6. INVESTMENTS IN AN ASSOCIATED COMPANY - Quoted 2015 2014Note
Janana De Malucho Textile Mills Ltd. (JDM)341,000 (2014: 341,000) ordinary shares of Rs.10 each - cost 4,030 4,030
Equity held: 7.13% (2014: 7.13%)
Post acquisition profit and other comprehensive income brought forward including effect of items directly credited in equity by JDM 70,195 57,679
Dividend received (1,023) 0
Profit for the year - net of taxation 1,160 12,871
Share of other comprehensive income / (loss) - net of taxation 53 (1,150)
74,415 73,430
6.1
6.2
- equity as at June 30, 1,044,159 1,023,320
- total assets as at June 30, 3,487,615 3,576,849
- total liabilities as at June 30, 1,177,869 1,276,033
- revenue for the year ended June 30, 2,542,780 2,983,385
- profit before taxation for the year ended June 30, 14,721 249,465
- profit after taxation for the year ended June 30, 16,271 180,597
- other comprehensive income / (loss) for the year ended June 30, 738 (16,133)
6.3.
7. LONG TERM LOANS - Secured
Interest free loans to:
- executives 7.1 310 3,452
- employees 7.2 1,764 2,4512,074 5,903
Less: current portion grouped under current assets 1,293 4,538
781 1,365
7.1 Balance at beginning of the year 3,452 1,790
Add: disbursements made during the year 700 5,160
4,152 6,950
Less: recoveries / adjustments made during the year 3,842 3,498
Balance at end of the year 310 3,452
The management, as at June 30, 2015, has carried out impairment testing of itsinvestment in JDM as required under IAS 36, 'Impairment of Assets'. The recoverableamount of investment in JDM amounted Rs. 175.677 million. The recoverable amount ofinvestment has been determined using the 'value-in-use' computation. In assessing thevalue in use, estimated future cash flows have been discounted to their present valueusing a pre-tax discount rate that reflects current market assessment of the time value ofmoney. The pre-tax discount rate applied to cash flow projections is 8.42%. As a result ofthe aforementionedimpairment testing, the management has concluded that the carryingvalue of investment in JDM does not exceed its recoverable amount.
(Rupees in thousand)
Market value of the Company's investment in JDM as at June 30, 2015 was Rs.31.450million (2014: Rs.28.303 million).
Summarised financial information of JDM, based on the audited financial statements forthe year ended June 30, 2015, is as follows:
ANNUAL REPORT 2015

30
(a) The year-end balance is recoverable in monthly instalments ending September, 2016.
(b)
7.2
7.3
8. STORES, SPARES AND LOOSE TOOLS 2015 2014Note
Stores 6,693 6,727Spares including in-transit inventory valuing
Nil (2014: Rs.1.494 million) 11,445 12,521Loose tools 39 51
18,177 19,299
9. STOCK-IN-TRADE
Raw materials including in-transit inventory valuing Rs.35.931 million (2014: Rs.11.190 million) 9.1 214,131 399,795
Work-in-process 36,801 35,702Finished goods 9.2 58,880 173,675
309,812 609,172
9.1(a)
(b)
9.2
10. TRADE DEBTS - UnsecuredBalance at the year-end 2,455 2,657Less: provision made against doubtful debts 2,290 2,290
165 36711. LOANS AND ADVANCES
Current portion of long term loans - secured 7 1,293 4,538Advances (unsecured - considered good):
- employees 1,939 2,951- contractors and suppliers 2,321 3,690
5,553 11,179
Maximum aggregate amount of advances due from executives at any month-end duringthe year was Rs.2.972 million (2014: Rs.3 million).
The fair value adjustments as required by IAS 39 (Financial instruments: recognitionandmeasurement) arising in respect of staff loans are not considered material and hence notrecognised.
(Rupees in thousand)
Raw materials inventoryas at June 30, 2015 includes inventorycosting Rs.84.395 million,which has been stated at net realisable value; the amount charged to profit and lossaccount in respect of inventory written down to net realisable value worked-out toRs.8.277 million approximately.
Finished good inventories as at June 30, 2015 include inventories costing Rs.37.594million, which has been stated at net realisable value; the amount charged to profit andloss account in respect of inventories write-down to net realisable value worked-out toRs.6.459 million approximately.
These loans are recoverable in monthly instalments, which vary from employee toemployee and are adjustable against the gratuity benefits of the respective employee.
Raw material stocks valuing Rs.186.477 million (2014: Rs.295.722 million) were pledgedwith National Bank of Pakistan as at June 30, 2015 as security for short term financefacilities (note 26.1).
ANNUAL REPORT 2015

31
12. DUE FROM ASSOCIATED COMPANIES 2015 2014Note
Bannu Woollen Mills Ltd. 0 546Rehman Cotton Mills Ltd. 0 546
0 1,09212.1
13. OTHER RECEIVABLES
14. CASH AND BANK BALANCES
Cash-in-hand 12 34Cash at banks on:- current accounts 2,300 282- dividend accounts 57 57- term deposit receipt 14.1 5,200 5,200- PLS account 14.2 44 14- PLS security deposit account 14.2 126 119
7,727 5,672
7,739 5,706
14.1
14.2
15. AUTHORISED SHARE CAPITAL
2014
17,500,000Ordinary shares of Rs.10 each 175,000 175,0007,500,000 Redeemable cumulative preference
shares of Rs.10 each 75,000 75,000
25,000,000 250,000 250,000
16. ISSUED, SUBSCRIBED AND PAID-UP CAPITAL
2,896,000 Ordinary shares of Rs.10 eachfully paid in cash 28,960 28,960
434,400 Ordinary shares of Rs.10 eachissued as fully paid bonus shares 4,344 4,344
321,778 Ordinary shares of Rs.10 eachissued to a Bank by conversion of long term liabilities 3,218 3,218
3,652,178 36,522 36,522
16.1 Ordinary shares held by the Associated Companies 2015 2014and an Associate at the year-end:
Bibojee Services (Pvt.) Ltd. 1,277,247 1,277,247Bannu Woollen Mills Ltd. 144,421 144,421Janana De Malucho Textile Mills Ltd. 587,493 587,493Waqf-e-Kuli Khan 57,638 57,638
2,066,799 2,066,799
This carries profit at the rate of 5.29% (2014: 8.3%) per annum and is under lien of acommercial bank against guarantee issued by it in favour of Sui Northern Gas Pipelines Ltd.These carry profit at the rates of 4.5% to 7% (2014: 5% to 6%) per annum.
---- Numbers ----
434,400
321,778
3,652,178
These balances had arisen on account of sharing of combined expenses with theAssociated Companies.
(Rupees in thousand)
2,896,000
17,500,000
7,500,000
25,000,000
2015
---- Numbers ----
Other receivables balance as at June 30, 2015 includes import letters of credit weightshortage claims aggregating Rs. 1.983 million and letters of credit margin depositamounting Rs. 3.655 million.
ANNUAL REPORT 2015
32
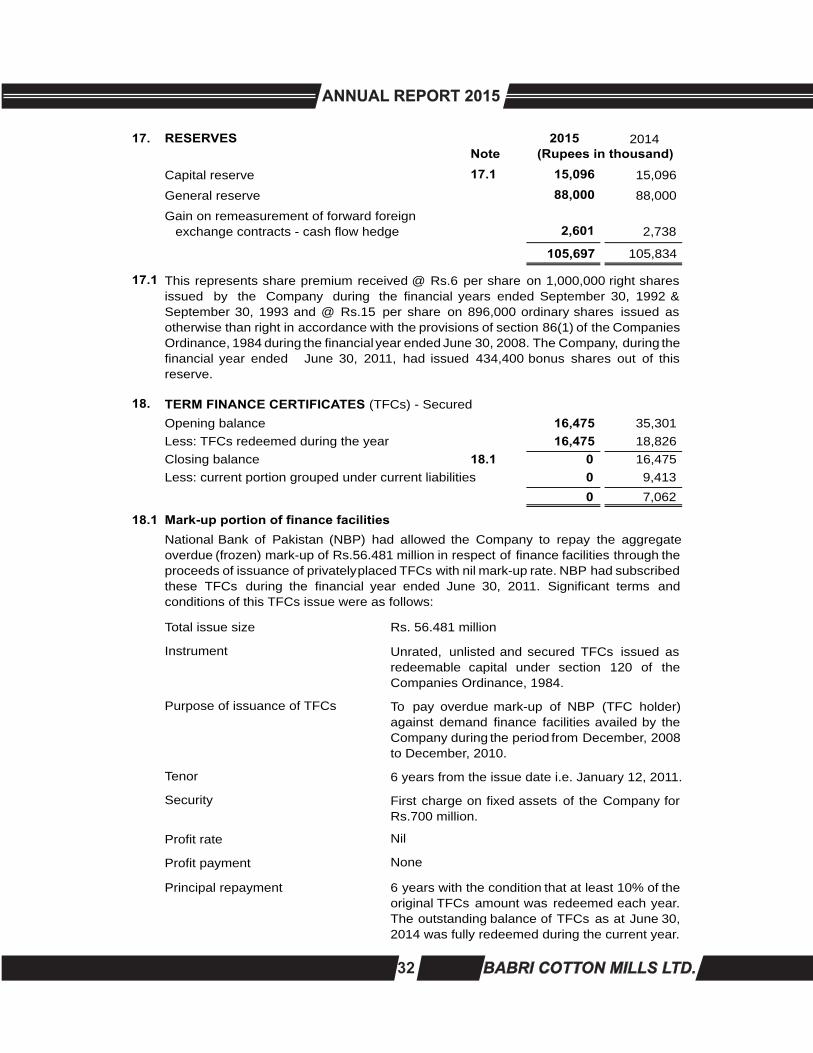
17. RESERVES 2015 2014Note
Capital reserve 17.1 15,096 15,096
General reserve 88,000 88,000
Gain on remeasurement of forward foreignexchange contracts - cash flow hedge 2,601 2,738
105,697 105,834
17.1
18. TERM FINANCE CERTIFICATES (TFCs)
- Secured
Opening balance 16,475 35,301
Less: TFCs redeemed during the year 16,475 18,826
Closing balance 18.1 0 16,475
Less: current portion grouped under current liabilities 0 9,413
0 7,062
18.1 Mark-up portion of finance facilities
Total issue size Rs. 56.481 million
Instrument
Purpose of issuance of TFCs
Tenor
Security
Profit rate Nil
Profit payment None
Principal repayment
This represents share premium received @ Rs.6 per share on 1,000,000 right sharesissued by the Company during the financial years ended September 30, 1992 &September 30, 1993 and @ Rs.15 per share on 896,000 ordinary shares issued asotherwise than right in accordance with the provisions of section 86(1) of the CompaniesOrdinance, 1984 during the financial year ended June 30, 2008. The Company, during thefinancial year ended June 30, 2011, had issued 434,400 bonus shares out of thisreserve.
National Bank of Pakistan (NBP) had allowed the Company to repay the aggregateoverdue (frozen) mark-up of Rs.56.481 million in respect of finance facilities through theproceeds of issuance of privatelyplaced TFCs with nil mark-up rate. NBP had subscribedthese TFCs during the financial year ended June 30, 2011. Significant terms andconditions of this TFCs issue were as follows:
6 years with the condition that at least 10% of theoriginal TFCs amount was redeemed each year.The outstanding balance of TFCs as at June 30,2014 was fully redeemed during the current year.
Unrated, unlisted and secured TFCs issued asredeemable capital under section 120 of theCompanies Ordinance, 1984.
To pay overdue mark-up of NBP (TFC holder)against demand finance facilities availed by theCompany during the period from December, 2008to December, 2010.
6 years from the issue date i.e. January 12, 2011.
First charge on fixed assets of the Company forRs.700 million.
(Rupees in thousand)
ANNUAL REPORT 2015
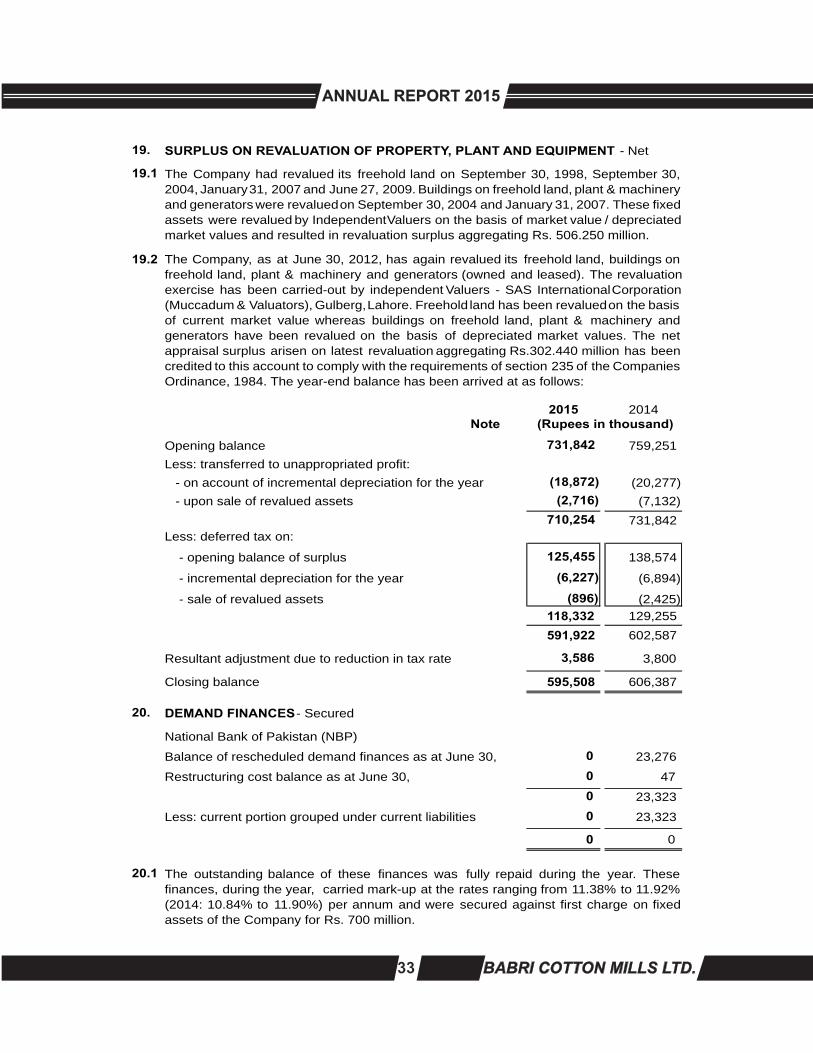
33
19. SURPLUS ON REVALUATION OF PROPERTY, PLANT AND EQUIPMENT -
Net
19.1
19.2
2015 2014Note
Opening balance 731,842 759,251
Less: transferred to unappropriated profit:
- on account of incremental depreciation for the year (18,872) (20,277)
- upon sale of revalued assets (2,716) (7,132)
710,254 731,842Less: deferred tax on:
- opening balance of surplus 125,455 138,574
- incremental depreciation for the year (6,227) (6,894)
- sale of revalued assets (896) (2,425)118,332 129,255
591,922 602,587
Resultant adjustment due to reduction in tax rate 3,586 3,800
Closing balance 595,508 606,387
20. DEMAND FINANCES - Secured
National Bank of Pakistan (NBP)
Balance of rescheduled demand finances as at June 30, 0 23,276
Restructuring cost balance as at June 30, 0 47
0 23,323
Less: current portion grouped under current liabilities 0 23,323
0 0
20.1 The outstanding balance of these finances was fully repaid during the year. Thesefinances, during the year, carried mark-up at the rates ranging from 11.38% to 11.92%(2014: 10.84% to 11.90%) per annum and were secured against first charge on fixedassets of the Company for Rs. 700 million.
The Company had revalued its freehold land on September 30, 1998, September 30,2004, January31, 2007 and June 27, 2009. Buildings on freehold land, plant & machineryand generators were revaluedon September 30, 2004 and January 31, 2007. These fixedassets were revalued by IndependentValuers on the basis of market value / depreciatedmarket values and resulted in revaluation surplus aggregating Rs. 506.250 million.
The Company, as at June 30, 2012, has again revalued its freehold land, buildings onfreehold land, plant & machinery and generators (owned and leased). The revaluationexercise has been carried-out by independent Valuers - SAS InternationalCorporation(Muccadum & Valuators), Gulberg,Lahore. Freehold land has been revaluedon the basisof current market value whereas buildings on freehold land, plant & machinery andgenerators have been revalued on the basis of depreciated market values. The netappraisal surplus arisen on latest revaluation aggregating Rs.302.440 million has beencredited to this account to comply with the requirements of section 235 of the CompaniesOrdinance, 1984. The year-end balance has been arrived at as follows:
(Rupees in thousand)
ANNUAL REPORT 2015

34
21. LIABILITIES AGAINST ASSETS SUBJECT TO FINANCE LEASE - Secured
21.1
- Assets
- Lease amount Rs.70 million
- Tenor 3.5 years
- Mark-up rate 6 months KIBOR plus 300 bps
- Security deposit 10% of the cost of machinery
- Residual value 10% of the cost of machinery
- Security
- Rental frequency 42 monthly instalments in arrears as detailed below:
21.2
2015
21.3 Deferred income arisen on sale and lease-back (Rupees in
arrangement has been worked-out as follows: thousand)
Lease amount 70,000
Carrying value of assets 57,405
Total deferred income 12,595
Less: credited to profit and loss account during the year 3,299
Balance as at June 30, 2015 9,296
22. STAFF RETIREMENT BENEFITS -
Gratuity
Significant actuarial assumptions 2015 2014
- discount rate 9.75% 13.25%
- expected rate of growth per annum in future salaries 8.75% 12.25%
- average expected remaining working life time of employees 8 years 8 years
These finances, during the year, carried finance cost at the rates ranging from 11.53% to13.17% per annum.
The Company, during the year, has entered into a sale and lease-back financing facilitywith Saudi Pak Industrial and Agricultural Investment Company Limited subject to thefollowing terms and conditions:
Gas fired power generator of Austrian origin andfour Simplex machines of Chinese origin
Title of leased assets in the name of lessor andranking charge on fixed assets of the Company
The future contribution rates of this scheme include allowance for deficit and surplus.Projected unit credit method, based on the following significant assumptions, is used forvaluation:
Minimum lease payments 22,038 36,730 58,768
Less: finance cost allocated to future periods 4,924 3,458 8,382
Present value of minimum lease payments 17,114 33,272 50,386
-------- Rupees in thousand --------
Particulars Upto
one yearTotal
From one to
three years
2015
ANNUAL REPORT 2015

35
2015 2014The amount recognised in the balance sheet
is as follows:
Present value of defined benefit obligation 62,500 55,631
Payable to outgoing members 0 166
Net liability at end of the year 62,500 55,797
Net liability at beginning of the year 55,797 43,551
Charge to profit and loss account 23,371 16,954
Experience adjustments (4,337) 3,528
Payments made during the year (12,331) (8,236)
Net liability at end of the year 62,500 55,797
The movement in the present value of defined benefit obligation is as follows:
Opening balance 55,631 40,835
Current service cost 16,806 12,965
Interest cost 6,565 3,989
Benefits paid (12,165) (5,580)
Benefits payable to outgoing members 0 (106)
Experience adjustments (4,337) 3,528
Closing balance 62,500 55,631
Expense recognised in profit and loss account
Current service cost 16,806 12,965
Interest cost 6,565 3,989
Charge for the year 23,371 16,954
Charge for the year has been allocated to:
- cost of sales 19,866 14,411
- distribution cost 233 170
- administrative expenses 3,272 2,373
23,371 16,954
Remeasurement recognised in other comprehensive income
Experience adjustments (4,337) 3,528
2015 2014 2013 2012 2011
Present value of defined benefit obligation 62,500 55,631 40,835 43,012 46,136
Experience adjustment on obligation (4,337) 3,528 14,142 1,370 4,068
--------------------------- Rupees in thousand ---------------------------
Comparison of present value of defined benefit obligation and experience adjustment onobligation for five years is as follows:
(Rupees in thousand)
ANNUAL REPORT 2015

36
22.1
22.2
22.3
23. DEFERRED TAXATION - Net 2015 2014Note
This is composed of the following:Taxable temporary differences arising in respect of:
- accelerated tax depreciation allowances 153,829 143,178- surplus on revaluation of property, plant & equipment 114,743 125,455
268,572 268,633Deductible temporary difference arising in respect of:
- staff retirement benefits - gratuity (20,000) (18,413)- provision for doubtful debts (733) (756)- minimum tax recoverable against
normal tax charge in future years (28,158) (14,148)- unused tax losses (40,218) 0
(89,109) (33,317)
179,463 235,316
24. TRADE AND OTHER PAYABLES
Due to Associated Companies 0 2,240Creditors 22,581 23,277Bills payable 24.1 11,284 11,133Advances from customers 3,265 6,097Accrued expenses 55,954 64,690Interest free security deposits - repayable on demand 170 170Workers' (profit) participation fund 24.2 0 5,520Waqf-e-Kuli Khan 34.1 12,048 12,048Workers' welfare fund 6,889 8,383Income tax deducted at source 846 2,149Unclaimed dividends 2,431 2,431Others 89 14
115,557 138,152
24.1 These are secured against lien on import documents.
Benefits paid during the year include payment of gratuity benefits to Ex. Chief FinancialOfficer amounting Rs.2.800 million.
The average duration of the benefit obligation as at June 30, 2015 is 8 years.
The expected contribution to defined benefit obligation for the year ending June 30, 2016is Rs.13.201 million.
(Rupees in thousand)
Year-end sensitivity analysis
Changes inassumption
Increase Decrease
Discount rate 1% 57,696
68,179
Salary growth rate 1% 68,303
57,502
Impact on defined benefit obligation
Rupees in thousand
ANNUAL REPORT 2015

37
2015 201424.2 Workers' (profit) participation fund (the Fund)* Note
Opening balance 5,520 15,619Add: interest on funds utilised in the
Company's business 370 743Less: paid to workers (5,890) (16,362)
0 0Add: allocation for the year 0 5,520
Closing balance 0 5,520
*
25. ACCRUED INTEREST / MARK-UP
Interest / mark-up accrued on:- demand finances 0 691- short term finances 5,989 10,643
Lease finance charges 387 0
6,376 11,33426. SHORT TERM FINANCES
Secured 26.1 193,653 379,054Unsecured - temporary bank overdrafts 0 1,492
193,653 380,546
26.1
These facilities are available upto December 31, 2015.
27. CURRENT PORTION OF NON-CURRENT LIABILITIES
Term finance certificates 18 0 9,413Demand finances 20 0 23,323Liabilities against assets subject to finance lease 21 17,114 0
17,114 32,73628. TAXATION
Opening balance 8,916 10,339Provision made during the year:
- current [net of tax credit under section 65Bof the Ordinance amounting Rs.3.602 million (2014: Rs.10.358)] 28.2 14,010 8,916
- prior years 41 (445)14,051 8,471
Less: payments / adjustments made againstcompleted assessments 8,957 9,894
14,010 8,916
(Rupees in thousand)
The Fund's audit for the year ended June 30, 2014 was carried-out by M/s Inaam ul Haq &Co., Chartered Accountants, 33-A, Behind Queens Centre, Shahrah-e-Fatima Jinnah,Lahore.
Short term finance facilities available from NationalBank of Pakistan (NBP) under mark-up arrangements aggregate Rs.630 million (2014: Rs.630 million) and are securedagainst pledge of raw material stocks, first charge on current and fixed assets of theCompany and personal guarantee of a director of the Company and an AssociatedPerson. These facilities, during the year, carried mark-up at the rates ranging from 8.98%to 12.18% (2014: 11.08% to 12.18%) per annum. Facilities available for opening letters ofcredit and guarantee from NBP aggregate Rs.300 million (2014: Rs.300 million) out ofwhich the amount remained unutilised at the year-end was Rs.174.062 million (2014:Rs.227.667 million). These facilities are secured against lien on import documents, firstcharge on current and fixed assets of the Company and personal guaranteeof a director
ANNUAL REPORT 2015

38
28.1
28.2
28.3
28.4
29. CONTINGENCIES AND COMMITMENTS
29.1
29.2
Due to location of the mills in the most affected area, the income of the Company wasexempt from tax under clause 126F of the second schedule to the Ordinance startingfrom the tax year 2010. As per management's contention, exemption available underclause 126F was a specific exemption granted by the Federal Board of Revenue to thespecific areas of Khyber Pakhtunkhwa.The Company has filed a writ petition before theIslamabad High Court, Islamabad praying exemption from levy of minimum tax undersection 113 of the Ordinance, which is still pending adjudication. The Peshawar HighCourt, Peshawar, in an identical writ petition concerning exemption of minimum tax filedby a Group Company, had granted exemption from levy of minimum tax. Themanagement is confident that IslamabadHigh Court will also grant exemption from levy ofminimum tax; accordingly, no provision for minimum tax for the financial year ended June30, 2012 was made in the books of account as well as provisions for minimum tax madeduring the financial years ended June 30, 2010 and June 30, 2011 aggregatingRs.23.055million were written-back in the books of account. An adverse judgment by the IslamabadHighRs. 39.712 million.
Court will create tax liability under section 113 of the Ordinance aggregating
Provisions for the current and preceding years represent minimum tax due under section113 of the Income Tax Ordinance, 2001 (the Ordinance).
Income tax assessments of the Company have been completed upto the Tax Year 2014i.e. upto the accounting year ended June 30, 2014.
The Finance Act, 2015 has omitted clause 126F of the Ordinance and has inserted a newsub-clause (xx) of clause (11A) in part IV of the second schedule of the Ordinancewherein exemption from levy of minimum tax under section 113 of the Ordinance hasbeen provided. The amendment would have a retrospective impact being related to taxyears 2010, 2011 and 2012.
The Company has filed a writ petition before the Peshawar High Court (PHC) against theGovernment of Khyber Pakhtunkhwa and Others in respect of minimum wagesNotification dated September 09, 2014 whereby minimum wages of workers wereenhanced upto Rs.15,000 per month. The PHC has admitted the writ petition and grantedan interim order against the enhancement of minimum wages. An adverse judgment bythe PHC will create additional wage liabilities aggregating Rs.4.214 million approximately.
The Deputy Commissioner InlandRevenue(the Assessing Officer), for the tax year 2006,has raised tax demands under sections 161 / 205 of the Ordinance aggregatingRs.5.468million. The Company has filed an appeal before the Commissioner Inland Revenue(Appeals) against the aforementioned order, who during the financial year endedJune 30, 2013 had remanded the order back to the Assessing Officer for reconsiderationof payments already made by the Company.
The Company, during the year, has challenged the levy of Gas InfrastructureDevelopment Cess (GIDC) by filing a petition before the PHC. The PHC has stayed thelevy / cess charged through GIDC Act, 2015 and the Respondents were directed tosubmit their comments. Earlier, the Supreme Court of Pakistan had dismissed the appealof Federation on the same matter on August 22, 2014, wherein it was held that the levyunder the GIDC Act, 2011 was not covered under any entry relating to the imposition orlevy of a tax as envisaged in the Constitution.
Sui Northern Gas Pipelines Ltd., along with gas bill for the month of June, 2015, hasraised GIDC demands aggregating Rs.89.876 million, which are payable in case of anadverse judgement by the PHC. The petition before the PHC is pending adjudication.
ANNUAL REPORT 2015

39
29.3
29.4 Also refer contents of note 28.3.
29.5 Commitments against irrevocable letters of credit 2015 2014outstanding at the year-end were for: Note
- raw materials 46,381 0
- spare parts 18,263 0
64,644 0
30. SALES - NetLocal
- Yarn 1,769,782 1,937,547
- Waste 39,343 44,233
1,809,125 1,981,780
Less: sales tax 51,156 54,384
1,757,969 1,927,396
31. COST OF SALES
Raw materials consumed 31.1 1,043,906 1,223,300
Packing materials consumed 31,282 32,112
Salaries, wages and benefits 31.2 248,626 234,960
Power and fuel 212,084 251,441
Repair and maintenance:- stores consumed 48,833 50,963
- expenses 9,693 9,771
58,526 60,734
Depreciation 50,473 47,097
Insurance 5,661 4,557
1,650,558 1,854,201Adjustment of work-in-process Opening 35,702 31,777
Closing (36,801) (35,702)
(1,099) (3,925)
Cost of goods manufactured 1,649,459 1,850,276
Adjustment of finished goods Opening stock 173,675 17,082
Closing stock (58,880) (173,675)
114,795 (156,593)
Cost of goods sold 1,764,254 1,693,683
Guarantees aggregating Rs.55.200 million (2014: Rs.55.200 million) issued bycommercial banks on behalf of the Company in favour of Sui NorthernGas Pipelines Ltd.were outstanding as at June 30, 2015. Guarantee amounting Rs.50 million is securedagainst the securities as detailed in note 26.1 whereas guarantee amounting Rs.5.200million is secured against term deposit receipt of the equivalentamount as stated in note14.1. Guarantee amounting Rs.50 million is valid upto December 31, 2015 whereasguarantee amounting Rs.5.200 million is valid upto April 7, 2016.
(Rupees in thousand)
ANNUAL REPORT 2015

40
31.1 Raw materials consumed 2015 2014Note
Opening stock 399,795 299,168Purchases 856,741 1,322,951
1,256,536 1,622,119Less: closing stock 214,131 399,795
Raw materials issued 1,042,405 1,222,324
Cess on cotton consumed 1,501 976
1,043,906 1,223,300
31.2
32. DISTRIBUTION COST
Freight, loading, travelling and conveyance 2,134 2,222
Salaries and benefits 32.1 6,698 5,165
Commission 184 1,527
Others 435 730
9,451 9,644
32.1
33. ADMINISTRATIVE EXPENSES
Salaries and benefits 33.1 42,824 44,984
Printing and stationery 724 901
Communication 1,027 1,149
Travelling and conveyance 1,446 2,242
Rent, rates and taxes 2,674 2,057
Insurance 407 376
Advertisement 81 69
Repair and maintenance 2,646 1,419
Vehicles' running 3,779 2,609
Guest house expenses and entertainment 1,337 2,077
Subscription 662 465
Auditors' remuneration:- statutory audit 825 605
- half yearly review 150 127
- consultancy charges 65 50
- certification charges 42 10
- out-of-pocket expenses 45 421,127 834
Legal and professional charges (other than Auditors) 2,144 2,762
Depreciation 1,971 2,269
62,849 64,213
33.1
These include Rs.19,866 thousand (2014: Rs.14,411 thousand) in respect of staffretirement benefits - gratuity.
These include Rs.233 thousand (2014: Rs.170 thousand) in respect of staff retirementbenefits - gratuity.
(Rupees in thousand)
These include Rs.3,272 thousand (2014: Rs.2,373 thousand) in respect of staffretirement benefits - gratuity.
ANNUAL REPORT 2015

41
34. OTHER EXPENSES 2015 2014Note
Loss on disposal of operating fixed assets - net 5.4 5,391 13,427
Donations 0 30
Donation to Waqf-e-Kuli Khan 34.1 0 1,773
Workers' (profit) participation fund 24.2 0 5,520
Workers' welfare fund 0 2,098
5,391 22,848
34.1
- Mr. Raza Kuli Khan Khattak - Mrs. Shahnaz Sajjad Ahmad
- Mr. Ahmad Kuli Khan Khattak - Dr. Shaheen Kuli Khan Khattak
- Mrs. Zeb Gohar Ayub Khan
35. OTHER INCOME
Income from financial assets
Return on bank deposits 887 1,176
Amortisation of gain on forward foreign exchange contracts 137 144
Income from non-financial assets
Salvage sales 3,239 4,074
Amortisation of restructuring cost on demand finances 20 47 63
Deferred income - credited 21.3 3,299 0
Unclaimed payable balances written-back 38 0
7,647 5,457
36. FINANCE COST
Mark-up on demand finances 692 4,352
Lease finance charges 6,401 930
Mark-up on short term finances 40,822 34,852
Interest on workers' (profit) participation fund 24.2 370 743
Bank charges 349 544
48,634 41,421
37. TAXATION
Current - for the year 14,010 8,916 - for prior years 41 (445)
28 14,051 8,471Deferred: - for the year 23 (55,853) 19,624 - resultant adjustment due to reduction in tax rate 19 3,586 3,800
(52,267) 23,424
(38,216) 31,895
(Rupees in thousand)
The amount has been donated to Waqf-e-Kuli Khan, (a Charitable Institution)administered by the following directors of the Company:
ANNUAL REPORT 2015

42
38. (LOSS) / EARNINGS PER SHARE
2015 2014
There is no dilutive effect on (loss) / earnings per share of the Company, which is based on:
(Loss) / profit after taxation attributable to ordinary shareholders (85,587) 82,020
Weighted average number of ordinary sharesin issue during the year 3,652,178 3,652,178
(Loss) / earnings per share - basic (23.43) 22.46
39. FINANCIAL RISK MANAGEMENT OBJECTIVES AND POLICIES
39.1 Financial Risk Factors
39.2 Market risk
(a) Currency risk
(Number of shares)
------- Rupees -------
The Company's activities expose it to a variety of financial risks: market risk (includinginterest rate risk, price risk and currency risk), credit risk and liquidity risk. TheCompany's overall risk management focuses on the unpredictabilityof financial marketsand seeks to minimise potential adverse effects on the Company's financial performance.
Risk management is carried-out by the Company's finance department under policiesapproved by the board of directors. The Company's finance department evaluatesfinancial risks based on principles for overall risk management as well as policiescovering specific areas, such as foreign exchange risk, interest rate risk, credit risk andinvestment of excess liquidity, provided by the board of directors.
(Rupees in thousand)
Market risk is the risk that the fair value or future cash flows of a financial instrument willfluctuate because of changes in market prices. Market risk comprises of three types ofrisks: currency risk, interest rate risk and price risk.
Foreign currency risk arises mainly where receivables and payables exist due totransactions entered into in foreign currencies. The Company is exposed to currency riskon import of raw materials and stores and spares denominated in U.S. $ and Euro. TheCompany's exposure to foreign currency risk for U.S. $ and Euro is as follows:
Rupees U.S.$ Euro
Funded:
Bills payable 11,284 111 0
Unfunded:
Outstanding letters of credit 64,644 456 161
75,928 567 161
Rupees U.S.$ Euro
Funded:
Bills payable 11,133 113 0
2015
------ in thousand ------
2014
------ in thousand ------
ANNUAL REPORT 2015

43
The following exchange rates have been applied:
2015 2014 2015 2014
U.S. $ to Rupee 101.95 103.86 101.70 98.75
Euro to Rupee 126.50 -
113.79 -
Sensitivity analysis
2015 2014Effect on loss (2014: profit) for the year:
U.S. $ to Rupee 1,129 1,116
(b) Interest rate risk
2015 2014 2015 2014
% %
Fixed rate instruments
Financial assets
Bank balances 4.5 to 7 5 to 8.3 5,370 5,333
Variable rate instruments
Financial liabilities
Demand finances - 10.84 to 11.90 0 23,276
Liabilities against assets subject to finance lease 11.53 to 13.17 -
50,386 0
Short term finances 8.98 to 12.18 11.08 to 12.18 193,653 379,054
Fair value sensitivity analysis for fixed rate instruments
Cash flow sensitivity analysis for variable rate instruments
(Rupees in thousand)
Carrying amount
The sensitivity analysis prepared is not necessarily indicative of the effect on loss (2014:profit) for the year and liabilities of the Company.
Average rate Balance sheet date rate
At June 30, 2015, if Rupee had strengthenedby 10% against U.S.$ with all other variablesheld constant, loss after taxation for the year would have been lower (2014: profit aftertaxation would have been higher) by the amount shown below mainly as a result of foreign exchange gains on translation of foreign currency financial liabilities.
Interest rate risk is the risk that the fair value or future cash flows of a financial instrumentwill fluctuate because of change in market interest rates. At the reportingdate, the interestrate profile of the Company's interest bearing financial instruments is as follows:
The Company does not account for any fixed rate financial assets and liabilities at fairvalue through profit or loss. Therefore, a change in interest rate at the reporting datewould not affect profit and loss account.
At June 30, 2015, if interest rate on variable rate financial liabilities had been 1% higher /lower with all other variables held constant, loss after taxation for the year would havebeen higher / lower by Rs.2.440 million; (2014: profit after taxationfor the year would havebeen Rs.4.023 million lower / higher) mainly as a result of higher / lower interest expenseon variable rate financial liabilities.
Effective rate
Rupees in thousand
The weakening of Rupee against U.S. $ would have had an equal but opposite impact onloss (2014: profit) after taxation.
ANNUAL REPORT 2015

44
(c) Price risk
39.3 Credit risk exposure and concentration of credit risk
Exposure to credit risk
2015 2014
Security deposits 1,151 1,151
Trade debts 165 367
Due from Associated Companies 0 1,092
Other receivables 6,007 2,832
Bank balances 7,727 5,672
15,050 11,114
39.4 Liquidity risk
(Rupees in thousand)
Price risk is the risk that the fair value or future cash flows of a financial instrument willfluctuate as a result of changes in market prices (other than those arising from interestrate risk or currency risk) whether those changes are caused by factors specific to theindividual financial instruments or its issuer or factors affecting all similar financialinstruments traded in the market. The Company is not exposed to any significant price risk.
The maximum exposure to credit risk as at June 30, 2015 along with comparative istabulated below:
Liquidity risk is the risk that the Company will not be able to meet its financialobligationsas they fall due. The Company's approach is to ensure, as far as possible, to alwayshave sufficient liquidity to meet its liabilities when due. Prudent liquidity risk managementimplies maintainingsufficient cash and marketablesecurities and ensuring the availabilityof adequate credit facilities. The Company's treasury department aims at maintainingflexibility in funding by keeping committed credit lines available.
All the trade debts at the balance sheet date represent domestic parties.
Credit risk represents the risk of a loss if the counter party fails to discharge its obligationand cause the other party to incur a financial loss. The Company attempts to controlcredit risk by monitoring credit exposures, limiting transactions with specificcounterparties and continually assessing the credit worthiness of counterparties.
Concentrations of credit risk arise when a number of counterparties are engaged insimilar business activities or have similar economic features that would cause theirabilities to meet contractual obligations to be similarly affected by changes in economic,political or other conditions. Concentrations of credit risk indicate the relative sensitivityofthe Company's performance to developments affecting a particular industry.
ANNUAL REPORT 2015
Credit risk primarily arises from trade debts and balances with banks. To manage exposureto credit risk in respect of trade debts, management performs credit reviews taking intoaccount the customer's financial position, past experience and other relevant factors. Whereconsidered necessary, advance payments are obtained from certain parties. Credit risk onbank balances is limited as the counter parties are banks with reasonably high credit ratings.

45
39.5 Fair values of financial instruments
Fair value is the amount for which an asset could be exchanged, or liability settled,between knowledgeable willing parties in an arm’s length transaction. Consequently,differences may arise between carrying values and the fair value estimates. At June 30,2015, the carrying values of all financial assets and liabilities reflected in the financialstatements approximate to their fair values except for loans to employees, which arevalued at their original costs less repayments.
Financial liabilities in accordance with their contractual maturities are presented below:
The contractual cash flows relating to the above financial liabilitieshave been determinedon the basis of interest / mark-up rates effective at the respective year-ends. The rates ofinterest / mark-up have been disclosed in the respective notes to these financialstatements.
2014
Term finance certificates 16,475 16,475 9,413 7,062
Demand finances 23,276 23,710 23,710 0
Trade and other payables 116,003 116,003 116,003 0
Accrued interest / mark-up 11,334 11,334 11,334 0
Short term finances 380,546 395,040 395,040 0
547,634 562,562 555,500 7,062
2015
Liabilities against assets
subject to finance lease 50,386 50,386 17,114 33,272
Trade and other payables 104,557 104,557 104,557 0
Accrued interest / mark-up 6,376 6,376 6,376 0
Short term finances 193,653 202,277 202,277 0
354,972 363,596 330,324 33,272
Between 1
to 3 years
---------------- Rupees in thousand ----------------
ParticularsCarrying
amount
Contractual
cash flows
Less than
1 year
ANNUAL REPORT 2015
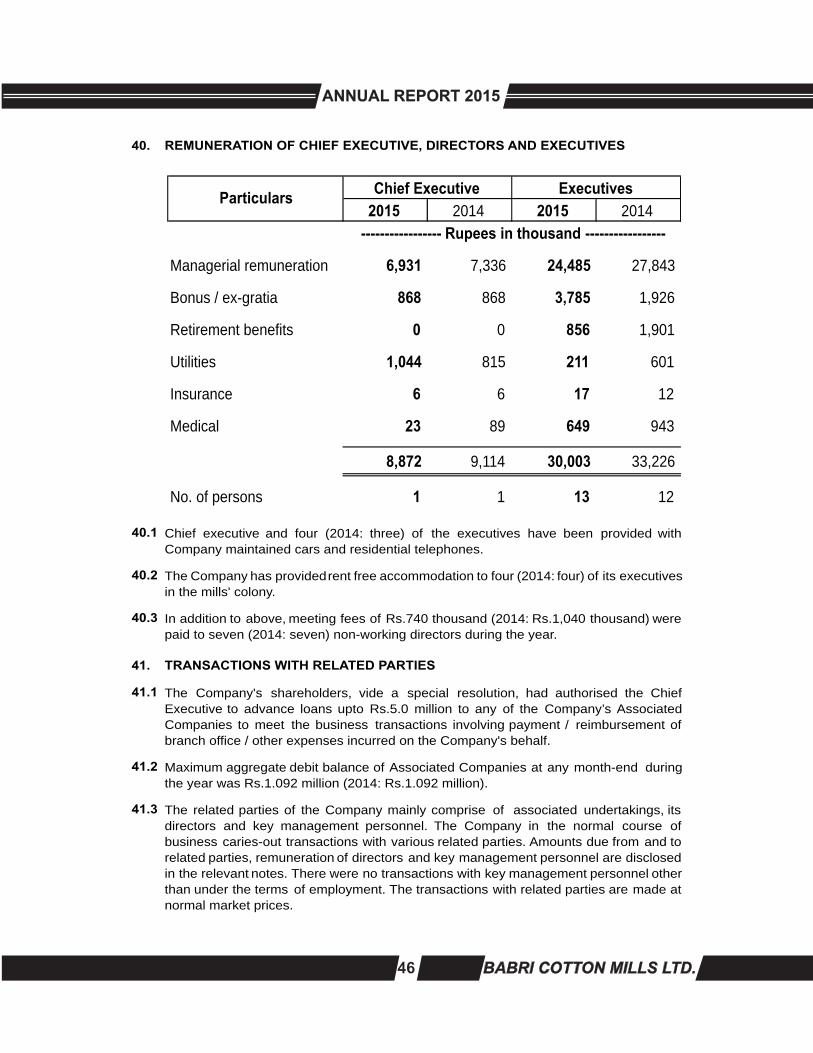
46
40. REMUNERATION OF CHIEF EXECUTIVE, DIRECTORS AND EXECUTIVES
40.1
40.2
40.3
41. TRANSACTIONS WITH RELATED PARTIES
41.1
41.2
41.3
In addition to above, meeting fees of Rs.740 thousand (2014: Rs.1,040 thousand) werepaid to seven (2014: seven) non-working directors during the year.
The related parties of the Company mainly comprise of associated undertakings, itsdirectors and key management personnel. The Company in the normal course ofbusiness caries-out transactions with various related parties. Amounts due from and torelated parties, remuneration of directors and key management personnel are disclosedin the relevant notes. There were no transactions with key management personnel otherthan under the terms of employment. The transactions with related parties are made atnormal market prices.
Maximum aggregate debit balance of Associated Companies at any month-end duringthe year was Rs.1.092 million (2014: Rs.1.092 million).
Chief executive and four (2014: three) of the executives have been provided withCompany maintained cars and residential telephones.
The Company has providedrent free accommodation to four (2014: four) of its executivesin the mills' colony.
The Company's shareholders, vide a special resolution, had authorised the ChiefExecutive to advance loans upto Rs.5.0 million to any of the Company’s AssociatedCompanies to meet the business transactions involving payment / reimbursement ofbranch office / other expenses incurred on the Company's behalf.
2015 2014 2015 2014
Managerial remuneration 6,931 7,336 24,485 27,843
Bonus / ex-gratia 868 868 3,785 1,926
Retirement benefits 0 0 856 1,901
Utilities 1,044 815 211 601
Insurance 6 6 17 12
Medical 23 89 649 943
8,872 9,114 30,003 33,226
No. of persons 1 1 13 12
----------------- Rupees in thousand -----------------
ParticularsChief Executive Executives
ANNUAL REPORT 2015

47
Material transactions with related parties during the year were as follows:
42. CAPITAL RISK MANAGEMENT
43. OPERATING SEGMENT
These financial statements have been prepared on the basis of single reportable segment.
43.1 Yarn sales represent 97.83% (2014: 97.77%) of the total sales of the Company.
43.2 All the Company's sales relate to customers in Pakistan.
43.3 All non-current assets of the Company as at June 30, 2015 are located in Pakistan.
43.4
There was no change to the Company’s approach to capital management during the yearand the Company is not subject to externally imposed capital requirements except for themaintenance of current ratio under the financing agreements.
The Company's prime objective when managing capital is to safeguard its ability tocontinue as a going concern so that it can continue to provide returns for shareholders,benefits for other stakeholders and to maintain a strong capital base to support thesustained development of its business.
The Company manages its capital structure by monitoring return on net assets andmakes adjustments to it in the light of changes in economic conditions. In order tomaintain or adjust the capital structure, the Company may adjust the amount of dividendpaid to shareholders and / or issue new shares.
Four (2014: two) of the Company's customers contributed towards 49.68% (2014:49.41%) of net sales during the year aggregating Rs.854.004 million (2014: Rs.952.282 million)
2015 2014
Janana De Malucho Associated Residential rent:Textile Mills Ltd. Company - paid 132
132- received 5 101
Utilities paid 987
1,015
Salaries paid 892
801
Dividend received 1,023 0
The Universal Insurance Insurance premium 0 1,433
Co. Ltd. Rent expensed 0 409Insurance claim 0 115
Waqf-e-Kuli Khan Trust Associated Donation 0 1,773
Undertaking
-do-
Name Nature of
relationshiNature of transaction
--- Rupees in ‘000 ---
ANNUAL REPORT 2015

48
44. CAPACITY AND PRODUCTION 2015 2014
Number of spindles installed 53,040 53,040
Number of rotors installed 400 400
Number of shifts worked for spindles 1,089 1,095
Number of shifts worked for rotors 1,089 1,095
Number of spindles / shifts worked 55,296,512 56,785,418
Number of rotors' shifts worked 217,800 218,700
Average count spun 49.08 51.30
Rotors' capacity Kgs 370,475 372,176
Actual production of yarn of all counts Kgs 4,738,775 4,704,560
44.1
45. NUMBER OF EMPLOYEES 2015 2014
Number of persons employed as at June 30,
- permanent 1,155
1,224
- contractual 40
61
Average number of employees during the year
- permanent 1,189
1,217
- contractual 49
59
46. DATE OF AUTHORISATION FOR ISSUE
47. FIGURES
These financial statements were authorised for issue on September 23, 2015 by theboard of directors of the Company.
------ Numbers ------
Corresponding figures have been re-arranged and re-classified, wherever necessary, forthe purpose of comparison. However, no material re-arrangements and re-classificationshave been made in these financial statements.
It is difficult to describe precisely the production capacity in textile industry since itfluctuates widely depending on various factors such as count of yarn spun, spindles'speed, twist per inch and raw materials used, etc. It also varies according to the patternof production adopted in a particular year.
ANNUAL REPORT 2015
Raza Kuli Khan KhattakChief Executive
Dr. Shaheen Kuli Khan Khattak Director
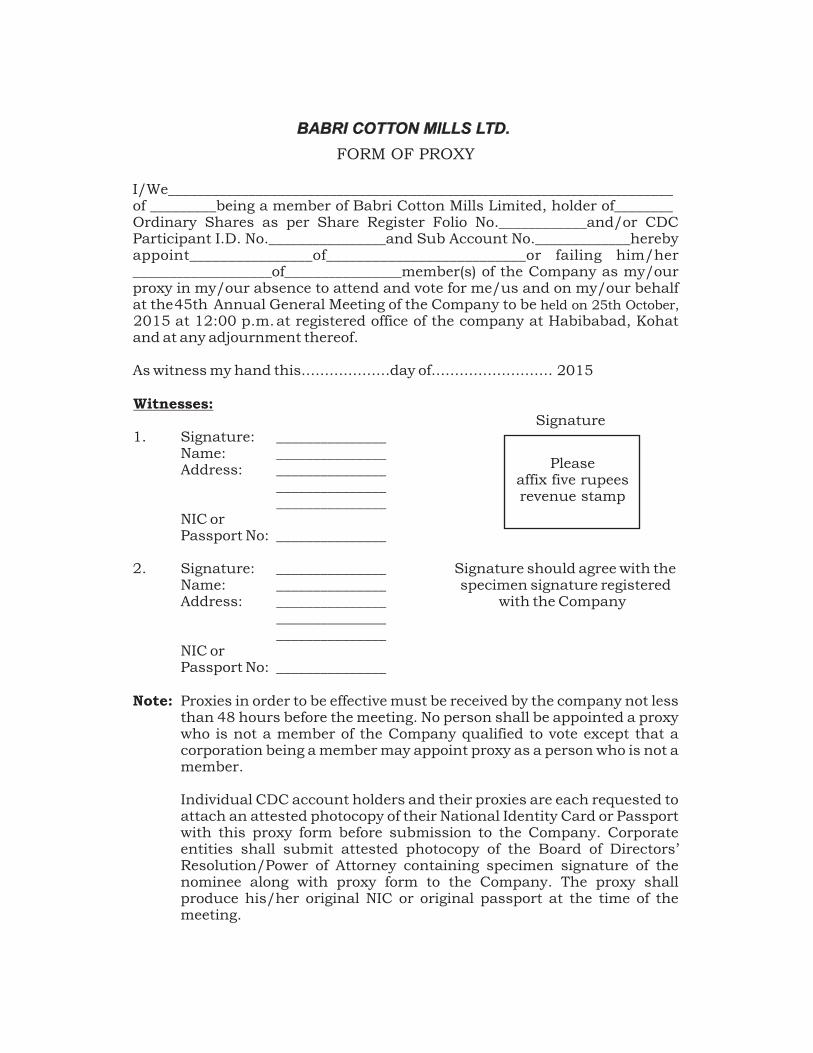
Pleaseaffix five rupeesrevenue stamp
45th2015 at 12:00 p.m.
2015
held on 25th October,
Witnesses: