4226 final report2907_s13803
74
Energy Efficiency Trend Analysis of the Tourism Sector Susanne Becken and Jo-Anne Cavanagh Landcare Research PO Box 69, Lincoln 8152 New Zealand Landcare Research Contract Report: LC0203/180 PREPARED FOR:
Transcript of 4226 final report2907_s13803
Energy Efficiency Trend Analysis of the Tourism Sector
Susanne Becken and Jo-Anne Cavanagh
Landcare ResearchPO Box 69, Lincoln 8152New Zealand
Landcare Research Contract Report: LC0203/180
PREPARED FOR:Energy Efficiency and Conservation Authority
DATE: August 2003

Reviewed by:
Prof. David Simmons
Ian TurneyScientistLandcare Research
Approved for release by:
Richard GordonScience ManagerSustainable Business and Government
© Energy Efficiency and Conservation Authority
No part of this work covered by copyright may be reproduced or copied in any form or by any means (graphic, electronic or mechanical, including photocopying, recording, taping, information retrieval systems, or otherwise) without the written permission of EECA.

Contents
Summary....................................................................................................................................51. Introduction.......................................................................................................................92. Background.......................................................................................................................93. Objectives.......................................................................................................................104. Methods..........................................................................................................................10
4.1 Industry Analyses..................................................................................................114.2 Tourist data............................................................................................................134.3 Model development...............................................................................................15
5. Results.............................................................................................................................165.1 Industry analyses...................................................................................................165.2 Integration of industry and tourist analyses...........................................................27
6. Discussion.......................................................................................................................287. Conclusions.....................................................................................................................308. Recommendation............................................................................................................329. References.......................................................................................................................3410. Appendices......................................................................................................................35
10.1 Appendix A – Survey form...................................................................................3510.2 Appendix B – Sources of transport data................................................................3710.3 Appendix C – Transport data................................................................................3810.4 Appendix D – Energy consumption by accommodation sub-sector.....................3910.5 Appendix E – Tourist behaviour...........................................................................4510.6 Appendix F – Tourist types...................................................................................46
Landcare Research
3
Landcare Research
4

Summary
Project and ClientThe Energy Efficiency Conservation Authority (EECA) commissioned Landcare Research to provide data and prepare a report on the New Zealand tourism sector’s energy use and trends for two reference years, 1999 and 2001. For the purposes of this study tourism is defined according to the World Tourism Organisation as ‘the activities of persons travelling to and staying in places outside their usual environment for not more than one consecutive year for leisure, business and other purposes’. As such, tourism is defined on the basis of consumption, and energy consumed by tourists has to be theoretically aggregated for all activities tourists do (i.e. transport, accommodation, restaurants) to arrive at a final estimate for energy use associated with the sector. Previous analyses of the sector had shown that tourism contributes 6% (27.5 PJ in 1997/98) of national energy use. Transport and accommodation are the largest contributors to energy use (23.1 PJ of a total of 27.5 PJ consumed by tourism in 1997/98, Patterson & McDonald, 2002), with transport being the key driver (Becken, 2002). EECA’s intention was to conduct further analyses on these data to determine any change in overall consumption in three factors (volume, structure, technology) through the means of their ‘decomposition analysis’.
ObjectivesThe objectives of this study were: Changes in energy efficiencies of vehicles and accommodation providers. Energy use efficiency patterns, trends and key drivers, including the relative shares of
electricity and other fuels used by the sector, and the end use activities (sub-sectors) to which this energy is put.
Changes in the relative importance of the domestic and international tourist mix and their respective energy use demands.
Structural changes within tourist types (e.g. modal shift, travel distances by transport mode, length of stay, accommodation usage).
Overall effect of growing tourist activity (total visitor volumes) on energy use demands A qualitative assessment of the potential gains in energy efficiency for different end-uses
and the strategic measures for capturing these gains. Benchmark the performance of the New Zealand tourist industry sector against individual
best practice energy use data and overseas data where this is available.
Methods
The methods used in the current study are those used by Becken (2002a). Becken (2002a) combined information gained in the analysis of the energy use by different sub-sectors of tourism (e.g. transport, accommodation) with analysis of tourist behaviour to derive overall energy use by tourism. The current study used data provided in Becken (2002a) for the 1999 reference year and collected new data for the 2001 reference year. 2001 is used as the second reference year as it relates to the available tourist data. However, the industry data mostly refers to that collected for 2002. The reason for this discrepancy is due to logistic reasons of the data collection.
Landcare Research
5

For the industry analyses for the second reference year, operators in the hotel, motel and backpacker accommodation categories were asked to provide information on their business and the amount of electricity, fossil fuel and other solid fuel consumed in its running. Similarly, transport providers were asked to supply data on fuel consumption and load factors, where information was not able to be accessed from publications. Information gained in these surveys was translated into energy efficiencies (energy use per unit of output, i.e. MJ/passenger-kilometre [MJ/pkm] and MJ/visitor-night) and compared for the two reference years. Analyses of tourist behaviour (i.e. travel choices in the transport and accommodation sub-sectors) were based on data provided through the Domestic Travel Study and the International Visitor Study (both undertaken by Tourism New Zealand), and were used to identify distinct tourist types (by means of cluster analysis). The travel behaviour of each tourist type was combined with energy efficiencies obtained in the industry analyses, which then enabled calculation of energy use associated with each tourist type and for all tourists.
Results Overall, hotel and motel operators showed a decrease in energy efficiency, dropping from
134.0 MJ/ visitor-night and 40.4 MJ/visitor-night respectively in the 1999 reference year to 145.3 MJ/ visitor-night and 48.5 MJ/ visitor-night respectively in the 2001 reference year. This equates to a decrease in efficiency of 8.4% and 20% for hotels and motels respectively. In contrast backpacker operators increased their energy efficiency from 38.6 MJ/ visitor-night in the 1999 reference year to 36.7 MJ/ visitor-night in 2001.
The energy efficiency of domestic air travel, rail, Cook Strait ferry and coach travel (backpacker bus, scheduled coach, shuttle bus) increased by 5-74% in the 2001 reference year, although the efficiency of campervans decreased (16 %). In 2001, energy use by the different transport modes varied from 0.32 MJ/pkm for scheduled coaches to 2.63 MJ/pkm for the Cook Strait ferry. The energy efficiency of cars was unable to be updated, due to the difficulties in accounting for the large number of number of factors (e.g. model of car, year of manufacture, driving conditions) that influences energy efficiencies.
The energy efficiency of domestic air travel improved (2.5 MJ/pkm in 2001 compared with 3.2 MJ/pkm in 1999), as a result of increases in both technological efficiency (lower fuel consumption per kilometre) and operational efficiency (increased load factors).
Overall, transport and accommodation associated with tourism consumed 22.6 PJ in 1999 and 21.0 PJ in 2001, which is equivalent to a decrease of 7.5%. Transport and accommodation contributed 81.7 % (18.5 PJ) and 18.3 % (4.2 PJ) respectively of the energy use in 1999 and 78.8% (16.5 PJ) and 21.2% (4.4 PJ) respectively in 2001.
In 1999, fuel (diesel and petrol) contributed at 43.8% (9.9 PJ) of the total energy use, followed by aviation fuel (38.4%, 8.7 PJ) and electricity (13.2%, 3.0 PJ). The proportions were similar in 2001, where petroleum fuel made up 44.7% (9.4 PJ), aviation fuel 34.5% (7.2 PJ) and electricity 15.1% (3.2 PJ) of the total energy use.
Including both international and domestic tourists, the most important drivers of this energy use are domestic air (34.5% of the total energy use in 2001), private cars (30.5%), and private homes (9.6%).
Fewer tourists travelled by domestic air in 2001 compared with 1999 (3.8% less for domestic tourists and 7.5% less for international tourists). This may change with the introduction of Air New Zealand’s ‘Express Class’ that may lead to increased volumes and possibly more flights as a result of the associated cheaper fares.
Domestic tourists contributed 17.8 PJ and 15.7 PJ of the total energy consumed in 1999 and 2001, respectively. International tourists consumed 4.9 PJ in 1999 and 5.2 PJ in
Landcare Research
6

2001. There were 2.0% fewer domestic tourists in 2001 than in 1999, and 17.9% more international tourists.
The main drivers of energy use for domestic tourists were private cars (39.2% of the energy consumed domestic tourists in 2001), domestic air travel (36.1%), and energy use of private homes. (8.1%).
For international tourists, domestic air travel (29.6% of the energy consumed by international tourists in 2001), rental cars (13.8%), hotels (14.9%) and private homes (14.3%) are the main drivers of energy use.
Domestic tourists travelled for less time (2.9 days in 2001 compared with 3.2 days in 1999), although similar distances in 2001 (614 km in 2001 compared with 623 km in 1999).
International tourists stayed longer in 2001 (21.1 days compared with 17.7 days in 1999). The distance travelled per tourist remained remarkably constant (about 1500 km) – a slight increase in distance travelled by camping tourists was offset by the shorter distances travelled by all other tourist types in 2001 compared with 1999.
Conclusions This study showed that the tourism sector has reduced its energy consumption in 2001 compared with 1999 by 7.5%. This is a result of decreasing domestic tourist volumes (-2%), increases in technological and operational energy efficiencies and minor changes in tourist behaviour (regarding transport modes, travel distances, accommodation choices). Because of its size (about 8 times larger than international tourism in terms of tourist trips), domestic tourism is the driver of overall energy use of tourism. Overall, transport was the major source of energy consumption (81.7% and 78.8% in the reference years 1999 and 2001 respectively), with domestic air travel and private cars being the primary contributors (34.5% and 30.5% in 2001 respectively). However, more information is needed to adequately reflect the influence of changes in energy efficiency of cars on the energy demand of tourism.
Overall, accommodation businesses did not show improvements in energy efficiency. Potential for energy savings exist in initially making operators aware of how their energy is being used, and of cost-effective ways to reduce that energy use. Awareness of energy use could be achieved through the promotion of consistent data reporting, such as that already commenced by EECA with their auditing spreadsheet for hotels and by the Youth Hostel Association who records energy consumption of its member hostels. However, it should also be acknowledged that a number of operators already record energy consumption for their own use and are working towards reducing energy use. Energy consumption of an individual operator also depends on the number and type of facilities (e.g. spas, saunas, bars) offered and cost-effective energy saving measures need to be tailored to individual businesses. As such, case studies of cost-effective energy saving measures such as those provided by the Environmental Accommodation Providers of Auckland could be promoted as examples of ways different operators have already reduced energy use.
International tourism is growing continuously, and current improvements in energy efficiency (e.g. air travel) do not offset the increased energy demand of international tourists resulting from this growth. Possible pathways to decrease energy use are either related to industries (technological or structural improvement, for example the type of transport networks) or tourist behaviour (decreasing travel distance per tourist).
Landcare Research
7

Recommendations The greatest energy saving potential exists by targeting the behaviour of domestic
tourists, in particular that related to transport, primarily air travel and private cars. Within the transport sector, domestic air travel and cars (private and rental) are the
primary contributors to energy use; as such EECA should focus their attention on strategies to reduce energy use associated with these transport modes. Conduct further research in the energy consumption of rental cars as important drivers of energy use by international tourists.
Within the accommodation sector, private homes and hotels are the primary contributors to energy use. Energy saving measures need to be tailored toward individual operators. EECA could assist this by providing a service to identify opportunities for energy saving, possibly starting with a small pilot group of hotels who use EECA’s monitoring spreadsheet for energy efficiency. Consistent data collection is important for future trend analyses.
Increase awareness of energy consumption issues among tourists. Develop strategies for each tourist type (especially domestic air travellers and
international coach tourists) to reduce energy use. Repeat this analysis in about five years’ time to better depict trends.
Landcare Research
8

1. Introduction
This project was carried out between March and July 2003 on behalf of the Energy Efficiency Conservation Authority (EECA). The purpose was to provide a comprehensive report of the tourism sector’s energy use patterns and trends, and to also provide the raw data in a spreadsheet format. Data from an earlier study in 1999 were used, and new data were collected for the second reference year, 2001. EECA intends to use both sets of data to conduct further analyses to determine any change in overall consumption into three factors (volume, structure, technology) through the means of their ‘decomposition analysis’.
This study employs the World Tourism Organisation definition of tourism as ‘the activities of persons travelling to and staying in places outside their usual environment for not more than one consecutive year for leisure, business and other purposes’. In other words, tourism is consumer-defined, and energy consumed by tourists has to be summed up for everything a tourist does to arrive at a final estimate for energy use associated with the sector. While tourism comprises many industries, such as transport, accommodation, attractions, restaurants etc., this study focuses on transport and accommodation as the largest contributors to energy use (84% out of 27.5 PJ in 1997/98, Patterson & McDonald, draft).
2. Background
Tourism is an increasingly important part of New Zealand’s economy with a 4.9% contribution to GDP in 2000 (Statistics New Zealand, 2000). In New Zealand, both international and domestic tourists are important to the industry. While the domestic market is static, the international market is growing continuously and reached the 2 million visitors mark in 2002. The tourism industry was long believed to be a green industry, but it turned out that it is a comparatively resource-intensive sector of the economy (Patterson & McDonald 2002, draft report), in particular because of its high demand for energy.
Indeed, tourism contributes about 27.5 PJ or 6% of national energy consumption and greenhouse gas emissions (Becken 2002a; Patterson & McDonald 2002, draft report). Given forecasted growth rates of about 6% for international tourism and a static domestic market, there is potential that energy demand by tourism is growing and that there is a need for action to counteract this trend. Because energy costs are part of the running costs in tourism businesses (e.g. hotels), there is some interest on the part of the industry to reduce energy costs, or at least to increase energy efficiency. Energy efficiency means to reduce energy use for a ‘given energy service or level of activity. This reduction in the energy consumption is not necessarily associated to technical changes, since it can also result from a better organisation and management’ World Energy Council (no date).
Against the background of New Zealand’s ratification of the Kyoto Protocol and the National Energy Efficiency and Conservation Strategy (EECA 2001), the tourism industry will be challenged to make its contribution to achieve national goals postulated in these policies.
Landcare Research
9

3. Objectives
Becken (2002a) identified that transport and accommodation comprised the major areas of energy consumption by tourism; and as such are the focus of this study. The objective of this project is to identify trends in energy use and efficiency of the tourism sector for two reference years, 1999 and 2001 (Note: industry data refer to 2002, but for simplicity the second reference year is referred to as 20011). These objectives are:
Changes in energy efficiencies of vehicles and accommodation providers. Energy use efficiency patterns, trends and key drivers, including the relative shares of
electricity and other fuels used by the sector, and the end use activities (sub-sectors) to which this energy is put.
Changes in the relative importance of the domestic and international tourist mix and their respective energy use demands.
Structural changes within tourist types (e.g. modal shift, travel distances by transport mode, length of stay, accommodation usage).
Overall effect of growing tourist activity (total visitor volumes) on energy use demands A qualitative assessment of the potential for energy efficiency gains for different end-uses
and the strategic measures for capturing these gains. Benchmark the performance of the New Zealand tourist industry sector against individual
best practice energy use data and overseas data where this is available.
4. Methods
This study builds on earlier work (Becken 2002a) that integrated tourist analyses with industry analyses (e.g. transport, accommodation) to determine the overall energy use of New Zealand’s tourism sector and to identify the key drivers of this energy use. The methodology entails separate analysis of energy consumption by typical tourism sub-sectors (e.g. transport, accommodation) and tourist behaviour (e.g. length of stay, travel distance and typical transport and accommodation choices), before integration of both analyses into a final model. The final model enables the total energy consumed by tourism to be calculated and examines the influence of the combined effects of energy efficiency of different sub-sectors and tourist behaviour. The industry analyses, the tourist analyses based on the International Visitor Survey (IVS) and the Domestic Travel Survey (1999), and the final model are described in more detail below.
This study uses the scope provided by the World Tourism Organisation who defined tourism as comprising ‘the activities of persons travelling to and staying in places outside their usual environment for not more than one consecutive year for leisure, business and other purposes’ (www.world-tourism.org). This means that business travellers are included as long as they stay overnight outside their usual environment. In this sense, this analysis of energy use follows similar analysis of economic impact as undertaken in the Tourism Satellite Account 1 No tourist data for 2002 were available, hence 2001 was chosen as the second reference year due to the availability of databases for both domestic and international tourists for this year.
Landcare Research
10

by Statistics New Zealand. There all activity of tourists is reported in terms of expenditure, there are so-called tourism characteristic sectors (e.g. accommodation) and tourism non-characteristic sectors (e.g. retail, banks, insurances); both are included in the Satellite Account. In terms of energy use, previous research by Patterson and MacDonald (2003, draft) revealed that transport and accommodation: are the most significant contributors (84% of tourism’s energy use), for this reason, this study focuses on these two sub-sectors.
4.1 Industry Analyses
Accommodation sector Within the accommodation sector, businesses in the hotel and motor inn (black), motel (red) and budget accommodation (green) categories (as classified by the Automobile Association (AA), see also www.nzaa.co.nz) were the major energy users (comprising 67%, 16% and 6%, respectively, of the energy consumed by commercial tourist accommodation, Becken, Simmons & Frampton, 2001). As such, collecting updated information from these industries was the focus of the current study. The energy efficiencies and the fuel mixes for ‘camping grounds’ (25 MJ/visitor-night), ‘Bed & Breakfast’ (110 MJ/visitor-night) and ‘private homes’ (41 MJ/visitor-night) are taken from Becken et al. (2001) and Becken (2000a) for both reference years. These efficiencies were required in the final model.
The analysis of energy use by accommodation businesses for the reference year 1999 built on three separate surveys; the first survey was undertaken on the West Coast of the South Island (Johnson 1999, unpublished), the second survey was a subsequent nationwide survey (1999/2000), while EECA supplied a third set of data on ‘top class’ hotels in Christchurch and Queenstown, which EECA had collected in 1998. As such, the actual years surveyed for energy use included in the 1999 reference year are: 96/97 for the hotel data supplied by EECA, 98/99 for the West Coast data, and 99/00 for the national survey. For the West Coast and the national survey, a stratified random sample of accommodation businesses was surveyed. Businesses within all classifications used by the AA (2000) – black (hotel, motor inn), blue (hosted accommodation), red (motel) and green (budget accommodation) – were surveyed. The operators were first contacted either by telephone or by email and asked if they would participate in the survey. If the operator agreed, the survey (see Appendix A) was either mailed or faxed to the respondent; in some cases the researcher visited the business to collect the survey. The Hotel Survey undertaken by EECA involved visitation of ‘top class’ hotels in Christchurch and Queenstown by EECA staff. These businesses were grouped in the hotel (black) category.
The earlier study (Becken et al. 2001) on accommodation energy use revealed highly variable energy use within each category. It was concluded that an independent random sample of new businesses would absorb any differences in trend, simply because the individual business characteristics would dominate consumption patterns. For this reason, it was decided that the same businesses surveyed in the previous study were to be contacted for the current study.
For the analysis of energy use by accommodation businesses in the second reference year, all operators in the black (N = 29), red (N = 20) and green (N = 35) categories who participated in the 1999 study were initially contacted via phone and asked if they would participate in the current survey. During the initial phone call stage nine operators were excluded due to one of the following reasons: the current owners had only recently taken over the business, the business was no longer listed, or direct refusal. The original survey forms were updated and
Landcare Research
11
sent via post or email to those operators willing to participate in the study. Follow-up phone calls were made to ensure receipt of the surveys, to answer any queries, and to check progress. Due to the low participation rate (<50%) of operators previously surveyed, additional hotels in the Auckland and Wellington region were randomly selected primarily using the AA directory (2003). Information supplied by all operators covered either January – December 2002, or April 2002 – March 2003, with one exception. One operator could only supply information on energy use over the period April 2001- March 2002. For practical reasons, this information was all grouped into the 2001 reference year.
For both reference years, data on the annual consumption of electricity, fossil fuel and other solid fuel directly consumed in running the accommodation building (i.e. business vehicles are excluded) were collected. Additionally, information on the business (i.e. number of visitor-nights in the year corresponding to the energy figures, operating time period, capacity, size, and amenities) was also collected. Information on electricity, fossil and other solid fuel was requested in the most commonly used unit (e.g. kWh, litres) and expressed as energy content (MJ) using the conversion figures provided in Baines (1993)1, and by EECA (conversion of LPG in m3 to MJ only, (EECA 20032), this study only). In a few cases the cost of energy consumption only was provided. In these cases, an average cost per unit obtained from either the operator in question or from the Ministry for Economic Development’s Energy Data File (January 2003) was used to convert the supplied cost into units of consumption. The total annual energy consumption for each business was calculated by summing the energy consumed annually for each fuel type by that business. Energy consumption for each accommodation business was expressed on a per visitor-night basis to facilitate comparison. Where data were only provided for a portion of the year, these data were linearly extrapolated to estimate annual consumption. While this may over- or underestimate the actual energy used by a business due to the seasonal nature of tourism, this extrapolation will only affect the total amount of energy used and not energy consumption (MJ/ visitor-night) as visitor numbers were similarly scaled. Extrapolation was used to account for missing periods of data, as opposed to extrapolation of a business that only operated in summer or winter, to a full year. Furthermore, it was considered that the errors associated with such an extrapolation would be small due to the small number of businesses (four) for which data was extrapolated. Geometric means (logarithmic transformation so that means are not biased towards extreme values) were used to describe the average energy efficiency for each accommodation category.
The proportion of energy attributed to each fuel source was determined by first calculating the fuel mix (in percent) for each business, and second averaging the proportions for each fuel source. This proportion was used in the final model to determine the contribution of each fuel source to the total amount of energy consumed by tourism (see section 4.2).
Transport sectorTourists use a wide range of transport modes while in New Zealand; and the following modes of transport were considered relevant to obtain data on energy use:Road – Campervan, rental car, private car, hitchhiker, motorcycle, shuttle bus, coach (tour bus), scheduled coach, backpacker busRail – RailSea – Cook Strait ferries, other ferries, recreational boat (yacht)1 Energy provided in form of kWh was multiplied by a factor of 3.6 to arrive at MJ; this conversion does not take into account any losses associated with generation or transmission.2 EECA Hotel Benchmarking-beta.xls file. Provided by R. O’Brien, EECA.
Landcare Research
12
Air – Domestic air, helicopter (only in 1999)
For the 1999 reference year, data on the energy efficiency (expressed as MJ/passenger km) were either obtained directly from EECA (1999), derived from data contained in New Zealand Ministry of Transport (MoT) (1995, 1997, 1998) or was obtained from representatives in each transport category. Energy efficiency was derived by converting fuel consumption rates into energy use per vehicle kilometre (using factors from Baines 1993) and taking into account typical load factors. Further detail on the derivation of average energy efficiencies taking into account fuel consumption rates, fleet composition (e.g. diesel and petrol) and average load factors is described in Becken (2002b).
For the current study representatives from TranzRail, Tranzlink, Air New Zealand, and the remaining transport categories (except recreational boats and ferries other than Tranzlink) were contacted to update information collected previously. The Ministry of Transport were contacted to provide updated information of fuel consumption of private and rental cars (also required for the hitchhiking category) but were unable to provide the required information. For this reason, these energy efficiencies have not changed for the 2001 reference year. A list of the sources for data on energy use by the transport sector is provided in Appendix B (see also spreadsheet ‘transport’). Further information used to derive energy efficiency is provided in Appendix C.
4.2 Tourist data
OverviewWhen attempting to analyse tourists’ energy use, it is difficult to collect this information directly from tourists, and it is therefore necessary to convert easily reportable information (e.g. type of accommodation used) into new variables that can be translated into energy use by multiplying them with the respective energy efficiencies. These new variables are called travel choices, and the efficiency of a travel choice is measured as kilometres or number of nights. To obtain travel distances in kilometres, ‘travel sectors’ were defined, i.e. travel between two overnight stops. In the case of domestic tourists their place of residence (‘home’) is the starting point for the first travel sector, and home is also the finishing place for the last sector. The originally reported locations throughout New Zealand were condensed to 142 ‘representative locations’ for which a distance matrix was established (i.e. distance in km between A and B, etc.). In terms of transport and accommodation choices, the originally reported modes or categories had to be condensed into the categories for which information on energy use was available (e.g. a ‘school bus’ was recoded into ‘scheduled coach’, or a ‘private plane’ was recoded into ‘domestic air’; similarly, ‘maraes’, ‘convents’ or ‘army camps’ were coded as ‘private homes’). More information on the data manipulation can be found in Becken (2002a).
To reduce the large number of individual tourists to a manageable number of groups, cluster analysis was undertaken, one each for domestic and international tourists as described below.
Domestic touristsThe Domestic Travel Study (DTS)3 was first conducted in 1983 until 1989/90, and was taken up again in 1999. Since then it has been undertaken continuously, although the sample size dropped significantly from about 17,000 in 1999 to 12,000 in 2001. These sample sizes
3 The data were provided through the Spatial Analysis Facility at the University of Auckland.
Landcare Research
13
include respondents who undertook overnight trips (=tourists), day-trippers, and those who reported no trip at all. Because of resource constraints not every trip is recorded in full detail (i.e. the complete itinerary) in the DTS database, which means that the travel data for domestic tourists are slightly less accurate than those for international tourists. The sampling methodology can be found at the Tourism Research Council’s homepage (http://www.trcnz.govt.nz/).
The 1999 sample of domestic tourists in this analysis included 5455 tourists and 7737 overnight trips. The 2001 sample included 3587 tourists and 5105 overnight trips. Respondents who did not provide sufficient information on transport or accommodation were excluded.
Because domestic tourists often undertake weekend trips as opposed to the longer holidays as do international tourists, it was considered appropriate to a priori segment tourists into those who stayed one or two nights and those who stayed at least three nights. Each of these two subsamples of domestic tourists was cluster-analysed using a non-hierarchical cluster method (K-means). This method gives more weight to the actual magnitude of travel choice efficiencies (e.g. travel distance) and less weight to the combinations of travel choices (Hair et al. 1998). This method required specification of the cluster number by the researcher beforehand; for both points in time and both subsamples three clusters were used. The variables used in the cluster analysis and measured in km/day (transport mode) or nights/day (accommodation) were: domestic air, rental car, private car, company car, coach, camper van, scheduled bus, train, ferry, hitchhiking, motorcycle, hotel, motel, backpacker hostel, camping ground, Bed & Breakfast, and private home.
International touristsThe International Visitor Survey (IVS) has formed the basis for over a decade of reports on regional patterns of visitor behaviour and total expenditure in New Zealand. Information collected includes data on transport modes, accommodation used, and attractions/activities visited by tourists. The IVS is undertaken in the form of an exit survey at New Zealand’s main international airports, Auckland, Christchurch and Wellington with approximately 5500 visitors each year (see www.trcnz.govt.nz). In order to restructure the data into itineraries the data were extracted by the Spatial Analysis Facility at the University of Auckland (P. Forer) from the existing survey analysis package, reformatted into a commonly readable form, validated against known tables and then transformed into a structure suitable for allowing the query and mapping of flows.
As for domestic tourists, the itineraries had to be condensed into those locations in the distance matrix; and the originally reported transport modes and accommodation categories had to be condensed into the categories for which information on energy was available. Inaccuracies are inherent in the data, mainly as a result of false reporting on the part of the tourists (see Becken, 2002a). For example, tourists confused different modes of transport (e.g. Cook Strait ferry with a cruise ship) or obviously left out parts of their trip (i.e. the number of nights reported did not match the arrival and departure dates).
International tourists (n= 5505) were separated into ‘touring tourists’, and so-called ‘gateway-only tourists’, who are those who do not leave their city of arrival (Auckland, Wellington or Christchurch). As there is no information on transport behaviour of ‘gateway tourists’, although it is assumed they use transport while being at the gateway city, only ‘touring tourists’ were included in the cluster analysis. Gateway-only tourists were included in the
Landcare Research
14
final spreadsheet model, with an arbitrarily estimated minimum travel distance of 60 km by scheduled bus (return from and to the airport).
Again, the basis for the cluster analysis was tourists’ travel behaviour measured through their travel choice efficiencies (i.e. km/day and nights/day). A hierarchical cluster analysis with a correlational (Pearson) measure was used to segment tourists. This method identifies similar patterns rather than the actual magnitude of the scores (e.g. distance travelled); however, it is not suitable for large sample sizes (Hair et al. 1998), and the IVS samples of touring tourists were split into four subsamples using the ‘sampling quarter’ variable. The tourist types (coach tourist, visiting friends/ relatives tourist, auto, backpacker, camper and comfort traveller) resulting from each of the four subsamples segmentations were compared for their clustering process and the emerging clusters, and were then recombined to provide one final tourist-type solution. The variables used in cluster analyses were: domestic air, rental car, private car, campervan, scheduled bus, coach, backpacker bus, bicycle, ferry, train, hitchhiking, hotel, motel, B&B, backpacker hostel, camping ground and private home.
4.3 Model development
The tourist types derived in the cluster analyses of domestic and international tourists combine tourists with similar travel behaviour, while at the same time displaying a maximum inter-group difference, i.e. the diversity of individual travel behaviours can be condensed into the identified typical travel patterns. There are six domestic tourist types for each year of reference (three short-staying and three long-staying), and six international tourist types plus the ‘gateway-only tourist’. The information associated with each of these types was used to build a model that incorporated average travel behaviour of each tourist type and average energy efficiencies associated with different travel choices (see spreadsheet ‘final model’). To this end, the average travel distance for each transport mode and the average number of nights spent in each accommodation category were calculated (as arithmetic means) for each tourist type and multiplied by the energy efficiency determined from the industry analyses for the respective year (1999 or 2001). This procedure resulted in an average energy use in megajoules associated with each tourist type. These energy consumption values were extrapolated to the whole population of tourists. In the case of international tourists, the IVS databases provided weights for each individual tourist so that the nationalities are represented according to their mix in the arrival statistics by Statistics New Zealand. Having weights associated with each tourist in the database allowed an extrapolation from the sample to the tourist population within each tourist type, simply by summing up the weights for all tourists within one tourist type. Adding up the numbers of tourists within each type provides a figure for all international tourists in the respective year (note that the scope of the IVS includes tourists aged over 15 years, which differs from Statistics New Zealand’s arrival statistics, which include all arrivals). The DTS databases only contained quarterly weights (since itineraries are collected on a quarterly basis), and the proportion of a particular tourist type in the sample was extrapolated to the proportion of this type in the population. This was possible because the total number of trips (16.9 million in 1999 and 16.6 million in 2001, Tourism Research Council 2002) was known. Finally, the total energy used by tourism was determined by summing the energy use of all domestic and international tourist types.
Contributions to energy useThe spreadsheet model was also used to determine what travel choices (e.g. domestic air, private car, hotel etc.) contributed most to energy use. Energy use associated with each travel choice was summed up within each tourist type (e.g. average energy use of a specific type for
Landcare Research
15
a given travel choice, such as domestic air, multiplied by the total number of tourists of this type) and aggregated for all types each within international and domestic tourists (e.g. energy use for domestic air travel across all types), and in total. This procedure allowed determination of the relative share of the total energy use by each travel choice, including by the whole of the transport and accommodation sub-sectors. Additionally the contribution of each fuel source to the total energy use in the two reference years was determined by multiplying the energy use associated with each travel choice with the relative contribution of the fuel source for that travel choice. For transport, petroleum fuel (petrol and diesel) was the primary fuel source. Derivation of the relative contribution of different fuel sources in the accommodation sector is discussed in section 4.1.
5. Results
5.1 Industry analyses
AccommodationThis section provides information gained from the accommodation surveys and identifies energy efficiency trends and fuel mixes for operators in the hotel, motel and backpacker categories. The total energy used by these accommodation categories within New Zealand is estimated in section 5.2.
Response rate: For the 1999 reference year, 332 businesses were contacted to ultimately achieve a sample size of 120 (comprising all three subsamples). More information on the sample composition and the response rate for the 1999 reference year is detailed in Becken et al. (2001). In the current study, 89 operators were contacted and 9 operators were excluded at the initial phone call stage due to one of the following reasons: the current owners had only recently (<3 months) taken over the business, the businesses were no longer listed, or direct refusal (1 only). Of those operators that indicated they were willing to participate 53% (hotels and motels) and 75% (backpackers) returned surveys. The main reasons cited for not returning the surveys were being too busy, and difficulties in obtaining the required information.
Data quality: Despite efforts to obtain reliable data, the data supplied are of variable accuracy as it is dependent on what level of detail and what information was kept by operators. For example, some motel operators kept records for the Statistics New Zealand Accommodation Monitor and had reliable records of visitor-nights, while others provided estimates based on number of rooms occupied. Reliable estimates of electricity consumption were also surprisingly difficult to obtain in some cases as the operator had changed power companies and difficulties had been experienced in the billing process, which then failed to provide an accurate record of consumption. For some larger operators, the structure of their financial system prevented ready provision of the required data, and in some other cases only the cost of the associated energy consumption was recorded on a routine basis.
Energy use: Energy efficiency (MJ/visitor-night) in the hotel and, especially motel, accommodation categories decreased from the 1999 reference year, while a increase was observed for backpacker accommodation (Table 1). However, it should be noted that while energy efficiency decreased proportionately more for motel operators (20.0%), the actual
Landcare Research
16
decrease in energy efficiency was 8.1 MJ/visitor-night compared with 11.3 MJ/visitor-night for hotel operators (Table 1). The decreased energy efficiency was less marked for the hotel and motel categories when only operators surveyed in both years were included (Table 2). Decreased energy efficiency occurred in the backpacker category when only operators surveyed in both years were included (Table 2). However, this change is also likely to be within the errors associated with reporting.
Table 1 Energy efficiency (MJ/visitor-night) for the accommodation categories in the reference years1999 and 2001, all operators
Accommodation category
1999 (MJ/visitor-night) 2001 (MJ/visitor-night) % change from 1999
Hotels 134.0 145.3 8.4Motels 40.4 48.5 20.0Backpacker 38.8 36.7 -5.3
Table 2 Energy efficiency (MJ/visitor-night) for the accommodation categories in the reference years 1999 and 2001, only operators surveyed in both years
Accommodation category
1999 (MJ/visitor-night) 2001 (MJ/visitor-night) % change from 1999
Hotels 134.5 140.1 4.1Motels 38.4 44.3 13.9Backpacker 36.0 36.7 2.1
When all operators were included, the decrease in energy efficiency in the hotel category could largely be attributed to the influence of a single operator (‘3001’), despite the variability observed in the change of energy efficiency by individual operators (Table 3). If this operator is removed from the hotel category, the average energy efficiency for hotels drops to 136.8 MJ/visitor-night or an increase in energy use per visitor-night of 2.06% from 1999. For this operator energy consumption is driven by high consumption of both electricity and natural gas (Appendix D, spreadsheet ‘accommodation’). However, this operator also offers the greatest number of amenities including a business centre, three licensed restaurants and bars, swimming pool, spa, sauna and gym.
When only data from operators surveyed in both years were analysed, the outlying operator was removed from the hotel category resulting in a decreased energy efficiency of 4.1% compared with the 1999 reference year.
Landcare Research
17

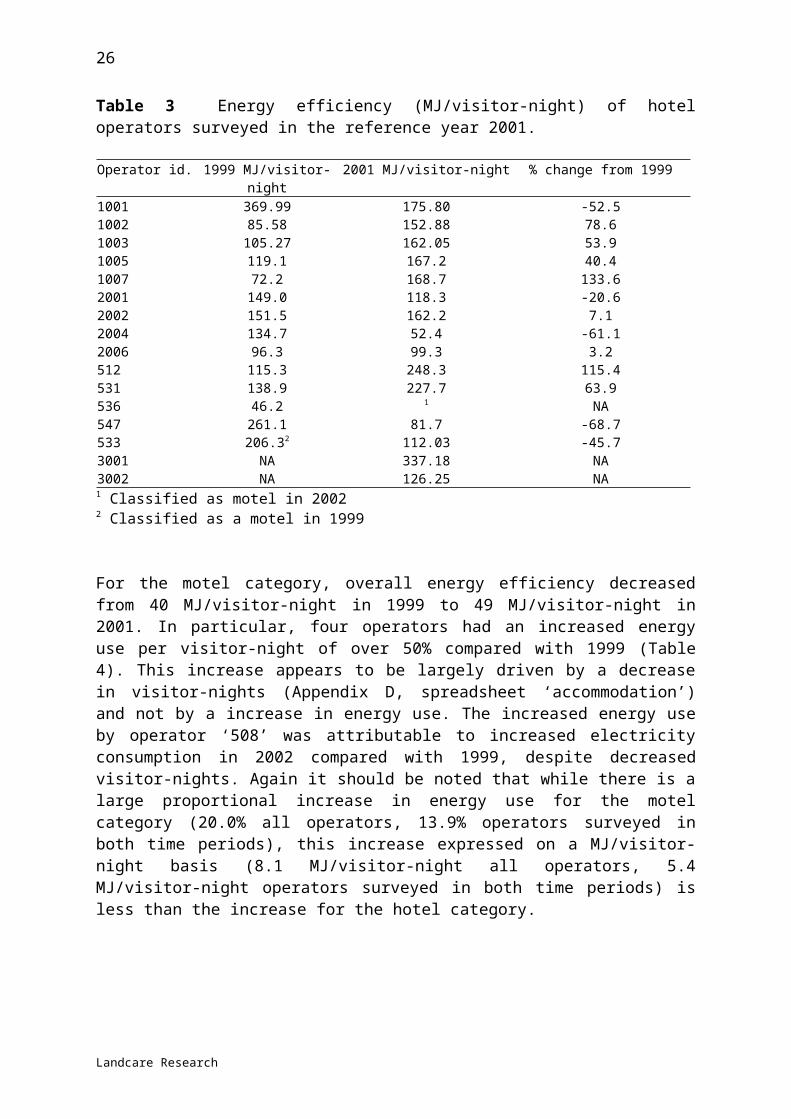
Table 3 Energy efficiency (MJ/visitor-night) of hotel operators surveyed in the reference year 2001.
Operator id. 1999 MJ/visitor-night 2001 MJ/visitor-night % change from 19991001 369.99 175.80 -52.51002 85.58 152.88 78.61003 105.27 162.05 53.91005 119.1 167.2 40.41007 72.2 168.7 133.62001 149.0 118.3 -20.62002 151.5 162.2 7.12004 134.7 52.4 -61.12006 96.3 99.3 3.2512 115.3 248.3 115.4531 138.9 227.7 63.9536 46.2 1 NA547 261.1 81.7 -68.7533 206.32 112.03 -45.73001 NA 337.18 NA3002 NA 126.25 NA1 Classified as motel in 20022 Classified as a motel in 1999
For the motel category, overall energy efficiency decreased from 40 MJ/visitor-night in 1999 to 49 MJ/visitor-night in 2001. In particular, four operators had an increased energy use per visitor-night of over 50% compared with 1999 (Table 4). This increase appears to be largely driven by a decrease in visitor-nights (Appendix D, spreadsheet ‘accommodation’) and not by a increase in energy use. The increased energy use by operator ‘508’ was attributable to increased electricity consumption in 2002 compared with 1999, despite decreased visitor-nights. Again it should be noted that while there is a large proportional increase in energy use for the motel category (20.0% all operators, 13.9% operators surveyed in both time periods), this increase expressed on a MJ/visitor-night basis (8.1 MJ/visitor-night all operators, 5.4 MJ/visitor-night operators surveyed in both time periods) is less than the increase for the hotel category.
Landcare Research
18
Table 4 Energy efficiency (MJ/visitor-night) of motel operators surveyed in the 2001 reference year
Operator id. 1999 MJ/visitor-night 2001 MJ/visitor-night % change from 1999106 33.82 26.57 -21.44108 51.38 51.11 -0.53123 30.33 36.40 20.01319 54.68 85.54 56.44508 32.48 70.17 116.05517 36.85 35.81 -2.82523 57.36 48.84 -14.85533 206.31 1
546 23.16 42.68 84.24552 43.95 29.46 -32.98536 46.22 110.56 138.991 Classified as hotel in 20022 Classified as a hotel in 1999
For the backpacker category, four operators had an increased energy use per visitor-night of over 100% compared with 1999 (Table 5). For these operators the change in energy efficiency appears to be driven by increased electricity usage, which is not offset by the slightly increased visitor numbers (Appendix D, spreadsheet ‘accommodation’). In contrast, a large increase in visitor numbers for another operator (‘204’) combined with a decrease in electricity usage resulted in a decrease in energy consumption in excess of 90% and is most likely explained by some kind of reporting error.
Finally, it should be noted that data from the 1999 reference year span a wider time period (due to the collation of data from three sources) than the 2001 reference year. Additionally two operators (533, 536; Tables 3, 4) were classified differently in the reference years 1999 and 2002. These factors may also influence the observed trends.
Landcare Research
19

Table 5 Energy efficiency (MJ/visitor-night) of backpacker operators surveyed in the 2001 reference year
Operator id. 1999 MJ/visitor-night
2001 MJ/visitor-night % change from 1999
506 43.72 47.71 9.1526 32.08 42.08 31.2200 194.71 133.11 -31.6201 22.62 19.33 -14.5202 7.73 30.56 295.4203 43.99 144.85 229.3204 44.83 3.85 -91.4205 54.96 17.02 -69.0206 53.43 1 NA207 81.62 72.70 -10.9209 31.66 142.81 351.0210 39.03 39.09 0.2211 49.19 54.32 10.4212 26.55 21.98 -17.2213 30.68 31.63 3.1214 36.95 19.81 -46.4216 32.23 36.00 11.7217 16.81 25.43 51.3218 26.03 58.70 125.5219 19.97 27.38 37.1220 59.03 101.43 71.8221 23.66 19.90 -15.9222 47.70 41.85 -12.3223 49.77 39.77 -20.1224 22.23 20.83 -6.3225 49.29 28.22 -42.81Unreliable estimates
Contribution of fuel sources to total energy consumptionElectricity is the primary contributor to the total energy consumption in all accommodation categories for both reference years (Tables 6 and 7). LPG is the next most common fuel type for all, while the other sources, natural gas, wood, diesel and coal, only play a minor role.
Table 6 Relative contribution of different fuel sources to total energy use by operators surveyed in the 1999 reference year
Fuel source Hotel [%] Motel [%] Backpacker [%]Electricity 74.4 94.8 76.3LPG 7.5 4.4 3.2Natural gas 0.0 0.0 5.1Wood 5.6 0.9 9.8Diesel 7.7 0.0 1.1Coal 4.8 0.0 4.5
Landcare Research
20

Table 7 Relative contribution of different fuel sources to total energy use by operators surveyed in the 2001 reference year
Fuel source Hotel [%] Motel [%] Backpacker [%]Electricity 70.6 97.8 90.1LPG 15.8 2.2 6.1Natural gas 8.1 0.0 0.4Wood 2.3 0.0 1.2Diesel 3.2 0.0 0.0Coal 0 0.0 2.1
Potential for energy savings exist in initially making operators aware of how their energy is being used and of cost-effective ways to reduce that energy use. This is especially relevant for motel operators for which the greatest difficulties were experienced in obtaining energy use data due to the lack of, or incomplete records. Awareness of energy use could be achieved through the promotion of consistent data reporting such as that already commenced by EECA with their auditing spreadsheet for hotels and by the Youth Hostel Association who records energy consumption of its member hostels. However, it should also be acknowledged that a number of operators (particularly hotels) already record energy consumption for their own use and are working towards reducing energy use. Energy consumption of an individual operator also depends on the number and type of facilities (e.g. spas, saunas, bars) offered, which in turn is driven by consumer demand. As such cost-effective energy saving measures need to be tailored to individual businesses and case studies of energy saving measures such as those provided by the Environmental Accommodation Providers of Auckland could be promoted as examples of ways different operators have already reduced energy use.
TransportThis section provides the energy efficiency trends for the different transport modes. Energy efficiency is measured as the amount of energy used per passenger-kilometre, hence this measure takes into account both fuel efficiency of the vehicle and average load factors. These data are used in section 5.2 to estimate the overall energy use by transport and the relative importance of different transport modes.
Data quality: The quality of data for transport modes typically used by tourists varies, with data on domestic air travel, the Cook Strait ferries and rail travel considered to be the most accurate and reliable. Bus operations and campervan travel were also considered to be reasonably reliable and accurate. The value for car transport constituted an average value dating back to the mid-1990s. However, the variation in fuel consumption for cars is considerable given different makes, years, driving conditions, etc., which is the reason why the Ministry of Transport were unwilling to update the average consumption figure provided in MoT (1995).
Energy use: The greatest improvements in energy efficiency were made for rail travel, coach tours, scheduled buses and domestic air travel (Table 8). In the case of coach and bus travel, the determining factor was increased occupancy of buses in the 2001 reference year compared with 1999. The energy efficiency for rail travel in 1999 has been taken from EECA (1999), while the data for 2001 reference year have been provided directly by TranzRail. Achievements in energy efficiency for air travel are due to a modernised fleet as well as
Landcare Research
21
higher load factors on domestic flights. This can be seen in the spreadsheet ‘transport’, where both energy use per available seat kilometre and energy per revenue kilometre decreased. The average occupancy of domestic aircraft increased from 60% in 1999 to 66% in the 2001 reference year. Camper vans appear less efficient in the current study compared with 1999, but both figures are based on estimates provided by companies, and the difference is probably within the margin of error.
Table 8 Transport energy efficiencies (MJ/pkm) for the reference years 1999 and 2001
Transport Category 1999 MJ/pkm 2001 MJ/pkm % change from 1999Other ferries 3.53 NA1 NADomestic Air 3.19 2.54 -20.38Cook Strait ferry 3.08 2.63 -14.611)
Camper van 2.06 2.39 16.02Recreational boat 1.75 1.75 Not updated2
Train 1.44 0.38 -73.61Private car 1.03 1.03 Not updatedHitchhiking 1.03 1.03 Not updatedCoach (tour bus) 1.01 0.32 -68.32Rental car 0.94 0.94 Not updatedScheduled coach 0.75 0.51 -32.00Motorcycle 0.87 0.87 Not updated2)
Shuttle bus, van 0.59 0.56 -5.08Backpacker bus 0.58 0.39 -32.761 Not applicable because new IVS/DTM data only use one category for Ferry, for which the energy efficiency of the Cook Strait Ferry is assumed 2. Boat and motorcycle were not updated, because their contribution to energy use is minorNote: Sources of data are provided in Appendix B (spreadsheet ‘transport’)
Tourist analysesDomestic tourists: The proportion of short-term domestic tourists increased from
61.2% in 1999 to 64.7% in 2001. The cluster analyses produced similar tourist types for each reference year, although ‘intensive car tourists’ were more dominant in 2001 at the expense of ‘air travel’ and ‘short trip car travel’ (Table 9). The proportion of people who travelled for more than two nights (long-term tourists) but used the car for only moderate distances (often this ‘moderate car tourist’ used other transport modes) decreased, while the proportion of the other long-term tourist types remained constant.
Table 9 Mix of tourist types for domestic tourists in the reference years 1999 and 2001
Tourist Types N (1999) % (1999) N (2001) % (2001)Short-term touristsAir (short) tourist 443 5.7 218 4.3Intensive car (short) tourist 672 8.7 976 19.1Short trip car tourist 3623 46.8 2111 41.4Long-term touristsLonger air traveller 276 3.6 188 3.7Moderate car tourist 1855 24.0 1052 20.6Car exclusive tourist 868 11.2 560 11.0
Landcare Research
22
Previous analysis had shown that domestic air travellers, and in particular short air travellers, often travel for business reasons, while the remaining tourist types are holiday travellers (Becken, 2002a). The length of stay is not normally distributed, but is positively skewed, i.e. there are outliers towards longer stays. The overall length of stay of all domestic tourists in this sample was 3.16 days in 1999 (median 2.0) compared with 2.911 days (median 2.0) in 2001 (Table 10). Short-term tourists stayed on average 1.47 days in 1999 and 1.44 days in 2001 (the median for both years is one night away); while long-term tourists had a holiday averaged 5.83 days (median 4.0) in 1999 compared with 5.61 days (median 3.0) in 2001. This means that the overall drop in length of stay is mainly attributed to shorter holidays by ‘long-term tourists’.
The distance travelled by all domestic tourists decreased from 623 km in 1999 (median 482 km) to 614 km (480 km median) in 2001. Short-term tourists (stay of one or two nights) travelled 496 km (median 390 km) in both 1999 and 2001, whereas long-term tourists travelled 825 km (median 666 km) in 1999 and 831 km (median 668 km) in 2001. Thus, the overall decrease in distance travelled is likely to be due to the shift from longer-term to short-term trips; however, given the inaccuracies inherent in the data the change is probably within the margin of error.
There were only slight changes in travel choices between 1999 and 2001. For example, the average distance travelled by rental car increased by 17% (Table 8) from 12 km in 1999 to 14 km in 2001, although the proportion of tourists who used rental cars remained the same (2%) (Appendix E). The decrease in air travel (the second most common transport mode among tourists) distance is explained by fewer tourists travelling by air (13.2% in 1999 and 12.8% in 2001). The figures shown in Table 8 should be treated with caution, especially for secondary transport modes, such as ferries or motorcycles, as there may be considerable reporting error associated with these data. Typical travel behaviour by tourist type is shown in detail in the spreadsheet model (Appendix F).
1 This is slightly shorter than the 3.0 days reported by the Tourism Research Council for 2001, because in this current study only nights that are specified for an accommodation category are counted.
Landcare Research
23
Table 10 Travel choices of domestic tourists for both reference years and all tourist types
Travel choice 1999 2001 Change [%]Average distance travelled per tourist (km)Domestic air 140 135 -3.6Rental car 12 14 16.7Private car 406 395 -2.7Coach 6 6 0.0Camper van 7 7 0.0Scheduled bus 11 13 18.2Train 6 5 -16.7Ferry 4 5 25.0Company car 25 28 12.0Hitchhiking - 1Motorcycle 3 1 -66.7Yacht 2 1 -50.0Taxi - 1TOTAL DISTANCE 623 614 -1.4Accommodation (average nights per tourist)Hotel 0.4 0.3 -25.0Motel 0.3 0.3 0.0Home 2.0 1.9 -5.0Backpacker hostel 0.1 0.1 0.0Campgrounds 0.4 0.3 -25.0B&B 0.1 0.1 0.0TOTAL STAY 3.16 2.91 -7.9Note: the figures presented in this table are calculated as an average across all tourists, including those that did not use a specific transport mode (distance = 0) or accommodation category (no nights).
International tourists: In the IVS sample of 1999, data were analysed for 5505 tourists, of which 1162 were gateway-only tourists (21.1%). Similarly in 2001, 5468 tourists, of which 1184 were gateway-only tourists (21.7%), were included in this analysis. The mix of tourist types resulting from the cluster analyses is shown in Table 11. The mix of tourist types was relatively stable over the two years, although both the proportion of tourists visiting friends/relatives (VFR) and gateway-only tourist increased with a corresponding decrease in other tourist types (Table 11).
Table 11 International tourist types in the reference years 1999 and 2001
Tourist Types N (1999) % (1999) N (2001) % (2001)Coach tourist 1545 28.0 1488 27.2Auto tourist 819 14.9 794 14.5Backpacker 494 9.0 478 8.7Camper 316 5.7 288 5.3Comfort traveller 157 2.8 145 2.7Visiting friends/ relatives (VFR)
1012 18.4 1091 20.0
Gateway only 1162 21.1 1184 21.7
Landcare Research
24

International tourists stayed longer in 2001 compared with 1999: the average calculated length of stay2 increased from 17.7 days (median 9.0) to 21.1 days (median 9.0). However, it has to be noted that this ‘calculated length of stay’ deviates considerably from the reported length of stay, particularly for 1999. The reported length of stay is based on what tourists reported when asked their length of stay in New Zealand; the average was 24.7 days in 1999 and 20.5 days in 2001. This indicates the range of error associated with self-reporting; tourists either overestimated their length of stay (possibly because of a psychological bias associated with a successful holiday) or they forgot to report several nights in their itinerary. If touring tourists were separated from gateway-only tourists, the average length of stay increased from 19.2 days (median 11.0) to 21.4 days (median 11.0).
The total distance travelled by an average international tourist remained relatively constant in 1999 (average 1515 km; median 1193 km) and 2001 (average 1504 km; median 1143 km), despite the potential sources of error associated with reporting and analysis. Considering touring tourists only, the distance travelled also remained constant (average 1904 km in 1999 and 1903 km in 2001), although, the distribution of distances travelled changed slightly over time. In 1999 the distribution was less skewed and the standard deviation was smaller, compared with 2001 where the median travel distance was 3.5% shorter (1720 km versus 1660 km), while the average remained the same. This indicates that tourists generally travelled less distance, but a few tourists travelled extremely long distances (Fig. 1).
Fig. 1 Distance travelled by international tourists in 2001.
The travel choices made by international tourists in the two reference years as measured by average travel distance and nights spent in different accommodation categories are shown in Table 12. For example, a decrease of 22.4% occurred in the distance travelled on backpacker buses, although the proportion of tourists using this mode of transport remained relatively stable (2.6% of all tourists used this mode in 1999, compared with 2.4% in 2001(see Appendix E). The distance travelled by bicycle and cruise ship also decreased. For the 2 Sum of all reported nights in specific categories of accommodation.
Landcare Research
Freq
uenc
y
25

bicycle, this decrease is explained by a reduction in the number of bicycle tourists of 50.0%. In contrast, the proportion of cruise ship tourists remained similar (0.5% of all tourists in 1999 and 2001), although the distances travelled were slightly shorter. Distance travelled by domestic air decreased by only 2.3%, although the proportion of tourists who used this mode at least once decreased by 7.5%. This means that tourists who did travel by air within New Zealand travelled further in 2001 compared with 1999. The proportion of coach tourists also decreased between 1999 and 2001 (26.1% and 24.7%, respectively), which together with a decrease in travel distance resulted in an overall decrease in travel distance by coach by 9.4% (Table 12). In 2001, tourists travelled slightly further by scheduled bus, although the proportion of about 40.4 % (40.3% in 2001) using this mode at least once remained constant. More tourists travelled by rental car in 2001 compared with 1999 (at approximate similar distances), which results in an overall increase in travel distance from 396 km in 1999 to 423 km in 2001. Further details are presented in Appendix F and the final model spreadsheet.
In summary, the most significant changes in travel behaviour that affect energy use are the less frequent use of domestic air and by coach, the shorter distance travelled by air and by coach (all resulting in a decrease of energy use). No major modal shift towards energy efficient public transport could be observed.
Table 12 Travel choices of international tourists for both reference years and all tourist types
Travel choice 1999 2001 % ChangeAverage distance travelled per tourist (km)
Domestic air 384 375 -2.3Rental car 396 423 6.8Private car 144 144 0.0Coach 308 279 -9.4Camper van 85 85 0.0Scheduled bus 79 87 10.1Train 26 25 -3.8Backpacker bus 58 45 -22.4Ferry 18 19 5.6Cruise ship 5 4 -20.0Hitchhiking 7 7 0.0Cycle 7 4 -42.9Motorcycle 1 2 100.0Yacht 1 1 0.0Taxi 1 2 100.0TOTAL DISTANCE 1515 1504 -0.7Accommodation (average nights per tourist)Hotel 3.3 3.3 0.0Motel 1.8 1.9 5.6Home 8.6 10.3 19.8Backpacker hostel 2.2 2.6 18.2Campgrounds 1.3 1.3 0.0B&B 0.6 0.7 16.7TOTAL STAY 17.7 20.1 13.6Note: the figures presented in this table are calculated as an average across all tourists, also those that did not use a transport mode or accommodation category.
Landcare Research
26
5.2 Integration of industry and tourist analyses
International visitor numbers (expressed as arrivals) increased by 18% from 1.44 million in 1999 to 1.69 million in 2001, while domestic volumes decreased slightly by about 2% (Table 11). The spreadsheet model provides information on total energy use by international and domestic tourists, the whole sector (and sub-sectors), and per average tourist. Energy use per tourist decreased both for international (3385 MJ in 1999 and 3082 MJ in 2001) and domestic (1053 MJ in 1999 and 950 MJ in 2001) tourists, mainly as a result of the increase in energy efficiency for domestic air travel and other transport modes, for example coach travel. The decrease in energy use per tourist is not attributed to a change in travel behaviour, as travel distances – the main driver in terms of behaviour - decreased only marginally (Tables 10 and 12). The predominance of domestic tourist volumes combined with the decrease in energy use per tourist results in a decrease in the overall energy consumption of the tourism sector from 22.6 PJ in 1999 to 21.0 PJ in 2001 (-7.5%), despite the growth in the number of international tourist trips (Table 13).
Table 13 Summary for energy use of the tourism sector (transport and accommodation sub-sectors) for both reference years
Tourists Trips 1999 Trips 2001 Change trips (%)
Energy use 1999 (PJ)
Energy use 2001 (PJ)
Change energy use (%)
International 1,437,552 1,694,537 17.88 4.87 5.22 7.33Domestic 16,889,000 16,557,000 -1.97 17.78 15.72 -11.56Total 18,326,552 18,251,537 -0.41 22.64 20.95 -7.46
The contribution of each travel choice to total energy use for domestic and international tourists, and for all tourists is shown in Table 14. For all tourists, domestic air was the key driver of energy use, although its contribution decreased slightly in 2001 (34.5%, or 7.2PJ) compared with 1999 (38.4% or 8.7PJ) due to the increase in energy efficiency. Private cars and domestic air travel account for a similar proportion of energy use for domestic tourists, while domestic air followed by rental cars are the most important contributors to energy use by international tourists. Generally, international tourists use a wider range of transport modes, which spreads energy use among a number of different transport modes, in contrast to domestic tourists in which transport is dominated by two modes. As such, a variety of targets for energy efficiency measures exist for the international market, whereas initiatives to reduce transport energy use of domestic tourists should focus on the private car and air travel. Two accommodation categories stand out as the most important contributors to energy use for both domestic and international tourists: private homes (9.6% of total energy use or 2.0PJ in 2001, 1.9 PJ in 1999) and hotels (6.9% or 1.5 PJ in 2001, 1.4 PJ in 1999). The other categories contribute only to a small degree, which indicates hotels should be the main target for energy efficiency initiatives within the commercial sector. Overall, the transport sector contributed 18.5 PJ (81.7%) in 1999, compared with 16.5 PJ (78.8%) in 2001, indicating the significance of this source to total energy use by tourism.
Landcare Research
27
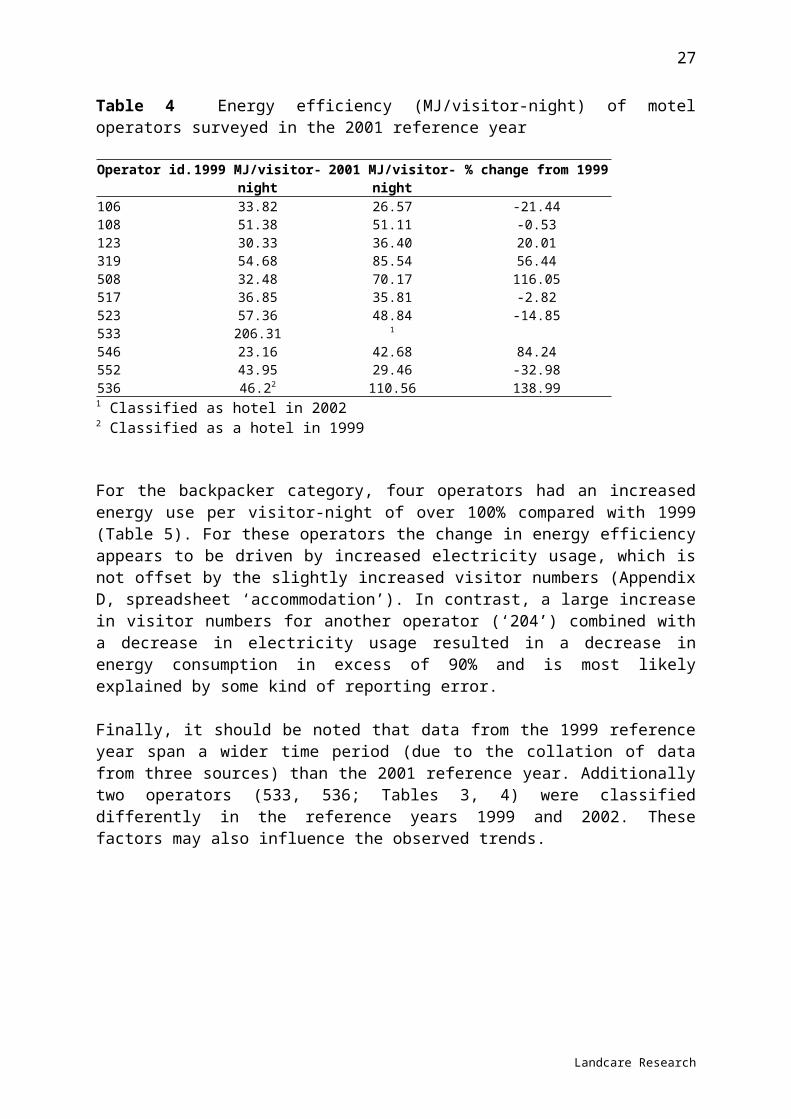
Table 14 Most important drivers of energy use (relative share [%] of 22.6 PJ in 1999 and 21.0 PJ in 2001)
Key drivers of energy use [%]
Domestic tourists 1999
Domestic tourists 2001
International tourists 1999
International tourists 2001
Overall share 1999
Overall share 2001
Domestic air 39.7 36.1 33.8 29.6 38.4 34.5Private car 36.3 39.2 4.0 4.4 29.3 30.5Coach 0.6 0.2 8.7 2.7 2.3 0.8Rental car 1.2 1.5 11.7 13.8 3.4 4.6Camper van 1.5 1.7 5.2 6.3 2.3 2.9“Home” 7.9 8.1 10.9 14.3 8.5 9.6Hotel 4.5 4.3 12.7 14.9 6.2 6.9Motel 1.3 1.7 2.1 3.0 1.4 2.0Backpacker 0.1 0.1 2.3 2.9 0.6 1.0
The most important fuel source is diesel and petrol, followed by aviation fuel and electricity (Table 15); the other sources only play a minor role. The importance of electricity increased slightly between 1999 and 2001.
Table 15 Fuel sources (relative share [%]) in 1999 and 2001
Key drivers of energy use [%]
Overall share 1999
Overall share 2001
Petrol/diesel fuel 43.8 44.7Aviation fuel 38.4 34.5Electricity 13.2 15.1LPG 1.0 1.7Wood 1.6 1.6Natural gas 0.8 1.5Coal 0.8 0.5Geothermal 0.4 0.4
6. Discussion
The objective of this study was to analyse any trend in energy use by tourists and the tourism sector that occurred between 1999 and 2001 resulting from changes in tourism activity (volume), structure (e.g. tourist type mix) and technology, when considering transport and accommodation as the major sources of energy demand. Due to the large volume of domestic tourists, the slight decrease (2%) in the number of domestic trips by New Zealanders (in combination with gains in efficiency) resulted in a larger decrease (11.6%) in the energy demand for domestic tourism from 17.8 PJ in 1999 to 15.7 PJ in 2001. In contrast, the growing international tourist volume (18% between the two reference years, and about 6% per annum forecast each year until 2008, although this growth was slowed down in 2003 as a result of external events such as SARS) led to a 7.3% increase in demand for energy by international tourists during the two-year study period. This also indicates that the increased volume of international tourists outweighs the efficiency gains (mainly in the transport sector, e.g. domestic air travel). Due to the influence of domestic tourism, overall energy use by
Landcare Research
28

tourist transport and accommodation decreased by 7.5% between 2001 and 1999. Of the total energy use transport contributed about 82% in 1999 and 79% in 2001. The main drivers of energy use are domestic air travel (34.5%), cars (private [30.5%] and rental [4.6%]), private homes (9.6%) and hotels (6.9%). The most significant modal change that could be observed was a decrease in air travel.
Energy use per average trip, for both domestic and international tourists, decreased slightly (international tourists: 3385 MJ in 1999 and 3082 MJ in 2001; domestic tourists: 1053 MJ in 1999 and 950 MJ in 2001) primarily as a result of improved energy efficiencies in the transport sector. In particular, domestic air became more energy efficient on a per passenger basis (3.19 MJ/pkm in 1999 and 2.54 MJ/pkm in 2002, Table 8). Furthermore, this result is considered reliable because of the consistent reporting by Air New Zealand for both reference years. Information on energy use by all other modes of transport was obtained from different sources for each reference year (e.g. train and buses), or was unable to be updated (cars) and may indicate that changes in energy use simply reflect different reporting. For the Cook Strait ferry, energy use per passenger is highly dependent on the passenger-to-freight ratio, which varies significantly, and makes improvements in efficiency difficult to detect. Energy use of rental and private cars by tourists requires considerably more investigation than was possible within the limits of this study. Principally, there are several competing trends that influence energy use associated with these transport modes. These includes the introduction of more modern and efficient cars (of particular importance for rental cars), the increasing number of diesel cars, the increasing proportion of cars with larger engines, the popularity of four-wheel drives, and the increasingly application of electronic equipment, such as air conditioning. At this stage, there is no information on energy use associated with cars specifically used by tourists, neither is there information whether specific types of tourists systematically use different types of cars (e.g. there is some anecdotal evidence that backpackers tend to buy older and smaller cars or rent them cheaply at companies such as ‘rent-a-dent’).
Energy efficiency associated with hotels and motels decreased slightly from 1999 to 2001 (134 MJ/visitor-night to 145 MJ/visitor-night, and 40.4 MJ/visitor-night to 48.5 MJ/visitor-night for hotels and motels respectively). In contrast energy efficiency increased overall for backpackers (from 38.6 MJ/visitor-night to 36.7 MJ/visitor-night in 1999 and 2001 respectively). In absolute numbers, hotels increased their energy use from 1.41 PJ in 1999 to 1.46 PJ in 2001, motels from 0.33PJ to 0.41 PJ and backpackers form 0.14 PJ to 0.17 PJ (final spreadsheet model). For hotels and motels this change is likely to be attributed to both increased stays and increase in energy efficiency for hotels and motels, for backpackers the increase in consumption is due to increased international tourists to backpackers. However, it is unclear as to how much of these trends are due to inconsistent or inaccurate reporting. More detailed time-series would be needed to trace improvements in energy efficiency for individual businesses, initially to primarily ensure consistent data collection. The results of the accommodation survey show that the calculated average energy efficiency for a visitor-night in a specific category depends on what businesses are included (outliers were shown to affect the final result dramatically); and it is possibly inappropriate to try defining one single estimate for energy use by category, given the very different nature of businesses even within one category1. For the final spreadsheet model, however, it is pragmatic to assume a representative energy efficiency for each category to allow calculation of energy use associated with tourist types.
1 The variation in consumption patterns would possibly be less in other tourist destinations where more uniform, resort-style accommodation businesses dominate.
Landcare Research
29

The method of segmenting tourists into types, as undertaken in the previous research (Becken 2002a), was validated in this current study, with similar types emerging in the second dataset compared with the first one. The most important trend for the domestic market is that domestic tourists undertake fewer trips in New Zealand2 for shorter periods of time, while travelling similar distances across all trips. For short trips (1 or 2 nights away), domestic tourists tended to travel more often with their private car and slightly less by domestic air in 2001 compared with 1999. Those who did travel by domestic air travelled further (1205 km in 2001 compared with 1095 km in 1999), while car travellers travelled shorter distances. Air travellers on longer trips travelled shorter distances in 2001 compared with 1999 (1301 km versus 1412 km).
International tourists stayed longer in New Zealand in 2001 than in 1999, although their travel distance remained remarkably constant. In other words, travel distance per tourist and per day decreased slightly. The mix of tourist types remained relatively constant, although the proportion of VFR tourists and gateway-only tourists increased. The analysis showed that all tourist types, except the camping tourist, travelled shorter distances on average, and as a result (in combination with efficiency gains in the transport sector) their individuated energy use decreased between 1999 and 2001. The camping tourists travelled 2881 km in 1999 compared with 2968 km in 2001, and in combination with a higher energy efficiency for camper van travel in 2001 the camping tourist consumed 8.5% more energy in 2001 compared with 1999. More research is needed to identify transport behaviour of ‘gateway-only’ travellers, who may comprise business and conference visitors, as well as visiting friends/relatives tourists, in order to ascertain energy use by these tourists.
7. Conclusions
Energy consumption by the tourism sector decreased from 22.6 PJ in 1999 to 21.0 PJ in 2001, or a decrease of 7.5% from 1999. The transport sector is the main contributor to this energy consumption, contributing 18.5 PJ (81.7%) and 16.5 PJ (78.8%) in 1999 and 2001 respectively. Comparatively, the accommodation sector consumed 4.2 PJ (18.3%) in 1999 and 4.4 PJ (21.2%) in 2001. Overall, the most important drivers are domestic air (34.5%), the private car (30.5%), and private homes (9.6%). The dominant fuel source is petroleum fuel in the form of diesel and petrol with a contribution of 43.7% to energy use in 1999, followed by aviation fuel (38.4%) and electricity (13.2%). The proportions were similar in 2001, where fuel made up 44.7%, aviation fuel 34.5% and electricity 15.1%.
Energy use associated with tourism appears to be mainly volume-driven, with domestic tourists as the primary driver. There were 2.0 % fewer domestic tourists in 2001 than in 1999, which corresponded to a decrease in energy use of domestic tourists from 17.8 PJ in 1999 to 15.7 PJ in 2001. In contrast there was an increase of 17.9 % in international tourist number, which corresponded to a smaller increase in energy consumption from 4.9 PJ in 1999 to 5.2 PJ in 2001. Technological and operational improvements of key transport modes (air travel in particular) also play an important role in reducing energy consumption.
2 This is only partly compensated for by an increased outbound market (0.5% between 2001 and 2002), Statistics New Zealand at www.stats.govt.nz)
Landcare Research
30
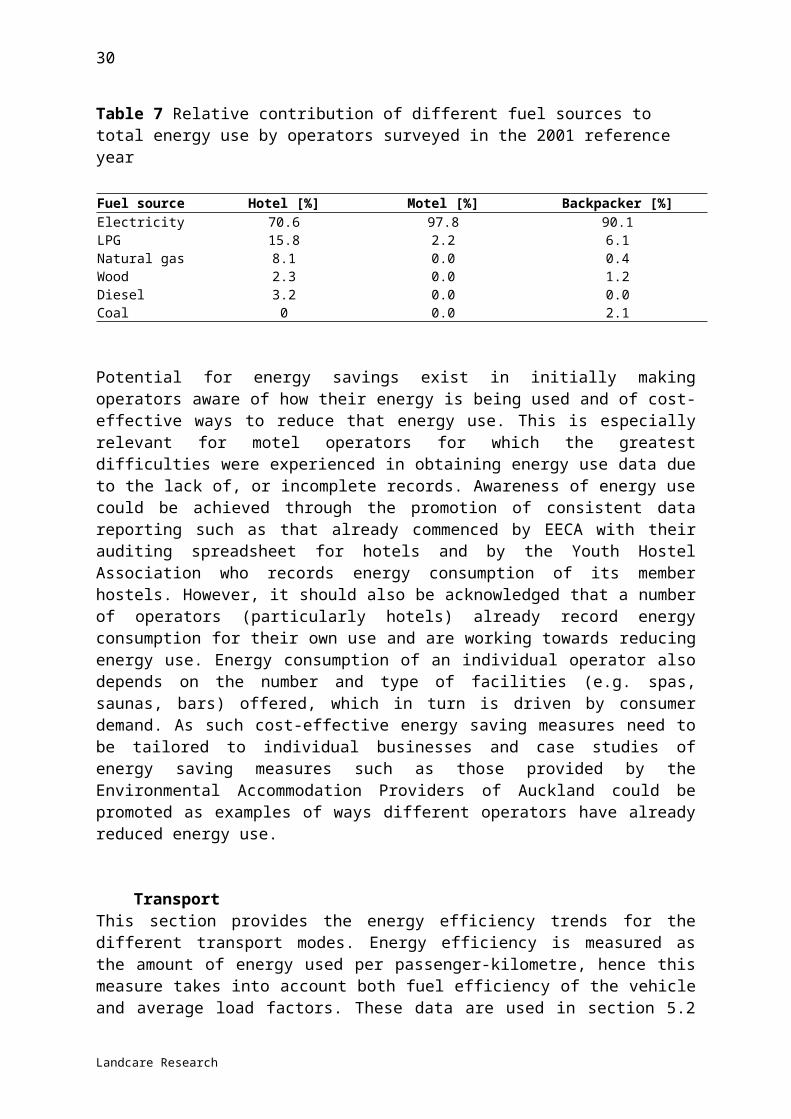
The main change in travel behaviour is that domestic tourists travelled for less time (3.2 days in 1999 and 2.9 days in 2001), although they travelled similar distances in 2001 (the average tourist travelled 623 km in 1999 and 614 km in 2001). In contrast, international tourists stayed longer in 2001 (21.1 days compared with 17.7 days in 1999). The distance travelled per tourist remained remarkably constant (about 1500 km) – a slight increase in distance travelled by camping tourists was offset by the shorter distances travelled by all other international tourist types in 2001 compared with 1999. The development of international tourist behaviour is desirable, because longer stays mean greater economic benefit, while the constant travel distance does not lead to an increase in energy use. An overall decrease of travel distance in the future would be beneficial to compensate for further growth. Tourists travelled less often by domestic air in 2001 compared with 1999 (3.8% less for domestic tourists and 7.5% less for international tourists), and shorter distances. Because air travel is an energy intensive transport mode (despite recent improvements), this trend leads to a decrease in energy use. The trend may reverse with Air New Zealand’s ‘Express Class’ and associated cheaper fares that may lead to increased volumes and possibly more flights.
In terms of energy efficiency, further improvements in the efficiency of air travel, as well as increases in the efficiency of private and rental cars would yield the greatest overall improvement in energy use. Given the difficulties experienced in obtaining data on average fuel consumption for private or rental cars, this study cannot provide information on trends that may have occurred between the 1999 and 2001 reference years. According to conversations with rental car companies, the fleets become younger (which implies more fuel efficient vehicles), but the proportion of cars with larger engines increases (which potentially leads to increased energy demand). Saving potentials exist by encouraging rental vehicle companies to include predominantly small and energy efficient cars in their fleet; as well as – in the long run – vehicles that run on alternative fuel sources. However, rental fleet composition will also be driven by consumer demand, which may conflict with energy saving strategies.
More accurate and reliable data across a range of accommodation businesses are required to better estimate the energy consumption associated with tourist accommodation. Such data could be collected by the introduction of compulsory monitoring of energy use (maybe in the form of triple bottom line reporting), similar to visitor statistics already collected by Statistics New Zealand in the form of the Commercial Accommodation Monitor. This is probably not realistic in the short run, but could be a long-term goal in the context of both the Tourism Strategy and the National Energy Efficiency and Conservation Strategy. EECA has initiated the collection of energy use data for hotels through the provision of a spreadsheet model that allows for easy recoding of energy use (EECA 2003). If hotels take up this form of reporting it will reduce the errors associated with inconsistent reporting and provide a more accurate reflection of energy use trends. Moreover, effects such as cold winters or power crises could be picked up when consistent reporting is in place. To enhance uptake of this form of reporting EECA could work with a small pilot group of businesses, and at the same time energy saving measures could be discussed and introduced into those hotels. The current study indicates that EECA’s focus on energy efficiency in hotels is warranted to effectively reduce energy use in the accommodation sector. Because of the large variation of energy use within hotels, EECA may consider the option of monitoring hotels of different star categories, as for example available through Qualmark.
Segmentation into tourist types allows EECA or other stakeholders to address tourists more specifically when attempting to induce shifts in behaviour. For example, international
Landcare Research
31
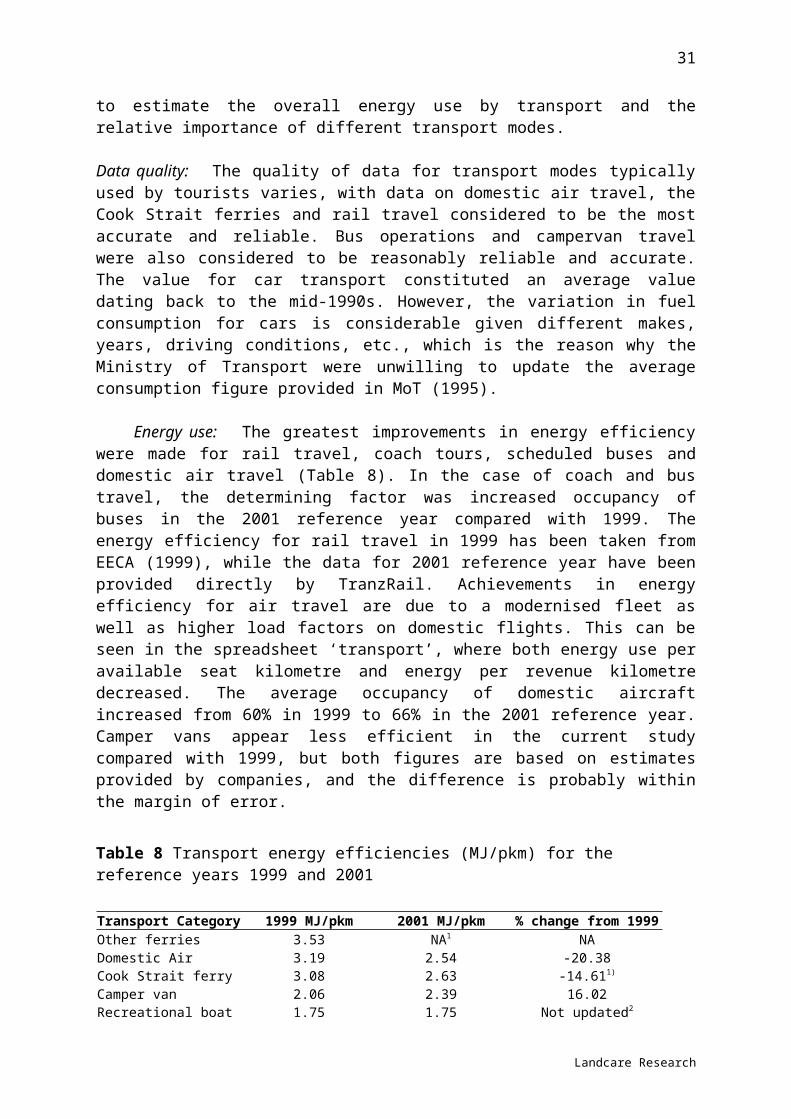
backpacker tourists could be encouraged to travel on public transport, while camping tourists could be motivated to travel less distance. In terms of domestic tourists, more research is required to study the trend of increasing numbers of short-term trips that cover relatively long individual travel distances. Research is currently being undertaken by Landcare Research on reducing the travel distance by international tourists, but it is too early to make any statements about saving potentials. No information on potentials to modify domestic tourists’ travel behaviour is available.
To date, very little research has focussed on energy use by tourism, therefore a comparison of New Zealand with other countries is not possible. A few studies have analysed energy use associated with different types of accommodation (e.g. CADDET 1997; Deng & Burnett 2000; Warnken & Bradley 2002). In terms of transport behaviour, however, to the knowledge of the authors there are only two researchers in France examining travel distance (and associated fuel use and emissions) associated with different transport modes. Only drafts for publications are available at this stage.
8. Recommendation
The potential amount of energy that can be saved is unable to be quantified within this study, although a number of opportunities exist.
Greatest energy saving potential exists by targeting the behaviour of domestic tourists, in particular that related to transport, primarily air travel and private cars. Strategies to reduce energy use associated with air travel by reducing the amount (distance, frequency) of air travel will conflict with the promotion of air travel, such as through the introduction of Air New Zealand’s ‘Express class’. As such, reduced energy use in this sector is more likely to result from technological change and improvements in operational efficiency. Strategies to reduce energy use associated with cars exist in promoting the sale of smaller fuel efficient models, encouraging regular car maintenance, promoting alternative means of transport e.g. coach travel. However, the difficulties associated with providing an accurate assessment of the energy use of cars by tourism, due to the large number of factors associated with efficiency e.g. model of car, year, driving conditions, should also be recognised.
Within the transport sector, domestic air travel and cars (private and rental) are the primary contributors to energy use, as such EECA should focus their attention on strategies to reduce energy use associated with these transport modes.
Within the accommodation sector, private homes and hotels are the primary contributors to energy use. Strategies already in place to reduce energy use in private homes will also impact on consumption in the tourist sector. For hotels, energy consumption will in part be driven by the facilities offered by the hotels, which in turn is driven by consumer demand. Additionally, the age and structure of buildings will influence energy demand. As such, energy saving measures need to be tailored toward individual operators. EECA could assist this by providing a service to identify opportunities for energy saving for a hotel, or assisting/promoting organisations such as the Environmental Accommodation Providers of Auckland (EAPA) and Target Zero, who provide a forum for energy saving measures to be promoted and experiences to be discussed (EAPA). Target Zero, an initiative of the Christchurch City Council, promotes resource efficiency and waste minimisation whilst maximising profits for businesses.
Landcare Research
32
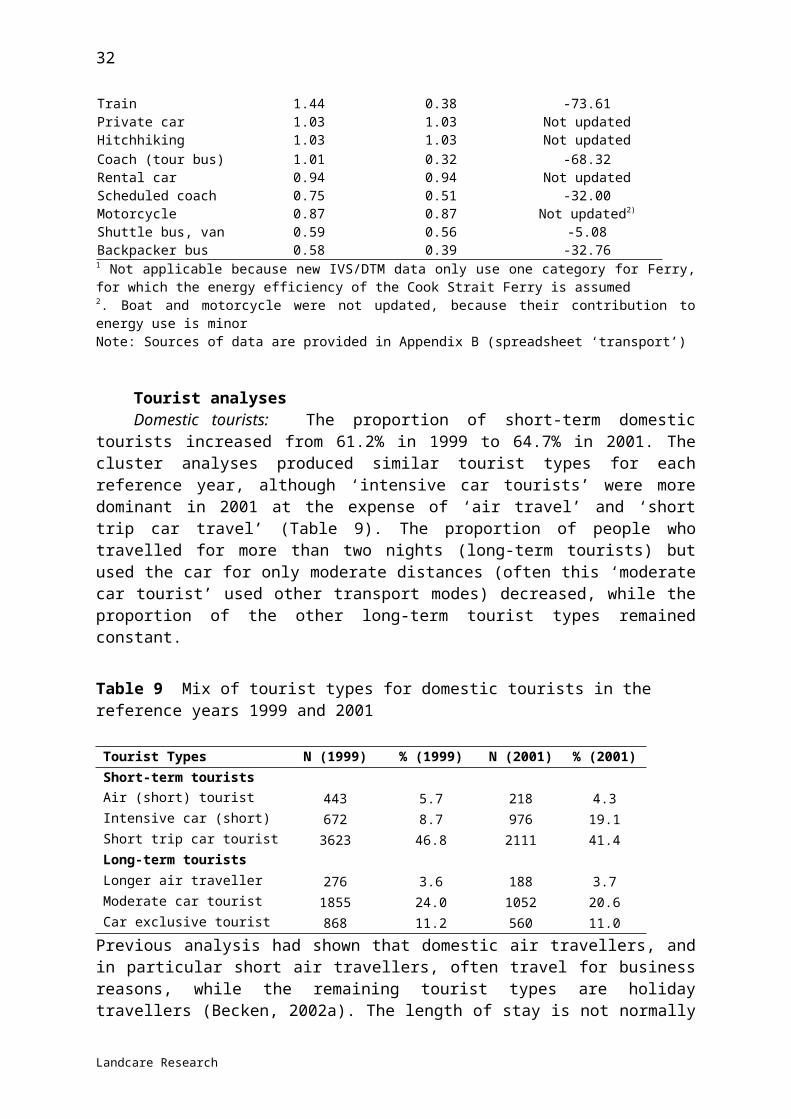
Consistent data collection is necessary to enable trends in energy use by tourism due to technological developments and behavioural changes to be accurately assessed. With regards to the accommodation industry, EECA could work with a small pilot group of businesses to enhance uptake of its monitoring form to provide consistent data collection for hotels, the primary energy users in the accommodation sector. Ultimately, it would be desirable if energy reporting was made compulsory for businesses.
Customer awareness is an important factor in improving the sustainability of tourism businesses. Little is known how aware tourists are of issues, such as energy consumption and greenhouse gases1, and it is recommended that consumer campaigns be initiated to increase the currently (probably) low level of knowledge among tourists.
This study should be repeated in about five year's time in order to take into account the influence of greater technological development and behavioural change on trends in energy consumption by tourism than the two years encompassed by this study. The methodology of analysing tourism industries and tourist behaviour in the form of tourist types as provided in this study is considered sufficiently robust to enhance the model in the future with new points in time.
Strategies to reduce the travel energy use for all tourist types are needed to reduce energy use by the tourist sector. For domestic tourists, passengers travelling short distance by air, which often includes business travellers, are the main target. For international tourists, coach tourists should be targeted, but also auto and camping tourists.
1 Becken, S. (forthcoming). The perception of climate change and forest carbon sinks by tourists and tourism experts. Submitted to Global Environmental Change.
Landcare Research
33
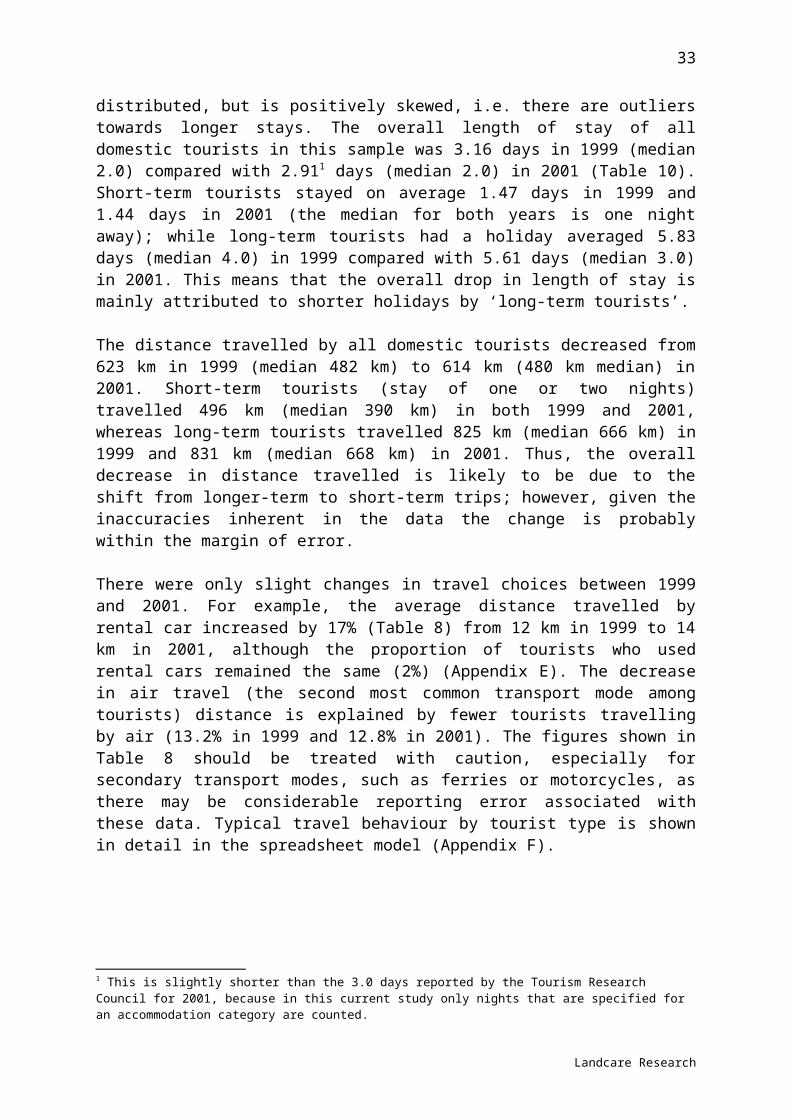
9. References
Baines, J.T. ed. 1993: New Zealand energy information handbook. Christchurch.
Becken, S. 2002a: Energy use in the New Zealand tourism sector. PhD thesis, Lincoln University, New Zealand.
Becken, S. 2002b: Tourism and transport in New Zealand – implications for energy use. TRREC Report No. 54. (http://www.lincoln.ac.nz/trrec/trrecpub.htm)
Beckens, S.; Frampton, C.; Simmons, D. 2001: Energy consumption patterns in the accommodation sector – the New Zealand case. Ecological Economics 39: 371–386.
CADDET (Centre for the Analysis and Dissemination of Demonstrated Energy Technologies) 1997: Saving energy with energy efficiency in hotels and motels. Maxi Brochure 07. The Netherlands, Sittard.
Deng, S.; Burnett, J. 2000: A study of energy performance of hotel buildings in Hong Kong. Energy and Buildings 31: 7–12.
EECA 1999: Energy-wise monitoring quarterly. New Zealand’s transport sector energy use: Highlights. Issue 14, December 1999. Wellington.
EECA 2000: Residential Sector Energy Use: Highlights. Energy wise monitoring quarterly. Issue 15, June 2000.
EECA 2001: National energy efficiency and conservation strategy. Wellington.
Hair, J.F.; Anderson, R.E.; Tatham, R.L.; Black, W.C. 1998: Multivariate data analysis. Fifth Edition. Upper Saddle River, NJ, USA, Prentice Hall.
Johnson, V. 1999: Tourism energy flows on the West Coast of the South Island, New Zealand. Unpublished report on data collection.
Lenzen, M. 1999: Total requirements of energy and greenhouse gases for Australian transport. Transportation Research Part D, 4D: 265–290.
Ministry of Transport 1995: Greenhouse gas emissions from New Zealand transport Wellington, MoT.
Ministry of Transport 1997: Carbon monoxide emissions from petrol vehicles. Vehicle fleet emissions control strategy – Stage 1. Wellington, MoT.
Ministry of Transport 1998: Local air quality management: impacts from the road transport sector. Vehicle fleet emissions control strategy – Final Report. Wellington, MoT.
Patterson, M.G.; McDonald, G. 2002: How green and clean is New Zealand tourism? Lifecycle and future environmental impacts. Draft 15 March 2002. Palmerston North, Massey University.
Statististic New Zealand 2000: Tourism Satellite Account. Available at: www.stats.govt.nz
Tourism Research Council 2002: New Zealand domestic travel survey 2001. Wellington.
Warnken, J.; Bradley, M. 2002: Energy auditing and estimating greenhouse gas emissions for Australia’s tourist accommodation sector. Research Report. Australia, CRC for Sustainable Tourism.
World Energy Council (no date). Available at http://www.worldenergy.org
Landcare Research
34

10. Appendices
10.1 Appendix A – Survey form
INFORMATION ON THE BUSINESSIdeally, the following information should cover the last financial year. However, if this is not convenient, please supply as much information as you can, stating the dates that the bills relate to.
Name of business_______________________________
Operating Time and Total number of visitor-nightsQ. Did the business operate for the whole financial year?
Yes No if no: what was your operating period?_______________________________
Q. What is the total capacity of the business? Number of beds/sites (a double bed counts as two beds):________________________Number of bedrooms: __________________________
Q. What was the total number of visitor-nights from 01 April 02 – 31 March 03? (Note: one visitor-night = one guest for one night. If you had two guests staying for three nights, you would have (2 x 3) = 6 visitor-nights). Please write the total below, and any necessary comments: Total number of visitor-nights02/03______________________________________________01/02 (if available)____________________________________________00/01 (if available)____________________________________________
Total business area and amenities of your propertyQ. What is the total business area (floor space) of your property? Please include all buildings used for accommodation, restaurants and maintenance etc. If there are two or more floors please include the total floor space for each level. Please use square metres:Total business floor area of buildings = ________________________________ m2
Q. Please tick the box for the following amenities that belong to the business: Restaurant Bar Lounge Swimming Pool Spa Sauna Laundry Other (please
specify) ____
ENERGY USED BY THE BUSINESS
Commercial use means use for business excluding private consumption.
ElectricityPlease refer to the electricity bills for the period 01 April 02 – 31 March 2003 for actual units consumed in kilowatt hours (kWh). Q. Total commercial units used in 02/03: ____________________________ kWh
01/02 (if available): __________________________ kWh00/01 (if available):___________________________ kWh
Landcare Research
35

(You could use this table to help calculate the total yearly consumption for electricity. You could also just copy the power bills and attach them to the survey)02/03 Apr May June July Aug Sep Oct Nov Dec Jan Feb Mar TotalUnits kWh01/02 Apr May June July Aug Sep Oct Nov Dec Jan Feb Mar TotalUnits kWh00/01 Apr May June July Aug Sep Oct Nov Dec Jan Feb Mar TotalUnits kWh
GasQ. Does the business use Natural Gas LPG any other (please specify)_________________Q. Total commercial units used in 02/03: _____________________________ kg
01/02 (if available): ___________________________ kg00/01 (if available): ___________________________ kg
WoodQ. Units of measurement (please specify m3, 3m3, cords or other): ____________________Q. Total commercial units used in 02/03: _____________ (m3, 3m3, cords etc)
01/02 (if available):_________________(m3, 3m3, cords etc)00/01 (if available):_________________(m3, 3m3, cords etc)
Fuel for generators and other machinery used in the businessThis includes fuel for generators and other machinery used directly for running the business. Please refer to business records, for the period 01 April 99 – 31 March 2000 for actual units consumed, measured in litres (l).Q. Diesel: Total commercial units used in 02/03: _____________________________L
01/02 (if available):____________________L00/01 (if available):____________________L
Q. Other fuel…………….: Total commercial units used in 02/03: _______________L01/02 (if available):____________________L00/01 (if available):____________________L
CoalPlease refer to business records, for the period 01 April 02 – 31 March 03 for actual units consumed, usually measured in kilograms (kg).Q. Total commercial units used in 02/03: ____________ ______ kg
01/02 (if available): ___________________________ kg00/01 (if available): ___________________________ kg
Other fuels and sources of energyQ. Does the business use other fuels and sources of energy not covered by this survey? If so, please record this with an estimate of how much the business used in the operating period.__________________________________________________________________________________
This is the end of the survey. Thank you very much for the time you have taken to
Landcare Research
36

complete this, we realize that it is a considerable task. Many thanks!
Landcare Research
37

10.2 Appendix B – Sources of transport data
Table B1 Data sources for transport data
Transport mode Source 1999 This study (“2001” second point-in-time)
Domestic Air Information provided by Robert Fletcher Air NZ, data for 1999 to 2003
Information provided by Robert Fletcher, Air NZ, data for 1999 to 2003
Cook Strait Ferry 2000, information provided by Ross Clark, Tranzrail
Information provided by David Shepherd, Tranzrail
Other Ferries Lenzen (1999) Not updated because new IVS/DTM data only use one category for Ferry, for which the energy efficiency of the Cook Strait Ferry was assumed
Camper van Information provided by Maui, Kea Campers, Kiwi Campers
Information provided by Maui, Kea Campers
Recreational boat Information provided by Jim O'Grady, boat retailer
Not updated
Train EECA (1999) Information provided by Ken James, Tranzrail
Private car Ministry of Transport, 1995/1998 plus data on load factors from West Coast survey 2000, see Becken (2002a)
Not updated
Hitchhiking (Ministry of Transport, 1995/1998 plus data on load factors from West Coast survey 2000, see Becken (2002a)
Not updated
Coach (tour bus) EECA, 1999 plus data on load factors from West Coast survey 2000, see Becken (2002a)
Clarks and Johnstons Coachlines
Rental car Ministry of Transport, 1995/1998 plus data on load factors from West Coast survey 2000, see Becken (2002a)
Not updated
Scheduled bus EECA (1999), see Becken (2002b) Intercity CoachlinesMotorcycle Information provided by New
Zealand motorbike rentalsNew Zealand motorbike rentals
Helicopter Information provided by Westpac Trust Helicopters
Not used
Shuttle bus, van Ministry of Transport, 1995/1998 plus data on load factors from West Coast survey 2000, see Becken (2002a)
Information provided by Super shuttle1
Backpacker bus (EECA, 1999 plus data on occupancy from West Coast survey 2000)
Information provided by Kiwi Experience, Magic Network
1Additional shuttle companies were contacted but did not provide the requested information
Landcare Research
38

10.3 Appendix C – Transport data
Table C1 Transport data, road transport
Coach company
Category Average occupancy
Avg fuel cons. [l/100 km
MJ/pkm Other comments
Intercity scheduled bus
30 40.00 0.51 Guesstimates, assumed 30 pax on 50-seater buses Volvo
Clarks Coachlines
tour operator
35 35.70 0.39 Refers to 48-seater bus
Clarks Coachlines
tour operator
29 12.85 0.17 Refers to 38-seater bus
Johnston's Coachlines
tour operator
35 36.50 0.40 Buses are 28 to 50 seaters, most in the fleet of 88 are 48-50 seaters
Kiwi Experience
backpacker bus Lease buses from Johnston's Coachlines
Magic travellers network
Back-packer bus
32 32.50 0.39 Reliable data based on logs; high-season loads are 42 and off-peak loads are smaller at about 20 pax, the 32 are an estimated avg loading
Super Shuttle shuttle 10 14.80 0.56 Capacity of vans is 11; the estimate for the fuel consumption refers to a new Mercedes van (probably less efficient for older vehicles)
Maui, Kea Campers
Camper van
2.2 12- 15 2.39 Estimates provided by Kea Campers and Maui
Table C2 Domestic air energy use
Air New Zealand data FY99 FY00 FY01 FY02 FY03*MJ/ask 1.92 1.865 1.750 1.705 1.593MJ/rpk 3.19 2.798 2.576 2.544 2.192Percent Reduction (% since FY99) -12.3% -19.2% -20.2% -31.3%ask = available seat kilometre; rpk = revenue passenger kilometre
Table C3 Train energy use
Train data Passengers 2002/3
Passengers per trip *
Distance (oneway)
Energy use per oneway trip [MJ]
Energy use per passenger kilometre [MJ/pkm]
Overlander 74,500 205 682 49117 0.35Northerner 51,300 141 682 49117 0.51Tranzcoastal 79,000 217 250 24765 0.46Tranzalpine 194,000 533 230 39986 0.33
Table C4 Cook Strait Ferry energy use
Cook Strait Ferries
MJ/passenger 1999 MJ/passenger 2001
Lynx 9.19 5.59Aratere 0.79 1.10Arahura 1.25 1.48
Landcare Research
39
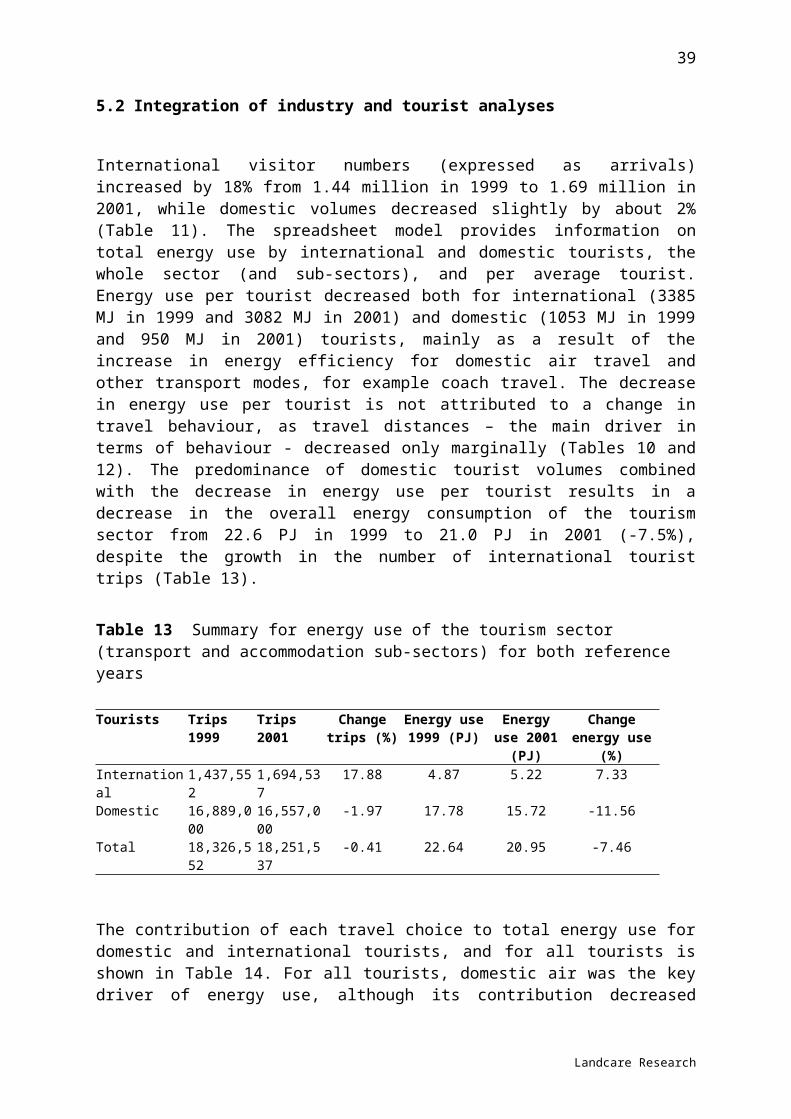
10.4 Appendix D – Energy consumption by accommodation sub-sector
Table D1 Energy consumption for hotel operators in the reference year 1999
Business IdReference yearVisitor-nights
Electricity (MJ)
LPG (MJ) Natural Gas (MJ)
Wood (MJ)
Diesel (MJ)
Coal (MJ) MJ/person
1001 96-97 41975 15230257.2 300000 0 0 0 0 369.991002 96-97 13936 1192636.8 0 0 0 0 0 85.581003 96-97 61448 6468865.2 0 0 0 0 0 105.271005 96-97 54185 35107.2 634350 0 0 151787 0 119.081007 96-97 48476 2725380 775000 0 0 0 0 72.212001 97-98 72069 9744728.4 993850 0 0 0 0 149.002002 97-98 47105 3516991.2 3620550 0 0 0 0 151.522004 97-98 28059 3779424 0 0 0 0 0 134.702006 97-98 60535 3645169.2 439850 0 0 45720 0 96.26512 98-99 35950 4010875.2 40000 0 77910 0 15060 115.27531 98-99 24943 3127618.8 336650 0 0 0 0 138.89536 98-99 6951 283320 38250 0 0 0 0 46.26547 98-99 9435 455630.4 0 0 0 0 2008000 261.1237 99-00 2190 557535.96 30850 0 0 0 0 268.6741 99-00 9040 275418 38250 0 0 0 0 34.70112 99-00 3960 593949.6 45000 0 93492 3810 0 185.92115 99-00 5100 215589.6 0 0 0 0 0 42.271004 96-97 51191 7179706.8 901000 0 0 0 0 157.851006 96-97 16097 2001866.4 1011250 0 0 1943100 0 307.901008 96-97 99276 25282479.6 4304050 0 0 0 0 298.022005 97-98 82815 5678035.2 117150 0 155820 7519035 0 162.652003 97-98 12100 2914704 0 0 0 0 0 240.882007 97-98 18760 3084847.2 0 0 0 0 0 164.44505 98-99 12320 1715040 18000 0 233730 0 0 159.64525 98-99 2640 215222.4 0 0 74793.6 0 12048 114.42
Landcare Research
40

535 98-99 3900 172141.2 0 0 0 0 0 44.14537 98-99 2840 130914 73850 0 299174.4 0 125500 221.63538 98-99 8500 - 360000 0 233730 0 0 NA549 98-99 2360 49636.8 7500 0 249312 0 125500 183.03NA –not applicable
Table D2 Energy consumption for hotel operators in the reference year 2002
Business IdReference yearVisitor-nights
Electricity (MJ)
LPG (MJ) Natural Gas (MJ)
Wood (MJ)
Diesel (MJ)
Coal (MJ) MJ/person Change Time 2 - Time 1 (MJ/person)
% change from 1999
1001 02-03 85880 14113897 984000 0 0 0 0 175.80 -194.19 -52.51002 02-03 82126 12311521 244000 0 0 0 0 152.88 67.30 78.61003 02-03 47315 6404630.4 1262700 0 0 0 0 162.05 56.77 53.91005 02-03 47974 4474302.3 8561394 0 0 0 0 167.21 48.13 40.41007 02-03 88071 13725680 1125000 0 0 7658.1 0 168.71 96.50 133.62001 02-03 106922 11197508 1454210 0 0 0 0 118.33 -30.68 -20.62002 02-03 69372 3384072 7871000 0 0 0 0 162.24 10.72 7.12004 02-03 33726 989287.2 622930 0 155820 0 0 52.42 -82.27 -61.12006 02-03 51629 4057200 0 0 116865 952500 0 99.30 3.04 3.2512 02-03 59021 6460174.8 355000 0 3428040 4411980 0 248.30 133.04 115.4531 02-03 16325 3435673 280800 0 0 0 0 227.66 88.77 63.9536 CHANGED STATUS, SEE MOTELS547 02-03 8268 675709.2 0 0 0 0 0 81.73 -179.39 -68.7533 02-03 14853 2392065 311800 0 0 0 0 112.03 -94.28 -45.73001 02-03 98292 16707402 0 16434449.2 0 0 0 337.18 NA3002 02-03 78019 2810216.7 0 7039628.85 0 0 0 126.25 NANA- not applicable
Landcare Research
41

Table D3 Energy consumption for backpacker operators in the reference year 1999
Business IdReference yearVisitor-nights
Electricity (MJ)
LPG (MJ) Natural Gas (MJ)
Wood (MJ)
Diesel (MJ)
Coal (MJ) MJ/person
506 98-99 27740 558792 439400 0 199449.6 0 15060 43.72526 98-99 3250 104254.8 0 0 0 0 0 32.08200 98-99 3091 382676.4 0 0 68560.8 0 150600 194.71201 98-99 46593 1032861.6 21200 0 0 0 0 22.62202 98-99 34506 250383.6 16300 0 0 0 0 7.73203 98-99 12996 571651.2 0 0 0 0 0 43.99204 98-99 15309 432878.4 0 0 102841.2 0 150600 44.83205 98-99 7495 242928 0 0 68560.8 0 100400 54.96206 98-99 4665 209840.4 0 39400 0 0 0 53.43207 98-99 3458 186732 0 0 95495.4 0 0 81.62209 98-99 8311 263163.6 0 0 0 0 0 31.66210 98-99 6120 187416 0 0 51420.6 0 0 39.03211 98-99 14319 601484.4 0 0 102841.2 0 0 49.19212 98-99 9650 197474.4 0 58706 0 0 0 26.55213 98-99 20597 631854 0 0 0 0 0 30.68214 98-99 4134 152748.5143 0 0 0 0 0 36.95216 98-99 4959 136443.6 0 0 23373 0 0 32.23217 98-99 35265 592783.2 0 0 0 0 0 16.81218 98-99 14238 327384 43250 0 0 0 0 26.03219 98-99 8754 174855.6 0 0 0 0 0 19.97220 98-99 9123 369532.8 0 0 68560.8 0 100400 59.03221 98-99 949 22456.8 0 0 0 0 0 23.66222 98-99 5978 182293.2 0 0 102841.2 0 0 47.70223 98-99 8365 313516.8 0 0 102841.2 0 0 49.77224 98-99 38359 852552 0 0 0 0 0 22.23225 98-99 3490 120600 0 0 51420.6 0 0 49.2924 99-00 2014 77824.8 0 0 0 0 0 38.64
Landcare Research
42
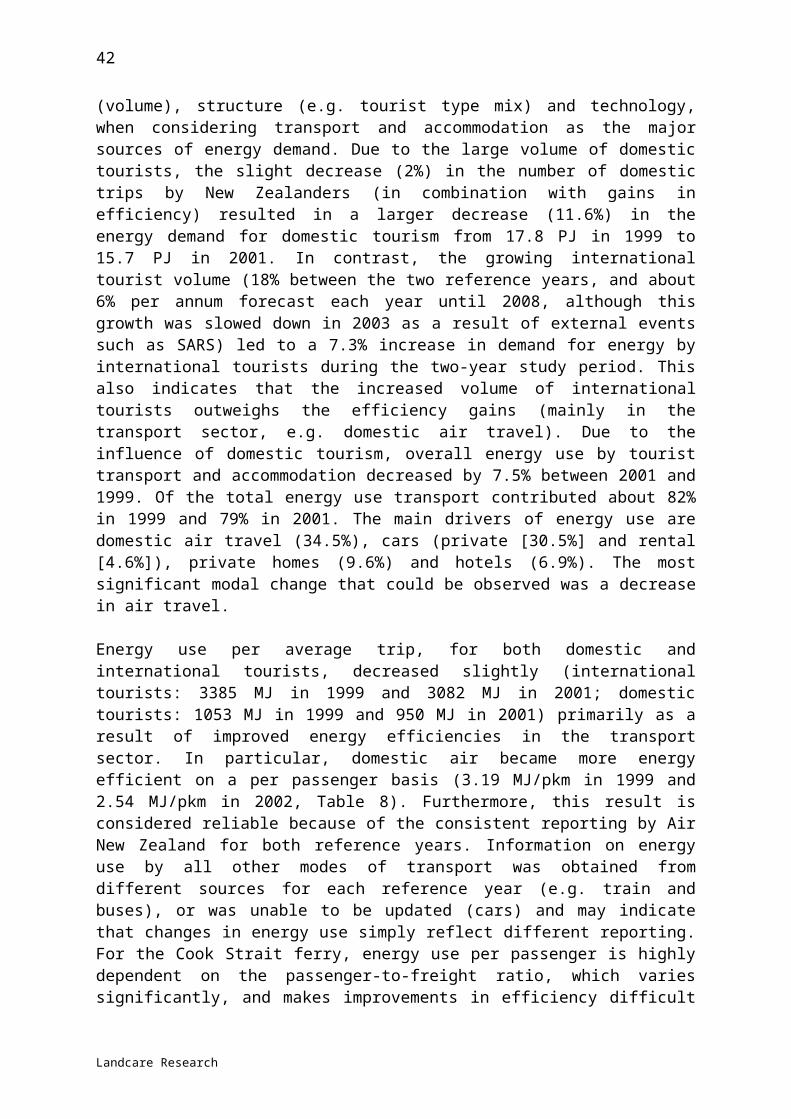
44 99-00 935 11102.4 0 0 15582 19050 0 54.2860 99-00 1139 21459.6 0 32859.6 0 0 0 47.69208 98-99 3078 190108.8 0 0 51420.6 0 0 78.47215 98-99 1675 99381.6 0 0 68560.8 0 15060 160.20321 99-00 8940 133812 0 78800 7791 0 0 24.65322 99-00 12775 145249.2 0 109532 0 0 0 19.94510 98-99 6328 126651.6 246750 0 77910 0 50200 79.25539 98-99 3750 61711.2 5000 0 0 0 0 19.80
Table D4 Energy consumption for backpacker operators in the reference year 2002
Business IdReference yearVisitor-nights
Electricity (MJ)
LPG (MJ) Natural Gas (MJ)
Wood (MJ)
Diesel (MJ)
Coal (MJ) MJ/person Change Time 2 - Time 1 (MJ/person)
% change from 1999
506 02-03 19729 377550 513350 0 34592.04 762 15060 47.71 4.00 9.1526 02-03 694 126545.28 0 0 0 0 0 42.08 10.00 31.2200 02-03 4359 279010.8 0 0 0 0 301200 133.11 -61.60 -31.6201 02-03 47917 926460 0 0 0 0 0 19.33 -3.29 -14.5202 02-03 49397 1482430 27000 0 0 0 0 30.56 22.83 295.4203 02-03 18209 2637640.8 0 0 0 0 0 144.85 100.87 229.3204 02-03 27793 107053.2 0 0 0 0 0 3.85 -40.98 -91.4205 02-03 9533 145152 0 0 17140.2 0 0 17.02 -37.93 -69.0206 02-03 6571.5 - 978285 0 0 0 0 - NA NA207 02-03 872 126792 0 0 0 0 0 72.70 -8.91 -10.9209 02-03 9967 1417741.2 5670 0 0 0 0 142.81 111.15 351.0210 02-03 8508 332586 0 0 0 0 0 39.09 0.07 0.2211 02-03 17902 852368.4 0 0 119981.4 0 0 54.32 5.13 10.4212 02-03 12560 245419.2 0 30653.2 0 0 0 21.98 -4.57 -17.2213 02-03 22601 707616 7200 0 0 0 0 31.63 0.95 3.1214 02-03 2978 59004 0 0 0 0 0 19.81 -17.14 -46.4
Landcare Research
43

216 02-03 5812 202939.2 6300 0 0 0 0 36.00 3.77 11.7217 02-03 48950 1245032.6 0 0 0 0 0 25.43 8.63 51.3218 02-03 14039 824158.8 0 0 0 0 0 58.70 32.67 125.5219 02-03 8168 223660.8 0 0 0 0 0 27.38 7.41 37.1220 02-03 18577 149173.2 1735030 0 0 0 0 101.43 42.40 71.8221 02-03 1524 30330 0 0 0 0 0 19.90 -3.76 -15.9222 02-03 8022 320151.6 0 0 15582 0 0 41.85 -5.85 -12.3223 02-03 10293 409384.8 0 0 0 0 0 39.77 -10.00 -20.1224 02-03 81776 1703131.2 0 0 0 0 0 20.83 -1.40 -6.3225 02-03 5104 144032.4 0 0 0 0 0 28.22 -21.07 -42.7
Table D5 Energy consumption for motel operators in the reference year 1999
Business IdReference yearVisitor-nights
Electricity (MJ)
LPG (MJ) Natural Gas (MJ)
Wood (MJ)
Diesel (MJ)
Coal (MJ) MJ/person
106 99-00 3766 127360.8 0 0 0 0 0 33.82108 99-00 7106 365130 0 0 0 0 0 51.38123 99-00 3060 92808 0 0 0 0 0 30.33319 99-00 10950 598752 0 0 0 0 0 54.68508 99-00 4568 148356 0 0 0 0 0 32.48517 98-99 957 35265.6 0 0 0 0 0 36.85523 98-99 1180 67680 0 0 0 0 0 57.36533 98-99 12757 2631888 0 0 0 0 0 206.31546 98-99 5634 129600 900 0 0 0 0 23.16552 98-99 2815 123732 0 0 0 0 0 43.9511 99-00 15330 812520 0 0 0 0 0 53.0017 99-00 3960 51894 0 0 0 0 0 13.10105 99-00 18888 847584 0 0 0 0 0 44.87116 99-00 4631 120028 0 0 0 0 0 25.92311 99-00 4930 162504 0 0 0 0 0 32.96
Landcare Research
44
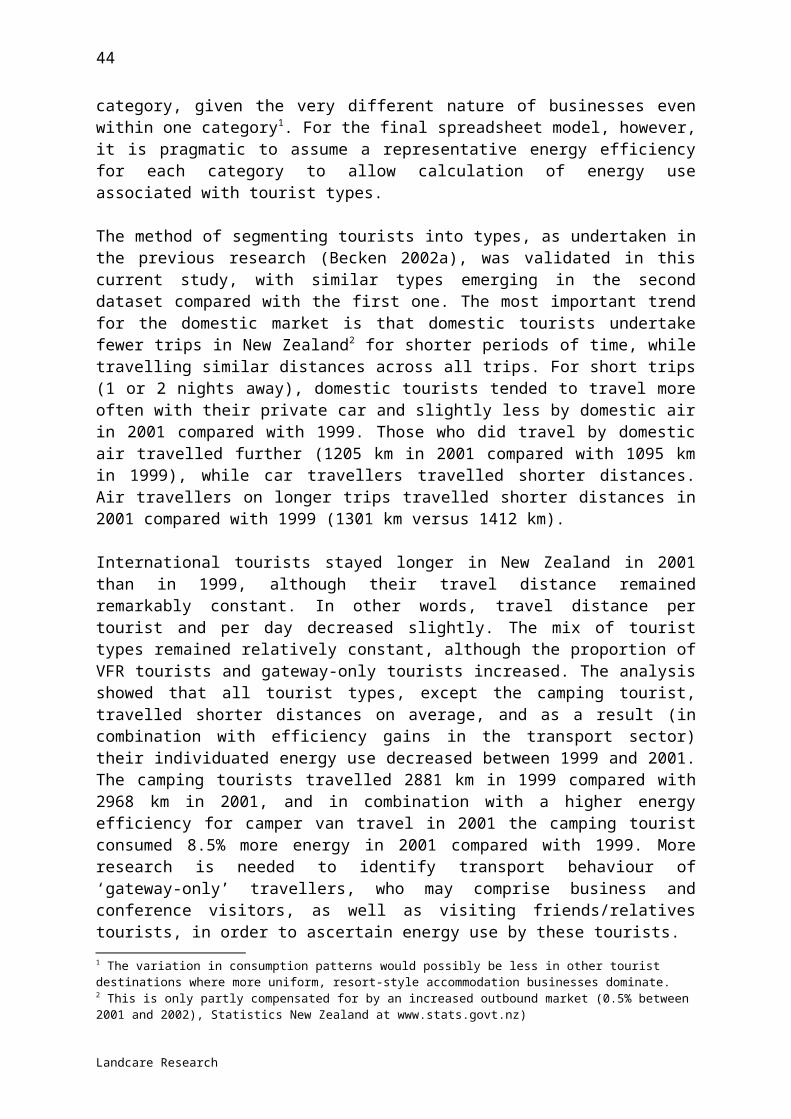
323 99-00 8760 264960 0 0 0 0 0 30.25503 98-99 1386.7 391997 19933.3 0 86428.16 0 0 359.39504 99-00 9427.2 72969 58500 0 0 0 0 13.95513 98-99 10688 388188 234000 0 0 0 0 58.21542 98-99 4720 65261 0 0 0 0 0 13.83
Table D6 Energy consumption for motel operators in the reference year 2002
Business IdReference yearVisitor-nights
Electricity (MJ)
LPG (MJ) Natural Gas (MJ)
Wood (MJ)
Diesel (MJ)
Coal (MJ) MJ/person Change Time 2 - Time 1 (MJ/person)
% change from 1999
106 02-03 6142 163180.8 0 0 0 0 0 26.57 -7.25 -21.4108 02-03 7071 361400.4 0 0 0 0 0 51.11 -0.27 -0.5123 02-03 3579 130269.6 0 0 0 0 0 36.40 6.07 20.0319 02-03 6531 558680.4 0 0 0 0 0 85.54 30.86 56.4508 02-03 2800 196466.4 0 0 0 0 0 70.17 37.69 116.0517 02-03 1199 42937.2 0 0 0 0 0 35.81 -1.04 -2.8523 02-03 4300 180000 30000 0 0 0 0 48.84 -8.52 -14.9533 CHANGED STATUS, SEE HOTELS546 02-03 5473 233568 0 0 0 0 0 42.68 19.51 84.2552 02-03 3561 104900.4 0 0 0 0 0 29.46 6.30 14.3536 02-03 3018 306673.2 27000 0 0 0 0 110.56 64.30 139.0NA- not applicable
Landcare Research
45

48
10.5 Appendix E – Tourist behaviour
Table E1 Information on proportion of tourist who used a specific transport mode or accommodation category at least once.
Domestic tourists 1999 [%]
Domestic tourists 2001 [%]
International tourists 1999 [%]
International tourists 2001 [%]
Domestic air 13.3 12.8 37.4 34.6Rental car 2.0 2.0 24.5 26.1Private car 76.6 77.6 14.2 14.2Coach 0.9 1.0 26.1 24.7Camper van 1.0 0.7 3.5 3.5Scheduled bus 2.3 2.6 40.41 40.3Train 0.9 0.9 5.2 4.7Ferry 2.9 3.4 15.4 16.8Backpacker bus 0 0 2.6 2.4Hitchhiking NA 0.1 0.8 0.5Motorcycle 0.5 0.3 0.1 0.1Yacht 0.7 0.6 0.3 0.3Taxi NA 0.3 0.4 0.5Helicopter NA NA 0.1 0.1Cruise ship NA NA 0.5 0.5Company car 4.6 5.0 NA NABicycle NA NA 0.4 0.2
Hotel 17.0 16.8 55.2 54.0Motel 13.2 13.6 23.5 22.7Home 63.6 62.0 36.4 36.6Backpacker hostel
2.1 2.2 12.5 14.1
Campgrounds 10.1 9.2 9.5 9.2B&B 2.1 1.8 8.4 7.41) Note that gateway-only tourists were allocated 60 km by scheduled bus each.
Landcare Research

10.6 Appendix F – Tourist types
Table F1 Model of domestic tourists (1999), average travel behaviour by typesDomestic tourists 1999
Air (short) tourist
Intensive car (short) tourist
Short trip car tourist
Longer air traveller
Moderate car tourist
Car exclusive tourist
Number of tourists 967,144 1,464,907 7,909,623 602,555 4,049,780 1,894,991
Transport in kmDomestic air 1095 1 15 1412 77 8Rental car 6 0 8 17 5 55Private car 9 838 270 35 372 1032Coach 0 0 4 0 16 0Camper van 0 1 5 0 21 0Scheduled bus 1 0 8 4 31 0Train 0 0 4 0 17 1Ferry 0 4 2 0 8 10Company car 2 0 32 4 39 1Hitchhiking 0 0 0 0 0 0Motorcycle 0 0 4 0 7 0Yacht 0 0 2 0 4 0Taxi 0 0 0 0 0 0Accommodation in nightsHotel 0.8 0.2 0.2 1.2 0.4 0.5Motel 0.1 0.2 0.2 0.5 0.5 0.7Home 0.5 0.7 1.0 2.4 4.6 2.5Backpacker hostel 0.0 0.0 0.0 0.1 0.1 0.1Camp-grounds 0.0 0.1 0.1 0.1 1.0 0.5B&B 0.0 0.0 0.0 0.1 0.1 0.1ENERGY USE (MJ) 3160 871 459 4858 1088 1310
Landcare Research
47
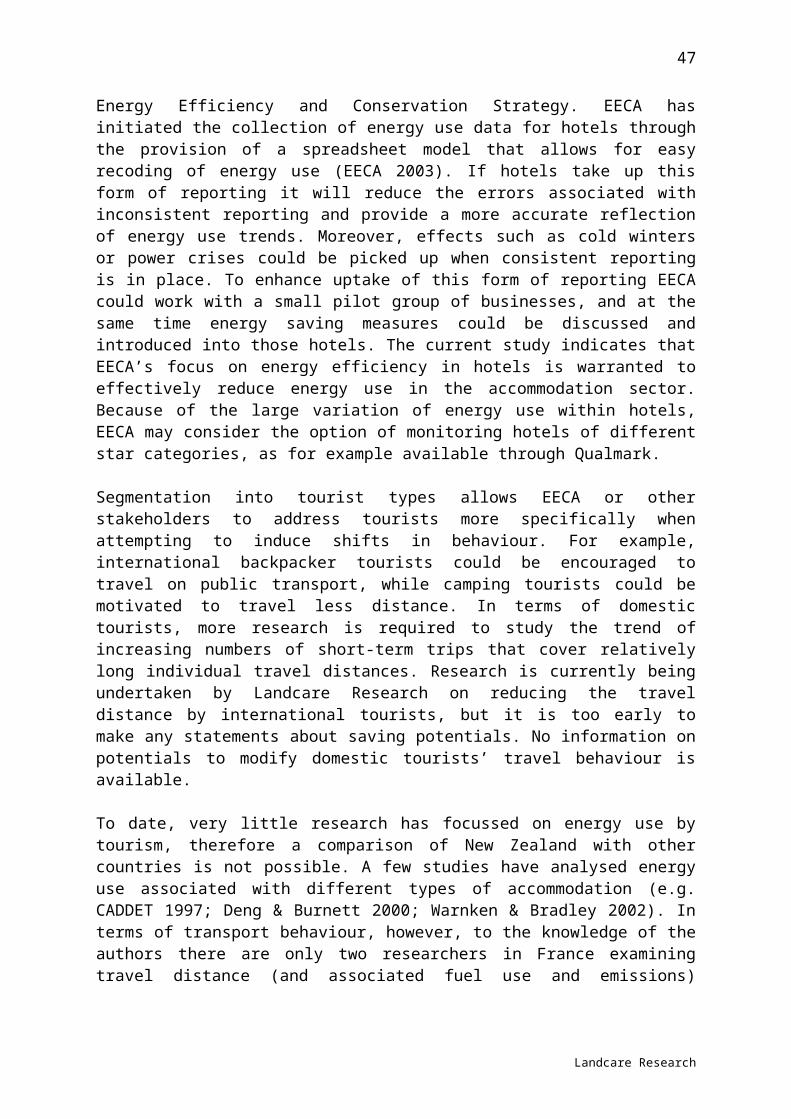
48
Table F2 Model of domestic tourists (2001), average travel behaviour by typesDomestic tourists 2001
Air (short) tourist
Intensive car (short) tourist
Short trip car tourist
Longer air traveller
Moderate car tourist
Car exclusive tourist
Number of tourists 707,037 3,165,452 6,846,587 609,739 3,411,9421,816,243
Transport in kmDomestic air 1205 3 45 1301 73 12Rental car 4 2 13 11 36 3Private car 11 643 211 34 369 984Coach 0 2 9 3 11 0Camper van 0 0 3 0 27 0Scheduled bus 6 0 10 18 37 1Train 0 1 4 14 14 1Ferry 2 2 2 1 13 14Company car 5 1 46 45 27 0Hitchhiking 0 0 0 0 3 0Motorcycle 0 0 2 0 2 0Yacht 0 0 1 0 5 0Taxi 1 0 1 0 0 0Accommodation in nightsHotel 0.7 0.2 0.2 1.0 0.3 0.3Motel 0.2 0.2 0.2 0.4 0.5 0.6Home 0.4 0.7 0.9 2.5 4.8 2.5Backpacker hostel
0.0 0.0 0.0 0.1 0.1 0.1
Campgrounds 0.0 0.1 0.1 0.0 1.0 0.4B&B 0.0 0.0 0.0 0.1 0.2 0.0TOTAL ENERGY (MJ)
3217 692 476 3694 1053 1185
Landcare Research

Table F3 Model of international tourists (1999), average travel behaviour by typesInternational tourists 1999
Coach tourist
VFR Auto tourist
Backpacker
Camper Comfort
Number of tourists 377,900 272,949 208,318 117,995 82,217 36,263Transport in kmDomestic air 789 368 293 311 243 360Rental car 84 200 1497 592 756 584Private car 11 571 26 236 158 68Coach 767 64 198 449 74 269Camper van 1 4 2 2 1441 39Scheduled bus 31 50 19 440 73 60Train 26 22 26 66 19 129Ferry 9 14 36 47 50 16Backpacker bus 0 11 1 532 16 8Hitchhiking 0 0 0 38 41 29Motorcycle 0 2 6 0 0 0Yacht 0 0 0 2 4 5Taxi 2 0 1 2 6 0Helicopter 0 1 0 1 0 0Cruise ship 12 1 12 0 0 0Accommodation in nightsHotel 7.4 0.9 3.0 1.3 0.7 3.1Motel 0.2 1.4 8.6 0.7 0.7 1.1Home 0.2 31.8 1.5 3.2 2.1 1.5Backpacker hostel 0.1 0.8 0.2 19.9 1.8 0.8Campgrounds 0.0 0.4 0.1 1.1 19.2 0.9B&B 0.1 0.2 1.1 0.2 0.1 9.5TOTAL ENERGY (MJ) 4546 3500 3854 4386 5815 4109
Landcare Research
49

48
Table F4 Model of international tourists (2001), average travel behaviour by typesInternational tourists 2001
Coach tourist
VFR Auto tourist
Backpacker
Camper Soft comfort
Number of tourists429,159 343,577 247,972 131,419 84,195 42,966Transport in kmDomestic air 755 436 281 241 186 431Rental car 153 180 1483 748 856 743Private car 8 529 25 298 104 61Coach 756 53 173 310 68 264Camper van 0 6 5 4 1579 35Scheduled bus 25 77 22 491 62 120Train 35 17 10 40 20 215Ferry 10 11 32 63 64 35Backpacker bus 1 16 1 471 11 8Hitchhiking 0 3 0 59 15 0Motorcycle 0 0 11 0 1 25Yacht 0 0 2 2 0 7Taxi 3 2 1 1 2 4Helicopter 0 0 0 1 0 9Cruise ship 12 1 4 1 0 0Accommodation in nightsHotel 7.5 1.0 2.4 1.3 0.7 3.3Motel 0.2 1.2 9.1 0.4 0.9 1.2Home 0.2 35.7 1.4 2.1 2.5 2.5Backpacker hostel 0.2 1.2 0.2 23.3 1.6 2.2Campgrounds 0.1 0.6 0.2 1.2 20.4 0.3B&B 0.0 0.1 1.1 0.1 0.1 17.3TOTAL ENERGY (MJ) 3538 3649 3440 3657 6306 5035
Landcare Research