Chapter 10 Correlation and Regression. SCATTER DIAGRAMS AND LINEAR CORRELATION.

4.1 Scatter Diagrams and Linear Correlation with work
1
Oct 168:27 AM
4.1 Scatter Diagrams and Linear CorrelationEssential Questions:How does correlation help me analyze the relationship I am comparing?
Focus Points:• Make a scatter diagram.• Visually estimate the location of the "bestfitting" line for a scatter diagram.
• Use sample data to compute the sample correlation coefficient, r.
• Investigate the meaning of the correlation coefficient, r.
Oct 168:33 AM
A scatter diagram is a graph in which data pairs (x, y) are plotted as individual points on a grid with horizontal axis x and vertical axis y. We call x the explanatory variables and y the response variable.
Oct 168:35 AM
NO SLOPE!!
Correlation
or association.
Draw the "bestfitting" line.
Describe the correlation (moderate linear, perfectly linear, etc) and association (positive, negative, none).
Oct 168:40 AM
WHAT DOES A SCATTER PLOT TELL US?A scatter diagram shows the relationship between two paired variables x and y. For each pair (x, y) of the data set, we plot the point on a grid with horizontal axis x and vertical axis y. • To the extent the data points on the graph fall closer to a straight line, we can say that the relationship between x and y is more linear.
• To the extent the data pairs are scattered over the graph, we can say no linear relationship between x and y is apparent.
Oct 168:46 AM Oct 168:58 AM
The sample correlation coefficient, r, is a numerical measurement that assesses the strength of a linear relationship between two variables x and y. 1. r is a unitless measurement between 1 and 1. In symbols,
1 < r < 1. If r = 1, there is a perfect positive linear correlation. If r = 1, there is perfect negative linear correlation. If r = 0, there is no linear correlation. The closer r is to 1 or 1, the better a line describes the relationship between the two variables x and y.
2. Positive values of r imply as x is increasing, y tends to increase. Negative values of r imply that as x increases, y tends to decrease.
3. r will not change if variables are converted to different units.

4.1 Scatter Diagrams and Linear Correlation with work
2
Oct 169:09 AM
Finding "r"
degrees of freedom "df" = n 1
Oct 169:17 AM
p. 149
Oct 169:18 AM
Example 1: Sand DunesSand driven by wind creates large, beautiful dunes at the Great Sand Dunes National Monument, Colorado. Of course, the same natural forces also create large dunes in the Great Sahara Desert and Saudi Arabia. Is there a linear correlation between wind velocity and sand drift rate? Let x be a random variable representing wind velocity (in 10 cm/sec) and let y be a random variable representing drift rate of sand (in 100 gm/cm/sec). A test site at the Great Sand Dunes National Monument gave the following information about x and y. Graph a scatter diagram, determine r and describe what r tells you about the relationship between the variables.
x 70 115 105 82 93 125 88y 3 45 21 7 16 62 12
Oct 169:31 AM
What does the correlation coefficient, r, is a sample statistic from a data set of ordered pairs (x, y). It is a measurement indicating the strength of a linear relationship between x and y. • r is a unitless measurement from 1 to 1.• r close to 1 means positive linear relationship increasing from left to right.
• r close to 1 means negative linear relationship decreasing from left to right.
• r close to 0 means no linear relationship between the variables.
Oct 169:34 AM
p is used for population correlation coefficient
Oct 169:35 AM
REMINDER!!!
4.1 Scatter Diagrams and Linear Correlation with work
3
Oct 169:36 AM
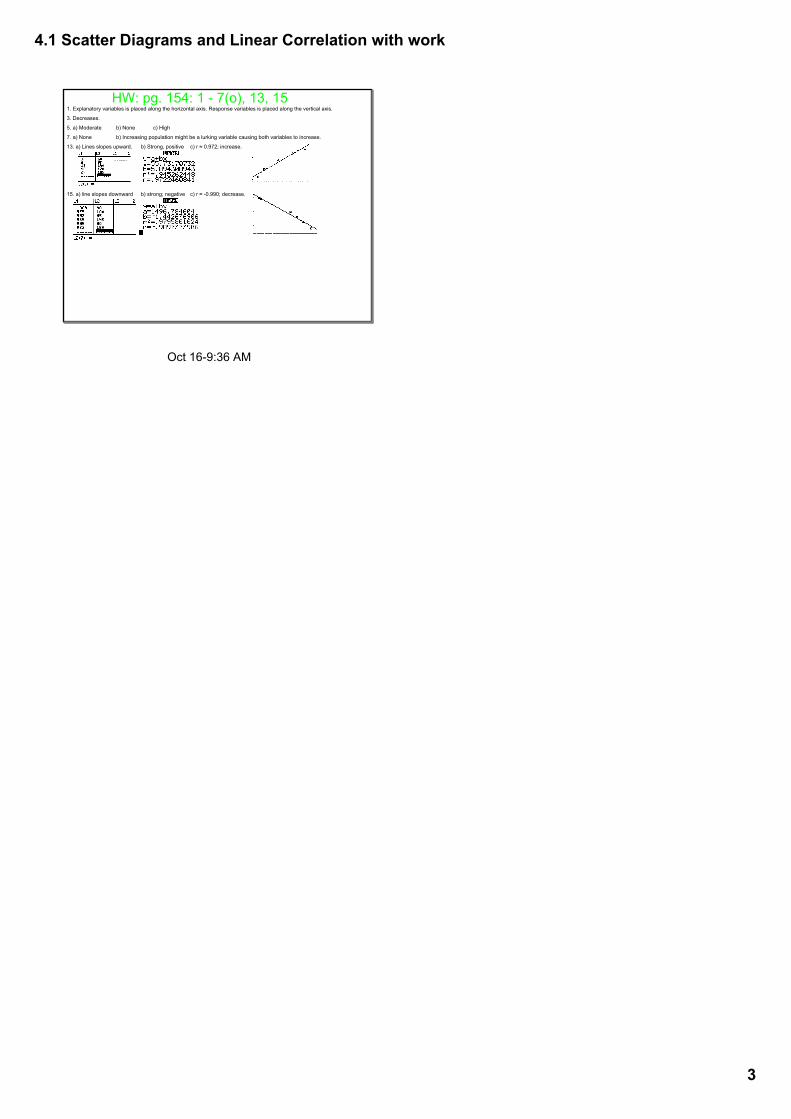
HW: pg. 154: 1 7(o), 13, 15 1. Explanatory variables is placed along the horizontal axis. Response variables is placed along the vertical axis.
3. Decreases.
5. a) Moderate b) None c) High
7. a) None b) Increasing population might be a lurking variable causing both variables to increase.
13. a) Lines slopes upward. b) Strong, positive c) r ≈ 0.972; increase.
15. a) line slopes downward b) strong; negative c) r ≈ 0.990; decrease.