40S Applied Math Mr. Knight – Killarney School Slide 1 Unit: Sinusoids Lesson: SIN-L1 Sinusoidal...
26
40S Applied Math Mr. Knight – Killarney School Slide 1 Unit: Sinusoids Lesson: SIN-L1 Sinusoidal Functions Sinusoidal Functions Learning Outcome B-4 SIN-L1 Objectives: To study periodic and sinusoidal functions.
-
Upload
david-hamilton -
Category
Documents
-
view
228 -
download
1
Transcript of 40S Applied Math Mr. Knight – Killarney School Slide 1 Unit: Sinusoids Lesson: SIN-L1 Sinusoidal...

40S Applied MathMr. Knight – Killarney School
Slide 1
Unit: SinusoidsLesson: SIN-L1 Sinusoidal Functions
Sinusoidal Functions
Learning Outcome B-4
SIN-L1 Objectives: To study periodic and sinusoidal functions.

40S Applied MathMr. Knight – Killarney School
Slide 2
Unit: SinusoidsLesson: SIN-L1 Sinusoidal Functions
There were 8.32 hours of daylight in Winnipeg on January 7th, 2000. Would you expect this to be any different on January 7th, 2001 or January 7th, 2005? The answer would be no. The reason is that the number of hours of daylight on any given day in a specific place will be approximately the same every year. If you were to draw a graph of the number of hours of daylight for a period of about three years, the graph would be similar to the one shown below. The y-axis represents the number of daylight hours and the x-axis represents the days of the year from January 1st, 2000 at x = 1, to December 31st, 2000 at x = 365, and so on.
Intro - About Periodic Functions
40S Applied MathMr. Knight – Killarney School
Slide 3
Unit: SinusoidsLesson: SIN-L1 Sinusoidal Functions
This information or data will be different for each place in the world, but it will remain repetitive for any given place over the years. This is an example of a function (number of daylight hours over time) that is called Periodic. Other examples of periodic functions are
•the amount of air in your lungs over time
•the average daily temperatures during the year.
In this module you will study functions that are periodic, and some of the properties and applications of one special type of periodic function. You will use computer software such as Graphmatica and Curve Expert to draw and analyze periodic functions.
Intro - About Periodic Functions (cont’d)
40S Applied MathMr. Knight – Killarney School
Slide 4
Unit: SinusoidsLesson: SIN-L1 Sinusoidal Functions
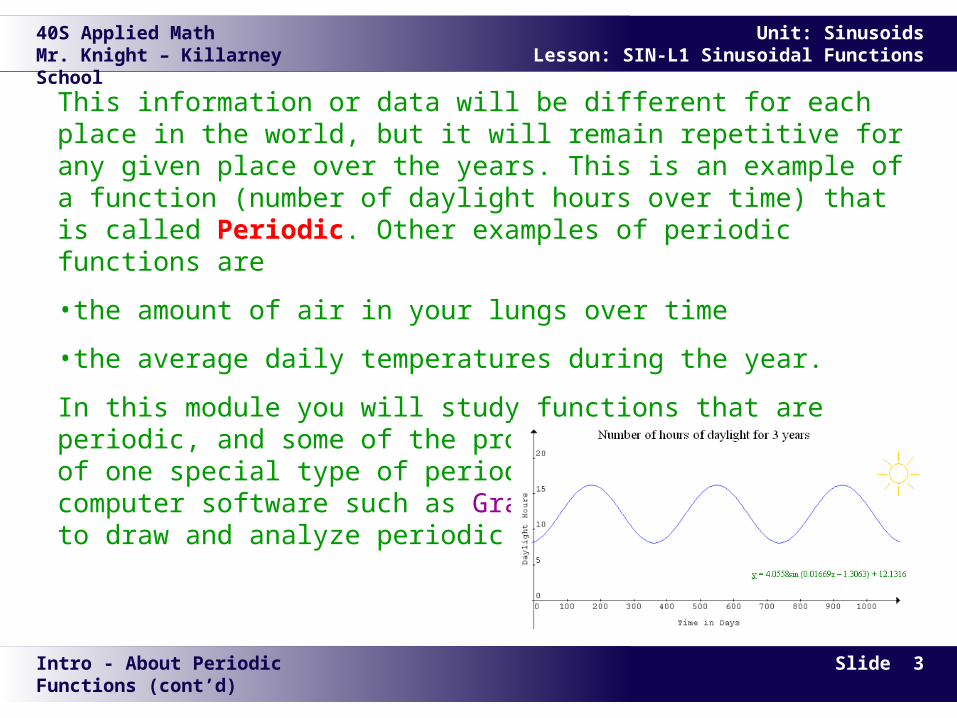
Consider the following events represented in graphical form.
•Which graphs represent repeating patterns?
•Which graphs could be used to predict future patterns?
1. EKG of heart beat for a normal heart.
Theory – Introduction to Periodic Functions

40S Applied MathMr. Knight – Killarney School
Slide 5
Unit: SinusoidsLesson: SIN-L1 Sinusoidal Functions
Consider the following events represented in graphical form.
• Which graphs represent repeating patterns?
• Which graphs could be used to predict future patterns?
2. Height above ground for child on swing.
Theory – Introduction to Periodic Functions

40S Applied MathMr. Knight – Killarney School
Slide 6
Unit: SinusoidsLesson: SIN-L1 Sinusoidal Functions
Consider the following events represented in graphical form.
• Which graphs represent repeating patterns?
• Which graphs could be used to predict future patterns?
3. Sunrise times in Winnipeg over two years.
Theory – Introduction to Periodic Functions

40S Applied MathMr. Knight – Killarney School
Slide 7
Unit: SinusoidsLesson: SIN-L1 Sinusoidal Functions
Consider the following events represented in graphical form.
• Which graphs represent repeating patterns?
• Which graphs could be used to predict future patterns?
4. The number of hours a Senior 4 student spent doing homework each day for three weeks.
Theory – Introduction to Periodic Functions
40S Applied MathMr. Knight – Killarney School
Slide 8
Unit: SinusoidsLesson: SIN-L1 Sinusoidal Functions
In each case, the graph shows a relation of some event over time. If the relation has similar patterns that are repeated at regular intervals (such as #1 and #3), then the relation is defined as periodic, and the length of the repeating interval is called a period.
Data are usually easier to recognize as periodic or not periodic when represented in graphical form. For this reason, we will normally draw a graph of any data that may involve a periodic relation.
Theory – Introduction to Periodic Functions

40S Applied MathMr. Knight – Killarney School
Slide 9
Unit: SinusoidsLesson: SIN-L1 Sinusoidal Functions
Graphs of Periodic Functions
Draw a sketch of each situation described below. Indicate whether you think the graph represents a periodic or non-periodic function. Then click on the question to compare your answer after you have made your sketch.
40S Applied MathMr. Knight – Killarney School
Slide 10
Unit: SinusoidsLesson: SIN-L1 Sinusoidal Functions
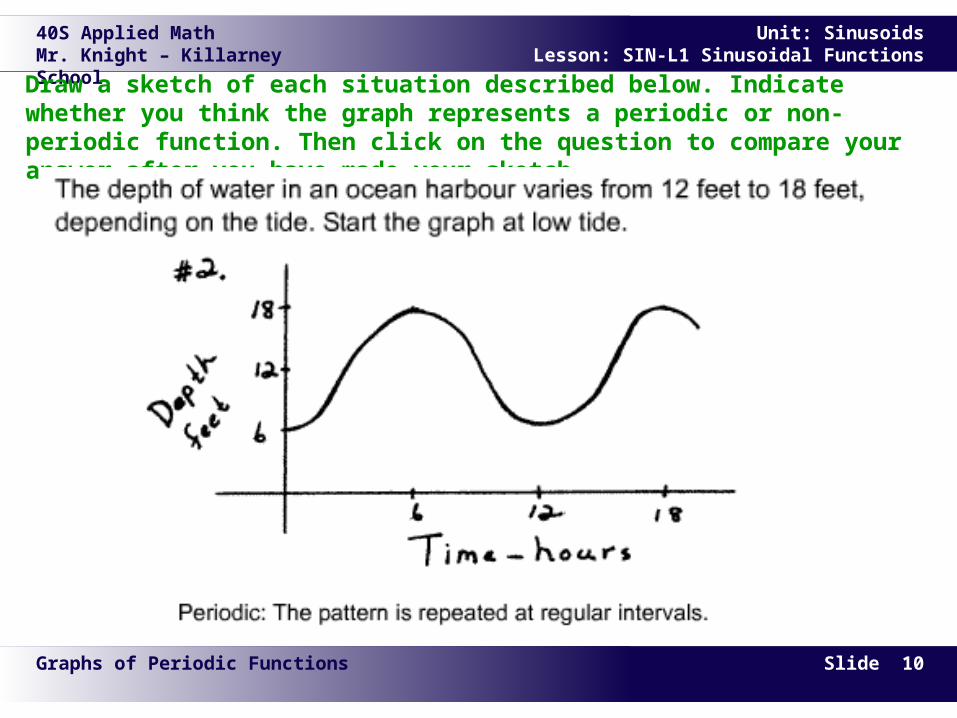
Graphs of Periodic Functions
Draw a sketch of each situation described below. Indicate whether you think the graph represents a periodic or non-periodic function. Then click on the question to compare your answer after you have made your sketch.

40S Applied MathMr. Knight – Killarney School
Slide 11
Unit: SinusoidsLesson: SIN-L1 Sinusoidal Functions
Graphs of Periodic Functions
Draw a sketch of each situation described below. Indicate whether you think the graph represents a periodic or non-periodic function. Then click on the question to compare your answer after you have made your sketch.

40S Applied MathMr. Knight – Killarney School
Slide 12
Unit: SinusoidsLesson: SIN-L1 Sinusoidal Functions
Graphs of Periodic Functions
Draw a sketch of each situation described below. Indicate whether you think the graph represents a periodic or non-periodic function. Then click on the question to compare your answer after you have made your sketch.

40S Applied MathMr. Knight – Killarney School
Slide 13
Unit: SinusoidsLesson: SIN-L1 Sinusoidal Functions
Introduction to the Sine Function Investigation
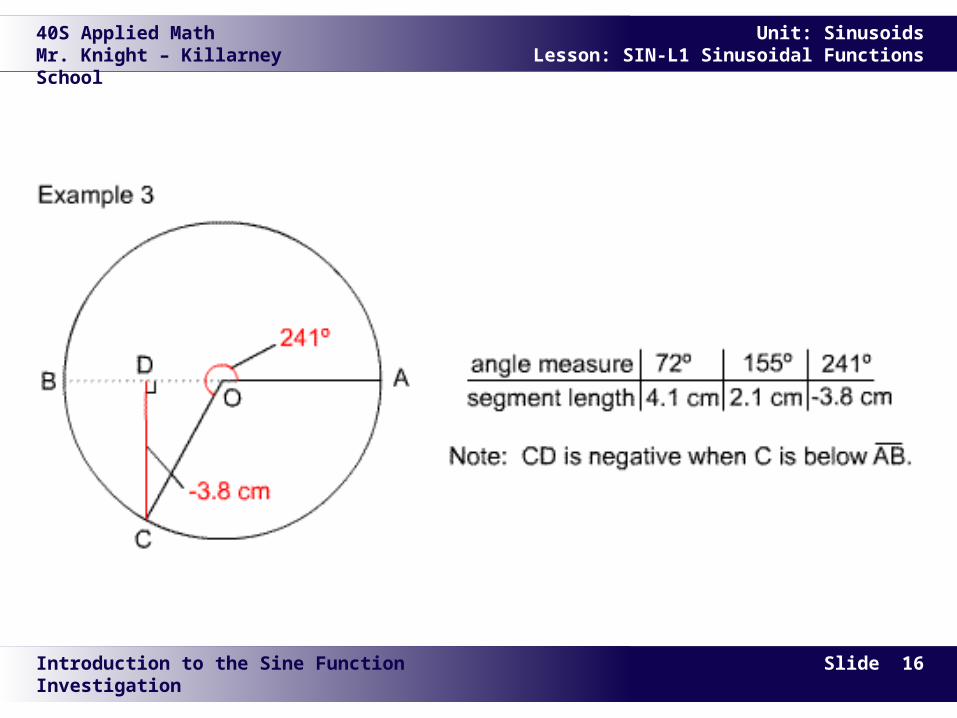
We now want to investigate a special kind of periodic function in a circle. We will study the relationship between the measure of angle AOC (identified with a red arc) and the length of segment CD (also in red) in a diagram similar to the one shown below, for numerous positions of C as we rotate C around the circle in a counterclockwise direction.

40S Applied MathMr. Knight – Killarney School
Slide 14
Unit: SinusoidsLesson: SIN-L1 Sinusoidal Functions
Introduction to the Sine Function Investigation

40S Applied MathMr. Knight – Killarney School
Slide 15
Unit: SinusoidsLesson: SIN-L1 Sinusoidal Functions
Introduction to the Sine Function Investigation
40S Applied MathMr. Knight – Killarney School
Slide 16
Unit: SinusoidsLesson: SIN-L1 Sinusoidal Functions
Introduction to the Sine Function Investigation

40S Applied MathMr. Knight – Killarney School
Slide 17
Unit: SinusoidsLesson: SIN-L1 Sinusoidal Functions
Sine Function Investigation
Purpose of the investigation: •To determine the shape of a sinusoidal function Procedure: •Measure the number of degrees of rotation of each radius. •Measure the length of each related vertical segment. •Record all data in the Data Table provided.
Print the investigation off of the website, if you haven’t been provided with it.SIN-L1 SinFcn Inv

40S Applied MathMr. Knight – Killarney School
Slide 18
Unit: SinusoidsLesson: SIN-L1 Sinusoidal Functions
Theory – The Sinusoidal Function
The graph from the investigation on the previous page should look similar to the one shown below.
If point C were moved around the circle a second time, the angle measures would be from 360° to 720°, and the segment lengths would remain the same, and the shape of the graph would be repeated, as shown below.
A graph with a wave-like appearance - like the one shown above - represents a special kind of function called a sinusoidal function, or sine function.

40S Applied MathMr. Knight – Killarney School
Slide 19
Unit: SinusoidsLesson: SIN-L1 Sinusoidal Functions
Theory – Characteristics of the Sinusoidal Function
The graph below shows a typical sinusoidal function. In this case, the x-axis is the median line of the sinusoidal function. The median line is sometimes called the axis of the sine function, and is a horizontal line midway between the maximum and minimum values of the sine curve.

40S Applied MathMr. Knight – Killarney School
Slide 20
Unit: SinusoidsLesson: SIN-L1 Sinusoidal Functions
Theory – Characteristics of the Sinusoidal Function (cont’d)
The amplitude is the maximum displacement of the curve from the median line. The amplitude in our investigation was approximately 5 cm.

40S Applied MathMr. Knight – Killarney School
Slide 21
Unit: SinusoidsLesson: SIN-L1 Sinusoidal Functions
Theory – Characteristics of the Sinusoidal Function (cont’d)
The period is the length of the shortest interval in which the wave repeats itself. The period in our investigation was 360°.

40S Applied MathMr. Knight – Killarney School
Slide 22
Unit: SinusoidsLesson: SIN-L1 Sinusoidal Functions
Example - Analyzing a Sinusoidal Graph
The graph shows the number of hours of daylight in Winnipeg for about 1100 days. This is the same graph you saw in the introduction to this module.Use the graph to answer the following questions. In each case,
• state the value(s) • state the significance of these values

40S Applied MathMr. Knight – Killarney School
Slide 23
Unit: SinusoidsLesson: SIN-L1 Sinusoidal Functions
Example - Analyzing a Sinusoidal Graph

40S Applied MathMr. Knight – Killarney School
Slide 24
Unit: SinusoidsLesson: SIN-L1 Sinusoidal Functions
Example - Analyzing a Sinusoidal Graph

40S Applied MathMr. Knight – Killarney School
Slide 25
Unit: SinusoidsLesson: SIN-L1 Sinusoidal Functions
Example - Analyzing a Sinusoidal Graph

40S Applied MathMr. Knight – Killarney School
Slide 26
Unit: SinusoidsLesson: SIN-L1 Sinusoidal Functions
Example - Analyzing a Sinusoidal Graph