40 41 - · PDF file40 41 MARCH 21, 2017 VARIETY.COM MARCH 21, 2017 VARIETY.COM network Sling...
1
40 41 MARCH 21, 2017 VARIETY.COM MARCH 21, 2017 VARIETY.COM network Sling TV DirecTV Now Hulu PlayStation Vue YouTube TV affiliate fee per sub per month 2015 affiliate fee per sub per month 2017 % chg. total viewers 2014 total viewers 2016 % chg. total subs (in 000s) 2015 total subs (in 000s) 2017 % chg. A+E NETWORKS Lifetime n/a $0.34 $0.36 5.9% 528k 447k -15.3% 95,894 90,296 -5.8% A&E n/a $0.31 $0.33 6.5% 708k 463k -34.6% 95,968 90,343 -5.9% History n/a $0.28 $0.30 7.1% 863k 637k -26.2% 96,149 90,888 -5.5% FYI n/a $0.12 $0.12 Even 95k 88k -7.4% 70,932 63,338 -10.7% LMN n/a $0.10 $0.11 10.0% 333k 345k 3.6% 82,031 75338 -8.1% Military History Channel n/a $0.07 $0.07 Even n/a n/a n/a n/a n/a n/a Viceland n/a $0.06 $0.06 Even 251k 49k -80.5% 71,220 71,909 1.0% Crime & Investigation n/a $0.06 $0.06 Even n/a n/a n/a n/a n/a n/a Lifetime Real Women n/a $0.04 $0.04 Even n/a n/a n/a n/a 75,338 n/a AMC AMC $0.44 $0.50 13.6% 626k 536k -14.4% 94,832 90,552 -4.5% IFC $0.20 $0.22 10.0% 110k 119k 8.2% 73,333 71,343 -2.7% WE tv $0.15 $0.16 6.7% 262k 297k 13.4% 85,241 86,094 1.0% SundanceTV $0.14 $0.16 14.3% 78k 120k 53.9% 57,269 65,505 14.4% BBC America $0.10 $0.11 10.0% 123k 142k 15.5% 78,375 71,343 -9.0% CBS CBS Sports Network $0.25 $0.28 12.0% n/a n/a n/a n/a n/a n/a Smithsonian Channel $0.08 $0.09 12.5% 35k 61k 74.3% 33,633 36,830 9.5% POP $0.02 $0.03 50.0% 92k 93k 1.1% 75,255 72,820 -3.2% DISCOVERY Discovery Channel $0.42 $0.44 4.8% 628k 610k -2.9% 96,589 91,388 -5.4% TLC $0.22 $0.25 13.6% 496k 406k -18.2% 95,030 89,764 -5.5% OWN $0.21 $0.25 19.1% 215k 233k 8.4% 81,587 77,705 -4.8% Discovery Español $0.21 $0.22 4.8% 51k 48k -5.9% 6,476 6,278 -3.1% Discovery Familia $0.19 $0.21 10.5% 19k 17k -10.5% 5,778 5,515 -4.6% Discovery Family Channel $0.14 $0.15 7.1% 117k 76k -35.0% 69,513 62,169 -10.6% Velocity $0.14 $0.15 7.1% 94k 129k 37.2% 62,308 71,436 14.7% Animal Planet $0.13 $0.14 7.7% 354k 354k Even 94,288 88,859 -5.8% Investigation Discovery $0.10 $0.11 10.0% 633k 714k 12.8% 86,062 84,732 -1.6% Science $0.09 $0.10 11.1% 191k 208k 8.9% 75,481 68,258 -9.6% Destination America $0.09 $0.10 11.1% 122k 103k -15.6% 57,238 52,687 -8.0% Discovery Life $0.08 $0.10 25.0% 64k 54k -15.6% 46,696 46,508 -0.4% American Heroes Channel $0.08 $0.10 25.0% 151k 120k -20.5% 59,917 53,890 -10.1% DISNEY ESPN $6.61 $7.86 18.9% 1,023k 827k -19.2% 94,396 87,437 -7.4% Disney Channel $1.38 $1.61 16.7% n/a n/a n/a 96,206 91,312 -5.1% ESPN2 $0.83 $0.98 18.1% 274k 246k -10.2% 94,379 87,349 -7.5% SEC Network $0.67 $0.74 10.5% n/a n/a n/a n/a n/a n/a Freeform $0.29 $0.34 17.2% 584k 450k -23.0% 94,406 89,117 -5.6% ESPNews n/a n/a n/a n/a $0.25 $0.29 16.0% n/a n/a n/a n/a n/a n/a ESPN Deportes n/a n/a n/a n/a $0.22 $0.26 18.2% n/a n/a n/a n/a n/a n/a ESPN Classic n/a n/a n/a n/a $0.23 $0.25 8.7% n/a n/a n/a n/a n/a n/a ESPNU $0.23 $0.25 8.7% 62k 52k -16.1% 73,594 68,574 -6.8% Disney XD $0.20 $0.23 15.0% 295k 220k -25.4% 80,120 74,710 -6.8% Disney Junior $0.17 $0.19 11.8% n/a n/a n/a 74,972 72,167 -3.7% FOX Fox News Channel $1.25 $1.55 24.0% 1,055k 1,408k 33.5% 87,058 89,433 2.7% Fox Sports 1 $0.98 $1.30 32.7% 131k 183k 39.7% 84,836 84,159 -0.8% FX Network $0.62 $0.69 11.3% 675k 519k -23.1% 95,033 90,060 -5.2% Fox College Sports n/a n/a n/a n/a $0.45 $0.50 11.1% n/a n/a n/a n/a n/a n/a BTN $0.40 $0.43 7.5% n/a n/a n/a n/a n/a n/a Fox Sports 2 $0.28 $0.33 17.9% 15k 21k 40.0% 45,393 50,164 10.5% National Geographic Channel $0.26 $0.28 7.7% 280k 269k -3.9% 86,144 89,348 3.7% Fox Life n/a n/a n/a n/a $0.24 $0.25 4.2% n/a n/a n/a n/a n/a n/a FXX $0.23 $0.26 13.0% 182k 220k 20.9% 77,280 85,573 10.7% Nat Geo Mundo n/a n/a n/a n/a $0.22 $0.24 9.1% n/a n/a n/a n/a n/a n/a Fox Deportes $0.21 $0.24 14.3% 32k 27k -15.6% 21,831 21,282 -2.5% Fox Business Network $0.21 $0.23 9.5% 43k 114k 165.1% 74,224 83,791 12.9% FXM $0.19 $0.20 5.3% 101k 92k -8.9% 52,607 55,729 5.9% Nat Geo Wild $0.14 $0.16 14.3% 135k 143k 5.9% 57,891 56,124 -3.1% network Sling TV DirecTV Now Hulu PlayStation Vue YouTube TV affiliate fee per sub per month 2015 affiliate fee per sub per month 2017 % chg. total viewers 2014 total viewers 2016 % chg. total subs (in 000s) 2015 total subs (in 000s) 2017 % chg. NBCUNIVERSAL USA $1.00 $1.07 7.0% 1,156k 849k -26.6% 96,341 91,429 -5.1% Universal HD n/a n/a n/a n/a $0.42 $0.43 2.9% n/a n/a n/a n/a n/a n/a CNBC $0.39 $0.42 7.7% 139k 155k 11.50% 93,623 87,947 -6.1% Golf Channel $0.35 $0.38 8.6% 99k 108k 9.1% 79,250 75,678 -4.5% Syfy $0.32 $0.35 9.4% 455k 355k -22.0% 94,804 89,742 -5.4% NBCSN $0.30 $0.32 6.7% 147k 173k 17.7% 81,578 83,790 2.7% Bravo $0.29 $0.31 6.9% 355k 314k -11.6% 92,295 87,213 -5.5% E! $0.27 $0.30 11.1% 301k 271k -10.0% 94,296 89,488 -5.1% MSNBC $0.25 $0.26 4.0% 350k 609k 74.0% 94,531 85,317 -9.8% Esquire Network* $0.18 $0.19 5.6% 66k 100k 51.5% 70,253 44,581 -36.5% Oxygen Network $0.16 $0.17 6.3% 197k 141k -28.4% 77,450 75,298 -2.8% Cloo* $0.12 $0.13 8.3% 54k 37k -31.5% 57,993 n/a n/a Sprout $0.12 $0.13 8.3% 143k 136k -4.9% n/a 58,266 n/a Chiller $0.11 $0.11 Even 66k 46k -30.3% 38,820 35,687 -8.1% NBC Universo $0.10 $0.11 10.0% 31k 32k 3.2% 39,326 42,378 7.8% CNBC World n/a n/a n/a n/a $0.10 $0.11 10.0% n/a n/a n/a n/a n/a n/a SCRIPPS HGTV $0.22 $0.23 4.6% 761k 880k 15.6% 95,628 90,949 -4.9% Food Network $0.21 $0.22 4.8% 595k 596k 0.2% 96,931 92,873 -4.2% Travel Channel $0.14 $0.15 7.1% 274k 275k 0.4% 91,468 84,215 -7.9% DIY Network $0.10 $0.11 10.0% 128k 149k 16.4% 60,942 58,368 -4.2% Cooking Channel $0.09 $0.10 11.1% 74k 91k 23.0% 61,951 63,756 2.9% Great American Country $0.02 $0.02 0.0% 44k 49k 11.4% 59,547 56,352 -5.4% TURNER TNT $1.58 $2.09 32.3% 1,052k 821k -22.0% 95,331 90,332 -5.2% TBS $0.77 $1.02 32.5% 714k 620k -13.2% 96,474 91,671 -5.0% CNN $0.64 $0.78 21.9% 404k 757k 87.4% 97,092 91,567 -5.7% TCM $0.30 $0.33 10.0% n/a n/a n/a n/a n/a n/a Cartoon Network $0.24 $0.28 16.7% 1,183k 1,017k -14.0% 96,390 90,788 -5.8% truTV $0.20 $0.25 25.0% 344k 243k -29.4% 89,664 86,832 -3.2% CNN en Español n/a n/a n/a n/a $0.18 $0.22 22.2% n/a n/a n/a n/a n/a n/a HTV n/a n/a n/a n/a $0.17 $0.18 5.9% n/a n/a n/a n/a n/a n/a CNN International n/a n/a n/a n/a $0.14 $0.17 21.4% n/a n/a n/a n/a n/a n/a Boomerang $0.09 $0.11 22.2% 52k 149k 186.5% 43,603 42,585 -2.3% HLN $0.00 $0.00 Even 260k 288k 10.8% 95,174 90,651 -4.8% VIACOM Nickelodeon/Nick at Nite $0.71 $0.78 9.9% 1,512k 1,240k -18.0% 94,792 89,108 -6.0% MTV $0.51 $0.57 11.8% 420k 308k -26.7% 93,240 87,573 -6.1% Spike TV $0.45 $0.50 11.1% 502k 410k -18.3% 93,364 83,416 -10.7% BET $0.25 $0.27 8.0% 333k 281k -15.6% 88,255 83,897 -4.9% Nick Jr. $0.25 $0.27 8.0% 311k 412k 32.5% 75,426 71,946 -4.6% VH1 $0.24 $0.27 12.5% 272k 286k 5.2% 92,626 87,568 -5.5% Comedy Central $0.23 $0.26 13.0% 463k 318k -31.3% 93,992 89,538 -4.7% MTV Live $0.21 $0.24 14.3% n/a n/a n/a n/a n/a n/a TV Land $0.19 $0.21 10.5% 499k 480k -3.8% 92,484 87,617 -5.3% TeenNick $0.14 $0.17 21.4% 210k 153k -27.1% 72,306 68,472 -5.3% CMT $0.13 $0.14 7.7% 191k 146k -23.6% 86,989 75,182 -13.6% Nicktoons $0.10 $0.11 10.0% 197k 173k -12.2% 66,545 62,095 -6.7% Centric $0.10 $0.10 Even 60k 42k -30.0% 51,829 50,357 -2.8% MTV Classic $0.09 $0.09 Even 22k 17k -22.7% n/a 52,266 n/a mtvU n/a n/a n/a n/a $0.09 $0.09 Even n/a n/a n/a n/a n/a n/a BET Hip-Hop n/a n/a n/a n/a $0.08 $0.08 Even n/a n/a n/a n/a n/a n/a MTV2 $0.08 $0.09 12.5% 166k 137k -17.5% 79,416 75,412 -5.0% CMT Music n/a n/a n/a n/a $0.06 $0.06 Even n/a n/a n/a n/a n/a n/a BET Soul n/a n/a n/a n/a $0.06 $0.06 Even n/a n/a n/a n/a n/a n/a BET Gospel n/a n/a n/a n/a $0.05 $0.06 20.0% n/a n/a n/a n/a n/a n/a Logo $0.04 $0.04 Even 48k 52k 8.3% 51,337 48,270 -6.0% Tr3s n/a n/a n/a n/a $0.04 $0.04 Even n/a n/a n/a n/a n/a n/a BET Jams n/a n/a n/a n/a $0.03 $0.04 33.3% n/a n/a n/a n/a n/a n/a NickMusic n/a n/a n/a n/a $0.02 $0.03 50.0% n/a n/a n/a n/a n/a n/a Nick 2 n/a n/a n/a n/a $0.02 $0.02 Even n/a n/a n/a n/a n/a n/a SOURCES: SNL KAGAN, NOMURA, MOFFETTNATHANSON, NIELSEN, SPORTSTVRATINGS.COM. VARIETY. THE CHART DOES NOT INCLUDE BROADCAST NETWORKS (I.E. NBC), PREMIUM CABLE CHANNELS (I.E. HBO), REGIONAL SPORTS NETWORKS (I.E. FOX SPORTS WEST) AND INDEPENDENT CABLE CHANNELS (I.E. C-SPAN). NETWORKS MARKED WITH AN ASTERISK HAVE BEEN SHUT DOWN. COLORED BOXES MARKED WITH A “T” IN THE SKINNY BUNDLE SECTION DENOTE CHANNELS THAT MUST BE PURCHASED IN A SEPARATE TIER. “N/A” INDICATES INFORMATION IS NOT AVAILABLE. DISNEY HAS A 50% OWNERSHIP STAKE IN A+E NETWORKS.... History, A&E Network, and Lifetime have taken viewership hits, but they remain corner- stone cable nets. Low-visibility channels that could be vul- nerable include Lifetime Real Women, Crime + Investigation, and Military History. The jury is still out after a year of the revamp of H2 into Viceland. Discovery has never been hesitant to rebrand under- performing channels. But in recent years the priorities have been the six outlets that drive 85% of company reve- nue: Discovery, TLC, Animal Planet, Investigation Discov- ery, Science, and Velocity. Disney has felt the pinch of investor focus on ESPN’s sub- scriber erosion. Spinoffs born in the go-go years are no lon- ger getting the hard sell. Dis- ney Channel and Freeform are grappling with declining rat- ings and behavioral shifts among younger viewers. Time Warner’s basic cable division has long prided itself on its quality-not-quantity focus on cornerstone cable brands. CNN, TNT, and TBS give Turner the goods to be a must-have for any digital MVPD offering. Turner is launching a commercial-free subscription-streaming version of its animation-library channel Boomerang this month, raising questions about Boomerang’s long-term future as a linear offering. A weak spot in the roster has been TruTV, which shifted its focus to comedy in 2014 and has lost almost a third of its viewership since. The largest cable program- mer faces the toughest tran- sition to a skinny-bundle environment. There’s little doubt that the curtain will fall sooner rather than later on the low-visibility spinoffs of MTV, Nickelodeon, and BET. For now, Viacom is staying out of the digital MVPD push at YouTube and Hulu as it seeks to sell traditional MVPDs on the concept of its core chan- nels serving as the foundation of a non-sports-entertainment bundle offering. Fox’s sports-heavy cable lineup will surely be in the forefront of shifts in packaging. Fox News and FX are the big non-sports drivers of distribution. The National Geographic group could see erosion among low-visibility spinoff channels. NBCUniversal Cable has taken big steps in the past year to adapt to changing times. Esquire Network and Cloo have gone dark, Oxygen is about to be refurbished into a true-crime brand. Distribu- tion deals for NBCU’s large suite of channels is pretty well locked in for the near term with the major traditional and digital MVPDs. Nine companies own the overwhelming majority of cable networks available to U.S. consumers. This chart exhibits not only who owns what, but includes several key indicators as to the relative financial health of each channel: the affiliate fee each channel collects from pay TV distributors, the total number of viewers each channel averages on a 24-hour basis, and the total subscribers each channel reaches. In addition, we’ve charted which of the five major skinny bundles in the marketplace (or soon to arrive there) includes these channels. While affiliate fees have held up well in recent years, the preponderance of significant declines across both ratings and audience-reach for so many channels hint at the troubles ahead for the multichannel business. The pressure on the AMC mothership to drive affiliate- fee and carriage gains for its sibling nets has analysts wondering how the company will fare when “The Walking Dead” inevitably lurches into the sunset. Speculation about takeover suitors — Lionsgate? CBS? — will persist. CBS’ tiny lineup of channels largely shields it from the jit- ters over steady disassembling of the bundle. CBS Sports Net- work isn’t big enough to make a dent should it struggle; the same goes for its POP joint venture with Lionsgate. The Knoxville, Tenn.-based pro- gramming group has focused resources on three core brands, but has seen steeper subscriber declines for Travel Channel than for HGTV and Food Network. DIY Network, Cooking Channel, and Great American Country are comparatively low-cost operations.
Transcript of 40 41 - · PDF file40 41 MARCH 21, 2017 VARIETY.COM MARCH 21, 2017 VARIETY.COM network Sling...
40 41
MA
RCH
21,
201
7
VARI
ETY.
CO
M
MA
RCH
21,
201
7
VARI
ETY.
CO
M
network Slin
g T
V
Dir
ecT
V N
ow
Hul
u
Play
Stat
ion
Vue
YouT
ube
TV
affiliate feeper sub
per month2015
affiliate feeper sub
per month2017 % chg.
total viewers
2014
total viewers
2016 % chg.
total subs (in 000s)
2015
total subs (in 000s)
2017 % chg.
A+E
NET
WO
RK
S
Lifetime n/a $0.34 $0.36 5.9% 528k 447k -15.3% 95,894 90,296 -5.8%
A&E n/a $0.31 $0.33 6.5% 708k 463k -34.6% 95,968 90,343 -5.9%
History n/a $0.28 $0.30 7.1% 863k 637k -26.2% 96,149 90,888 -5.5%
FYI n/a $0.12 $0.12 Even 95k 88k -7.4% 70,932 63,338 -10.7%
LMN n/a $0.10 $0.11 10.0% 333k 345k 3.6% 82,031 75338 -8.1%
Military History Channel n/a $0.07 $0.07 Even n/a n/a n/a n/a n/a n/a
Viceland n/a $0.06 $0.06 Even 251k 49k -80.5% 71,220 71,909 1.0%
Crime & Investigation n/a $0.06 $0.06 Even n/a n/a n/a n/a n/a n/a
Lifetime Real Women n/a $0.04 $0.04 Even n/a n/a n/a n/a 75,338 n/a
AM
C
AMC $0.44 $0.50 13.6% 626k 536k -14.4% 94,832 90,552 -4.5%
IFC $0.20 $0.22 10.0% 110k 119k 8.2% 73,333 71,343 -2.7%
WE tv $0.15 $0.16 6.7% 262k 297k 13.4% 85,241 86,094 1.0%
SundanceTV $0.14 $0.16 14.3% 78k 120k 53.9% 57,269 65,505 14.4%
BBC America $0.10 $0.11 10.0% 123k 142k 15.5% 78,375 71,343 -9.0%
CBS
CBS Sports Network $0.25 $0.28 12.0% n/a n/a n/a n/a n/a n/a
Smithsonian Channel $0.08 $0.09 12.5% 35k 61k 74.3% 33,633 36,830 9.5%
POP $0.02 $0.03 50.0% 92k 93k 1.1% 75,255 72,820 -3.2%
DIS
CO
VER
Y
Discovery Channel $0.42 $0.44 4.8% 628k 610k -2.9% 96,589 91,388 -5.4%
TLC $0.22 $0.25 13.6% 496k 406k -18.2% 95,030 89,764 -5.5%
OWN $0.21 $0.25 19.1% 215k 233k 8.4% 81,587 77,705 -4.8%
Discovery Español $0.21 $0.22 4.8% 51k 48k -5.9% 6,476 6,278 -3.1%
Discovery Familia $0.19 $0.21 10.5% 19k 17k -10.5% 5,778 5,515 -4.6%
Discovery Family Channel $0.14 $0.15 7.1% 117k 76k -35.0% 69,513 62,169 -10.6%
Velocity $0.14 $0.15 7.1% 94k 129k 37.2% 62,308 71,436 14.7%
Animal Planet $0.13 $0.14 7.7% 354k 354k Even 94,288 88,859 -5.8%
Investigation Discovery $0.10 $0.11 10.0% 633k 714k 12.8% 86,062 84,732 -1.6%
Science $0.09 $0.10 11.1% 191k 208k 8.9% 75,481 68,258 -9.6%
Destination America $0.09 $0.10 11.1% 122k 103k -15.6% 57,238 52,687 -8.0%
Discovery Life $0.08 $0.10 25.0% 64k 54k -15.6% 46,696 46,508 -0.4%
American Heroes Channel $0.08 $0.10 25.0% 151k 120k -20.5% 59,917 53,890 -10.1%
DIS
NEY
ESPN $6.61 $7.86 18.9% 1,023k 827k -19.2% 94,396 87,437 -7.4%
Disney Channel $1.38 $1.61 16.7% n/a n/a n/a 96,206 91,312 -5.1%
ESPN2 $0.83 $0.98 18.1% 274k 246k -10.2% 94,379 87,349 -7.5%
SEC Network $0.67 $0.74 10.5% n/a n/a n/a n/a n/a n/a
Freeform $0.29 $0.34 17.2% 584k 450k -23.0% 94,406 89,117 -5.6%
ESPNews n/a n/a n/a n/a $0.25 $0.29 16.0% n/a n/a n/a n/a n/a n/a
ESPN Deportes n/a n/a n/a n/a $0.22 $0.26 18.2% n/a n/a n/a n/a n/a n/a
ESPN Classic n/a n/a n/a n/a $0.23 $0.25 8.7% n/a n/a n/a n/a n/a n/a
ESPNU $0.23 $0.25 8.7% 62k 52k -16.1% 73,594 68,574 -6.8%
Disney XD $0.20 $0.23 15.0% 295k 220k -25.4% 80,120 74,710 -6.8%
Disney Junior $0.17 $0.19 11.8% n/a n/a n/a 74,972 72,167 -3.7%
FOX
Fox News Channel $1.25 $1.55 24.0% 1,055k 1,408k 33.5% 87,058 89,433 2.7%
Fox Sports 1 $0.98 $1.30 32.7% 131k 183k 39.7% 84,836 84,159 -0.8%
FX Network $0.62 $0.69 11.3% 675k 519k -23.1% 95,033 90,060 -5.2%
Fox College Sports n/a n/a n/a n/a $0.45 $0.50 11.1% n/a n/a n/a n/a n/a n/a
BTN $0.40 $0.43 7.5% n/a n/a n/a n/a n/a n/a
Fox Sports 2 $0.28 $0.33 17.9% 15k 21k 40.0% 45,393 50,164 10.5%
National Geographic Channel $0.26 $0.28 7.7% 280k 269k -3.9% 86,144 89,348 3.7%
Fox Life n/a n/a n/a n/a $0.24 $0.25 4.2% n/a n/a n/a n/a n/a n/a
FXX $0.23 $0.26 13.0% 182k 220k 20.9% 77,280 85,573 10.7%
Nat Geo Mundo n/a n/a n/a n/a $0.22 $0.24 9.1% n/a n/a n/a n/a n/a n/a
Fox Deportes $0.21 $0.24 14.3% 32k 27k -15.6% 21,831 21,282 -2.5%
Fox Business Network $0.21 $0.23 9.5% 43k 114k 165.1% 74,224 83,791 12.9%
FXM $0.19 $0.20 5.3% 101k 92k -8.9% 52,607 55,729 5.9%
Nat Geo Wild $0.14 $0.16 14.3% 135k 143k 5.9% 57,891 56,124 -3.1%
network Slin
g T
V
Dir
ecT
V N
ow
Hul
u
Play
Stat
ion
Vue
YouT
ube
TV
affiliate feeper sub
per month2015
affiliate feeper sub
per month2017 % chg.
total viewers
2014
total viewers
2016 % chg.
total subs (in 000s)
2015
total subs (in 000s)
2017 % chg.
NBC
UN
IVER
SAL
USA $1.00 $1.07 7.0% 1,156k 849k -26.6% 96,341 91,429 -5.1%
Universal HD n/a n/a n/a n/a $0.42 $0.43 2.9% n/a n/a n/a n/a n/a n/a
CNBC $0.39 $0.42 7.7% 139k 155k 11.50% 93,623 87,947 -6.1%
Golf Channel $0.35 $0.38 8.6% 99k 108k 9.1% 79,250 75,678 -4.5%
Syfy $0.32 $0.35 9.4% 455k 355k -22.0% 94,804 89,742 -5.4%
NBCSN $0.30 $0.32 6.7% 147k 173k 17.7% 81,578 83,790 2.7%
Bravo $0.29 $0.31 6.9% 355k 314k -11.6% 92,295 87,213 -5.5%
E! $0.27 $0.30 11.1% 301k 271k -10.0% 94,296 89,488 -5.1%
MSNBC $0.25 $0.26 4.0% 350k 609k 74.0% 94,531 85,317 -9.8%
Esquire Network* $0.18 $0.19 5.6% 66k 100k 51.5% 70,253 44,581 -36.5%
Oxygen Network $0.16 $0.17 6.3% 197k 141k -28.4% 77,450 75,298 -2.8%
Cloo* $0.12 $0.13 8.3% 54k 37k -31.5% 57,993 n/a n/a
Sprout $0.12 $0.13 8.3% 143k 136k -4.9% n/a 58,266 n/a
Chiller $0.11 $0.11 Even 66k 46k -30.3% 38,820 35,687 -8.1%
NBC Universo $0.10 $0.11 10.0% 31k 32k 3.2% 39,326 42,378 7.8%
CNBC World n/a n/a n/a n/a $0.10 $0.11 10.0% n/a n/a n/a n/a n/a n/a
SCR
IPPS
HGTV $0.22 $0.23 4.6% 761k 880k 15.6% 95,628 90,949 -4.9%
Food Network $0.21 $0.22 4.8% 595k 596k 0.2% 96,931 92,873 -4.2%
Travel Channel $0.14 $0.15 7.1% 274k 275k 0.4% 91,468 84,215 -7.9%
DIY Network $0.10 $0.11 10.0% 128k 149k 16.4% 60,942 58,368 -4.2%
Cooking Channel $0.09 $0.10 11.1% 74k 91k 23.0% 61,951 63,756 2.9%
Great American Country $0.02 $0.02 0.0% 44k 49k 11.4% 59,547 56,352 -5.4%
TU
RN
ER
TNT $1.58 $2.09 32.3% 1,052k 821k -22.0% 95,331 90,332 -5.2%
TBS $0.77 $1.02 32.5% 714k 620k -13.2% 96,474 91,671 -5.0%
CNN $0.64 $0.78 21.9% 404k 757k 87.4% 97,092 91,567 -5.7%
TCM $0.30 $0.33 10.0% n/a n/a n/a n/a n/a n/a
Cartoon Network $0.24 $0.28 16.7% 1,183k 1,017k -14.0% 96,390 90,788 -5.8%
truTV $0.20 $0.25 25.0% 344k 243k -29.4% 89,664 86,832 -3.2%
CNN en Español n/a n/a n/a n/a $0.18 $0.22 22.2% n/a n/a n/a n/a n/a n/a
HTV n/a n/a n/a n/a $0.17 $0.18 5.9% n/a n/a n/a n/a n/a n/a
CNN International n/a n/a n/a n/a $0.14 $0.17 21.4% n/a n/a n/a n/a n/a n/a
Boomerang $0.09 $0.11 22.2% 52k 149k 186.5% 43,603 42,585 -2.3%
HLN $0.00 $0.00 Even 260k 288k 10.8% 95,174 90,651 -4.8%
VIA
CO
M
Nickelodeon/Nick at Nite $0.71 $0.78 9.9% 1,512k 1,240k -18.0% 94,792 89,108 -6.0%
MTV $0.51 $0.57 11.8% 420k 308k -26.7% 93,240 87,573 -6.1%
Spike TV $0.45 $0.50 11.1% 502k 410k -18.3% 93,364 83,416 -10.7%
BET $0.25 $0.27 8.0% 333k 281k -15.6% 88,255 83,897 -4.9%
Nick Jr. $0.25 $0.27 8.0% 311k 412k 32.5% 75,426 71,946 -4.6%
VH1 $0.24 $0.27 12.5% 272k 286k 5.2% 92,626 87,568 -5.5%
Comedy Central $0.23 $0.26 13.0% 463k 318k -31.3% 93,992 89,538 -4.7%
MTV Live $0.21 $0.24 14.3% n/a n/a n/a n/a n/a n/a
TV Land $0.19 $0.21 10.5% 499k 480k -3.8% 92,484 87,617 -5.3%
TeenNick $0.14 $0.17 21.4% 210k 153k -27.1% 72,306 68,472 -5.3%
CMT $0.13 $0.14 7.7% 191k 146k -23.6% 86,989 75,182 -13.6%
Nicktoons $0.10 $0.11 10.0% 197k 173k -12.2% 66,545 62,095 -6.7%
Centric $0.10 $0.10 Even 60k 42k -30.0% 51,829 50,357 -2.8%
MTV Classic $0.09 $0.09 Even 22k 17k -22.7% n/a 52,266 n/a
mtvU n/a n/a n/a n/a $0.09 $0.09 Even n/a n/a n/a n/a n/a n/a
BET Hip-Hop n/a n/a n/a n/a $0.08 $0.08 Even n/a n/a n/a n/a n/a n/a
MTV2 $0.08 $0.09 12.5% 166k 137k -17.5% 79,416 75,412 -5.0%
CMT Music n/a n/a n/a n/a $0.06 $0.06 Even n/a n/a n/a n/a n/a n/a
BET Soul n/a n/a n/a n/a $0.06 $0.06 Even n/a n/a n/a n/a n/a n/a
BET Gospel n/a n/a n/a n/a $0.05 $0.06 20.0% n/a n/a n/a n/a n/a n/a
Logo $0.04 $0.04 Even 48k 52k 8.3% 51,337 48,270 -6.0%
Tr3s n/a n/a n/a n/a $0.04 $0.04 Even n/a n/a n/a n/a n/a n/a
BET Jams n/a n/a n/a n/a $0.03 $0.04 33.3% n/a n/a n/a n/a n/a n/a
NickMusic n/a n/a n/a n/a $0.02 $0.03 50.0% n/a n/a n/a n/a n/a n/a
Nick 2 n/a n/a n/a n/a $0.02 $0.02 Even n/a n/a n/a n/a n/a n/a
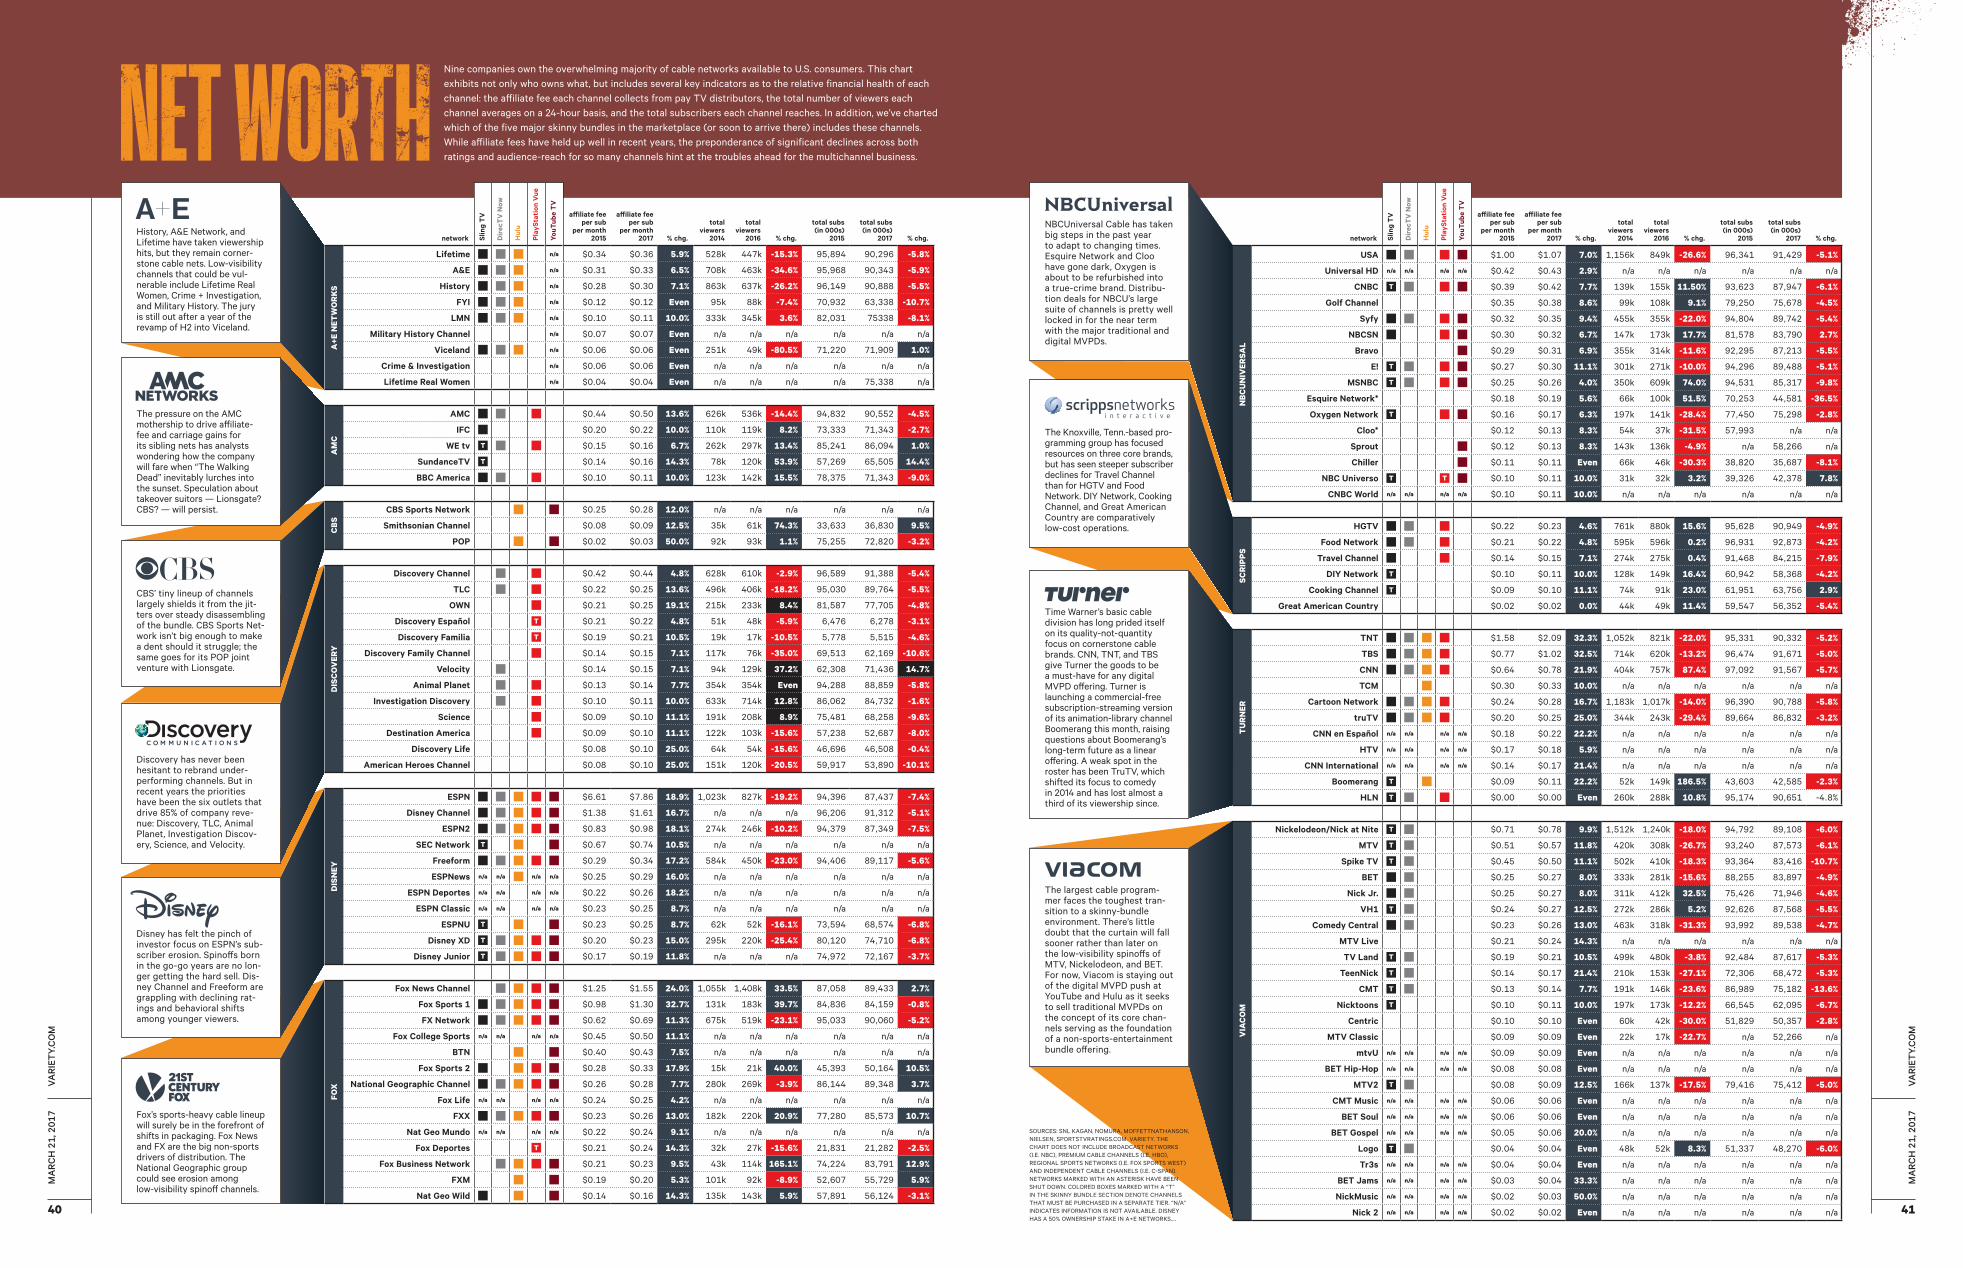
SOURCES: SNL KAGAN, NOMURA, MOFFETTNATHANSON, NIELSEN, SPORTSTVRATINGS.COM. VARIETY. THE CHART DOES NOT INCLUDE BROADCAST NETWORKS (I.E. NBC), PREMIUM CABLE CHANNELS (I.E. HBO), REGIONAL SPORTS NETWORKS (I.E. FOX SPORTS WEST) AND INDEPENDENT CABLE CHANNELS (I.E. C-SPAN). NETWORKS MARKED WITH AN ASTERISK HAVE BEEN SHUT DOWN. COLORED BOXES MARKED WITH A “T” IN THE SKINNY BUNDLE SECTION DENOTE CHANNELS THAT MUST BE PURCHASED IN A SEPARATE TIER. “N/A” INDICATES INFORMATION IS NOT AVAILABLE. DISNEY HAS A 50% OWNERSHIP STAKE IN A+E NETWORKS....
History, A&E Network, and Lifetime have taken viewership hits, but they remain corner-stone cable nets. Low-visibility channels that could be vul-nerable include Lifetime Real Women, Crime + Investigation, and Military History. The jury is still out after a year of the revamp of H2 into Viceland.
Discovery has never been hesitant to rebrand under-performing channels. But in recent years the priorities have been the six outlets that drive 85% of company reve-nue: Discovery, TLC, Animal Planet, Investigation Discov-ery, Science, and Velocity.
Disney has felt the pinch of investor focus on ESPN’s sub-scriber erosion. Spinoffs born in the go-go years are no lon-ger getting the hard sell. Dis-ney Channel and Freeform are grappling with declining rat-ings and behavioral shifts among younger viewers.
Time Warner’s basic cable division has long prided itself on its quality-not-quantity focus on cornerstone cable brands. CNN, TNT, and TBS give Turner the goods to be a must-have for any digital MVPD offering. Turner is launching a commercial-free subscription-streaming version of its animation-library channel Boomerang this month, raising questions about Boomerang’s long-term future as a linear offering. A weak spot in the roster has been TruTV, which shifted its focus to comedy in 2014 and has lost almost a third of its viewership since.
The largest cable program-mer faces the toughest tran-sition to a skinny-bundle environment. There’s little doubt that the curtain will fall sooner rather than later on the low-visibility spinoffs of MTV, Nickelodeon, and BET. For now, Viacom is staying out of the digital MVPD push at YouTube and Hulu as it seeks to sell traditional MVPDs on the concept of its core chan-nels serving as the foundation of a non-sports-entertainment bundle offering.
Fox’s sports-heavy cable lineup will surely be in the forefront of shifts in packaging. Fox News and FX are the big non-sports drivers of distribution. The National Geographic group could see erosion among low-visibility spinoff channels.
NBCUniversal Cable has taken big steps in the past year to adapt to changing times. Esquire Network and Cloo have gone dark, Oxygen is about to be refurbished into a true-crime brand. Distribu-tion deals for NBCU’s large suite of channels is pretty well locked in for the near term with the major traditional and digital MVPDs.
Nine companies own the overwhelming majority of cable networks available to U.S. consumers. This chart exhibits not only who owns what, but includes several key indicators as to the relative financial health of each channel: the affiliate fee each channel collects from pay TV distributors, the total number of viewers each channel averages on a 24-hour basis, and the total subscribers each channel reaches. In addition, we’ve charted which of the five major skinny bundles in the marketplace (or soon to arrive there) includes these channels. While affiliate fees have held up well in recent years, the preponderance of significant declines across both ratings and audience-reach for so many channels hint at the troubles ahead for the multichannel business.
The pressure on the AMC mothership to drive affiliate- fee and carriage gains for its sibling nets has analysts wondering how the company will fare when “The Walking Dead” inevitably lurches into the sunset. Speculation about takeover suitors — Lionsgate? CBS? — will persist.
CBS’ tiny lineup of channels largely shields it from the jit-ters over steady disassembling of the bundle. CBS Sports Net-work isn’t big enough to make a dent should it struggle; the same goes for its POP joint venture with Lionsgate.
The Knoxville, Tenn.-based pro-gramming group has focused resources on three core brands, but has seen steeper subscriber declines for Travel Channel than for HGTV and Food Network. DIY Network, Cooking Channel, and Great American Country are comparatively low-cost operations.