4. TITLE AND SUBTITLE DAAD19-01-1-0587 · Farzan Parsinejad earning a Ph.D. and Christian Arcari...
42
2 NSN 7540-01-280-5500 Standard Form 298 (Rev.2-89) Prescribed by ANSI Std. 239-18 298-102 Enclosure 1 REPORT DOCUMENTATION PAGE Form Approved OMB NO. 0704-0188 Public Reporting burden for this collection of information is estimated to average 1 hour per response, including the time for reviewing instructions, searching existing data sources, gathering and maintaining the data needed, and completing and reviewing the collection of information. Send comment regarding this burden estimates or any other aspect of this collection of information, including suggestions for reducing this burden, to Washington Headquarters Services, Directorate for information Operations and Reports, 1215 Jefferson Davis Highway, Suite 1204, Arlington, VA 22202-4302, and to the Office of Management and Budget, Paperwork Reduction Project (0704-0188,) Washington, DC 20503. 1. AGENCY USE ONLY ( Leave Blank) 2. REPORT DATE 08/15/04 3. REPORT TYPE AND DATES COVERED Final Progress 15 May 01 – 14 May 04 4. TITLE AND SUBTITLE Autoignition and Burning Speeds of JP-8 Fuel at High Temperatures and Pressures 5. FUNDING NUMBERS DAAD19-01-1-0587 6. AUTHOR(S) Mohamad Metghalchi 7. PERFORMING ORGANIZATION NAME(S) AND ADDRESS(ES) Northeastern University 360 Huntington Ave., Boston, MA 02115 8. PERFORMING ORGANIZATION REPORT NUMBER DAAD19-01-1-0587 / 560280 / 3 9. SPONSORING / MONITORING AGENCY NAME(S) AND ADDRESS(ES) U. S. Army Research Office P.O. Box 12211 Research Triangle Park, NC 27709-2211 10. SPONSORING / MONITORING AGENCY REPORT NUMBER 41603.1-EG 11. SUPPLEMENTARY NOTES The views, opinions and/or findings contained in this report are those of the author(s) and should not be construed as an official Department of the Army position, policy or decision, unless so designated by other documentation. 12 a. DISTRIBUTION / AVAILABILITY STATEMENT Approved for public release; distribution unlimited. 12 b. DISTRIBUTION CODE . 13. ABSTRACT (Maximum 200 words) Experimental facilities have been designed and built for liquid injection lines in both spherical and cylindrical vessels. Heating equipments including vessel band heaters and liquid line heater along with pressure transducer and thermocouples have been added to cylindrical vessel. Burning speed of JP-8 air mixtures was measured in a range of temperature and pressure. Flame pictures have been taken in the cylindrical vessel with end glasses using a high speed CCD camera. The reults are presented in this report. 14. SUBJECT TERMS Combustion Autoignition 15. NUMBER OF PAGES 20 16. PRICE CODE 17. SECURITY CLASSIFICATION OR REPORT UNCLASSIFIED 18. SECURITY CLASSIFICATION ON THIS PAGE UNCLASSIFIED 19. SECURITY CLASSIFICATION OF ABSTRACT UNCLASSIFIED 20. LIMITATION OF ABSTRACT UL
Transcript of 4. TITLE AND SUBTITLE DAAD19-01-1-0587 · Farzan Parsinejad earning a Ph.D. and Christian Arcari...

2
NSN 7540-01-280-5500 Standard Form 298 (Rev.2-89) Prescribed by ANSI Std. 239-18
298-102
Enclosure 1
REPORT DOCUMENTATION PAGE
Form Approved
OMB NO. 0704-0188
Public Reporting burden for this collection of information is estimated to average 1 hour per response, including the time for reviewing instructions, searching existing data sources, gathering and maintaining the data needed, and completing and reviewing the collection of information. Send comment regarding this burden estimates or any other aspect of this collection of information, including suggestions for reducing this burden, to Washington Headquarters Services, Directorate for information Operations and Reports, 1215 Jefferson Davis Highway, Suite 1204, Arlington, VA 22202-4302, and to the Office of Management and Budget, Paperwork Reduction Project (0704-0188,) Washington, DC 20503. 1. AGENCY USE ONLY ( Leave Blank)
2. REPORT DATE 08/15/04
3. REPORT TYPE AND DATES COVERED Final Progress 15 May 01 – 14 May 04
4. TITLE AND SUBTITLE Autoignition and Burning Speeds of JP-8 Fuel at High Temperatures and Pressures
5. FUNDING NUMBERS DAAD19-01-1-0587
6. AUTHOR(S) Mohamad Metghalchi
7. PERFORMING ORGANIZATION NAME(S) AND ADDRESS(ES) Northeastern University 360 Huntington Ave., Boston, MA 02115
8. PERFORMING ORGANIZATION REPORT NUMBER DAAD19-01-1-0587 / 560280 / 3
9. SPONSORING / MONITORING AGENCY NAME(S) AND ADDRESS(ES) U. S. Army Research Office P.O. Box 12211 Research Triangle Park, NC 27709-2211
10. SPONSORING / MONITORING AGENCY REPORT NUMBER 41603.1-EG
11. SUPPLEMENTARY NOTES The views, opinions and/or findings contained in this report are those of the author(s) and should not be construed as an official Department of the Army position, policy or decision, unless so designated by other documentation. 12 a. DISTRIBUTION / AVAILABILITY STATEMENT Approved for public release; distribution unlimited.
12 b. DISTRIBUTION CODE .
13. ABSTRACT (Maximum 200 words) Experimental facilities have been designed and built for liquid injection lines in both spherical and cylindrical vessels. Heating equipments including vessel band heaters and liquid line heater along with pressure transducer and thermocouples have been added to cylindrical vessel. Burning speed of JP-8 air mixtures was measured in a range of temperature and pressure. Flame pictures have been taken in the cylindrical vessel with end glasses using a high speed CCD camera. The reults are presented in this report.
14. SUBJECT TERMS Combustion Autoignition
15. NUMBER OF PAGES 20
16. PRICE CODE
17. SECURITY CLASSIFICATION OR REPORT
UNCLASSIFIED
18. SECURITY CLASSIFICATION ON THIS PAGE
UNCLASSIFIED
19. SECURITY CLASSIFICATION OF ABSTRACT
UNCLASSIFIED
20. LIMITATION OF ABSTRACT
UL

Final Progress Report
Autoignition and Burning Speeds of JP-8 Fuel at High
Temperatures and Pressures
Submitted to:
U. S. Army Research Office
ATT: AMSRL-RO-S (IPR)
P. O. Box 12211
Research Triangle Park, NC 27709-2211
Grant No. DAAD19-01-1-0587
August 25, 2004

1. M. Matlo, F. Parsinejad and H. Metghalchi, “Schlieren and shadowgraph
images of transient expanding spherical thin flames”, Proceedings of IMECE2002: ASME International Mechanical Engineering Congress & Exposition, New Orleans, Louisiana, November 2002.
F. Rahim, M. Metghalchi, J. Keck, “Development of Reaction Mechanism and Measurement of Burning Speeds of Methane/Oxidizer/Diluent Mixtures at Low Temperatures and High Pressures”, Western States Combustion Institute, La Jolla, California, March 2002.
Farzan Parsinejad and Mohamad Metghalchi, A Mathematical Model for Schlieren and Shadowgraph Images of Transient Expanding Spherical Thin Flames, ASME International Journal of Engineering for Gas Turbines and Power, 126-2 (2004), 241-247.
Sergio Ugarte, Mohamad Metghalchi, James C. Keck, Methane Oxidation Modeling Using the Rate-Controlled Constrained-Equilibrium Method, Proceedings of the Fall technical meeting of the US Eastern Section of The Combustion Institute, Penn State, Oct., 2003.
Sergio Ugarte, Mohamad Metghalchi, James C. Keck, Methanol Oxidation
Induction Times Using the Rate-Controlled Constrained-Equilibrium Method, Proceedings of IMECE 2003 ASME International Mechanical Engineering Congress and Exposition, Washington D.C., Nov., 2003. F. Parsinejad and H. Metghalchi, “Burning Speed Measurement of JP-8 Air Flames”, Proceedings of IMECE2004: ASME International Mechanical Engineering Congress & Exposition, Anaheim, California, USA, 2004.
2. One Manuscript and five Peer Reviewed Papers. 3. One Ph.D. student, one Master’s student and one Bachelor’s degree student. 4. No inventions. 5. Experimental facilities for heating combustion chamber have been added to
the current set up. Data have been collected for liquid fuel (JP-8) and burning speed has been calculated using a thermodynamic model. Also flame pictures have been studied for any cracked or wrinkled flame structure.
6. No patents. 7. Farzan Parsinejad earning a Ph.D. and Christian Arcari earning a Master’s
degree.
REPORT DOCUMENTATION PAGE (SF298)
(Continuation Sheet)

4
Introduction
MIL-T-83133C grade JP-8 is of interest to the U.S. Army as the single fuel for the
battlefield. The conversion to JP-8 occurred primarily to improve the safety of aircraft,
although the “single fuel for the battlefield” concept (and the similarity of jet fuel to
diesel fuel) is centered on the use of aviation kerosene in all Air Force and Army aircraft
and ground vehicles. Detailed chemical kinetic mechanisms that describe combustion of
many of the components in JP-8 are not available and are unlikely to be developed in the
near future. Hence there is a need to study the characteristics of JP-8 experimentally.
The following is the final progress report on our developments and
accomplishments through May 2001- May 2004. The detail of the experimental facilities
including two combustion chambers, spherical and cylindrical, optical set up, a high
temperature oven and also our thermodynamic model used to calculate burning speed
were discussed in the last reports and will be briefly discussed here. Measurements have
been done in these facilities for gaseous and liquid fuels over the wide range of
temperature and pressure. In the last year we developed a new heating system for fuel
injection line in cylindrical vessel. The liquid fuel line in the spherical vessel was
redesigned. Burning speeds of premixed JP-8 air have been measured for a range of
temperature and pressure. Pictures of JP-8 flame have been taken using the high speed
CCD camera in the cylindrical chamber. The results are presented in this report.
Experimental Set up
The burning speed measurements were made in the existing spherical combustion
chamber. The spherical chamber consists of two hemispheric heads bolted together to
make a 15.4 cm inner diameter sphere. The chamber was designed to withstand pressures
up to 425 atm and is fitted with ports for spark electrodes, diagnostic probes, and ports
for filling and evacuating it. A thermocouple inserted through in one of the chamber ports
was used to check the initial temperature of the gas inside the chamber. A Kistler 603B1
piezo-electric pressure transducer with a Kistler 5010B charge amplifier was used to
obtain dynamic pressure vs. time records from which the burning speed was determined.
Ionization probes mounted flush with the wall located at the top and bottom of the

5
chambers were used to measure the arrival time of the flame at the wall and to check for
spherical symmetry and buoyant rise.
The spherical vessel is housed in an oven which can be heated up to 500 K.
Liquid fuel is stored in a 115 cc heated pressure vessel and is transferred through a heated
line inside the oven to the spherical chamber. Several thermocouples are located on the
line from the fuel reservoir to the vessel to monitor temperature of the fuel passageway.
A heated strain gauge (Kulite XTE-190) in the oven is used to measure partial pressure of
fuel in the vessel.
The companion cylindrical chamber is made of SAE4140 steel with an inner
diameter and length of 133.35 mm. The two end windows are 34.93 mm thick Pyrex with
a high durability against pressure and temperature shocks as well as having very good
optical properties. A Z-type Schlieren/Shadowgraph ensemble has been set up to
visualize the flame propagation. A high speed CCD camera (1108-0014, Redlake Inc.)
with a capture rate of up to 8000 frames per second is placed very close to the focal point
of the second mirror. Two band heaters and a rope heater wrapped around the cylindrical
vessel are used to heat up the inside temperature of the vessel up to 500 K. This chamber
is equipped with a heated liquid fuel line system, a pressure strain gauge and
thermocouples similar to the spherical vessel. The oven was omitted to permit flame
observation for this application.
The gas handling system used with these facilities consists of a vacuum pump for
evacuating the system and a valve manifold connected to gas cylinders for preparation of
the fuel/oxidizer/diluent mixtures. Partial pressures of the fuel mixtures were measured
using Kulite strain gauge pressure transducers in the 0-15 atm range. Two spark plugs
with extended electrodes were used to ignite the mixture at the desired location in the
chambers. An electronic ignition system controlled by the data acquisition program
provides a spark with the necessary energy. The data acquisition program synchronizes
the ignition with the dynamic pressure recording and Schlieren/Shadowgraph
photography.
The data acquisition system consists of a Data Translations 16 bit data acquisition
card, which records the pressure change of the combustion event at a rate of 250 kHz.
The analog to digital converter card receives the pressure signal from the charge
6
amplifier and the signals from the ionization probes. All signals are recorded by a
personal computer and an output data file is automatically generated. The output data
files include the dynamic pressure and its corresponding time.
The test procedure begins by evacuating the vessel and gas handling system using
the vacuum pump. The chamber then is filled with JP-8 vapor to the desired pressure and
air is added. The vessel and the fuel tank are at the same temperature during the filling.
After the chamber is filled with the proper mixture, several minutes are allowed for the
system to become quiescent before it is ignited. This will prevent any turbulence inside
the vessel. Six thermocouples on the liquid line are used to make sure that temperature
along the filling line is never below the condensation temperature for JP-8. At least three
runs at each initial condition were made to provide a good statistical sample. Based on
statistical analysis, it was found that three runs are sufficient to achieve a 95% confidence
level. Figure 1 shows the schematic of two combustion chambers.
Figure 2 shows a schematic of the liquid fuel line and the cylindrical vessel. The
liquid fuel line system is equipped with Kulite XTE-190 pressure strain gauge and
thermocouples similar to the spherical vessel. A 50 cc open liquid fuel reservoir is
connected to the vertical liquid line 15 cm above the table. Two valves are controlling the
liquid flow rate. The line forms a coil around a 7 cm diameter tube which is heated up to
500 K. This allows the liquid fuel to vaporize as it slowly moves through the coil. The
partial pressure of the fuel is monitored by the pressure gauge as it slowly occupies the
system. Figure 3 shows the fuel reservoir and heated coil on the line.
Theoretical Model
The theoretical model used to calculate burning speed from the pressure rise in a
constant volume chamber is based on one previously developed by Metghalchi and Keck
and Rahim et al with some modifications. The burning velocity is calculated by the
equation:
fuu A/xv mS &= (1)
Where:
uS : Burning velocity

7
m : Mass of the gas mixture in the chamber
uv : Specific volume of the unburned gas
x& : Mass fraction burning rate
fA : Flame area
Using the volume and energy equations, temperature and mass fraction of burned
gas are determined iteratively:
∫∫∫′
′
′′+′′+′′=1
x.l.b
x
xu
x
0b xdvxdvxdv
mV
s
(2)
xdexdexdemQ
mE
xlb
x
xu
x
b s′′+′′+′′=− ∫∫∫
′
′ 1
..0
(3)
Where: e : Specific internal energy.
E : Total initial energy of gas in the chamber.
Q : Energy transfer via heat interaction from boundary layer to the vessel and
radiation from burned gas to the wall. x : Mass fraction burned.
x′ : Total mass fraction of gases outside the boundary layer
x ′′ : Integration variable. v : Specific volume.
V : Combustion chamber volume.
The subscripts b and u refer to the burned and unburned gas respectively and
subscript b.l. and s refer to boundary layer and isentropic process.
Experimental Results
1. Gaseous Fuel, methane-air-diluent mixtures: Measurements have been done for methane-air-diluent (Extra diluent consisting
of CO2 and N2 will be added to simulate the conditions in an engine) over the pressure

8
range of 1-20 atm and temperature range of 298-650 K for equivalence ratios of 0.8-1.2.
In the approach taken here, the pressure is the primary measurement. A thermodynamic
analysis of the pressure time record that was used to calculate laminar burning speeds has
been presented in the previous report. The measured values were compared to PREMIX
code’s theoretical predictions using GRI-Mech 3.0 mechanism. As it was expected, the
agreement is very good at high temperature, low pressure condition. GRI-Mech 3.0
predicts higher values at high pressure, low temperature conditions.
Investigation of cracking or wrinkling has been done in the cylindrical chamber.
In order to observe at what pressure the flame starts to become cellular, flames have been
visualized in the cylindrical chamber. The burned gas volume and pressure relation has
been plotted in Figure 4 for different mixtures. It can be seen that the effect of
equivalence ratio, diluent percentage and initial pressure is very small on the behavior of
this curve. The final pressure achieved in the combustion chamber is different for
different mixtures.
Shadowgraph photographs of flame propagation for stoichiometric methane-air-
diluent mixtures with initial pressures of 1 atm and diluent of 0-15% (pi = 1 atm, Ti = 298
K) are shown in Figure 5. Inside the cylindrical vessel, the pressure reaches
approximately 5 times its initial value before the flame hits the wall. It can be seen that
throughout the whole experiments, the flame is smooth and spherical for all these
mixtures.
The burning speeds along isentropes for stoichiometric methane-air-diluent
mixtures with initial pressures of 1 atm and diluent of 0-15% are shown in Figure 6. The
agreement between measured values and PREMIX calculations are good. Also in this
figure, the power law fits to the experimental data have been shown along with the actual
data. It can be seen that adding diluent decreases the burning speed and the final pressure
achieved in the vessel becomes smaller. Mixtures with more diluent have lower flame
temperature and consequently lower flame speed. In mixtures with high percentage of
diluent, buoyancy can be significant. This can be detected using the ionization probes
signals. In Figure 6 all the measured values are for smooth flames, therefore the measured
values are the laminar burning speeds.

9
At high pressures, the flame front is cellular and instabilities can be observed even
at smaller radii, as shown in Figure 7a. Shadowgraph photographs of flame propagation
for stoichiometric methane-air-diluent mixtures with initial pressures of 5 atm and diluent
of 0-15% (pi = 5 atm, Ti = 298 K) are shown in Figure 7. Cellularities can be seen in
methane-air mixture with no diluent at pressures around 7-8 atmosphere. By adding
diluent to the mixture, part b-d of the figure, although the flames are still cracked, but
they do not develop to any cellular structure. By adding diluent up to 15%, cracks
become less but the effect of buoyancy can be observed.
Figure 8 shows the burning speed of stoichiometric methane-air-diluent mixture
with initial temperature of 298 K, initial pressure of 5 atmospheres and diluent range of
0-15%. Again as we increase the amount of diluent the burning speed decreases. It can be
observed that the agreement between measured values and PREMIX is good for mixtures
with 5% diluent and higher. For methane-air mixture with no extra diluent, the measured
values are higher than PREMIX. This again can be due to the instabilities in flame
structure that increases the burning rate and consequently the measured values are higher
than laminar burning speeds calculated by PREMIX. This has been verified in Figure 7a.
As it has been discussed in the previous section, the flame becomes cellular for
stoichiometric methane-air mixtures with initial pressure of 5 atm, at pressures around 7-
8 atm.
In Figure 9, the lean methane-air mixture is at higher pressure (pi = 5 atm, φ =
0.8). It can be seen in Figure 9a that at a pressure ratio (p/ pi) of 1.26, cells start to grow
on the flame surface. This might be the reason for the higher measured values than
PREMIX calculations in Figure 10. The burning speeds of cellular flames are shown by
hollow symbols in Figure 10. The effect of diluent on the measured and calculated
burning speeds along isentropes for methane-air-diluent at an equivalence ratio of φ =
0.8, initial temperature of 298 K and initial pressure of 5 atmosphere has been shown in
Figure 10. Adding diluent reduces the burned gas temperature making the flame slower
and moving it into the low temperature/high pressure regime. As can be seen, the
agreement between calculations and experimental results is poor. In the case of 0 and 5%
diluent the measured values cross the PREMIX predictions. As the amount of diluent is
increased to 10 and 15%, PREMIX predicts higher values. In order to explain this, more

10
studies of flame structure are required. In Figure 9b-d, flame propagation of methane-air-
diluent mixtures (pi = 5 atm, Ti = 298 K) with 5, 10 and 15% diluent respectively, are
shown. Instabilities can be observed around a pressure ratio of 1.6 in 9b. This could be
again the explanation for the higher measured values than PREMIX predictions for this
mixture at around the same pressure. For a methane-air mixture with 10 and 15% diluent,
the flame is stable due to excess nitrogen, which suppresses instabilities. Measurements
have been made only up to the point that flame hits the top wall. Ionization probes
mounted flush with the wall at the top and bottom of the chambers are used to measure
the arrival time of the flame at the wall and check for spherical symmetry and buoyant
rise. Adding diluent makes the flame slower and consequently the flame is buoyant and
in the some cases is also distorted.
Shadowgraph photographs of flame propagation for rich methane-air-diluent
mixtures with initial pressures of 5 atm and diluent of 0-10% (pi = 5 atm, Ti = 298 K and
φ = 1.2) are shown in Figure 11. The flames are smooth for all the mixtures with different
amount of diluent. In Figure 12, burning speeds of same methane-air-diluent mixtures at
an equivalence ratio of φ = 1.2 are shown. As is shown in this figure, PREMIX over-
predicts for mixtures with 0, 5 and 10% diluent. As can be seen in Figure 12, the
measured burning speeds at high pressures for rich methane-air mixture are lower than
PREMIX predictions. Considering Figure 11, it can be concluded that for stable flames at
high pressures, measured flame speeds are lower than PREMIX predictions. Other
investigators have also seen disagreement between measured burning speeds and
calculations using GRI-Mech 3.0 model at high pressures. For unstable flames at high
pressures, the measured values are higher than PREMIX because of higher speed of
cellular flames.
Mixtures of gaseous and liquid fuel with air have been burned in the cylindrical
vessel with new heating facility to experiment at higher initial temperatures. Flame
pictures have been taken using the Schlieren/Shadowgraph set up and high speed CCD
camera.
Figure 13 presents the flame propagation of stoichiometric propane air mixture at
initial temperature and pressure of 450 K and 1 atm, respectively. The pressure and
temperature at the end of combustion when flame hits the wall are about 7 atm and 650

11
K, respectively. Each picture is taken 3 ms after the previous one. As it is shown in the
pictures, the flame is smooth and not buoyant till it hits the wall. This supports our
assumption in burning speed measurements.
2. Liquid Fuel, JP8-air mixtures:
Flame pictures of Ethanol and air mixture are shown in Figure 14. The mixture is
stoichiometric and initial temperature is 298 K. Initial pressure is 1 atm. All pictures are
shown with 3 ms time difference from their previous one. Ethanol is liquid in room
temperature. However, its vapor pressure at room temperature is enough to make a
stoichiometric mixture. Figure 14 shows that the flame is smooth and there is no
instability till it quenches at the wall. Again there is no sign of buoyancy on the flame.
The final pressure and temperature reach to about 6 atm and 450 K.
• Burning Speed of JP-8
Burning speeds of JP-8 air mixtures at wide range of temperature, pressure and
stoichiometric ratio has been measure using the spherical vessel and pressure method.
Figure 15 shows the flame propagation of stoichiometric JP-8 and air mixture at
initial temperature and pressure of 450 K and 1 atm, respectively. Each picture shown is
taken 3 ms after its previous one. Flame propagates smoothly almost all the vessel.
Instability starts at pressure of 5 atm and temperature of 650 K. This instability shows
itself as cracks on the flame surface which turns into cellular form as pressure and
temperature rise. Again there is no buoyancy on the flame. This Figure suggests that for
higher pressures flame is likely to be cellular and not laminar.
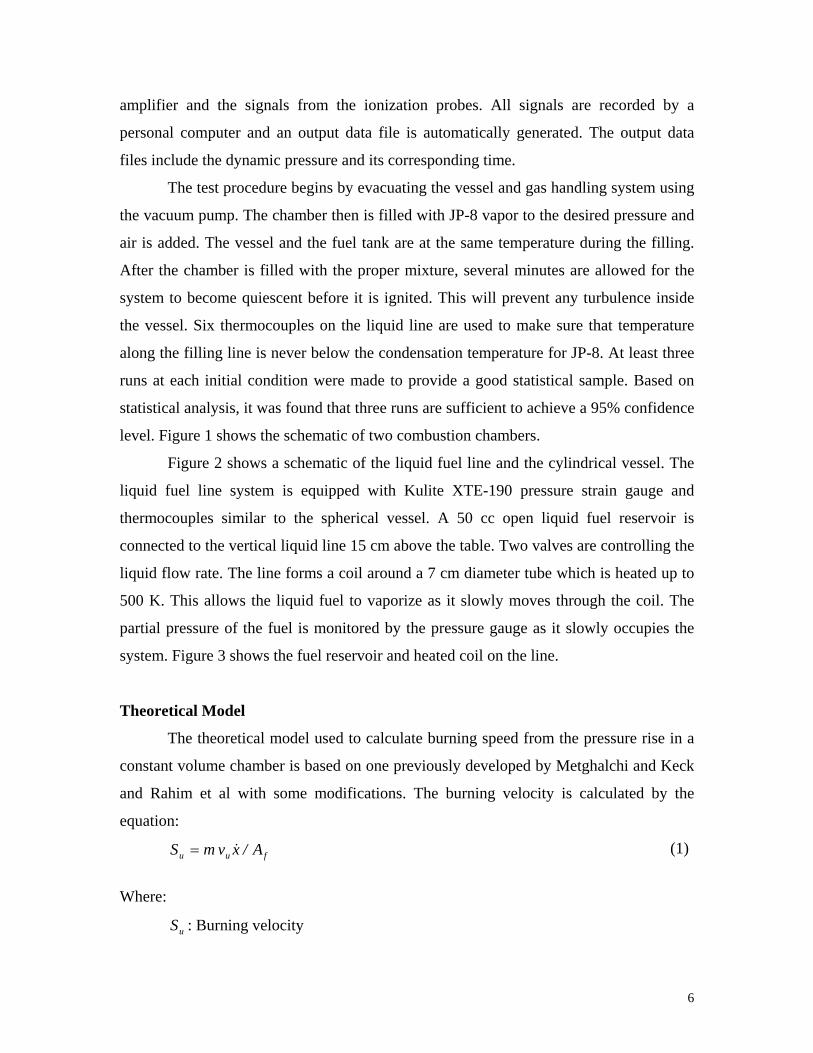
Burning speed measurements have been made in the spherical chamber using the
same thermodynamic model for JP8-air mixtures. In Figure 16, the pressure-time history
of stoichiometric JP8-air mixtures with initial temperature of 500 K and initial pressure
of 1 atmosphere. Ionization signals are also shown in this figure. The signals verify that
for this particular flame there is no buoyancy effect and flame is symmetrical.
By increasing the initial pressure to two and five atmospheres, flame becomes
slower and also slightly buoyant. The ionization signals show about 2 ms discrepancies in

12
Figures 17 and 18. Burning speed calculations have been done only up to the point that
flame hits the wall at the top.
The burning speeds vs. unburned gas temperatures calculated from the pressure
records in Figures 16-18 are shown in Figure 19. The burning speeds are shown along the
isentrope and it should be remembered that the pressure is increasing along each
isentrope. It can be also observed that by increasing the initial pressure, the burning speed
decreases. Some important results are presented in the following.
• Equivalence Ratio
The effect of equivalence ratio on burning speed can be seen in Figures 20-22.
Figure 20 shows burning speed measurements for mixtures of JP-8 and air at initial
temperature of 450 K and initial pressure of 1 atm with different stoichiometric ratios.
Note that results are plotted along the isentropes. That means the pressure values have an
isentropic relation with the unburned gas temperature.
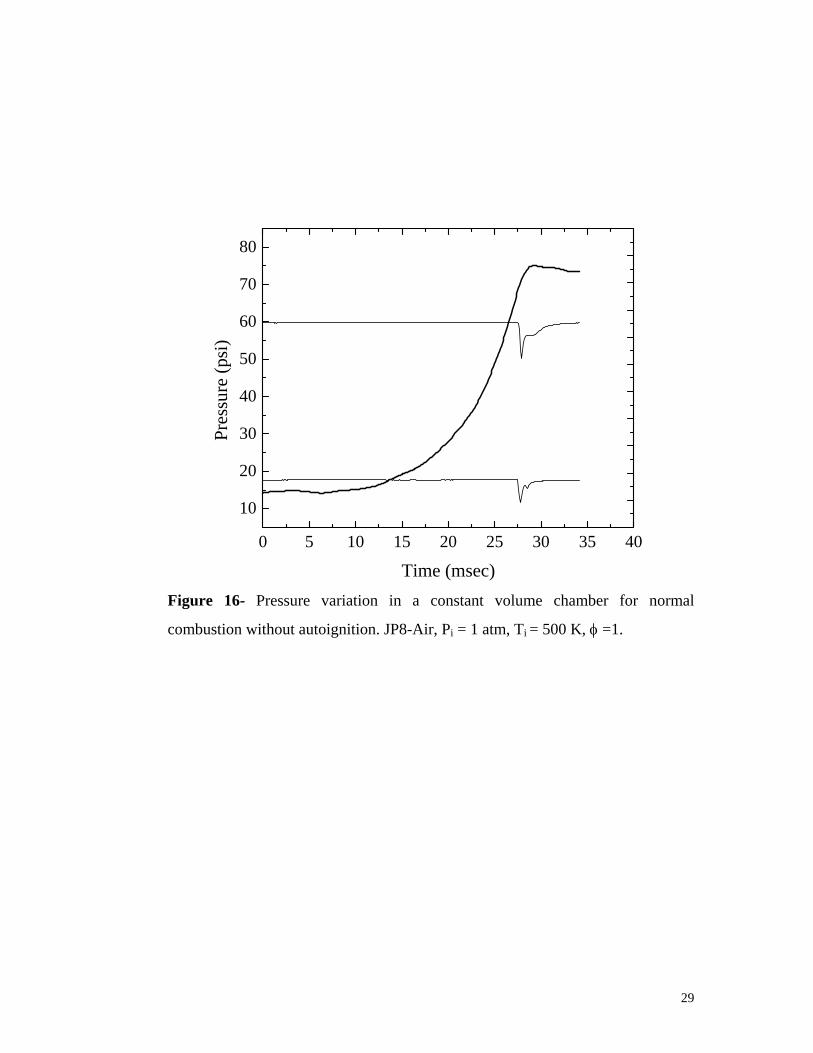
Figure 21 and 22 present the same measurements as in Figure 18 for initial
pressure of 5 atm and 9 atm respectively.
• Pressure Effect
The effect of pressure on burning speed can be seen in Figure 23. In this Figure
burning speeds for stoichiometric mixtures of JP-8 and air at initial temperature of 450 K
and various initial pressures have been plotted. It clearly shows that burning speed has an
inverse relation with pressure.
• Autoignition of JP-8
In Figure 24, the pressure-time history of stoichiometric JP8-air mixtures with
initial temperature of 450 K and initial pressure of 1 atmosphere. Ionization signals are
also shown in this figure. The signals verify that for this particular flame there is no
buoyancy effect and flame is symmetrical. However increasing the initial pressure makes
the flame speed slower and also makes the flame buoyant.
As temperature and pressure of unburned gas increase it reaches to a point that all
end gas autoignites. An example of this condition is shown in Figure 25. It can be seen
that autoignition produces the characteristic violent pressures oscillations associated with
“knock” in IC engines. In general we detect the starting point of autoignition by

13
observing the sudden pressure rise in the pressure-time history. For example as is shown
in Figure 25, autoignition happens for a stoichiometric JP-8 air mixture at initial
temperature and pressure of 500 K and 10 atm respectively where the pressure and
temperature reach 36 atm and 680 K.

14
LEGEND ASSEMBLED BOMBA - GROUNDED SPARK PLUGB - IONIZATION PROBEC - PRESSURE TRANSDUCERD - IONIZATION PROBEE - POWERED SPARK PLUGF - BOLTG - IONIZATION PROBEH - FILL HOLEI - IONIZATION PROBEJ - SILICON O-RING SLOTK - HOLES FOR SUPPORT COLUMNS
SIDE VIEW OF UPPER HEMISPHERE SIDE VIEW OF LOWER HEMISPHERE
TOP VIEW OF UPPER HEMISPHERE TOP VIEW OF LOWER HEMISPHERE
B,C
D,E
A
I
J,K,L
G,H
BAND HEATER CONNECTION
F
BAND HEATER CONNECTION
BAND HEATER CONNECTION
A
LKJ
CBIGHDE
F
BAND HEATER CONNECTION
INSULATIONINSULATION
A
A
FRONT VIEWRIGHT SIDE VIEWBOTTOM SECTION A-A
A - POWERED SPARK PLUGB - (PLUGGED)C - (PLUGGED)D - IONIZATION PROBEE - (PLUGGED)F - FILLG - (PLUGGED)H - IONIZATION PROBEI - GROUNDED SPARK PLUGJ - TEMPERATURE K - PRESSURE TRANSDUCERL - (PLUGGED)
INSULATION
GLASSSTEEL
BAND HEATER
E
DF
HG
I
LEGEND
SILICON O-RING
0.56" 2.00"
8.50" 5.30"
3.88"
8.09"
0.98"
1.88"
4.03"7.50"
R2.63"
R3.13"R4.25"
R0.27"
2.00" 0.56"
OUTER WALL OF CYLINDER
INNER WALL OF CYLINDER
GLASS3.20"
SCALE: 3 4" = 1" SCALE: 3 4" = 1"
SCALE: 3 4" = 1"
Figure 1a. (top) Schematic of 15.24 cm (6 inch) ID spherical combustion
chamber and 1b. (bottom) 13.33 cm (5.25 inch) ID cylindrical combustion
chamber, with aspect ratio of 1.

15
500 W HEATER
TO MANIFOLD
1 8" ID-1 4" OD
1 4" ID-3 8" ODP
FUEL
14" ID-3
8" OD
HEATED
Figure 2: Schematic of the liquid fuel line and the cylindrical vessel.

16
TO BUILDING AIRTUBING TO SUPPORT COIL
FUEL PIPE
BAND HEATER WITH POWER CONNECTIONS SHOWN
BRACE
TABLE
FILL POINT FOR FUEL
POWER SWITCH FOR HEATER
HEATED LINE TO CYLINDER
6.1250
10.1250
5.1250
10.1250
6.2500
2.3750
3.4295
3.8750
FRONT VIEW WITH ELECTRICAL CONNECTIONS SHOWN RIGHT SIDE VIEW
Figure 3: Fuel reservoir and heated coil on the line.

17
Figure 4- Pressure ratio vs. ratio of burned gas volume to the total volume of
combustion chamber for different mixtures of methane-air-diluent mixtures.
0.0 0.1 0.2 0.3 0.4 0.5 0.6 0.7 0.80
1
2
3
4
5
φ = 1.0, 0% dil, pi= 1 atm
p / p
i
Vb / Vt
φ = 1.2, 0% dil, pi = 5 atm φ = 0.8, 5% dil, pi = 5 atm φ = 0.8, 0% dil, pi = 5 atm

18
φ = 1.0, Pi = 1 atm,
(a) Dil =0% (b) 5% (c) 10% (d) 15%
t = 5 msec, p/pi = 1 t = 7 msec, p/pi = 1 t = 10 msec, p/pi = 1 t = 15 msec, p/pi = 1
t =15 msec, p/pi = 1.05 t = 17 msec, p/pi = 1.04 t = 25 msec, p/pi = 1.07 t = 40 msec, p/pi = 1.1
t =25 msec, p/pi =1.45 t = 30 msec, p/pi = 1.47 t = 40 msec, p/pi = 1.5 t = 53 msec, p/pi = 1.29
Figure 5- Flame propagation in cylindrical vessel, methane-air-diluent mixture, φ
=1.0, pi =1.0 atm and Ti = 298 K. (a) 0% diluent (b) 5% diluent (c) 10% diluent
(d) 15% diluent.

19
1 2 3 4 5 6 710
20
30
40
50
60
10%
15%
5%
0% diluent
Meas. Smooth Flame PREMIX Fit
S b (cm
/sec
)
p (atm)
diluent = 86% N2, 14% CO2
Figure 6- Comparison of burning speed of stoichiometric methane-air-diluent
mixtures with those determined by PREMIX code along isentropes with initial
pressure of 1 atm and initial temperature of 298 K, with different diluent
percentage.

20
φ = 1.0, Pi = 5 atm
(a) Dil = 0 % (b) 5 % (c) 10 % (d) 15 %
t = 3 msec, p/pi = 1 t = 3 msec, p/pi = 1 t = 3 msec, p/pi = 1 t = 20 msec, p/pi = 1
t = 14 msec, p/pi = 1.03 t = 19 msec, p/pi = 1.03 t = 29 msec, p/pi = 1.03 t = 80 msec, p/pi = 1.2
t = 35 msec, p/pi = 1.4 t = 50 msec, p/pi = 1.4 t = 67 msec, p/pi = 1.4 t = 110 msec, p/pi = 1.5
Figure 7- Shadowgraph pictures of flame propagation in the cylindrical chamber.
Methane-air-diluent, φ = 1.0, pi = 5.0 atm and Ti = 298 K. (a) 0% diluent (b) 5%
(c) 10% (d) 15%.
grgr

21
Figure 8- Comparison of burning speed of stoichiometric methane-air-diluent
mixtures with those determined by PREMIX code along isentropes with initial
pressure of 5 atm and initial temperature of 298 K, with different diluent
percentage.
300 320 340 360 380 400 420 440 460 4800
5
10
15
20
25
30
15%
10%
5%
0% Diluent
PREMIX
Cellular
S b (cm
/sec
)
Tu (K)
Cracked Flame

22
φ = 0.8, Pi = 5 atm
(a) Dil=0% (b) 5% (c) 10% (d) 15%
t = 20 msec, p/ pi = 1.0 t = 20 msec, p/ pi = 1.0 t = 20 msec, p/ pi = 1.02 t = 40 msec, p/ pi = 1.0
t = 30 msec, p/ pi = 1.03 t = 40 msec, p/ pi = 1.03 t = 40 msec, p/ pi = 1.02 t = 80 msec, p/ pi = 1.03
t = 40 msec, p/ pi = 1.14 t = 60 msec, p/ pi = 1.14 t = 60 msec, p/ pi = 1.06 t = 120 msec, p/ pi = 1.11
t = 50 msec, p/ pi = 1.26 t = 80 msec, p/ pi = 1.33 t = 80 msec, p/ pi = 1.13 t = 160 msec, p/ pi = 1.24
t = 60 msec, p/ pi = 1.48 t = 80 msec, p/ pi = 1.68 t = 123 msec, p/ pi = 1.41 t = 180 msec, p/ pi = 1.36
Figure 9- Shadowgraph pictures of flame propagation in the cylindrical chamber.
Methane-air-diluent mixture with φ =0.8, pi =5.0 atm and Ti = 298 K. (a) 0%
diluent (b) 5% (c) 10% (d) 15%.
grgr

23
300 320 340 360 380 400 420 440 4600
2
4
6
8
10
12
14
16
18
20
15%
10%
5%
0% Diluent
Cellalar
PREMIX
Cracked Flame
S b (cm
/sec
)
Tu (K)
Figure 10- Comparison of burning speed of methane-air-diluent mixtures, φ =
0.8, with those determined by PREMIX code along isentropes with initial
pressure of 5 atm and initial temperature of 298 K, with different diluent
percentage.

24
φ = 1.2, Pi = 5 atm
(a) Dil = 0 % (b) 5 % (c) 10 %
t= 12 msec, p/ pi = 1.0 t = 12 msec, p/ pi =1.0 t = 28 msec, p/ pi = 1.0
t = 37 msec, p/ pi = 1.07 t = 43 msec, p/ pi = 1.03 t = 92 msec, p/ pi = 1.1
t = 47 msec p/ pi =1.15 t = 93 msec, p/ pi = 1.35 t = 159 msec, p/ pi = 1.8
Figure 11- Shadowgraph pictures of flame propagation in the cylindrical
chamber. Methane-air-diluent mixture, φ =1.2, pi =5.0 atm and Ti = 298 K (a) 0%
diluent (b) 5% (c) 10%.
gr gr

25
Figure 12- Comparison of burning speed of methane-air-diluent mixtures, φ =
1.2, with those determined by PREMIX code along isentropes with initial
pressure of 5 atm and initial temperature of 298 K, with different diluent
percentage.
300 320 340 360 380 400 420 440 4600
5
10
15
20 PREMIX
Smooth Flame
S b (cm
/sec
)
Tu (K)
10%
5%
0% Diluent

26
Figure 13: Flame pictures of stoichiometric propane air mixture at initial temperature and
pressure of 450 K and 1 atm.

27
Figure 14: Flame pictures of stoichiometric Ethyl Alcohol and air mixture at initial
temperature is 298 K and initial pressure of 1 atm.

28
Figure 15: Flame propagation of stoichiometric JP-8 and air mixture at initial temperature and pressure of 450 K and 1 atm.
29
Figure 16- Pressure variation in a constant volume chamber for normal
combustion without autoignition. JP8-Air, Pi = 1 atm, Ti = 500 K, φ =1.
0 5 10 15 20 25 30 35 40
10
20
30
40
50
60
70
80Pr
essu
re (p
si)
Time (msec)

30
Figure 17- Pressure variation in a constant volume chamber for normal
combustion without autoignition. JP8-Air, Pi = 2 atm, Ti = 500 K, φ =1.
0 5 10 15 20 25 30 35 40 450
20
40
60
80
100
120
140
160Pr
essu
re (p
si)
Time (msec)

31
Figure 18- Pressure variation in a constant volume chamber for normal
combustion without autoignition. JP8-Air, Pi = 5 atm, Ti = 500 K, φ =1.
0 10 20 30 40 50 600
50
100
150
200
250
300
350
400Pr
essu
re (p
si)
Time (msec)

32
Figure 19- Comparison of burning speed of JP8-air mixtures, φ = 1.0, along
isentropes with initial pressure of 1, 2 and 5 atmospheres and initial temperature
of 500 K.
450 500 550 600 650 700 7500.0
0.2
0.4
0.6
0.8
1.0
1.2
1.4S b (m
/sec
)
Tu (K)
φ = 1, Ti = 500 K, pi = 1 atm φ = 1, Ti = 500 K, pi = 2 atm φ = 1, Ti = 500 K, pi = 5 atm

33
450 500 550 600 650
0.5
0.6
0.7
0.8
0.9
Bur
ning
Spe
ed (m
/sec
)
Unburned Gas Temperature (K)
φ = 1 φ = 0.9 φ = 0.7
P/P0 = (T/T0)γ /γ −1
Figure 20: Burning speed measurements for mixtures of JP-8 and air at initial
temperature of 450 K and initial pressure of 1 atm

34
450 500 550 600 650
0.2
0.3
0.4
0.5
0.6
0.7P/P0 = (T/T0)
γ /γ −1
Bur
ning
Spe
ed (m
/sec
)
Unburned Gas Temperature (K)
φ = 1 φ =0.8 φ = 0.7
Figure 21: Burning speed measurements for mixtures of JP-8 and air at initial
temperature of 450 K and initial pressure of 5 atm
35
450 500 550 600 650
0.150.200.250.300.350.400.450.500.550.600.650.700.750.80
P/P0 = (T/T0)γ /γ −1
Bur
ning
Spe
ed (m
/sec
)
Unburned Gas Temperature (K)
φ = 1 φ = 0.8 φ = 0.7
Figure 22: Burning speed measurements for mixtures of JP-8 and air at initial
temperature of 450 K and initial pressure of 9 atm

36
450 500 550 600 6500.3
0.4
0.5
0.6
0.7
0.8
0.9
Bur
ning
Spe
ed (m
/sec
)
Unburned Gas Temperature (K)
Pi = 1 atm Pi = 5 atm Pi = 10 atm
Figure 23: Burning speed measurements for stoichiometric mixtures of JP-8 and
air at initial temperature of 450 K.

37
0 50 100 150 200 250
10
20
30
40
50
60
70
80
Pres
sure
(psi
)
Time (ms)
Pressure
6.0
6.5
7.0
7.5
Vol
ts Bottom Ionization Probe Bottom Ionization Probe Top Ionization Probe
Figure 24: Pressure variation in a constant volume chamber for normal combustion
without autoignition. JP8-Air, Pi = 1 atm, Ti = 450 K, φ =1.

38
0 100 200 300 400 500100
200
300
400
500
600
700
800
Pres
sure
(psi
)
Time (ms)
Sudden Pressure RiseP = 525 psi
Figure 25: Pressure variation in a constant volume chamber for combustion with
autoignition. JP8-Air, Pi = 10 atm, Ti = 500 K, φ =1.

39
Biographical Sketch NAME: Mohamad (Hameed) Metghaclchi POSITION TITLE: Professor, Mechanical and Industrial Engineering Department Chair Research and Professional Experience:
Mohamad (Hameed) Metghalchi received his Bachelor of Science in Mechanical
Engineering from Oklahoma University in 1975. He received Masters and Doctor of
Science Degree in Mechanical Engineering from Massachusetts Institute of Technology
in 1977 and 1980 respectively. In fall of 1979, he joined department of Mechanical
Engineering at Northeastern University. Professor Metghalchi is Chair of Mechanical and
Industrial Engineering Department.
Professor Metghalchi is an active member of national societies, such as, the
American Society of Mechanical Engineers, the American Society of Engineering
Education, the Society of Automotive Engineers and the Combustion Institute. He is a
Fellow of ASME and chair of ASME Advanced Energy System Division. He is an
Associate Editor of ASME Journal of Energy Resources Technology. He is a member of
the Editorial Board of the International Journal of Exergy. He is also a member of the
Scientific Council of International Center for Applied Thermodynamics. He has been
proposal and scientific paper reviewer for the National Science Foundation, Combustion
Science Technology, Combustion Institute, Combustion and Flame, ASME Journal of
Energy Resources Technology, ASME Journal of Engineering for Gas Turbine and
Power, Biotechnology and American Chemical Society- the Petroleum Research Fund.
Professor Metghalchi’s research is in the area of thermofluids dealing with
scientific issues in Combustion, fluid mechanics, thermodynamics, heat transfer and
chemical reactions. Professor Metghalchi has supervised 10 Ph.D. theses and 19 M. Sc.
theses at Northeastern University. Currently, six graduate students are working under his
supervision. Professor Metghalchi has published extensively in education and research in
the last twenty five years.

40
Relevant Publications
[1] M. Metghalchi, J. C. Keck, "Laminar Burning Velocity of Propane-Air Mixtures
at High Temperature and Pressure." Combustion and Flame 38: 143-154, 1980.
[2] M. Metghalchi, J. C. Keck, "Burning Velocities of Mixtures of Air with
Methanol, Isooctane and Indolence at High Pressure and Temperature."
Combustion and Flame 48: 191-210, 1982.
[3] Elia, M., Moore,P., Ulinski, M., and Metghalchi,M., “Laminar Burning Velocity
of Methane-Oxygen-Argon (CH4-O2-Ar) Mixtures”. Proceedings of the ASME
Internal Combustion Engine Division, Columbus Indiana, ICE-Vol. 32-2, 1999.
[4] Elia, M., Ulinski, M. and Metghalchi, M., “Laminar Burning Velocity of
Methane-Air-Diluent Mixtures”. ASME Journal of Engineering for Gas Turbines
and Power, January 2001, Vol.190-196.
[5] F. Rahim, M. Metghalchi, “Burning Velocity for Spherical Flames in Cylindrical
and Spherical Chambers”, Eastern States Combustion Institute, December 2001.
[6] Rahim, F., Metghalchi, M., “Development of Reaction Mechanism and
Measurement of Burning Speeds of Methane/Oxidizer/Diluent Mixtures at Low
Temperatures and High Pressures”, Western States Combustion Institute, March
2002.
[7] Rahim, F., M. Elia, M. Ulinski and M. Metghalchi, “Burning Velocity
Measurements of Methane-Oxygen-Argon Mixtures and Its Application to Extend
the Methane-Air Burning Velocity Measurements”, International Journal of
Engine Research, Vol. 3, No 2, June 2002.

41
[8] Parsinejad, F., Matlo, M., Metghalchi, M., “A mathematical Model for Schlieren
and Shadowgraph Images of Transient Expanding Spherical Thin Flames”,
ASME Journal Engineering for Gas Turbines and Power, 126-2 (2004), 241-247.
[9] Parsinejad, F., Arcari, C., Shirk, E. and Metghalchi, M., “Burning Speed
Measurements of JP-8 Air Flames”, Proceeding of ASME International
Mechanical Engineering Congress and Exposition, Anaheim, CA, 2004.
Other Publications
[1] R. Law, M. Metghalchi, and J. C. Keck, "Rate-Controlled Constrained
Equilibrium calculations of Ignition Delay Times in Hydrogen-Oxygen
Mixtures." Twenty-Second Symposium (International) on Combustion, 1988, p.
1705.
[2] P. Bishnu, D. Hamiroune, M. Metghalchi, and J.C. Keck, “Constrained-
Equilibrium Calculations for Chemical Systems Subject to Generalized Linear
Constraints Using the NASA and STANJAN Equilibrium Programs”.
Combustion Theory and Modelling 1 (1997) 295-312.
[3] Hamiroune, D., Bishnu, P., Metghalchi, M. and Keck J.C. “Rate-Controlled
Constrained-Equilibrium Method Using Constraint Potentials,” Combustion
Theory and Modelling 2 (1998) 81-94
[4} Hui,H., Metghalchi,M., and Keck,J.C. “Estimation of the Thermodynamic
Properties of Unbranched Hydrocarbons”. Journal of Energy Resources
Technology, March 1999, Vol. 121, 45-50.
[5] Hui, H., Metghalchi, M., and Keck, J. C., “Estimation of the Thermodynamic
Properties of Branched Hydrocarbons”. ASME Journal of Energy Resources,
September 2000, Vol. 122, 147-152.

42
B. List of persons, other than those cited in the publication list, who have collaborated on
a project or a book, article, report or paper within the last 4 years. Negative reports
should be indicated.
Collaborator: None
C. Names of graduate and Post graduate advisors and advisees.
Graduate Advisor: James C. Keck
Doctoral Theses Advisees: Robert Law, Abdolgania Jimoh,
Djamel Hamiroune, Partha Bishnu,
Hui He, Faranak Rahim, Sergio Ugarte Post Doctoral Advisees: Faranak Rahim