4 the Individual - Architects' Council of Europe · Arundel:est Susse 18 0DE United ingdom...
21
Architects - the Individual Architect: Miran Kambic Project: Podcetrtek Sports Hall Photographer: Miran Kambic Place: Podcetrtek – Slovenia 4
Transcript of 4 the Individual - Architects' Council of Europe · Arundel:est Susse 18 0DE United ingdom...

4Architects -the Individual
Architect: Miran Kambic Project: Podcetrtek Sports Hall Photographer: Miran Kambic Place: Podcetrtek – Slovenia
4

Mirza & Nacey Reserach LtdSouthdown HouseFord Lane, FordArundelWest SussexBN18 0DEUnited Kingdom
Telephone: +44 1243 555302email: [email protected]
MIRZA & NACEY RESEARCH
Registered office: Southdown House, Ford Lane, Ford, Arundel, West Sussex BN18 0DE. Registered in England and Wales. Company No. 04618115
4.1 EarningsThe average earnings figure for Europe is almost identical in 2014 to that of 2012. Architects’ earnings record an average (adjusted for PPP) of €29 070 before tax.
The rate of decline in earnings seen between 2008 and 2010 eased considerably between 2010 and 2012. Although the direction was still downwards, the rate of decline was much slower. These latest figures for 2014 suggest that earnings have stabilised at 2012 levels.
This is the Europe-wide pattern; different countries show different trends. Between the 2012 and 2014 surveys average earnings have fallen the most in Turkey, the United Kingdom and Germany; while the highest rises are recorded by architects in Spain and Italy, but from a lower base.
CHART 4-2Range of average earnings (all full-time architects), adjusted for PPP
CHART 4-1Change in architects’ average earnings (all survey countries), 2008-14
The adjustment of average earnings for PPP takes account of differing price levels in the 26 surveyed countries, adjusting each country’s average earnings figure by its purchasing power parity (PPP) index.
These adjusted figures show average earnings are highest in Switzerland, Luxembourg, Germany, Denmark and Austria. Average adjusted earnings are lowest in Bulgaria, Romania and Latvia.
0
5000
10000
15000
20000
25000
30000
35000
2014201220102008
aver
age
earn
ings
€ a
djus
ted
for P
PP
4 - 48The Architectural Profession in Europe 2014

Mirza & Nacey Reserach LtdSouthdown HouseFord Lane, FordArundelWest SussexBN18 0DEUnited Kingdom
Telephone: +44 1243 555302email: [email protected]
MIRZA & NACEY RESEARCH
Registered office: Southdown House, Ford Lane, Ford, Arundel, West Sussex BN18 0DE. Registered in England and Wales. Company No. 04618115
€ average earnings 2014 average earnings adjusted for PPP
adjusted for PPP unadjusted for PPP 2012 2010 2008
Austria 42 095 45 000 42 174 38 925 47 337Belgium 30 192 33 000 28 354 28 384 28 222Bulgaria* 9 506 4 601 12 030 14 555 n/aCroatia 17 946 12 293 18 078 18 892 n/aCzech Republic* 13 150 9 284 19 410 21 268 n/aDenmark 43 187 60 289 42 543 37 843 39 012Estonia* 22 215 17 750 12 776 15 318 36 084Finland 40 486 50 000 38 339 35 601 32 327France 27 498 30 000 27 326 28 871 33 241Germany 43 350 45 000 46 422 39 932 38 797Greece 16 145 14 450 18 927 20 534 26 846Ireland 38 103 45 000 36 847 40 200 52 209Italy 27 132 28 000 24 248 18 779 n/aLatvia* 7 795 5 550 n/a n/a n/aLuxembourg 48 701 60 000 46 267 n/a 44 484Malta* 36 478 30 000 32 051 n/a 34 447Netherlands* 44 500 49 000 n/a n/a n/aPortugal 13 433 11 900 13 714 n/a n/aRomania 9 822 5 648 10 844 8 172 22 748Slovakia 15 581 11 000 n/a 16,378 n/aSlovenia* 19 808 16 500 17 964 29 240 31 491Spain 28 354 28 000 20 534 n/a n/aSweden 35 890 46 585 35 649 36 612 29 990Switzerland 54 608 83 904 n/a n/a n/aTurkey 19 213 12 335 24 902 21 432 20 486United Kingdom 37 582 48 749 48 242 45 922 45 014
2014 EUROPE-26** (25 in 2012, 23 in 2010 and 17 in 2008)
29 070 30 000 29 014 29 493 34 003
TABLE 4-1Average earnings of full-time Architects analysed by country
* caution - small sample Netherlands: BNA Benchmark Research 2014 ** 2014 EUROPE-26 ‘unadjusted’ figure is a weighted average and takes account of the number of architects in each participating country. The ALL Europe figure is not weighted.
CHART 4-3Average earnings, all full-time architects, ADJUSTED for Purchasing Power Parity (PPP)
average earnings, € adjusted for PPP0 10000 20000 30000 40000 50000 60000
Latvia
Bulgaria
Romania
Czech Republic
Portugal
Slovakia
Greece
Croatia
Turkey
Slovenia
Estonia
Italy
France
Spain
Belgium
Sweden
Malta
United Kingdom
Ireland
Finland
Austria
Denmark
Germany
Netherlands
Luxembourg
Switzerland
4 - 49The Architectural Profession in Europe 2014

Mirza & Nacey Reserach LtdSouthdown HouseFord Lane, FordArundelWest SussexBN18 0DEUnited Kingdom
Telephone: +44 1243 555302email: [email protected]
MIRZA & NACEY RESEARCH
Registered office: Southdown House, Ford Lane, Ford, Arundel, West Sussex BN18 0DE. Registered in England and Wales. Company No. 04618115
4.2 Earnings by Field of Employment
* caution - small sample Netherlands: BNA Benchmark Research 2014Earnings data converted from local currencies to Euros, exchange rate as at 01.05.14 and then adjusted for PPP
TABLE 4-2Average earnings analysed by country and field of employment (adjusted for PPP)
€ sole principal
partner/ director
ALL Prin-cipals
private practice salaried
freelance other private
ALL private
local / central gov’t
other public
ALL public
Austria 42 095 48 831 42 095 41 066 29 467 n/a 42 095 n/a n/a n/aBelgium 32 022 41 171 35 682 32 479 25 618 27 447 29 277 29 277 37 420 36 597Bulgaria* 21 125 7 183 11 619 7 149 15 844 n/a 9 506 10 985 n/a 10 985Croatia 23 033 17 946 18 426 16 123 n/a n/a 17 275 21 178 n/a 20 730Czech Republic* n/a n/a n/a 6 962 n/a n/a 12 892 n/a n/a n/aDenmark 38 388 57 583 50 673 38 580 49 089 46 066 43 187 40 308 46 066 42 707Estonia* 44 431 16 270 35 044 22 215 n/a n/a 25 031 n/a n/a n/aFinland 40 081 65 844 43 198 37 045 n/a 41 296 40 486 41 093 42 105 41 700France 27 498 41 247 27 498 27 498 20 599 27 956 27 498 37 122 38 524 37 149Germany 53 202 68 966 59 113 35 468 66 010 55 194 41 379 52 217 54 187 52 956Greece 13 408 33 520 14 525 14 749 11 173 15 084 14 608 24 134 21 587 23 061Ireland 29 636 38 103 30 483 36 410 19 052 n/a 33 870 57 197 59 272 58 002Italy 29 070 34 884 29 070 26 453 19 380 25 194 27 326 29 070 25 194 27 132Latvia* 26 966 6 004 9 965 4 705 n/a 8 427 8 006 1 489 n/a n/aLuxembourg 45 455 56 818 48 701 38 961 46 266 48 701 48 701 n/a n/a n/aMalta* 31 447 72 327 37 736 27 358 50 314 36 478 33 287 34 591 50 314 38 994Netherlands* 36 300 63 600 50 000 36 300 45 400 43 200 40 900 40 900 50 000 43 100Portugal 14 343 16 453 16 279 10 523 12 694 12 791 12 558 19 558 19 070 19 558Romania 12 502 11 787 11 787 4 000 n/a 6 286 9 822 n/a 12 180 7 858Slovakia 14 164 15 742 14 164 18 414 14 062 27 995 15 581 17 928 14 164 16 613Slovenia* 28 812 17 287 18 607 15 846 24 010 n/a 18 607 n/a n/a n/aSpain 31 646 25 316 26 371 31 646 21 097 25 316 26 371 42 514 37 975 42 141Sweden 42 298 53 407 49 562 34 864 n/a 43 016 42 469 47 033 42 726 46 998Switzerland 57 842 63 100 63 100 44 433 37 860 57 842 52 583 71 513 n/a 71 513Turkey 40 561 50 701 45 364 14 410 21 081 19 213 19 213 23 056 17 879 19 854United Kingdom 32 213 53 688 42 951 38 656 n/a 67 647 41 609 45 098 48 320 47 7832014 EUR-26 29 070 38 760 31 977 28 571 19 380 29 636 29 070 31 159 31 372 31 2242012 EUR-25 29 098 39 767 29 098 28 167 19 399 29 098 28 487 32 004 29 098 30 8072010 EUR-23 30 144 40 000 33 364 27 556 25 416 32 517 29 852 34 223 27 556 31 9572008 EUR-17 37 895 43 605 38 952 30 182 29 070 43 605 34 597 33 915 26 964 32 131
CHART 4-4Earnings by field of employment (adjusted for PPP)
aver
age
earn
ings
€' a
djus
ted
for P
PP
other
publi
c
local
autho
rity /
gove
rnmen
t
other
priva
te
freela
nce
salar
ied
priva
te pr
actic
e
partn
er / d
irecto
r
sole
princ
ipal
0
5000
10000
15000
20000
25000
30000
35000
40000
other publiclocal authority /government
other privatefreelancesalariedprivate practice
partner / directorsole principal
Highest average earnings are recorded by Partners / Directors (€38 760 adjusted for PPP). Their pay is clearly ahead of that of any other field of employment in the majority of countries.
The closest rival to Partners/Directors’ earnings come from the public sector. The figures suggest there is overall very little difference in the pay between local/central government and other parts of the public sector. In some countries, such as Ireland and Spain (and also Bulgaria, but small sample) architects working in the public
4 - 50The Architectural Profession in Europe 2014

Mirza & Nacey Reserach LtdSouthdown HouseFord Lane, FordArundelWest SussexBN18 0DEUnited Kingdom
Telephone: +44 1243 555302email: [email protected]
MIRZA & NACEY RESEARCH
Registered office: Southdown House, Ford Lane, Ford, Arundel, West Sussex BN18 0DE. Registered in England and Wales. Company No. 04618115
4.3 Earnings by Age
CHART 4-5Average earnings by age (adjusted for PPP)
€ 2014 2012 EUROPE-25
MEDIAN
2010 EUROPE-23
MEDIAN
2008 EUROPE-17
MEDIANlower quartile MEDIAN upper quartile
<30 7 505 14 241 27 690 14 549 15 615 17 041
30-34 6 344 14 763 24 380 19 399 24 550 29 214
35-39 15 081 30 189 47 451 24 902 30 075 34 677
40-44 18 269 32 704 51 329 29 098 33 364 38 760
45-49 21 384 38 611 62 893 33 800 33 364 39 729
50-54 25 157 44 025 72 502 36 081 34 317 42 391
55-59 22 642 44 824 72 502 38 797 35 119 43 647
60-64 22 026 48 264 75 472 41 370 40 875 41 890
65+ 14 535 29 151 50 248 37 354 36 095 n/a
TABLE 4-3Average earnings analysed by age (adjusted for PPP)
aver
age
earn
ings
€ a
djus
ted
for P
PP
65 an
d ove
r
60-6
455
-59
50-5
445
-49
40-4
435
-39
30-3
4
unde
r 30
0
10000
20000
30000
40000
50000
65 and over60-6455-5950-5445-4940-4435-3930-34under 30
group - a repeat of the pattern seen in 2012. More noticeable this year however is the jump at age 35, where average earnings appear to double between age 30-34 and 35-39.
The peak earning age continues to be age 60-64. This was the case in 2012 and 2010, although in 2008 the peak occurred at age 55-59. Compared with the 2012 survey, average earnings have improved amongst architects aged 35 upwards, while they are lower than in 2012 for architects aged under 35. Falling average earnings for architects under 35 has been the pattern now since the first survey in 2008. For architects aged 35 to 44, average earnings in 2014 have improved to reach 2010 levels; while for older architects their average earnings are returning to the same levels recorded in the 2008 survey.In all cases, figures quoted are based on data which has been adjusted for PPP.
sector report average earnings at least 50 per cent higher than Partners/Directors. While in Switzerland, Portugal and Croatia, public sector architects’ average earnings are also higher than those of Partners/Directors, but by less - around 10 to 15 per cent.
Elsewhere within private practice, the greatest difference between average earnings of Partners/Directors and salaried staff is recorded in Turkey and Romania. Here, salaried architects receive about one third the earnings of Principals. Denmark and Luxembourg emerge as having relatively high average salaries amongst Freelance architects, compared with other fields of employment. In nearly all countries, Sole Principals earn more than salaried architects in private practice. Sole Principals in Greece, Ireland and the United Kingdom are notable exceptions.
Compared with the 2012 survey, average earnings are unchanged for Sole Principals, but have fallen slightly, by 2.5 per cent, for Partners/Directors. By contrast, the average earnings recorded by private practice salaried staff have increase slightly, by 1.4 per cent. Average salaries reported by freelance architects are unchanged. Architects working in the public sector report a rise of 1.4 per cent although this masks a larger rise amongst ‘other public’ sectors but a fall amongst architects working for local or central government.
Architects’ average earnings rise in line with age, peaking at age 60 to 64. The rise to the peak value is consistent for each five year age
4 - 51The Architectural Profession in Europe 2014

Mirza & Nacey Reserach LtdSouthdown HouseFord Lane, FordArundelWest SussexBN18 0DEUnited Kingdom
Telephone: +44 1243 555302email: [email protected]
MIRZA & NACEY RESEARCH
Registered office: Southdown House, Ford Lane, Ford, Arundel, West Sussex BN18 0DE. Registered in England and Wales. Company No. 04618115
4.4 Earnings by Gender
* full-time equivalent (FTE) based on converting part-time earnings to a working week of 37.5 hours
€ 2014 2012 EUROPE-26
MEDIAN
2010 EUROPE-23
MEDIAN
2008 EUROPE-17
MEDIANlower quartile MEDIAN upper
quartile
Full time male 17 442 32 213 50 865 30 948 32 149 38 760
female 9 690 24 225 38 424 21 680 21 866 26 620
Part time FTE* male 15 141 30 105 49 777 34 099 37 936 30 431
female 12 716 23 750 37 367 24 137 25 862 24 225
TABLE 4-4Average earnings analysed by gender and full-time or part-time working (adjusted for PPP)
As in previous surveys, a considerable differential remains between the average earnings of male and female architects. This year’s survey shows full-time male architects earn 33 per cent more than full-time women; for part-time architects, men earn 27 per cent more than women. But the trend shows this differential - although still significant - is in decline. In the 2012 survey full-time men earned 43 per cent more than women, 47 per cent more in 2010 and 46 per cent more in 2008.
The part-time average earnings figures have been grossed up to represent full-time equivalence (FTE). For both men and women, average part-time earnings are lower than full-time. For male architects, part-timers earn 7 per cent less than their full-time colleagues, while for women there is almost parity: part-time architects earn just 2 per cent less than those working full-time.
0
5000
10000
15000
20000
25000
30000
35000
aver
age
earn
ings
€ a
djus
ted
for P
PP
female
male
CHART 4-6Average earnings of male and female Architects, working full-time (adjusted for PPP)
CHART 4-7Change in male / female architects’ average earnings (all survey countries), 2008-14
0
10000
20000
30000
40000
2014201220102008
aver
age
earn
ings
€ a
djus
ted
for P
PP
male
female
4 - 52The Architectural Profession in Europe 2014

Mirza & Nacey Reserach LtdSouthdown HouseFord Lane, FordArundelWest SussexBN18 0DEUnited Kingdom
Telephone: +44 1243 555302email: [email protected]
MIRZA & NACEY RESEARCH
Registered office: Southdown House, Ford Lane, Ford, Arundel, West Sussex BN18 0DE. Registered in England and Wales. Company No. 04618115
per cent / number
architects who have worked in another
European country in last 12 months (%)
of whom: number of countries working in for... have seriously
considered working in another country, last 12 months (%)
architects part/wholly educated in different country from the one in which principally
established (%)
short periods (up to16 weeks)
longer periods (>16 weeks) or on-going work
Austria 15 1.8 1.8 23 21Belgium 10 1.1 1.2 15 20Bulgaria* 4 2.0 0.0 23 15Croatia 4 1.7 1.0 50 28Czech Republic* 8 n/a 1.0 38 23Denmark 7 1.3 1.0 18 26Estonia* 10 1.0 n/a 15 25Finland 2 1.2 0.0 15 23France 3 1.1 0.7 14 19Germany 7 1.2 0.9 19 23Greece 4 2.0 1.6 57 54Ireland 13 1.6 0.8 28 37Italy 3 1.3 1.0 45 10Latvia* 6 n/a 2.0 24 17Luxembourg 29 1.1 1.2 32 90Malta* 0 n/a n/a 27 35Netherlands* 7 1.5 1.2 25 20Portugal 6 0.9 0.5 55 26Romania 3 0.7 0.5 34 19Slovakia 9 1.1 0.9 31 19Slovenia* 15 0.8 1.0 33 25Spain 4 1.6 1.2 46 18Sweden 6 1.0 0.5 34 34Switzerland 10 1.1 1.0 13 31Turkey 3 1.3 1.7 42 17United Kingdom 8 1.4 1.1 20 162014 EUROPE-26** 5 1.3 1.0 35 182012 EUROPE-25** n/a n/a n/a 35 n/a2010 EUROPE-23 n/a n/a n/a n/a n/a2008 EUROPE-17 n/a n/a n/a n/a n/a
TABLE 4-6Proportion of architects who have worked in another European country in the last 12 months
* caution - small sample Netherlands: BNA Benchmark Research 2014 n/a = question not asked ** total figure is a weighted average and takes account of the number of architects in each participating country
This question area has been newly expanded for 2014. In previous years, we obtained an estimate of the level of architects working in another country, by comparing the country in which respondents are registered with where their current office is. This showed that around 3 per cent were working in a different country from the one in which they were registered (2.3 per cent in 2014).
This year’s new question asks directly whether the respondent has worked in another country in the last 12 months. The findings show that overall 5 per cent of respondents have done so, including more than 10 per cent of architects in Luxembourg, Austria, and Ireland.
On average, most of the architects who have worked in another European country in the last 12 months have worked in just one country for either short periods or longer periods of time.
4.5 Working in another European country
per cent
architects working / resident in different country from
the one in which principally established (%)
2014 EUROPE-26 2.32012 EUROPE-25** 2.92010 EUROPE-23** 3.42008 EUROPE-17** 7.0
TABLE 4-5Proportion of architects working in a different country from where registered
* see left for table footnotes
4 - 53The Architectural Profession in Europe 2014

Mirza & Nacey Reserach LtdSouthdown HouseFord Lane, FordArundelWest SussexBN18 0DEUnited Kingdom
Telephone: +44 1243 555302email: [email protected]
MIRZA & NACEY RESEARCH
Registered office: Southdown House, Ford Lane, Ford, Arundel, West Sussex BN18 0DE. Registered in England and Wales. Company No. 04618115
Many more architects have “seriously considered” working in another country in the last 12 months: 35 per cent. Highest proportions are recorded in Greece, Portugal and Croatia (50 per cent or more) while more than 40 per cent of architects in Italy, Spain and Turkey have considered working elsewhere.
Another new question for 2014 reports on how many architects undertook part of their architectural education in another European country. Overall,18 per cent of respondents studied in a different European country from the one in which they are now principally established. The highest proportion is recorded by architects in Luxembourg (90 per cent) and in Greece (54 per cent).
There is some relationship between having been educated in another country and seriously considering working in another country. There are strong correlations for Greece (54 per cent and 57 per cent respectively), Sweden (34 per cent for both) and Ireland (37 and 28 per cent). Portugal also shows a correlation, although here the relationship is the opposite from that in the previously mentioned countries, so more architects have seriously considered working in another country (55 per cent) than were at least partly educated in another country (26 per cent).
CHART 4-8Architects who were at least partly educated in another European country, compared with architects who have seriously considered worked in another European country
per cent architects0 20 40 60 80 100
Italy
Bulgaria
United Kingdom
Turkey
Latvia
Spain
Slovakia
Romania
France
Netherlands
Belgium
Austria
Germany
Finland
Czech Republic
Slovenia
Estonia
Portugal
Denmark
Croatia
Switzerland
Sweden
Malta
Ireland
Greece
Luxembourg
seriously considered working in another European country in the last 12 months
part or all of architectural education undertaken in another European country
4 - 54The Architectural Profession in Europe 2014

Mirza & Nacey Reserach LtdSouthdown HouseFord Lane, FordArundelWest SussexBN18 0DEUnited Kingdom
Telephone: +44 1243 555302email: [email protected]
MIRZA & NACEY RESEARCH
Registered office: Southdown House, Ford Lane, Ford, Arundel, West Sussex BN18 0DE. Registered in England and Wales. Company No. 04618115
4.6 Main concerns about working in another country
per cent unable to find work
insufficient language
skills
insufficient knowledge of planning / building
regulations
architectural qualification
issues
practical, relocation
or personal issues
knowledge of local market
knowledge of local fee
scales / tariffs
PII cover for work in other
European countries
Austria 10 17 40 6 35 34 14 13Belgium 13 25 48 10 41 41 18 10Bulgaria* 26 36 53 13 43 38 21 13Croatia 13 35 51 21 63 21 15 8Czech Republic* 8 38 69 15 46 15 8 8Denmark 12 13 25 5 44 13 8 5Estonia* 26 16 53 5 53 32 16 5Finland 16 21 38 4 48 25 13 9France 18 45 47 9 47 48 18 16Germany 6 34 45 8 48 24 18 16Greece 43 23 40 14 56 26 11 11Ireland 21 44 39 6 53 30 15 12Italy 12 43 28 6 64 25 5 6Latvia* 26 29 50 9 29 44 12 12Luxembourg 10 7 33 12 32 32 8 18Malta* 26 10 38 11 54 28 15 17Netherlands* 12 12 40 11 51 26 9 5Portugal 31 25 26 7 49 18 6 6Romania 24 15 41 22 58 36 15 23Slovakia 16 48 49 6 35 34 17 11Slovenia* 32 23 57 19 57 25 8 8Spain 37 51 43 18 26 27 7 11Sweden 10 14 19 6 38 14 3 3Switzerland 11 12 29 11 46 21 15 9Turkey 36 41 29 27 27 20 7 5United Kingdom 25 50 43 11 40 31 18 162014 EUROPE-26 18 38 37 11 47 26 11 102012 EUROPE-25 19 39 35 11 66 n/a n/a n/a2010 EUROPE-23 n/a n/a n/a n/a n/a n/a n/a n/a2008 EUROPE-17 n/a n/a n/a n/a n/a n/a n/a n/a
The biggest concern for architects about working in another country is practical, relocation or personal issues. Almost half (47 per cent) of architects responding to this question thought this was a major concern. Particularly high proportions of architects in Italy, Croatia, Greece and Romania thought this was a major concern. Insufficient language skills were considered to be the main concern for a majority of architects in Spain and the United Kingdom, while 37 per cent overall were concerned about their knowledge of planning or building regulations. For about 30 per cent, or more, of architects in Greece, Portugal and Turkey a main concern was that they had been unable to find work in another European country. Knowledge of the local market was a main concern for almost half of French respondents.
TABLE 4-7Main concerns about working in another country cited by responding architects
per cent architects 0 10 20 30 40 50
PII insurance
fee scale knowledge
qualification
unable to find work
market knowledge
building regulations knowledge
language
relocation / personal
CHART 4-9Main concerns about working in another country
* caution - small sample Netherlands: BNA Benchmark Research 2014 2012/10/08 n/a = question was not asked
4 - 55The Architectural Profession in Europe 2014
Mirza & Nacey Reserach LtdSouthdown HouseFord Lane, FordArundelWest SussexBN18 0DEUnited Kingdom
Telephone: +44 1243 555302email: [email protected]
MIRZA & NACEY RESEARCH
Registered office: Southdown House, Ford Lane, Ford, Arundel, West Sussex BN18 0DE. Registered in England and Wales. Company No. 04618115
4.7 RetirementTABLE 4-8Age at which Architects expect to retire, analysed by country
CHART 4-10Age at which Architects expect to retire
per cent under 50 50-54 55-59 60-64 65-69 70-74 75-79 80-84 85 or over never
Austria 0 1 0 4 33 35 9 4 2 12Belgium 0 0 3 20 43 17 5 1 1 9Bulgaria* 0 1 1 27 28 11 5 1 3 23Croatia 0 0 4 21 33 9 2 0 1 30Czech Republic* 0 0 0 0 15 23 15 8 8 31Denmark 0 0 0 9 54 25 4 2 1 6Estonia* 0 0 0 10 10 30 30 0 5 15Finland 0 1 1 30 48 8 2 1 0 7France 0 1 1 22 38 17 6 1 2 12Germany 0 0 1 19 61 10 3 1 1 4Greece 1 1 1 22 37 11 3 1 1 22Ireland 0 0 2 10 35 19 7 2 3 23Italy 0 0 1 14 29 19 6 3 2 26Latvia* 0 3 6 17 20 9 6 3 3 34Luxembourg 0 1 3 23 45 14 3 1 2 9Malta* 0 1 7 41 30 11 0 0 3 8Netherlands* 0 0 2 27 46 14 4 2 1 4Portugal 1 1 2 12 30 11 4 1 3 35Romania 1 1 4 21 25 10 8 2 3 26Slovakia 0 1 3 27 23 14 3 2 1 27Slovenia* 0 0 2 18 33 14 6 2 2 24Spain 0 0 0 8 41 16 5 1 2 26Sweden 0 0 0 12 64 15 3 1 1 4Switzerland 0 1 2 17 47 17 5 1 0 12Turkey 9 14 14 19 15 5 3 1 1 20United Kingdom 0 1 2 11 37 20 9 2 2 152014 EUR-26 1 1 2 15 38 15 6 2 1 192012 EUR-25 1 1 2 14 34 16 6 2 2 232010 EUR-23 2 3 5 20 37 13 4 1 1 142008 EUR-17 3 4 7 20 39 11 3 1 1 12
* caution - small sample Netherlands: BNA Benchmark Research 2014
0
5
10
15
20
25
30
35
40
Never
85 or over
80-84
75-79
70-74
65-69
60-64
55-59
50-54
under 50
per c
ent r
espo
nden
ts
Never
85 or over80-84
75-7970-74
65-6960-64
55-5950-54
under 50
The chart shows two peaks in the age at which architects think they will retire. The highest peak, representing 38 per cent of architects, is age 65 to 69. The second peak (19 per cent) is ‘never’ - architects will continue to work as an architect until they die. Another 21 per cent say they will continue to work into their seventies, 3 per cent into their eighties.
4 - 56The Architectural Profession in Europe 2014

Mirza & Nacey Reserach LtdSouthdown HouseFord Lane, FordArundelWest SussexBN18 0DEUnited Kingdom
Telephone: +44 1243 555302email: [email protected]
MIRZA & NACEY RESEARCH
Registered office: Southdown House, Ford Lane, Ford, Arundel, West Sussex BN18 0DE. Registered in England and Wales. Company No. 04618115
de�nitely noprobably no
not sure
probably yes
de�nitelyyes
TABLE 4-9Whether Architects will continue to practice their profession until they retire
CHART 4-11Likelihood of continuing to work as an Architect until retirement
per cent definitely yes probably yes not sure probably no definitely noAustria 48 46 5 1 0Belgium 25 44 21 7 3Bulgaria* 49 34 10 4 3Croatia 34 51 13 2 0Czech Republic* 38 23 23 8 8Denmark 42 45 10 3 1Estonia* 39 50 11 0 0Finland 39 49 9 3 0France 29 44 20 5 2Germany 34 43 16 5 2Greece 35 30 27 6 2Ireland 34 46 13 5 1Italy 31 34 24 8 3Latvia* 51 31 14 3 0Luxembourg 42 44 11 2 1Malta* 28 53 15 4 0Netherlands* 40 45 10 5 0Portugal 31 29 26 12 2Romania 56 34 8 2 0Slovakia 50 37 11 1 1Slovenia* 29 53 16 2 0Spain 36 31 22 9 3Sweden 41 43 12 4 1Switzerland 43 42 13 2 0Turkey 43 40 12 4 1United Kingdom 40 42 11 6 22014 EUROPE-26 36 38 18 6 22012 EUROPE-25 35 39 18 6 22010 EUROPE-23 41 43 12 3 12008 EUROPE-17 39 42 13 4 2
Almost three quarters of architects will “definitely”, or “probably”, continue to work as an architect until they retire. Eight per cent will almost certainly not continue as an architect - this is the same proportion as the 2012 survey but higher than in 2010 or 2008.The highest proportion of architects who expect to leave the profession are in Portugal (14 per cent will probably or definitely not continue to work as an architect until retirement), Spain (12 per cent) and Italy (11 per cent). These three countries, along with Greece, also have a high proportion of architects saying “not sure” (22 per cent or more).
Thirty six per cent of the profession say they will “definitely” continue to work as an architect until they retire. The proportion is highest in Romania (56 per cent) and Slovakia (50 per cent).
* caution - small sample Netherlands: BNA Benchmark Research 2014
4 - 57The Architectural Profession in Europe 2014

Mirza & Nacey Reserach LtdSouthdown HouseFord Lane, FordArundelWest SussexBN18 0DEUnited Kingdom
Telephone: +44 1243 555302email: [email protected]
MIRZA & NACEY RESEARCH
Registered office: Southdown House, Ford Lane, Ford, Arundel, West Sussex BN18 0DE. Registered in England and Wales. Company No. 04618115
4.8 Hours Worked
number of hours difference between contracted and worked hours
per week
sole principal 0.6
partner / director 3.6
private practice salaried 4.0
freelance 4.4
other private 3.7
local / central government 3.2
other public 4.6
2014 EUROPE-26 3.7
2012 EUROPE-25 3.9
2010 EUROPE-23 3.5
2008 EUROPE-17 4.9
Architects in the private sector report longer working hours than in the public sector. Sole Principals and Partners/Directors work on average 45 hours per week, higher than in other employment fields. Private practice salaried architects record an average 44 hours, the same as Freelancers. Public sector architects average 40 hours (government) and 41 hours (other public) per week.
The longest average working hours are reported by Sole Principals in Austria and Belgium, and by Partners and Directors in Austria, Belgium and Germany - each recording over 50 hours per week. Private practice salaried architects in Turkey report the longest working week, also over 50 hours.
TABLE 4-11Average (mean) number of hours worked per week, analysed by country and field of employment
TABLE 4-10Difference between average hours contracted to work and average hours worked
hours / week sole principal partner / director
private practice salaried
freelance other private local / central government other public
Austria 52.0 50.5 47.5 41.0 n/a n/a n/aBelgium 52.1 52.3 42.9 42.4 44.2 39.5 40.2Bulgaria* 50.7 37.1 44.6 n/a n/a n/a n/aCroatia 43.9 45.8 39.3 n/a n/a 38.8 60.0Czech Republic* n/a n/a 45.0 n/a n/a n/a 40.0Denmark 44.1 46.2 40.0 n/a 39.7 39.3 41.2Estonia* n/a n/a 46.7 n/a n/a n/a n/aFinland 44.5 47.0 39.1 n/a 40.5 39.3 41.8France 46.9 41.0 44.7 48.1 47.9 44.1 41.8Germany 50.6 50.8 44.3 n/a 45.2 43.2 44.3Greece 43.7 47.7 42.6 44.5 n/a 40.4 49.7Ireland 47.7 45.3 45.0 n/a n/a 41.5 40.0Italy 41.4 41.4 42.3 42.3 43.2 39.6 39.0Latvia* 46.6 45.3 42.5 n/a n/a n/a n/aLuxembourg 47.4 43.4 n/a n/a n/a n/a n/aMalta* 50.9 n/a 45.5 n/a 46.3 43.6 n/aNetherlands* 44.3 16.4 40.2 39.8 39.6 40.0 n/aPortugal 42.6 41.4 43.5 43.0 45.1 39.7 40.1Romania 43.2 45.3 43.2 n/a n/a n/a 34.2Slovakia 46.4 46.0 43.8 44.4 42.7 44.5 42.2Slovenia* 46.5 40.5 39.2 n/a n/a n/a n/aSpain 44.9 44.6 49.5 n/a 44.3 38.6 37.8Sweden 44.2 44.8 41.1 n/a 39.6 41.3 n/aSwitzerland 48.4 47.0 45.6 n/a 46.0 44.6 46.5Turkey 49.0 49.7 50.5 44.8 42.5 39.4 41.7United Kingdom 47.4 45.3 43.6 n/a 42.1 39.2 44.82014 EUROPE-26 44.5 45.3 43.9 42.9 44.0 40.3 41.02012 EUROPE-25 45.3 46.1 43.2 40.2 43.1 38.1 38.92010 EUROPE-23 46.2 45.8 41.2 43.9 44.8 38.3 38.42008 EUROPE-17 51.0 50.1 46.0 47.0 46.6 42.2 43.3
* caution - small sample Netherlands: BNA Benchmark Research 2014
4 - 58The Architectural Profession in Europe 2014

Mirza & Nacey Reserach LtdSouthdown HouseFord Lane, FordArundelWest SussexBN18 0DEUnited Kingdom
Telephone: +44 1243 555302email: [email protected]
MIRZA & NACEY RESEARCH
Registered office: Southdown House, Ford Lane, Ford, Arundel, West Sussex BN18 0DE. Registered in England and Wales. Company No. 04618115
Architects were invited to rate their satisfaction with four professional areas: career; pay; business environment and quality of life. Respondents selected their satisfaction level on a scale of 0 (totally dissatisfied) to 10 (totally satisfied).
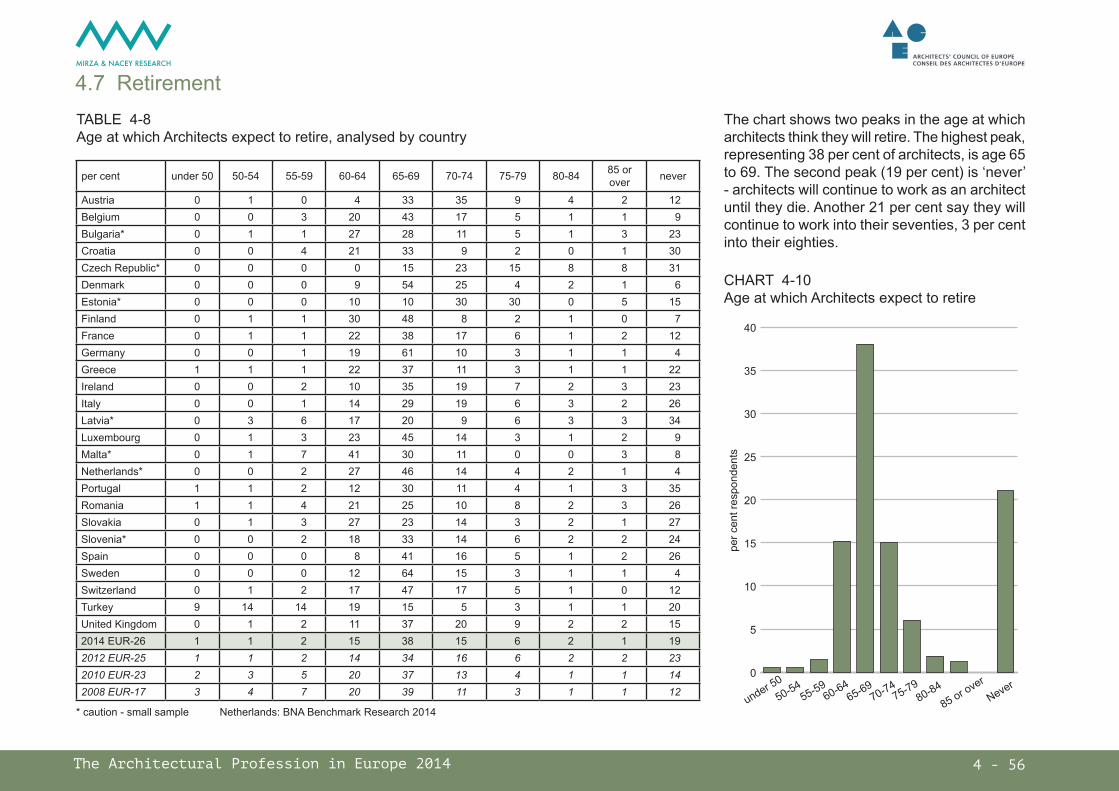
Architects are most satisfied with their choice of architecture as a career; the average score here is 6.9 out of 10. Satisfaction with the business environment (colleagues, fellow professionals, public planning bodies and so on) receives an
0 1 2 3 4 5 6 7 8 9 10
amount of pay
quality of life
business environment
choice of careeras an architect
satisfaction with ...
respondents' average rating<<< less satisfied more satisfied >>>
CHART 4-12Professional satisfaction, ranked, highest first
4.9 Career SatisfactionCHART 4-13Change in architects’ average rating scores - satisfaction with choice of career (all survey countries), 2008-14
average score of 5.8 while satisfaction with the quality of life is slightly lower, recording an average score of 5.5. Architects are least satisfied with the amount they are paid: this receives a satisfaction score of just 4.1 out of 10.
The highest average satisfaction scores are recorded by architects in Sweden, Denmark and Finland and Switzerland. The lowest scores are most frequently reported by architects in Italy, Ireland, Portugal and Spain. These findings are similar to those from the 2012 survey.
0
2
4
6
8
10
2014201220102008
satis
fact
ion
scor
e ou
t of 1
0
pay
lifebusiness
career
4 - 59The Architectural Profession in Europe 2014
Mirza & Nacey Reserach LtdSouthdown HouseFord Lane, FordArundelWest SussexBN18 0DEUnited Kingdom
Telephone: +44 1243 555302email: [email protected]
MIRZA & NACEY RESEARCH
Registered office: Southdown House, Ford Lane, Ford, Arundel, West Sussex BN18 0DE. Registered in England and Wales. Company No. 04618115
TABLE 4-12Satisfaction with choice of career as an Architect, analysed by country
CHART 4-14Satisfaction with choice of architecture as a career
score, 0 to 10(10= very satisfied)
ALL
Austria 8.1Belgium 7.0Bulgaria* 7.0Croatia 8.0Czech Republic* 7.8Denmark 8.3Estonia* 7.7Finland 8.1France 7.2Germany 7.4Greece 7.1Ireland 6.7Italy 6.3Latvia* 7.4Luxembourg 7.7Malta* 7.3Netherlands* 7.2Portugal 6.4Romania 8.1Slovakia 7.4Slovenia* 8.0Spain 7.2Sweden 8.3Switzerland 8.3Turkey 7.6United Kingdom 7.42014 EUROPE-26 6.92012 EUROPE-25 7.02010 EUROPE-23 7.62008 EUROPE-17 7.7
* caution - small sample Netherlands: BNA Benchmark Research 2014
4 - 60The Architectural Profession in Europe 2014

Mirza & Nacey Reserach LtdSouthdown HouseFord Lane, FordArundelWest SussexBN18 0DEUnited Kingdom
Telephone: +44 1243 555302email: [email protected]
MIRZA & NACEY RESEARCH
Registered office: Southdown House, Ford Lane, Ford, Arundel, West Sussex BN18 0DE. Registered in England and Wales. Company No. 04618115
TABLE 4-13Architects’ satisfaction with the amount they are paid analysed by country
CHART 4-15Satisfaction with amount paid
score, 0 to 10(10= very satisfied)
ALL
Austria 4.5Belgium 4.3Bulgaria* 3.7Croatia 4.5Czech Republic* 4.5Denmark 6.9Estonia* 5.0Finland 6.5France 4.2Germany 5.1Greece 3.2Ireland 3.4Italy 3.6Latvia* 5.0Luxembourg 5.8Malta* 4.4Netherlands* 5.4Portugal 3.0Romania 4.3Slovakia 3.9Slovenia* 3.2Spain 3.4Sweden 6.8Switzerland 6.8Turkey 4.5United Kingdom 4.82014 EUROPE-26 4.12012 EUROPE-25 4.32010 EUROPE-23 4.82008 EUROPE-17 4.7
* caution - small sample Netherlands: BNA Benchmark Research 2014
4 - 61The Architectural Profession in Europe 2014

Mirza & Nacey Reserach LtdSouthdown HouseFord Lane, FordArundelWest SussexBN18 0DEUnited Kingdom
Telephone: +44 1243 555302email: [email protected]
MIRZA & NACEY RESEARCH
Registered office: Southdown House, Ford Lane, Ford, Arundel, West Sussex BN18 0DE. Registered in England and Wales. Company No. 04618115
TABLE 4-14Architects’ satisfaction with their quality of life analysed by country
CHART 4-16Satisfaction with quality of life
score, 0 to 10(10= very satisfied)
ALL
Austria 6.3Belgium 5.6Bulgaria* 4.2Croatia 5.3Czech Republic* 6.7Denmark 8.0Estonia* 6.0Finland 7.6France 5.5Germany 6.0Greece 4.9Ireland 5.4Italy 5.1Latvia* 6.0Luxembourg 6.3Malta* 5.8Netherlands* 7.8Portugal 4.3Romania 5.7Slovakia 5.6Slovenia* 5.3Spain 4.7Sweden 7.6Switzerland 7.4Turkey 5.3United Kingdom 6.32014 EUROPE-26 5.52012 EUROPE-25 5.62010 EUROPE-23 6.12008 EUROPE-17 5.9
* caution - small sample Netherlands: BNA Benchmark Research 2014
4 - 62The Architectural Profession in Europe 2014

Mirza & Nacey Reserach LtdSouthdown HouseFord Lane, FordArundelWest SussexBN18 0DEUnited Kingdom
Telephone: +44 1243 555302email: [email protected]
MIRZA & NACEY RESEARCH
Registered office: Southdown House, Ford Lane, Ford, Arundel, West Sussex BN18 0DE. Registered in England and Wales. Company No. 04618115
TABLE 4-15Architects’ satisfaction with the business environment in which they work analysed by country
CHART 4-17Satisfaction with the business environment in which they work - including colleagues, fellow professionals, public planning bodies etc
score, 0 to 10(10= very satisfied)
ALL
Austria 6.1Belgium 6.6Bulgaria* 4.6Croatia 4.5Czech Republic* 6.2Denmark 7.4Estonia* 6.8Finland 7.0France 6.0Germany 6.8Greece 5.6Ireland 5.4Italy 5.1Latvia* 6.0Luxembourg 6.7Malta* 5.7Netherlands* 5.7Portugal 6.1Romania 5.7Slovakia 5.6Slovenia* 4.8Spain 5.6Sweden 7.1Switzerland 7.4Turkey 5.4United Kingdom 6.42014 EUROPE-26 5.82012 EUROPE-25 5.72010 EUROPE-23 6.12008 EUROPE-17 6.2
* caution - small sample Netherlands: BNA Benchmark Research 2014
4 - 63The Architectural Profession in Europe 2014

Mirza & Nacey Reserach LtdSouthdown HouseFord Lane, FordArundelWest SussexBN18 0DEUnited Kingdom
Telephone: +44 1243 555302email: [email protected]
MIRZA & NACEY RESEARCH
Registered office: Southdown House, Ford Lane, Ford, Arundel, West Sussex BN18 0DE. Registered in England and Wales. Company No. 04618115
4.10 Continuing Professional Development (CPD)On average, Europe’s architects undertake 20 hours of CPD per year. But the range varies considerably; from an average of zero hours CPD by architects in Turkey, to 50 or more in Spain and Bulgaria.
Similarly, personal expenditure on CPD activities varies considerably. The average across Europe is €150 per year, but is zero in several countries. Highest expenditure is reported by architects in Austria, who spend an average of €1000 per year on CPD activities. analysed by field of employment, highest average expenditure on CPD is incurred by Sole Principals. Architects in salaried positions in private practice spend an average of just €30 per year personally; while architects in the public sector say they spend nothing at all, personally, on CPD events and activities.
average (median) number hours CPD per year
personal expenditure on CPD, € per year(unadjusted for PPP)
Austria 40 1000Belgium 20 121Bulgaria* 95 204Croatia 20 66Czech Republic* 10 0Denmark 25 0Estonia* 20 150Finland 10 0France 0 0Germany 20 200Greece 30 200Ireland 40 200Italy 20 250Latvia* 40 200Luxembourg 16 400Malta* 13 150Netherlands* 16 250Portugal 15 1Romania 12 0Slovakia 6 0Slovenia* 20 275Spain 50 300Sweden 20 0Switzerland 20 410Turkey 0 0United Kingdom 37 02014 EUROPE-26 20 1502012 EUROPE-25 38 3002010 EUROPE-23** n/a n/a2008 EUROPE-17** n/a n/a
TABLE 4-16CPD hours and spend, analysed by country
* caution small sample Netherlands: BNA Benchmark Research 2014** question was not asked in 2008 or 2010
4 - 64The Architectural Profession in Europe 2014

Mirza & Nacey Reserach LtdSouthdown HouseFord Lane, FordArundelWest SussexBN18 0DEUnited Kingdom
Telephone: +44 1243 555302email: [email protected]
MIRZA & NACEY RESEARCH
Registered office: Southdown House, Ford Lane, Ford, Arundel, West Sussex BN18 0DE. Registered in England and Wales. Company No. 04618115
average number of hours CPD per year
personal expenditureon CPD € (top axis)
0 20 40 60 80 100
Turkey
France
Slovakia
Finland
Czech Republic
Romania
Malta
Portugal
Luxembourg
Netherlands
Switzerland
Sweden
Slovenia
Italy
Germany
Estonia
Croatia
Belgium
Denmark
Greece
United Kingdom
Latvia
Ireland
Austria
Spain
Bulgaria
0 300 600 900 1200 1500average personal expenditure on CPD, €s per year
number hours CPD per year (bottom axis)
average (median) number hours CPD per year
personal expenditure on CPD, € per year
(unadjusted for PPP)
sole principal 20 300
partner / director 25 244
private practice salaried 20 30
freelance 20 200
other private 20 200
local / central government 20 0
other public 20 0
2014 EUROPE-26 20 150
2012 EUROPE-25 38 300
2010 EUROPE-23* n/a n/a
2008 EUROPE-17* n/a n/a
CHART 4-18CPD hours (bottom axis) and spend (top axis), analysed by country
TABLE 4-17CPD hours and spend, analysed by field of employment
* question was not asked in 2008 or 2010
4 - 65The Architectural Profession in Europe 2014

Mirza & Nacey Reserach LtdSouthdown HouseFord Lane, FordArundelWest SussexBN18 0DEUnited Kingdom
Telephone: +44 1243 555302email: [email protected]
MIRZA & NACEY RESEARCH
Registered office: Southdown House, Ford Lane, Ford, Arundel, West Sussex BN18 0DE. Registered in England and Wales. Company No. 04618115
4.11 Building to Nearly Zero Energy StandardIn a new question this year, respondents say how often they are being asked to design energy efficiency as a retrofit service by their clients. Three per cent of respondents say they are “always” designing energy efficiency as a retrofit service, 11 per cent between 50 and 99 per cent of the time. The majority, 55 per cent, state they are being asked to design energy efficiency as a retrofit service less than 10 per cent of the time.
Building to Nearly Zero energy standards remains a minority issue. Only 4 per cent of architects say they do this “always”, while just 10 per cent say they build to Nearly Zero energy standards more than 50 per cent of the time. Together, 14 per cent of respondents build to Nearly Zero energy standards at least 50 per cent of the time, a slight improvement on the 2012 survey figure of 12 per cent. A further 27 per cent of architects build to Nearly Zero energy standards between 10 and 49 per cent of the time - leaving the majority, 59 per cent, building no more than 10 per cent of their designs to Nearly Zero energy standards. This is a rise on the 2012 figure of 53 per cent.
Countries which have higher proportions of architects who build to nearly zero energy standards are Austria, Luxembourg, Switzerland and Germany. For high proportions of architects designing energy efficiency as a retrofit service, these countries are joined by Belgium, Denmark, Finland, France.
per cent respondents less than 10% of the time
between 10% and 25% of the time
between 26% and 50% of the time
more than 50% of the time always
Austria 27 26 24 19 4Belgium 24 22 22 24 9Bulgaria* 43 23 13 13 9Croatia 63 21 11 5 0Czech Republic* 70 20 10 0 0Denmark 37 19 20 16 8Estonia* 35 0 25 20 20Finland 77 11 4 5 2France 35 21 21 15 8Germany 42 19 20 16 2Greece 55 23 13 7 1Ireland 33 17 22 22 6Italy 60 18 14 6 2Latvia* 32 24 26 12 6Luxembourg 23 26 25 21 4Malta* 70 20 7 3 0Netherlands* 50 23 15 10 2Portugal 60 17 13 7 3Romania 57 20 11 8 4Slovakia 43 28 20 7 2Slovenia* 26 20 28 16 10Spain 74 13 6 4 2Sweden 73 15 7 3 2Switzerland 27 28 23 19 3Turkey 72 12 8 5 4United Kingdom 55 18 15 9 22014 EUROPE-26 55 17 14 11 32012 EUROPE-25 n/a n/a n/a n/a n/a2010 EUROPE-23 n/a n/a n/a n/a n/a2008 EUROPE-17 n/a n/a n/a n/a n/a
TABLE 4-18How often architects are currently being asked to design energy efficiency as a retrofit service by their clients, analysed by country
* caution - small sample Netherlands: BNA Benchmark Research 2014 2008/10/12 quesiton was not asked in previous surveys
4 - 66The Architectural Profession in Europe 2014

Mirza & Nacey Reserach LtdSouthdown HouseFord Lane, FordArundelWest SussexBN18 0DEUnited Kingdom
Telephone: +44 1243 555302email: [email protected]
MIRZA & NACEY RESEARCH
Registered office: Southdown House, Ford Lane, Ford, Arundel, West Sussex BN18 0DE. Registered in England and Wales. Company No. 04618115
CHART 4-19How often respondents are currently being asked to build to Nearly Zero Energy standards by clients or through regulation
always
between 51 and99% of the time
between 26 and50% of the time
between 10 and25% of the time
less than 10%of the time
per cent respondents less than 10% of the time
between 10% and 25% of the time
between 26% and 50% of the time
between 51% and 99% of the time always
Austria 26 20 18 28 8Belgium 64 16 9 9 2Bulgaria* 67 11 14 4 3Croatia 71 14 8 7 0Czech Republic* 36 45 9 9 0Denmark 52 15 17 12 4Estonia* 75 20 5 0 0Finland 65 15 9 9 1France 56 14 12 11 8Germany 50 18 12 15 6Greece 62 13 13 9 3Ireland 64 16 13 6 1Italy 56 17 15 8 4Latvia* 68 15 9 6 3Luxembourg 24 24 19 25 7Malta* 86 10 3 1 0Netherlands* 60 18 10 10 2Portugal 63 14 11 8 4Romania 59 19 8 9 5Slovakia 58 21 14 5 3Slovenia* 64 8 8 18 2Spain 79 9 6 2 3Sweden 83 7 6 3 2Switzerland 23 19 28 25 6Turkey 68 13 9 4 6United Kingdom 73 10 9 7 12014 EUROPE-26 59 15 12 10 42012 EUROPE-25 53 20 14 9 32010 EUROPE-23 58 15 15 8 42008 EUROPE-17* n/a n/a n/a n/a n/a
TABLE 4-19How often architects are being asked to build to Nearly Zero Energy standards, analysed by country
* caution small sample Netherlands: BNA Benchmark Research 20142008 - question was not asked in 2008
4 - 67The Architectural Profession in Europe 2014