
4 Results and reports
20
4 Results and reports It is important that the results of a project evaluation are appropriately documented. CBA6 provides reports for VOC, TTC, net capital and maintenance costs, benefits and decision criteria, see Figure 48. CBA6 presents its results in two ways: online screen displays and reports. This chapter covers the display screens and reports produced by CBA6. A thorough understanding of the results shown in CBA6 is required in order to provide informed recommendations on a project’s economic justification. This chapter will ensure system users can make appropriate interpretation of the results calculated in CBA6. This chapter will also provide system users with an overview of the CBA6 results and explain how to cross-check evaluation inputs with outputs. 3
Transcript of 4 Results and reports
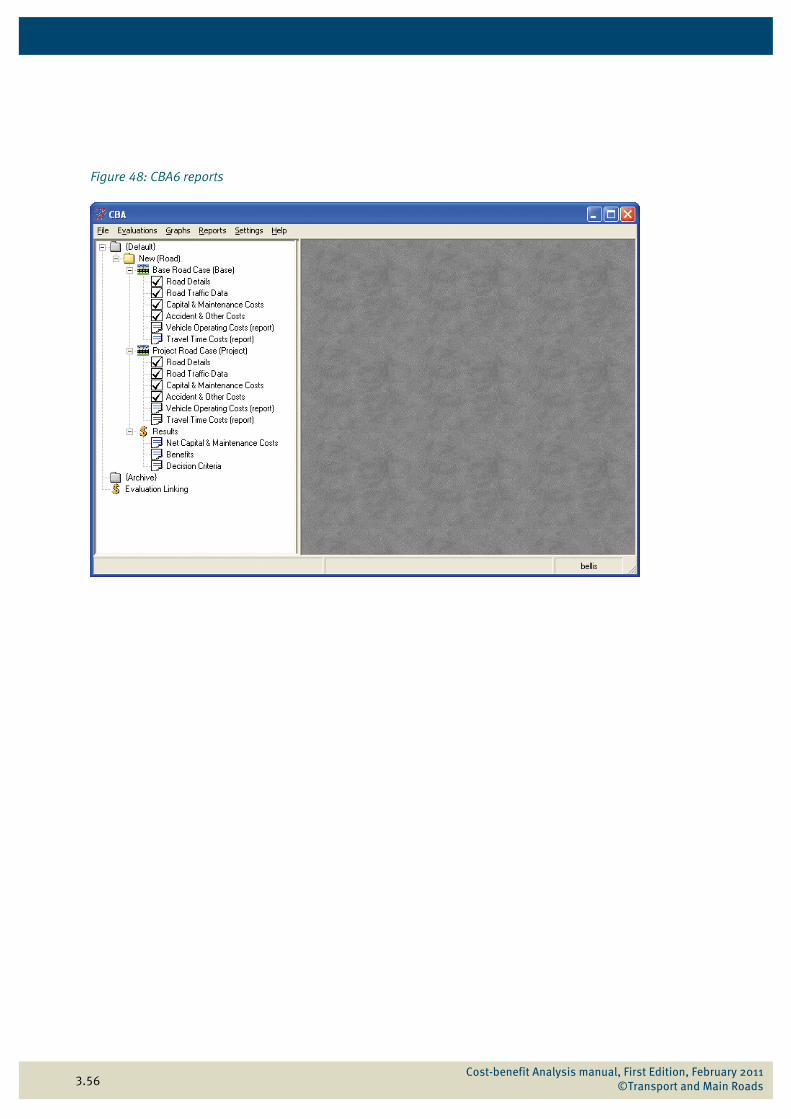
4 Results and reportsIt is important that the results of a project evaluation are appropriately documented. CBA6 provides reports for VOC, TTC, net capital and maintenance costs, benefits and decision criteria, see Figure 48. CBA6 presents its results in two ways: online screen displays and reports. This chapter covers the display screens and reports produced by CBA6.
A thorough understanding of the results shown in CBA6 is required in order to provide informed recommendations on a project’s economic justification. This chapter will ensure system users can make appropriate interpretation of the results calculated in CBA6. This chapter will also provide system users with an overview of the CBA6 results and explain how to cross-check evaluation inputs with outputs.
3
3.56
Figure 48: CBA6 reports
Cost-benefit Analysis manual, First Edition, February 2011 ©Transport and Main Roads
3.57
4.1 Vehicle operating costs
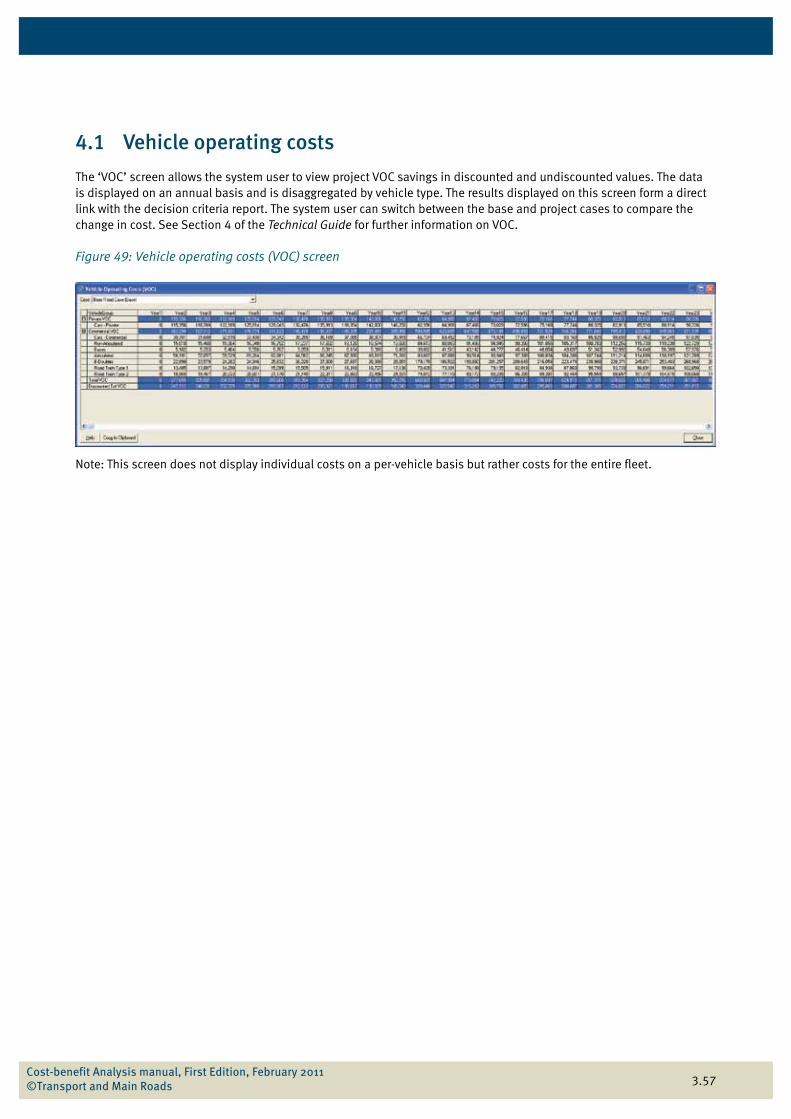
The ‘VOC’ screen allows the system user to view project VOC savings in discounted and undiscounted values. The data is displayed on an annual basis and is disaggregated by vehicle type. The results displayed on this screen form a direct link with the decision criteria report. The system user can switch between the base and project cases to compare the change in cost. See Section 4 of the Technical Guide for further information on VOC.
Figure 49: Vehicle operating costs (VOC) screen
Note: This screen does not display individual costs on a per-vehicle basis but rather costs for the entire fleet.
Cost-benefit Analysis manual, First Edition, February 2011 ©Transport and Main Roads
3.58
4.2 Travel time costs
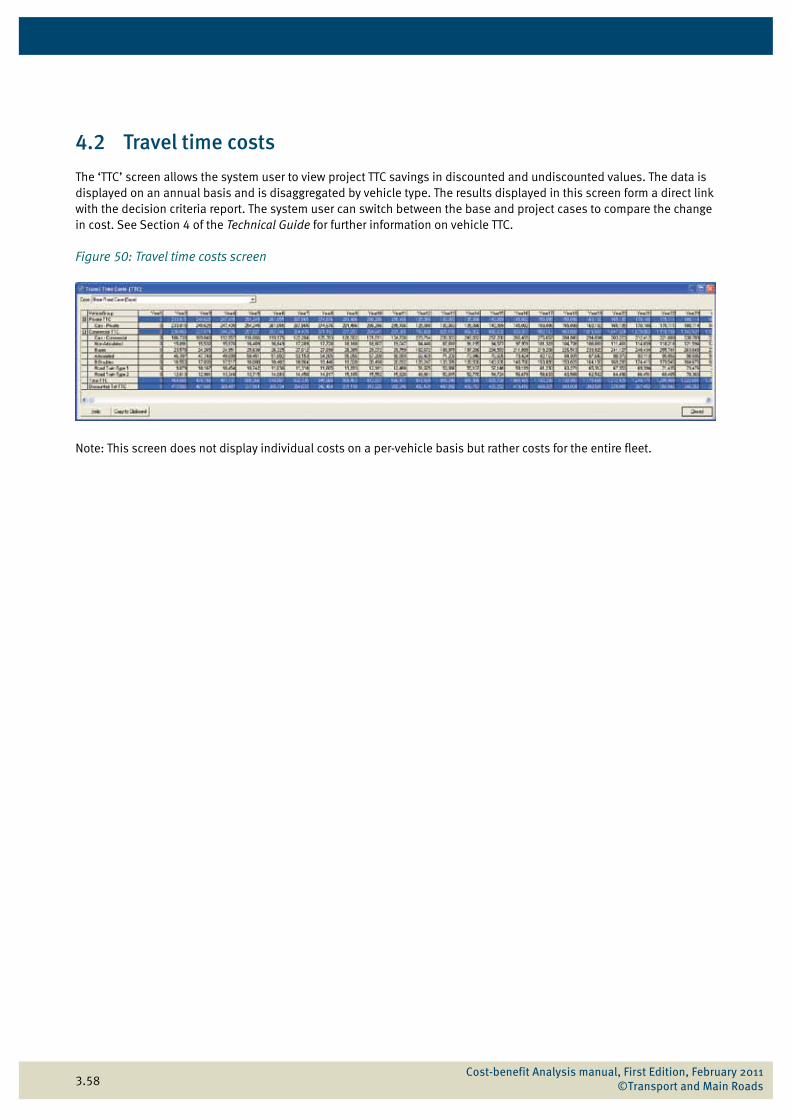
The ‘TTC’ screen allows the system user to view project TTC savings in discounted and undiscounted values. The data is displayed on an annual basis and is disaggregated by vehicle type. The results displayed in this screen form a direct link with the decision criteria report. The system user can switch between the base and project cases to compare the change in cost. See Section 4 of the Technical Guide for further information on vehicle TTC.
Figure 50: Travel time costs screen
Note: This screen does not display individual costs on a per-vehicle basis but rather costs for the entire fleet.
Cost-benefit Analysis manual, First Edition, February 2011 ©Transport and Main Roads
3.59
4.3 Net capital and maintenance costs
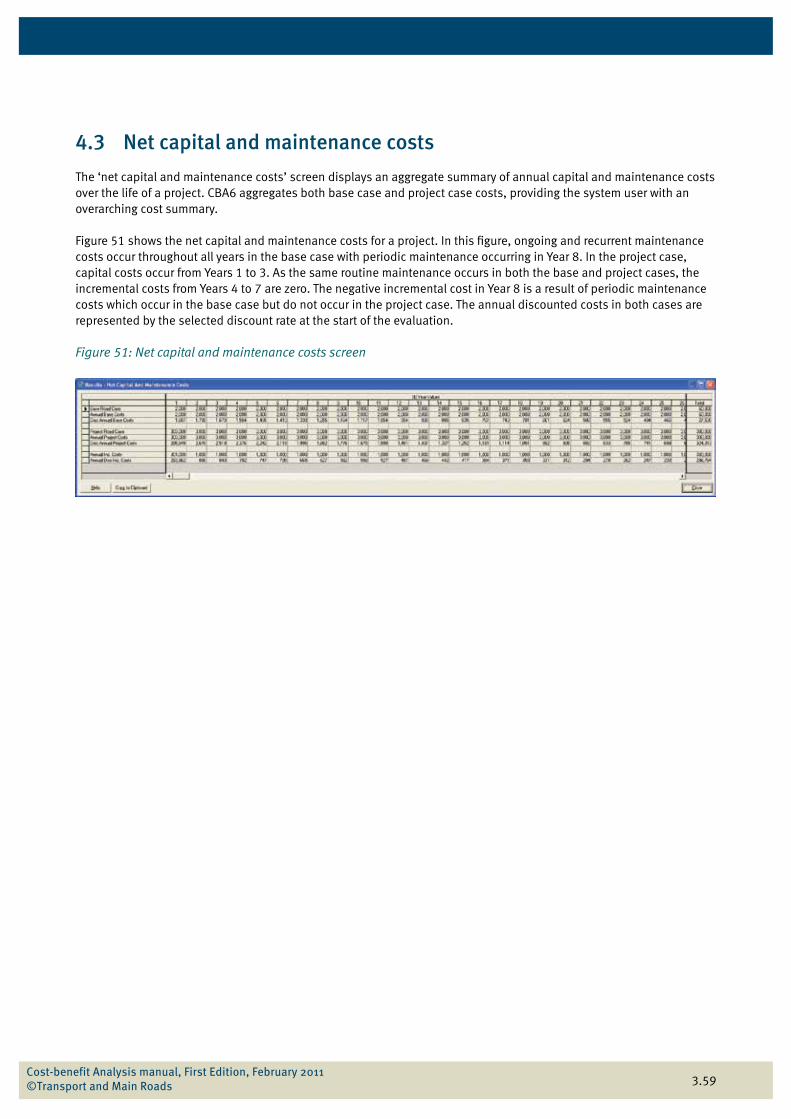
The ‘net capital and maintenance costs’ screen displays an aggregate summary of annual capital and maintenance costs over the life of a project. CBA6 aggregates both base case and project case costs, providing the system user with an overarching cost summary.
Figure 51 shows the net capital and maintenance costs for a project. In this figure, ongoing and recurrent maintenance costs occur throughout all years in the base case with periodic maintenance occurring in Year 8. In the project case, capital costs occur from Years 1 to 3. As the same routine maintenance occurs in both the base and project cases, the incremental costs from Years 4 to 7 are zero. The negative incremental cost in Year 8 is a result of periodic maintenance costs which occur in the base case but do not occur in the project case. The annual discounted costs in both cases are represented by the selected discount rate at the start of the evaluation.
Figure 51: Net capital and maintenance costs screen
Cost-benefit Analysis manual, First Edition, February 2011 ©Transport and Main Roads
3.60
4.4 Benefits
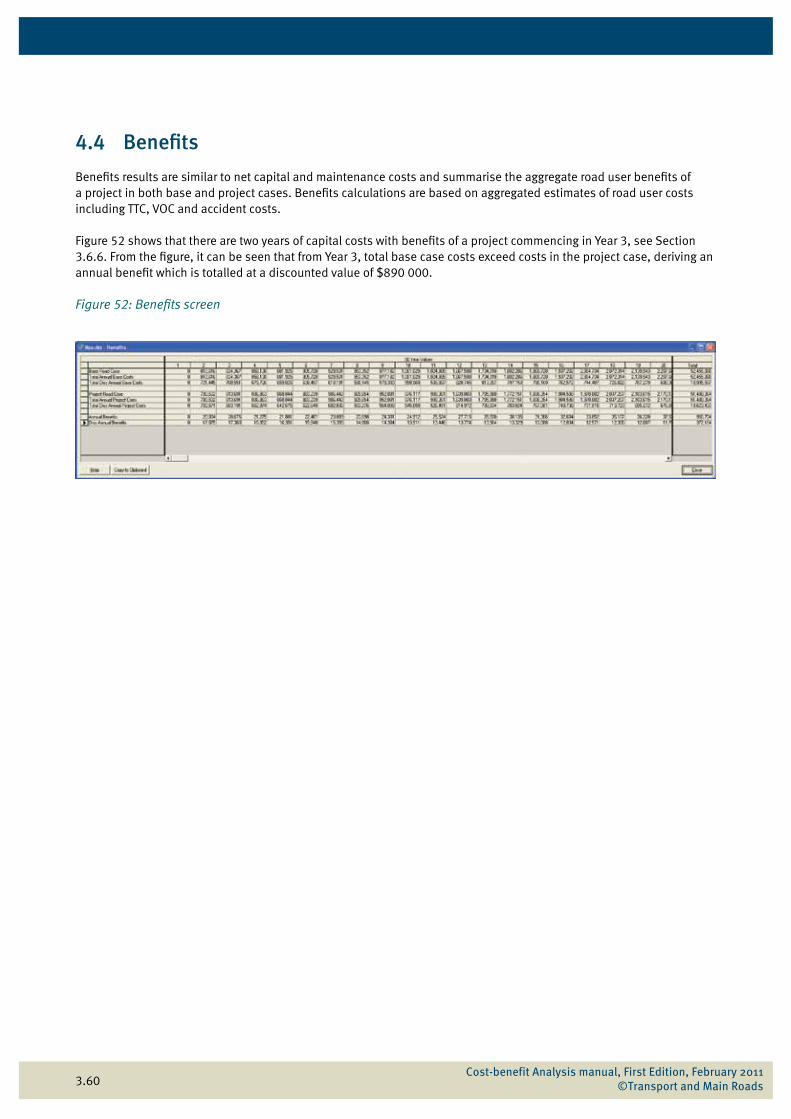
Benefits results are similar to net capital and maintenance costs and summarise the aggregate road user benefits of a project in both base and project cases. Benefits calculations are based on aggregated estimates of road user costs including TTC, VOC and accident costs.
Figure 52 shows that there are two years of capital costs with benefits of a project commencing in Year 3, see Section 3.6.6. From the figure, it can be seen that from Year 3, total base case costs exceed costs in the project case, deriving an annual benefit which is totalled at a discounted value of $890 000.
Figure 52: Benefits screen
Cost-benefit Analysis manual, First Edition, February 2011 ©Transport and Main Roads
3.61
4.5 Decision criteria
The economic decision criteria created by CBA6 are a set of indicators which allow system users to understand possible economic outcomes of projects. The economic decision criteria identified here allows useful economic comparisons between discounted benefits and costs.
The economic decision criteria generated in CBA6 includes:
• BCR
• NPV per $ investment
• NPV
• FYRR.
Each criterion is discussed in detail in Sections 4.5.1 to 4.5.4. For further information on the theoretical assumptions of the decision criteria used in CBA6, see Section 1.7 of the Theoretical Guide. For further information on the formulas used to calculate the decision criteria used in CBA6, see Section 9 of the Technical Guide.
4.5.1 Benefit-cost ratio
The BCR is the most widely used measurement of project performance within TMR. A BCR greater than 1 indicates that a project is economically viable i.e. the benefits outweigh the costs.
The decision criteria example in Figure 52 displays the output from CBA6. At the 7% discount rate, the BCR for the project is 2.48. This indicates that the benefits exceed the costs, and the project is economically viable.
4.5.2 Net present value per $ investment
This is a ratio of NPV divided by the present value of capital costs. It indicates the increase in economic value to the community relative to the amount of capital invested. If two projects generate the same NPV but have different capital efficiency ratios, the project with the higher capital efficiency factor is considered the superior investment.
4.5.3 Net present value
The NPV of a project is the difference between the discounted stream of benefits and the discounted stream of costs. Ultimately the NPV should be used to value the initiative and the BCR should be used to rank viable projects. The NPV shown in Figure 52 at the 6% discount rate is $12.9 million.
4.5.4 First year rate of return
The FYRR is a ratio of first year of benefits to the capital costs of a project. FYRR indicates whether a project’s optimal implementation time is in the past or in the future, and can indicate whether deferral is warranted (ATC 2007).
Cost-benefit Analysis manual, First Edition, February 2011 ©Transport and Main Roads
3.62
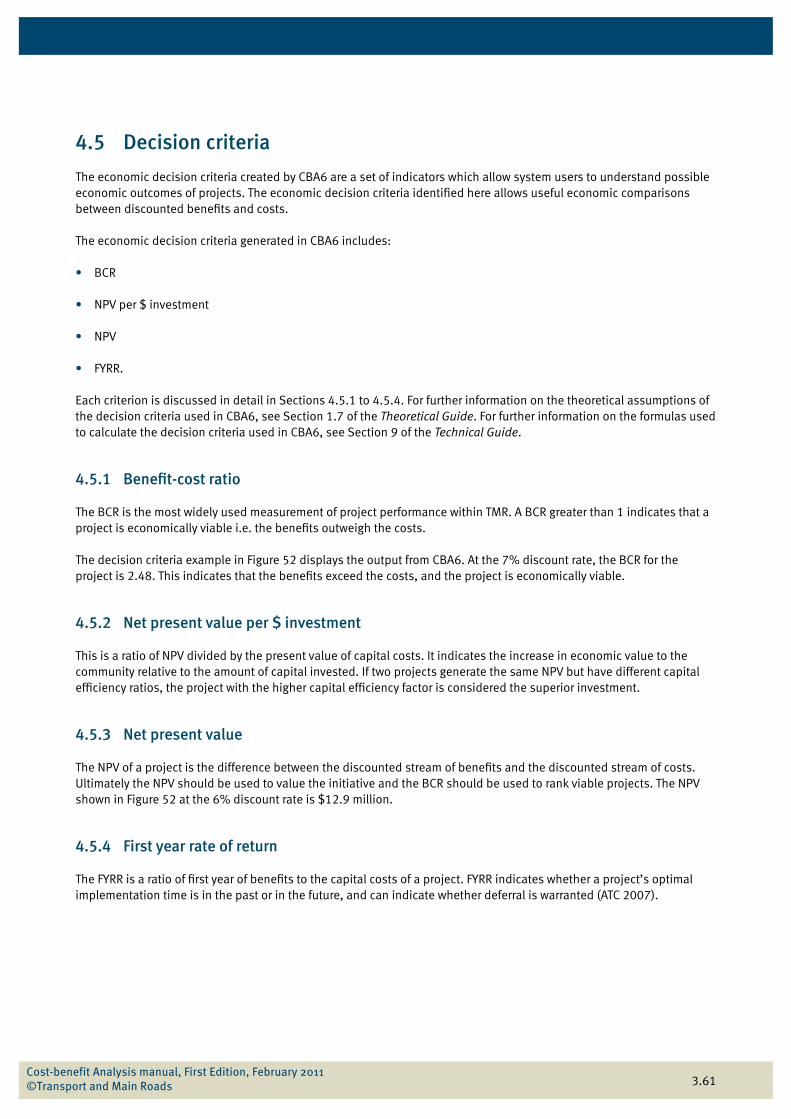
Figure 53: Results – decision criteria screen
4.5.5 Incremental and linking decision criteria
The ‘decision criteria’ screen can also be populated for linking evaluation files and comparing project options through the incremental analysis. For further information on using incremental analysis and linking, see Sections 5.12 and 5.13.
Cost-benefit Analysis manual, First Edition, February 2011 ©Transport and Main Roads
3.63
4.6 Producing and understanding CBA reports
CBA6 produces output reports in detailed forms for all project types available in the tool. These reports provide system users with disaggregated results which can be used in a variety of report presentation formats.
4.6.1 Producing road case reports
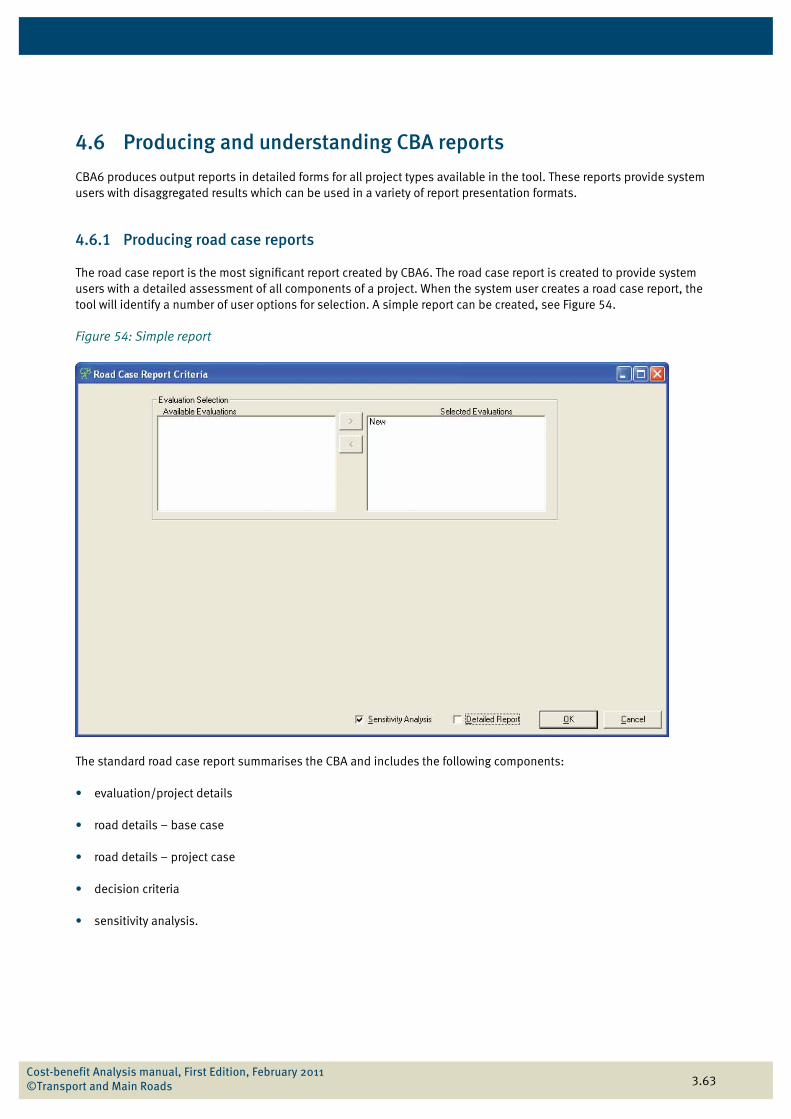
The road case report is the most significant report created by CBA6. The road case report is created to provide system users with a detailed assessment of all components of a project. When the system user creates a road case report, the tool will identify a number of user options for selection. A simple report can be created, see Figure 54.
Figure 54: Simple report
The standard road case report summarises the CBA and includes the following components:
• evaluation/project details
• road details – base case
• road details – project case
• decision criteria
• sensitivity analysis.
Cost-benefit Analysis manual, First Edition, February 2011 ©Transport and Main Roads
3.64
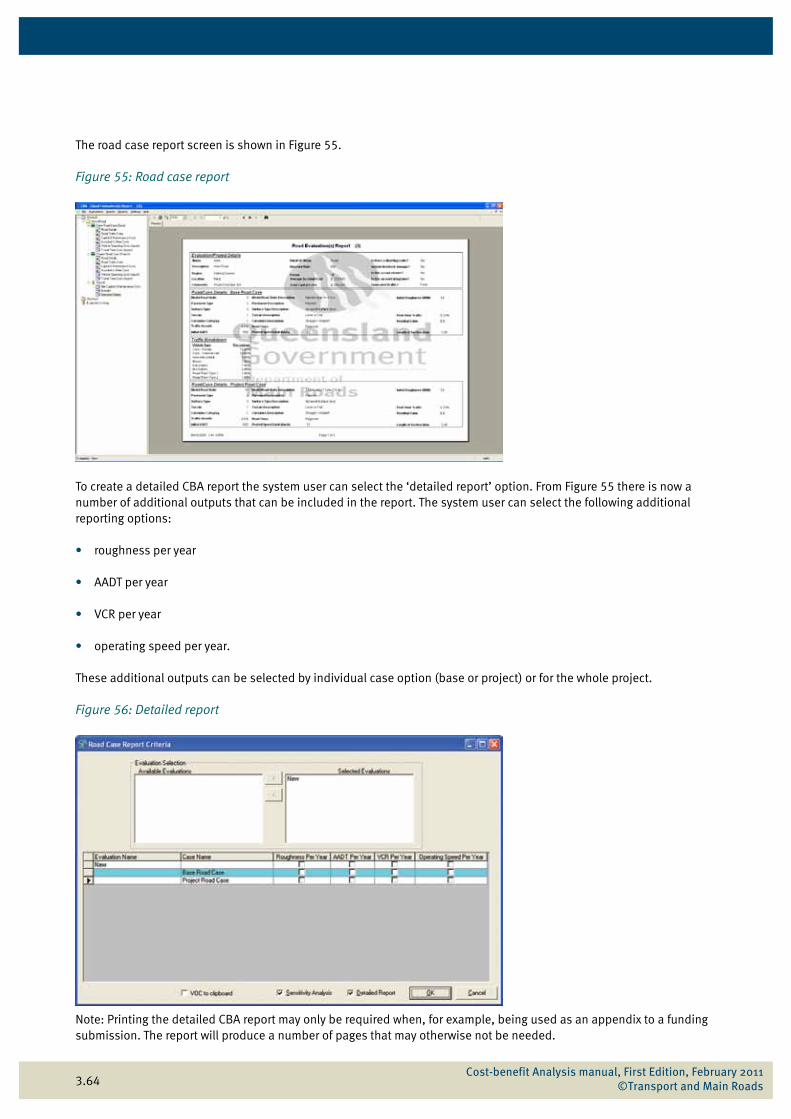
The road case report screen is shown in Figure 55.
Figure 55: Road case report
To create a detailed CBA report the system user can select the ‘detailed report’ option. From Figure 55 there is now a number of additional outputs that can be included in the report. The system user can select the following additional reporting options:
• roughness per year
• AADT per year
• VCR per year
• operating speed per year.
These additional outputs can be selected by individual case option (base or project) or for the whole project.
Figure 56: Detailed report
Note: Printing the detailed CBA report may only be required when, for example, being used as an appendix to a funding submission. The report will produce a number of pages that may otherwise not be needed.
Cost-benefit Analysis manual, First Edition, February 2011 ©Transport and Main Roads
3.65
4.6.2 Vehicle operating costs to clipboard
The ‘VOC to clipboard’ function is generically quite similar to the ‘copy to clipboard’ function, but is only available after the system user has generated a detailed road case report. When creating a detailed road case report, the system user is given an option to ‘copy VOC to clipboard’, see Figure 55. The function will then allow the system user to copy all VOCs of the evaluation to a spreadsheet for further analysis. This function allows the system user to acquire disaggregated VOC, unavailable in the other reports.
4.6.3 Sensitivity analysis
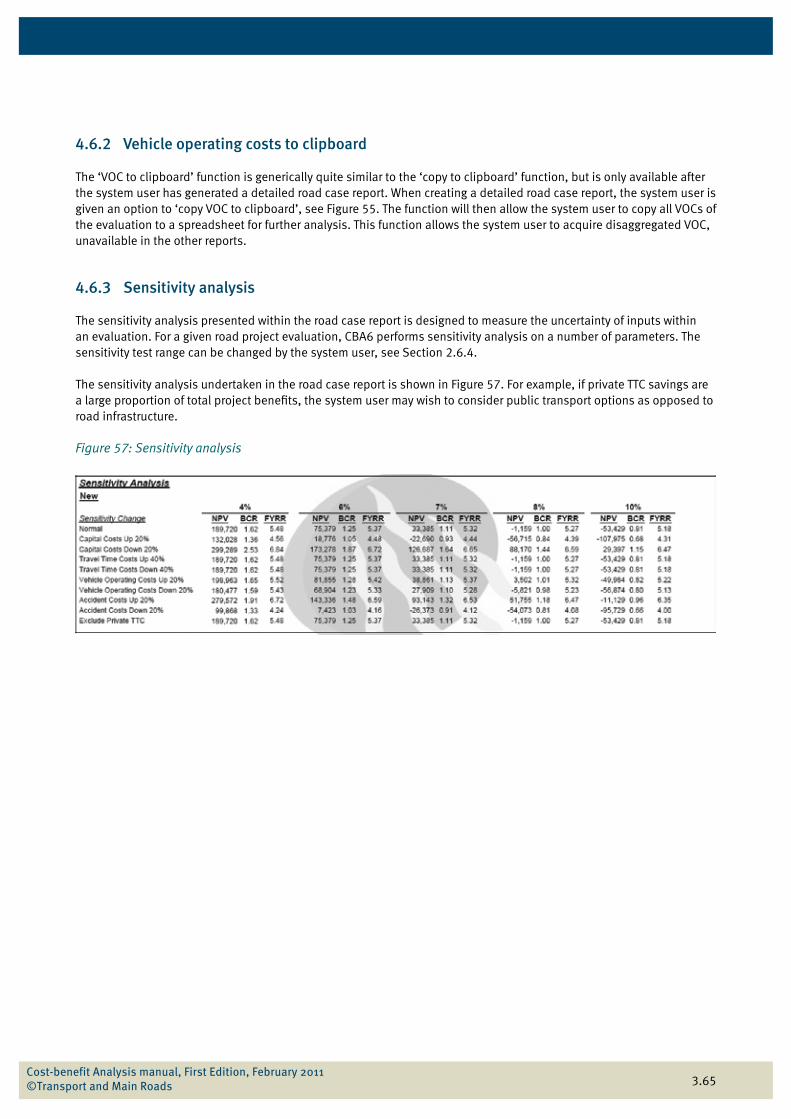
The sensitivity analysis presented within the road case report is designed to measure the uncertainty of inputs within an evaluation. For a given road project evaluation, CBA6 performs sensitivity analysis on a number of parameters. The sensitivity test range can be changed by the system user, see Section 2.6.4.
The sensitivity analysis undertaken in the road case report is shown in Figure 57. For example, if private TTC savings are a large proportion of total project benefits, the system user may wish to consider public transport options as opposed to road infrastructure.
Figure 57: Sensitivity analysis
Cost-benefit Analysis manual, First Edition, February 2011 ©Transport and Main Roads
3.66
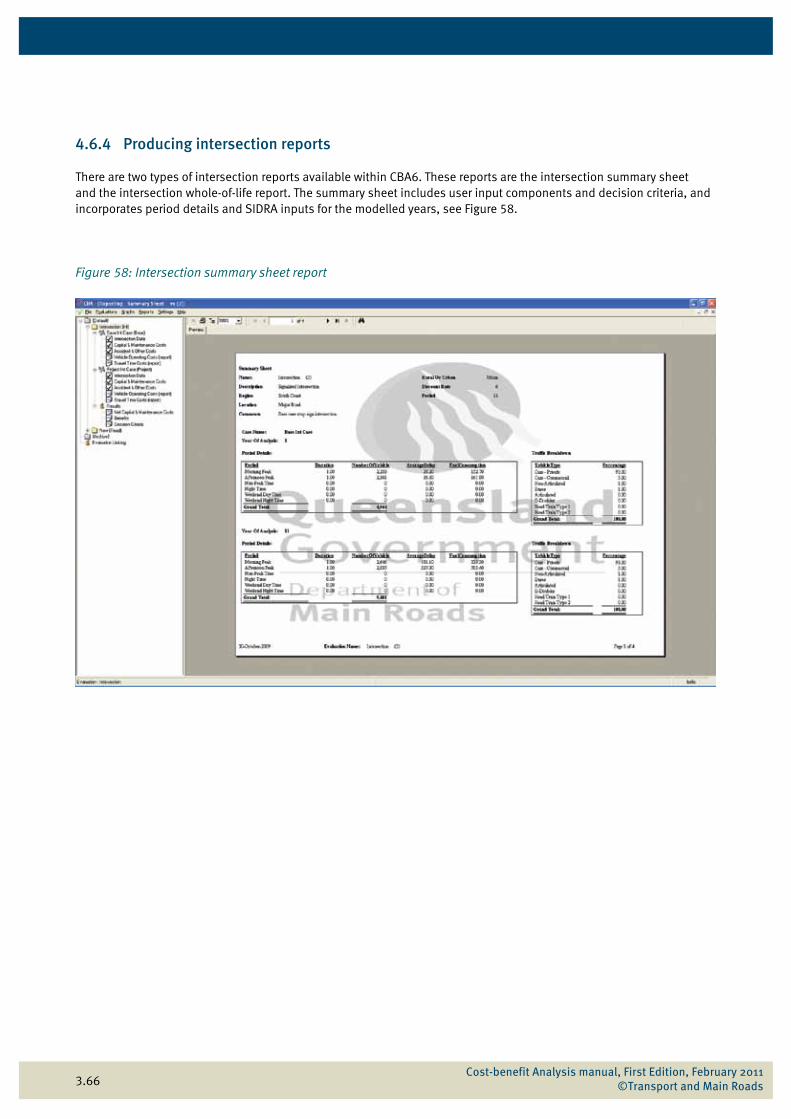
4.6.4 Producing intersection reports
There are two types of intersection reports available within CBA6. These reports are the intersection summary sheet and the intersection whole-of-life report. The summary sheet includes user input components and decision criteria, and incorporates period details and SIDRA inputs for the modelled years, see Figure 58.
Figure 58: Intersection summary sheet report
Cost-benefit Analysis manual, First Edition, February 2011 ©Transport and Main Roads
3.67
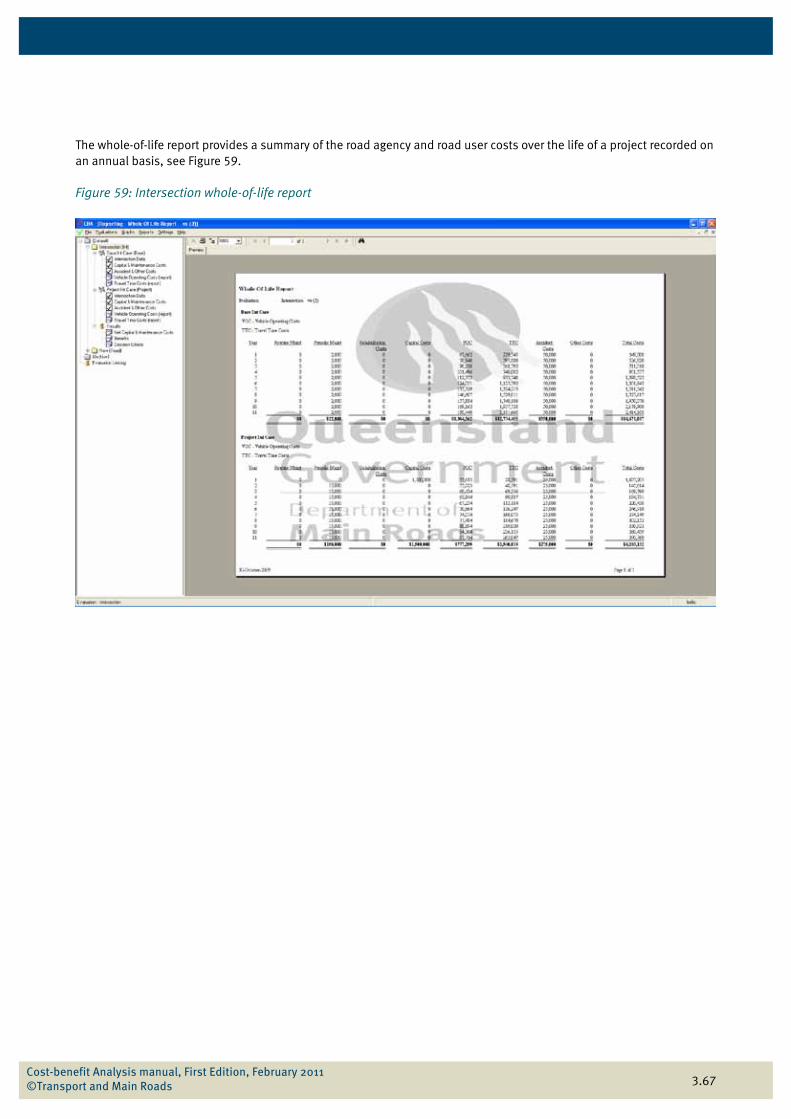
The whole-of-life report provides a summary of the road agency and road user costs over the life of a project recorded on an annual basis, see Figure 59.
Figure 59: Intersection whole-of-life report
Cost-benefit Analysis manual, First Edition, February 2011 ©Transport and Main Roads
3.68
4.7 Printing reports
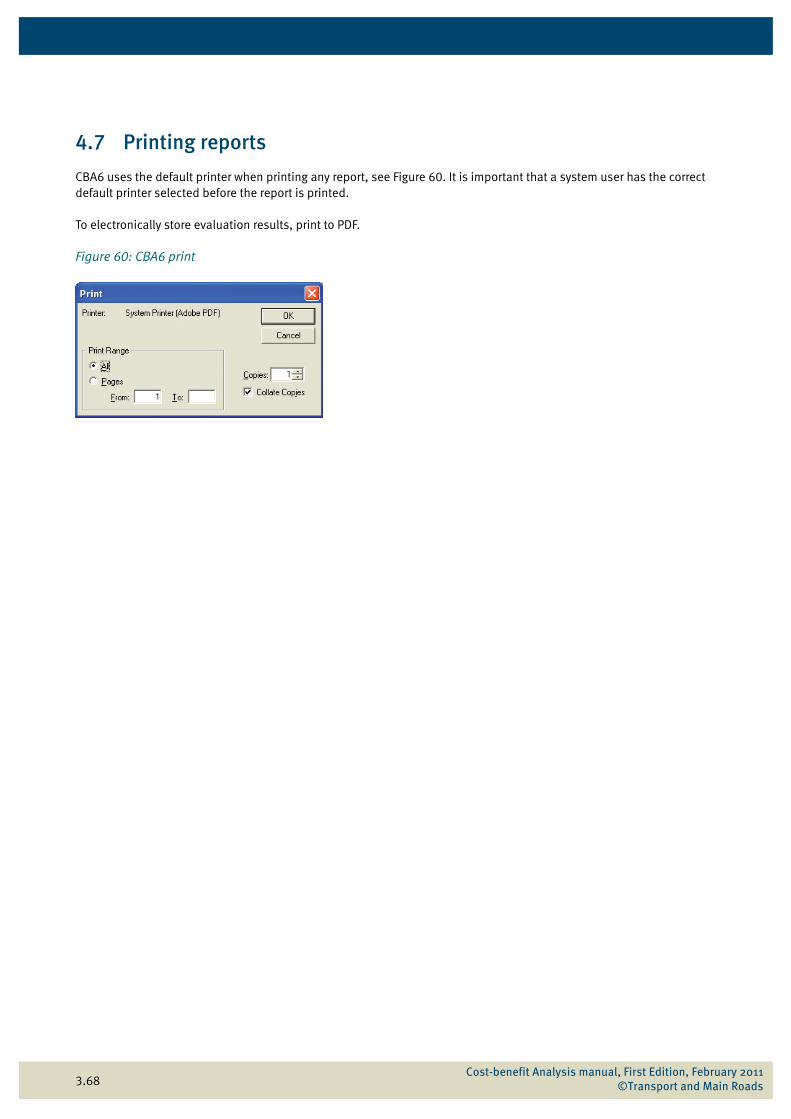
CBA6 uses the default printer when printing any report, see Figure 60. It is important that a system user has the correct default printer selected before the report is printed.
To electronically store evaluation results, print to PDF.
Figure 60: CBA6 print
Cost-benefit Analysis manual, First Edition, February 2011 ©Transport and Main Roads
3.69
4.8 Graphs
CBA6 allows the system user to graph selected variables per case against time. This function provides a valuable resource for system users to access visual representations of the inner workings of the tool while also providing a source of analysis for use in CBA reports.
The system user has the option of graphing the following variables:
• AADT (per vehicle type)
• AADT (total)
• operating speed (per vehicle type)
• volume in passenger car equivalents (per vehicle type)
• volume in passenger car equivalents (total)
• volume capacity ratios
• roughness count
• TTC
• VOC
• accident costs
• other costs
• total costs.
To create a graph the system user highlights a specific evaluation and selects the graph menu option, see Figure 14. The economic data graph option screen is shown in Figure 60. The system user can graph an individual case or both the base and project cases, using the arrow keys to select which case to graph. The system user can also specify the variables to be graphed on the Y axis. The primary Y axis option creates a line graph while the secondary Y axis options create a bar graph. The primary and secondary Y axis variables can be run simultaneously. The years to be graphed can also be specified in CBA6.
Cost-benefit Analysis manual, First Edition, February 2011 ©Transport and Main Roads
3.70
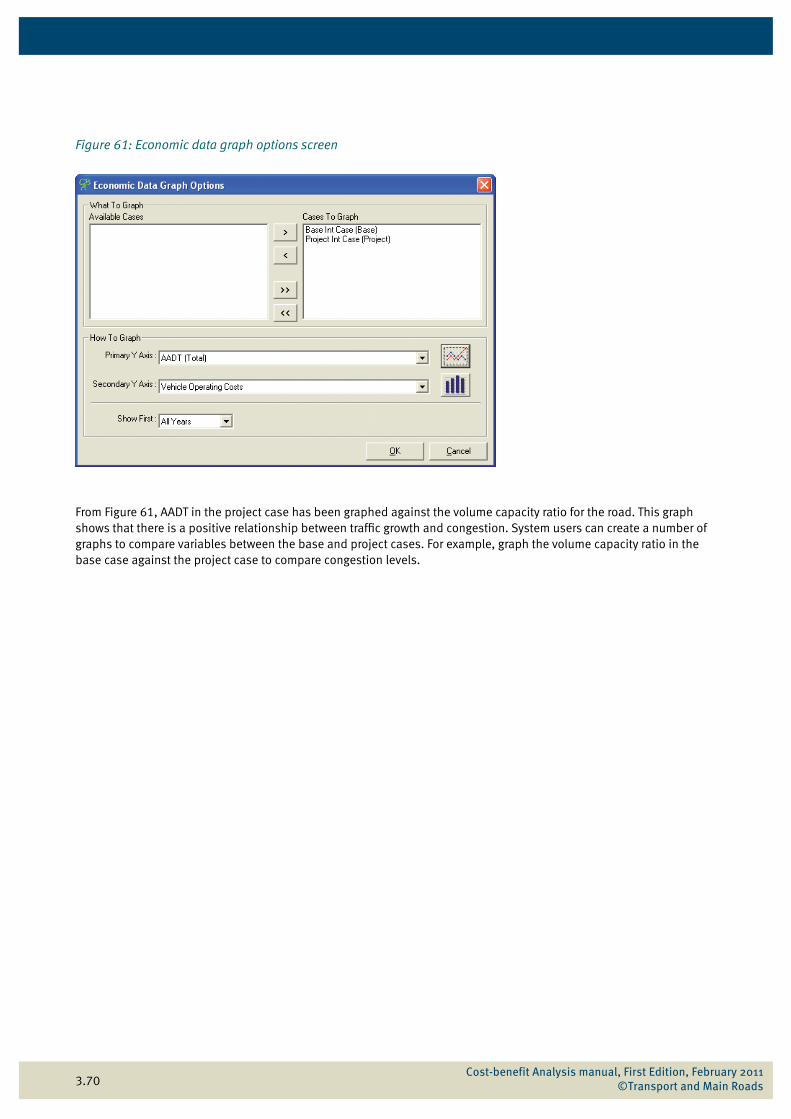
Figure 61: Economic data graph options screen
From Figure 61, AADT in the project case has been graphed against the volume capacity ratio for the road. This graph shows that there is a positive relationship between traffic growth and congestion. System users can create a number of graphs to compare variables between the base and project cases. For example, graph the volume capacity ratio in the base case against the project case to compare congestion levels.
Cost-benefit Analysis manual, First Edition, February 2011 ©Transport and Main Roads
3.71
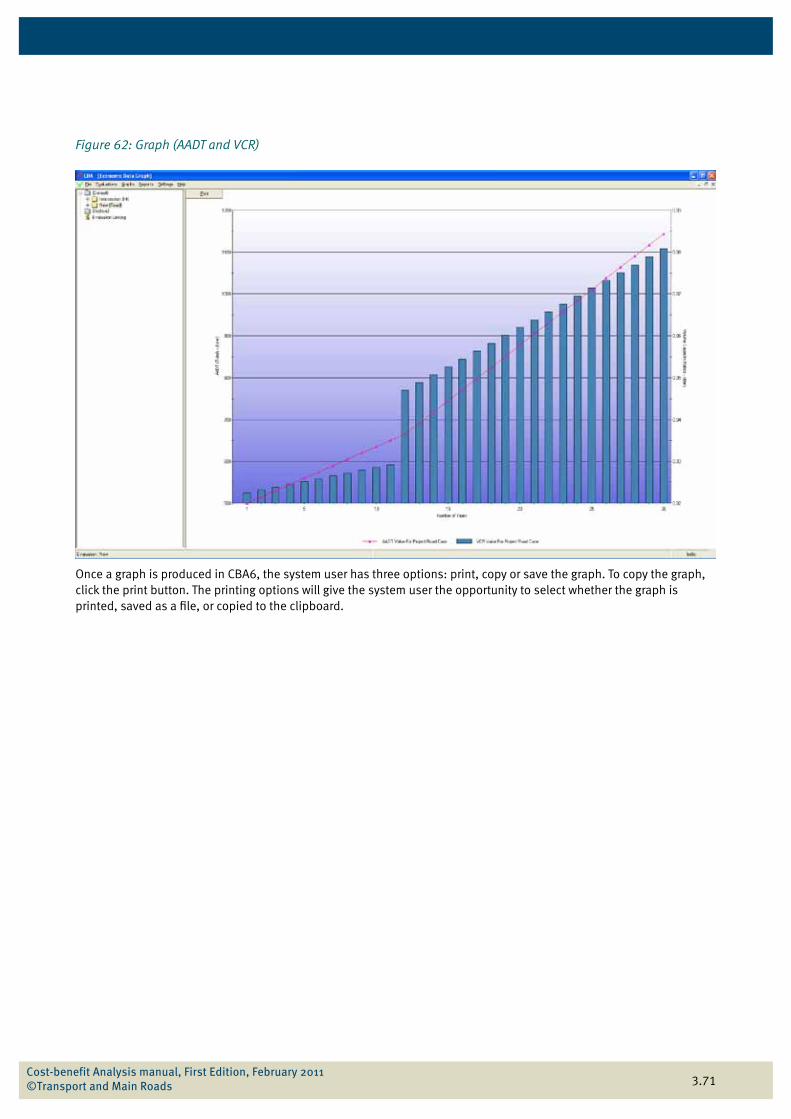
Figure 62: Graph (AADT and VCR)
Once a graph is produced in CBA6, the system user has three options: print, copy or save the graph. To copy the graph, click the print button. The printing options will give the system user the opportunity to select whether the graph is printed, saved as a file, or copied to the clipboard.
Cost-benefit Analysis manual, First Edition, February 2011 ©Transport and Main Roads
3.72
4.9 Understanding the results
When completing a road project evaluation, there are certain results that occasionally appear erroneous. For example, in the decision criteria, there may be disbenefits, negative costs and negative first year rates of return. This section aims to highlight the majority of these issues and explain what they mean in the context of CBA6.
Note: The system user is directed to the Technical Guide for information on the calculations made by CBA6.
4.9.1 Disbenefits
Most benefits are a result of the savings in road user costs between the base and project cases. If the project case costs exceed those of the base case, this is likely to be reflected in CBA6 as a negative benefit, or disbenefit.
Note: Disbenefits are displayed in red in the CBA6 results screen.
For example, provision of an improved road surface may increase the speed of the fleet, leading to increased consumption of fuel, oil and tyres. This increase in VOC is transferred to the road user who incurs this extra cost. In CBA6, this would result in a disbenefit to the road user. VOC are typically the most common disbenefit. These disbenefits are not usually incorrect or misleading. Where these disbenefits exist, project results should be carefully scrutinised for errors in the inputs. Examples where outputs may warrant cross check of the inputs could include:
• When CBA6 generates travel time disbenefits even though operating speed increases in the project case. For example, in the case of a bypass, the project will result in faster operating speeds but the appearance of disbenefits as AADT is higher.
• When CBA6 generates accident disbenefits although the width of the road has increased, resulting in a safer road. For example, this could occur where the section length is longer in the project case.
• When VOC increase in the project case despite an improvement in the road surface.
4.9.2 Negative costs
Negative costs are fundamentally the opposite of disbenefits. Negative costs refer to the savings in operating and maintenance costs, including any residual value, and will be displayed in red in the ‘decision criteria’ screen under the heading of ‘other costs’. Like disbenefits, negative costs are not necessarily incorrect or misleading. As previously mentioned, negative costs are the result of savings in maintenance costs over the life of a project, and can be due to better pavement construction.
4.9.3 Conflicting results from decision criteria
Conflicting results are unusual, but can occur within the decision criteria. It is possible to get BCR below 1 but positive NPV, or negative FYRR and BCR above 1. For example:
• If an alternative maintenance strategy is proposed to the current strategy, a BCR below 1 may result if the alternative maintenance strategy costs less than the current strategy.
• A project may result in a negative FYRR if there are disbenefits in the first year of operation.
If the decision criteria indicators are not clear, decisions should be based on NPV alone.
Cost-benefit Analysis manual, First Edition, February 2011 ©Transport and Main Roads
3.73
4.10 Response to unexpected results
Table 2 provides a useful output matrix for the system user to apply when confronted with unexpected results. System users can ensure the accuracy of the results by checking the inputs against the outputs. For example if a project provides accident disbenefits, the system user should check the road description (MRS, section length and AADT inputs). In this case, an incorrect MRS may have been used for the project case. This would mean the results in CBA6 are due to a human error. However if the project case has a longer section length than the base case it would be reasonable for accident disbenefits to occur. If system users observe unexpected or conflicting results, this table may assist in cross checking the outputs with the appropriate inputs. For further assistance, system users should direct all queries to the CBA Team.
Ultimately all results in CBA6 can be manually calculated and cross checked using the formulas presented in the Technical Guide.
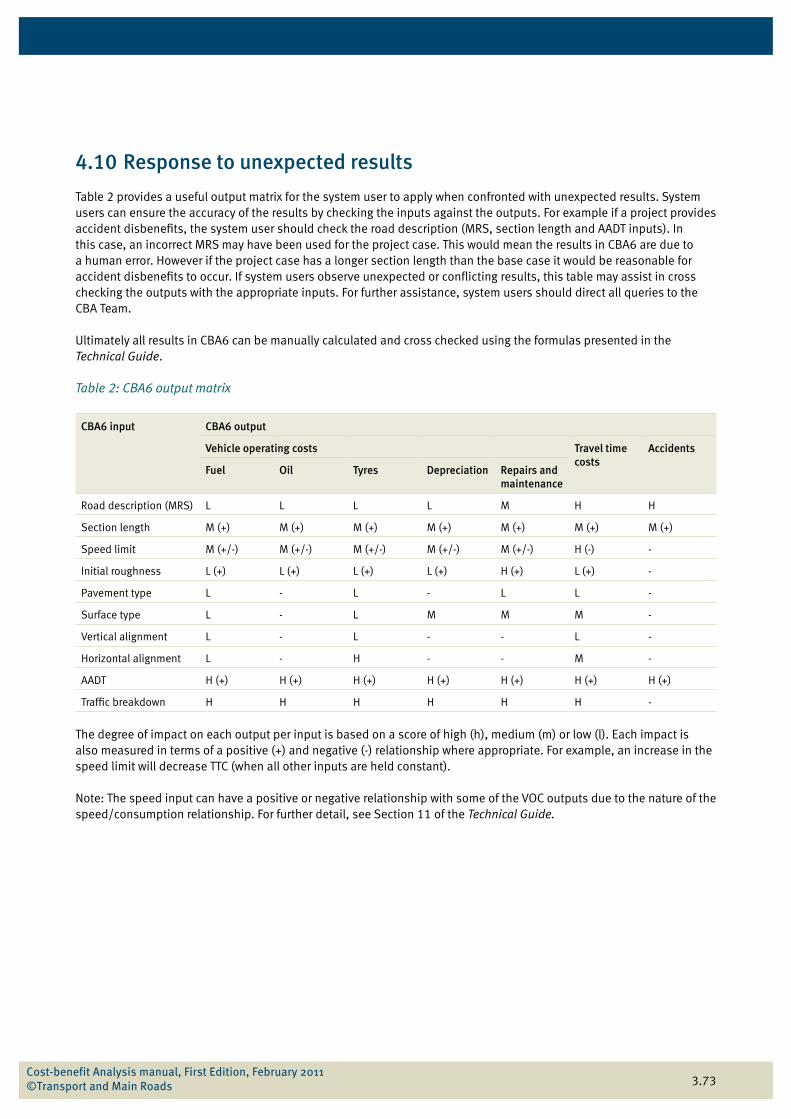
Table 2: CBA6 output matrix
CBA6 input CBA6 output
Vehicle operating costs Travel time costs
Accidents
Fuel Oil Tyres Depreciation Repairs and maintenance
Road description (MRS) L L L L M H H
Section length M (+) M (+) M (+) M (+) M (+) M (+) M (+)
Speed limit M (+/-) M (+/-) M (+/-) M (+/-) M (+/-) H (-) -
Initial roughness L (+) L (+) L (+) L (+) H (+) L (+) -
Pavement type L - L - L L -
Surface type L - L M M M -
Vertical alignment L - L - - L -
Horizontal alignment L - H - - M -
AADT H (+) H (+) H (+) H (+) H (+) H (+) H (+)
Traffic breakdown H H H H H H -
The degree of impact on each output per input is based on a score of high (h), medium (m) or low (l). Each impact is also measured in terms of a positive (+) and negative (-) relationship where appropriate. For example, an increase in the speed limit will decrease TTC (when all other inputs are held constant).
Note: The speed input can have a positive or negative relationship with some of the VOC outputs due to the nature of the speed/consumption relationship. For further detail, see Section 11 of the Technical Guide.
Cost-benefit Analysis manual, First Edition, February 2011 ©Transport and Main Roads
3.74
4.11 Presenting CBA6 results
Once the system user has completed an evaluation, there are several presentation options. Results can be presented in the form of standard and detailed road case reports (see Section 4.6.1) which can be used as attachments to funding proposals. Alternatively system users can use the CBA6 reports (decision criteria, see Figure 53) or the ‘copy to clipboard’ function to create a variety of graphs to illustrate discussion points.
Note: Interpretation of CBA results can often be quite challenging. The advice of qualified specialists should be sought when interpreting results and making conclusions of the CBA.
Cost-benefit Analysis manual, First Edition, February 2011 ©Transport and Main Roads


![ONTARIO POWER GENERATION REPORTS 2008 FINANCIAL RESULTS Reports... · 2019-04-12 · ONTARIO POWER GENERATION REPORTS 2008 FINANCIAL RESULTS [Toronto]: Ontario Power Generation Inc.](https://static.fdocuments.net/doc/165x107/5f0cf1577e708231d437e555/ontario-power-generation-reports-2008-financial-results-reports-2019-04-12.jpg)


