4. NOISE AND VIBRATION PREDICTION METHODOLOGY 4.1 Noise ... · The operating characteristics are...
42
Noise and Vibration Technical Report: Metro Gold Line Foothill Extension, Azusa to Montclair July 2012 Page 38 4. NOISE AND VIBRATION PREDICTION METHODOLOGY 4.1 Noise Prediction Models This sections covers noise associated with light-rail vehicle (LRV) operations, BNSF Freight and Metrolink operations, audible warning devices, traction power substations (TPSS), and construction. In general, the approach follows the Detailed Noise Assessment guidelines outlined in the FTA Guidance Manual. The steps are: 1. Identify noise sensitive receivers. Noise sensitive land uses were first identified using aerial photography. Field visits were then conducted to confirm land uses and gather additional relevant information, such as the presence of second stories or intervening structures. Sensitive receivers were then grouped together based on their location relative to the tracks and operational factors, such as train speed, that affect noise levels. The predictions for each cluster were based on the distance from the proposed project to the closest sensitive receiver in each cluster. The clusters used for assessment are shown in the figures in Appendix B. 2. Determine existing noise levels. Measurements of noise levels were taken at 21 locations to estimate the existing noise level at each cluster of receivers. 3. Develop noise prediction models. The noise prediction models are based on formulas provided in the FTA Guidance Manual, equipment specifications, safety regulations, and noise measurements of trains on the existing Gold Line. The prediction models are explained in detail in Section 4.1.1 through Section 4.1.6 4. Estimate future noise levels at each cluster of receivers. Apply the prediction models to estimate the project noise at each cluster. Compare the predicted noise levels to the applicable FTA impact thresholds to identify potential noise impacts. 5. Recommend noise mitigation measures. Noise mitigation options were evaluated for all locations where predicted noise levels exceed the Severe or Moderate impact thresholds. 4.1.1 Prediction Model, Noise from Light-Rail Vehicle Operations The following noise emissions and operating conditions are the basis for the light-rail vehicle (LRV) noise for the Metro Gold Line Foothill Extension Azusa to Montclair project: • Maximum sound level (Lmax) of 77 dBA for a two car train operating at 40 mph on ballast and tie track at a distance of 50 feet • Maximum train speed of 65 mph and maximum acceleration and deceleration of 4.4 feet/second 2 when entering and exiting stations
Transcript of 4. NOISE AND VIBRATION PREDICTION METHODOLOGY 4.1 Noise ... · The operating characteristics are...
Noise and Vibration Technical Report: Metro Gold Line Foothill Extension, Azusa to Montclair July 2012 Page 38
4. NOISE AND VIBRATION PREDICTION METHODOLOGY
4.1 Noise Prediction Models
This sections covers noise associated with light-rail vehicle (LRV) operations, BNSF Freight and Metrolink operations, audible warning devices, traction power substations (TPSS), and construction. In general, the approach follows the Detailed Noise Assessment guidelines outlined in the FTA Guidance Manual. The steps are:
1. Identify noise sensitive receivers. Noise sensitive land uses were first identified using aerial photography. Field visits were then conducted to confirm land uses and gather additional relevant information, such as the presence of second stories or intervening structures. Sensitive receivers were then grouped together based on their location relative to the tracks and operational factors, such as train speed, that affect noise levels. The predictions for each cluster were based on the distance from the proposed project to the closest sensitive receiver in each cluster. The clusters used for assessment are shown in the figures in Appendix B.
2. Determine existing noise levels. Measurements of noise levels were taken at 21 locations to estimate the existing noise level at each cluster of receivers.
3. Develop noise prediction models. The noise prediction models are based on formulas provided in the FTA Guidance Manual, equipment specifications, safety regulations, and noise measurements of trains on the existing Gold Line. The prediction models are explained in detail in Section 4.1.1 through Section 4.1.6
4. Estimate future noise levels at each cluster of receivers. Apply the prediction models to estimate the project noise at each cluster. Compare the predicted noise levels to the applicable FTA impact thresholds to identify potential noise impacts.
5. Recommend noise mitigation measures. Noise mitigation options were evaluated for all locations where predicted noise levels exceed the Severe or Moderate impact thresholds.
4.1.1 Prediction Model, Noise from Light-Rail Vehicle Operations
The following noise emissions and operating conditions are the basis for the light-rail vehicle (LRV) noise for the Metro Gold Line Foothill Extension Azusa to Montclair project:
• Maximum sound level (Lmax) of 77 dBA for a two car train operating at 40 mph on ballast and tie track at a distance of 50 feet
• Maximum train speed of 65 mph and maximum acceleration and deceleration of 4.4 feet/second2 when entering and exiting stations

Noise and Vibration Technical Report: Metro Gold Line Foothill Extension, Azusa to Montclair July 2012 Page 39
• Train Schedule:
Table 8: Operating Schedule for Noise Predictions
Time Headway Train Length 4am-6am 20 minutes 2 cars 6am-9am 10 minutes 2 cars 9am-3pm 20 minutes 2 cars 3pm-7pm 10 minutes 2 cars 7pm-1am 20 minutes 2 cars
Source: Metro Gold Line Foothill Extension Construction Authority, 2011
The operating characteristics are used to predict the levels of train noise using formulas included in the FTA Guidance Manual. The principal formulas are:
Relationship between Lmax and SEL:
3.3))2sin(2(log10max +
+×−= αα
lengthspeedLSEL
where:
speed = velocity in mph,
length = length of train in feet (2 car light rail train = 180 feet),
α = tan-1(length/2y), and
y = distance from track centerline to sensitive receiver.
Ground absorption effect:
42;0
425);42
1(75.0
5;66.02
≥=
≤≤−=
≤=
+=
eff
eff
eff
eff
HG
HHeffG
HG
HrHsH
where:
Heff = Effective height,
Noise and Vibration Technical Report: Metro Gold Line Foothill Extension, Azusa to Montclair July 2012 Page 40
Hs = Height of the noise source (2 feet),
Hr = Height of the receiver (5 feet), and
G = Ground factor.
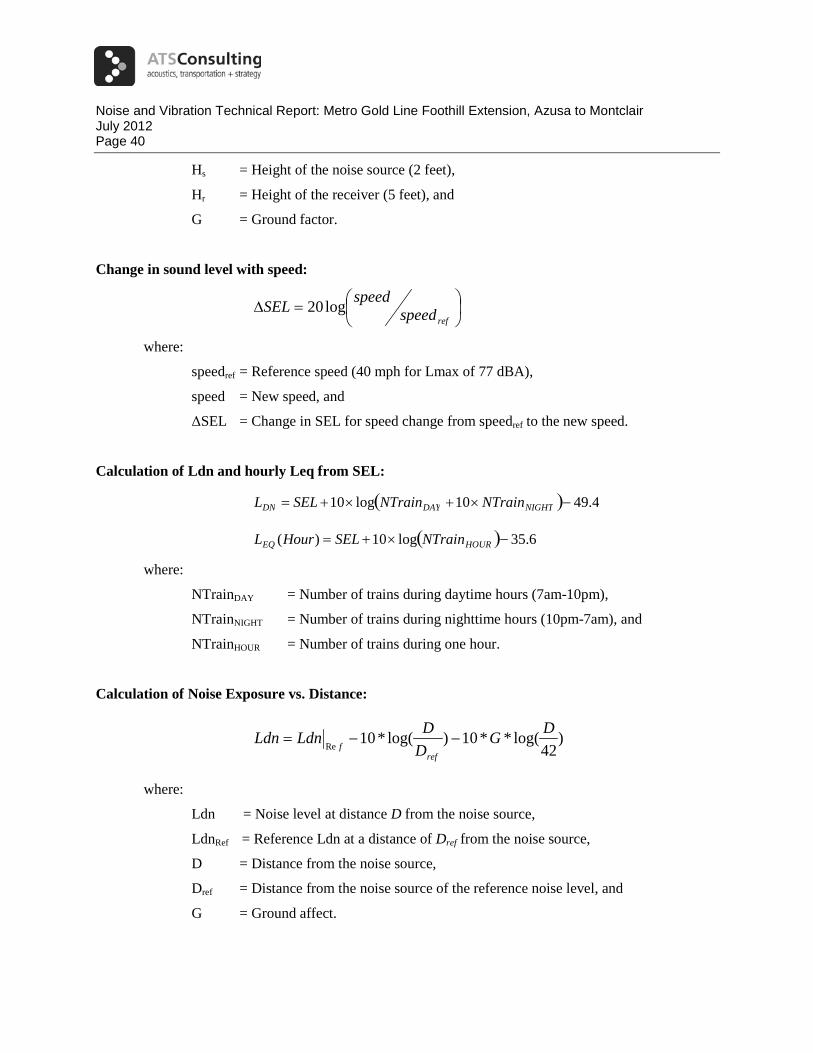
Change in sound level with speed:
=∆
refspeedspeedSEL log20
where:
speedref = Reference speed (40 mph for Lmax of 77 dBA),
speed = New speed, and
ΔSEL = Change in SEL for speed change from speedref to the new speed.
Calculation of Ldn and hourly Leq from SEL:
where:
NTrainDAY = Number of trains during daytime hours (7am-10pm),
NTrainNIGHT = Number of trains during nighttime hours (10pm-7am), and
NTrainHOUR = Number of trains during one hour.
Calculation of Noise Exposure vs. Distance:
)42
log(**10)log(*10Re
DGDDLdnLdnref
f−−=
where:
Ldn = Noise level at distance D from the noise source,
LdnRef = Reference Ldn at a distance of Dref from the noise source,
D = Distance from the noise source,
Dref = Distance from the noise source of the reference noise level, and
G = Ground affect.
( ) 6 . 35 log 10 ) ( − × + = HOUR EQ NTrain SEL Hour L
( ) 4 . 49 10 log 10 − × + × + = NIGHT DAY DN NTrain NTrain SEL L

Noise and Vibration Technical Report: Metro Gold Line Foothill Extension, Azusa to Montclair July 2012 Page 41
4.1.2 Prediction Model, BNSF Freight and Metrolink Trains
The following noise emissions and operating conditions are the basis for the BNSF freight noise from the Metro Gold Line Foothill Extension Azusa to Montclair project:
• A reference SEL of 88.4 dBA at 40 mph at 100 feet. This level is based on a compilation of measurements from many freight trains.
• A train speed of 30 mph. This was based on observed speeds of BNSF trains in the existing corridor.
• One train in each direction per day in Glendora, San Dimas, and La Verne. Two trains in each direction per day in Pomona and Claremont. All trains are during the daytime hours (7am to 10 pm). The inbound and outbound trains travel on the same track, except in Claremont.
The following noise emissions and operating conditions are the basis for the Metrolink commuter rail noise:
• A reference SEL of 88.4 dBA at 40mph at 100 feet. This is the same reference value used for the BNSF freight trains.
• A train speed of 50 mph. this was based on measured train speeds of Metrolink trains through Claremont.
• Train Schedule: 13 daytime trains and 5 nighttime trains for the westbound direction and 17 daytime trains and 1 nighttime train for the eastbound direction. This is based on the current Metrolink schedule.
The operating characteristics are used to predict the levels of train noise using formulas used for the LRV noise prediction model that are included in the FTA Guidance Manual. However, BNSF and Metrolink train noise includes noise generated by both the locomotives and rail cars (LRVs are electrically powered and do not have locomotives). Assumptions for the predictions of BNSF and Metrolink train noise are:
• There is one locomotive per train.
• Locomotives are modeled as monopole and rail cars as dipole sources.
• The change in sound level with speed is:
=∆
=∆
ref
ref
speedspeedLdnlocomotive
speedspeedLdnrailcar
log*30:
log*20:

Noise and Vibration Technical Report: Metro Gold Line Foothill Extension, Azusa to Montclair July 2012 Page 42
4.1.3 Prediction Model, Audible Warnings
4.1.3.1 Audible Warnings on Light-Rail Vehicles
The California Public Utilities Commission (CPUC) requires that audible warnings be sounded as light-rail trains approach all gate protected crossings. The requirements and general Metro practices for sounding LRV horns are:
• Every light-rail vehicle must be equipped with a bell or horn that generates a sound level of 85 dBA at a distance of 100 feet from the vehicle (CPUC General Order 143B). Most automobile horns generate a sound level of 80 to 85 dBA at a distance of 100 feet, so the LRV horn is slightly louder than most automobile horns.
• The light-rail vehicles are also equipped with a low-volume horn with a sound level of 75 dBA at 100 feet from the vehicle.
• The light-rail vehicle operator must sound an audible warning when approaching at-grade crossings protected by automatic crossing signals. The standard operating procedure on Phase 1 of the Metro Gold Line is to sound the low-volume horn (75 dBA at 100 feet) before at-grade crossings.
• The louder horn is used in case of emergency and at the discretion of the train operator.
Metro’s operating procedure calls for the train operators to sound the 75 dBA warning horn prior to all gate-protected crossings starting approximately 300 feet prior to the crossing. At speeds greater than 35 mph, the noise from the horn adds less than 1 dB to the noise exposure caused by light-rail train operations. The horn has not been included as a separate source in the noise analysis because train speeds greater than 35 mph have been assumed for all gate-protected crossings where the horn will be sounded.
4.1.3.2 Audible Warnings on BNSF Freight and Metrolink Vehicles
The governing body for BNSF freight audible warning practices is the Federal Railroad Administration. The FRA regulations for sounding the locomotive horn are:
• Engineers must sound train horns for a minimum of 15 seconds before a grade crossing, or if the train is traveling faster than 45 mph, when the train is within 1/4 mile of the crossing.
• Train horns must be sounded in the standardized pattern of 2 long, 1 short and 1 long. The horn must continue to sound until the lead locomotive or train car occupies the grade crossing.
• The minimum train horn volume is 96 dBA (Lmax) at a distance of 100 feet from the train. The maximum volume is 110 dBA (Lmax) at a distance of 100 feet from the train.
• Metrolink train horn noise was measured in the corridor. The measured horn noise was approximately 10 dB lower than the freight horn noise.
The minimum freight train horn volume corresponds to an SEL of 107 dBA at a distance of 100 feet. The measured Metrolink train horn volume corresponds to an SEL of 97 dBA. Freight train horns are

Noise and Vibration Technical Report: Metro Gold Line Foothill Extension, Azusa to Montclair July 2012 Page 43
significantly louder and sounded for longer periods of time when compared to horns on LRVs. The freight train horns can dominate the Ldn noise level in a neighborhood, significantly increasing the 24-hour noise level in areas adjacent to an at-grade crossing where the horn is sounded. The following formulas were used to predict the noise contribution from freight and Metrolink horns:
Calculation of Ldnref for Horn Noise:
49)*10(*10 −++= nightdayref EELogSELLdn ,
where:
Ldnref = Ldn at 100 feet,
SEL = Sound exposure level at 100 feet,
Eday = Number of times the horn is sounded during the daytime hours (7am to 10 pm),
Enight = Number of times the horn is sounded during the nighttime hours (10 pm to
7am).
Calculation of Noise Exposure vs. Distance:
−=
refref D
DLdnLdn log*15
where:
Ldn = Ldn at distance D,
Ldnref = Ldn at 100 feet,
D = Distance to the horn, and
Dref = Reference distance of 100 feet.
4.1.4 Prediction Model, Existing Traffic and Environmental Noise
The predicted future noise level with LRT operations must also include vehicular traffic and other environmental noise sources. The existing noise levels presented in Section 2 are used to account for those noise sources. However, the existing BNSF and Metrolink tracks will be relocated as a part of the project. Noise associated with the freight and Metrolink operations were subtracted from the measured noise level to determine the existing traffic and environmental noise not associated with the project.

Noise and Vibration Technical Report: Metro Gold Line Foothill Extension, Azusa to Montclair July 2012 Page 44
4.1.5 Prediction Model, Traction Power Substations (TPSS)
The primary noise sources on TPSS units are the transformer hum and noise from cooling systems. The TPSS units will be designed to comply with the MTA Design Criteria4 for noise from transit system ancillary facilities. The MTA Design Criteria are presented in Table 9. TPSS units are assumed to run continuously and any residential areas near the proposed TPSS locations are considered average residential density. The thresholds presented in the table are the maximum noise level at a distance of 50 feet from the unit or at the setback line of the nearest building, whichever is closer.
The maximum noise level (Lmax) in Table 9 is converted to Ldn to compare to the FTA Impact Criteria at the nearest cluster. The formula to convert Lmax to Ldn is:
8.13)1091015log(10)
1010max()
10max(
−∗+∗∗=+LL
TPSSLdn .
Using an Lmax of 45 dBA (for a continuous noise source in a community with average residential density) the corresponding Ldn is 51 dBA.
Table 9: Metro Design Criteria for Noise from Transit System Ancillary Facilities
Community Area Maximum Noise Level (dBA)1
Transient Continuous Low Density Residential 50 40
Average Residential 55 45 High-density residential 60 50
Commercial 65 55 Industrial/highway 75 65
Source: Metro Design Criteria, Table 2-9 (LACMTA 2009) 1Maximum noise level at a distance of 50 feet or at the setback line of the nearest building, whichever is closer.
4.1.6 Prediction Model, Construction Noise
Construction noise levels depend on the number of pieces and type of equipment, their general condition, the amount of time each piece operates per day, the presence of any noise attenuating features such as walls and berms, and the location of the construction activities relative to the sensitive receivers. The majority of these variables are left to the discretion of the contractor so that assessment of construction noise is a professional judgment of the likely means and methods that would be used by the contractor.
The construction of LRT guideway requires use of heavy earth-moving equipment, pneumatic tools, generators, concrete pumps, and similar equipment. Table 10 shows categories of equipment that are likely to be used and the typical noise generated by this equipment when it is operating at full load. The typical noise levels, along with estimates of what equipment would be used during the loudest phases of
4 Los Angeles County Metropolitan Transportation Authority. 2010. Metro Rail Design criteria, Section 2 Environmental Considerations.
Noise and Vibration Technical Report: Metro Gold Line Foothill Extension, Azusa to Montclair July 2012 Page 45
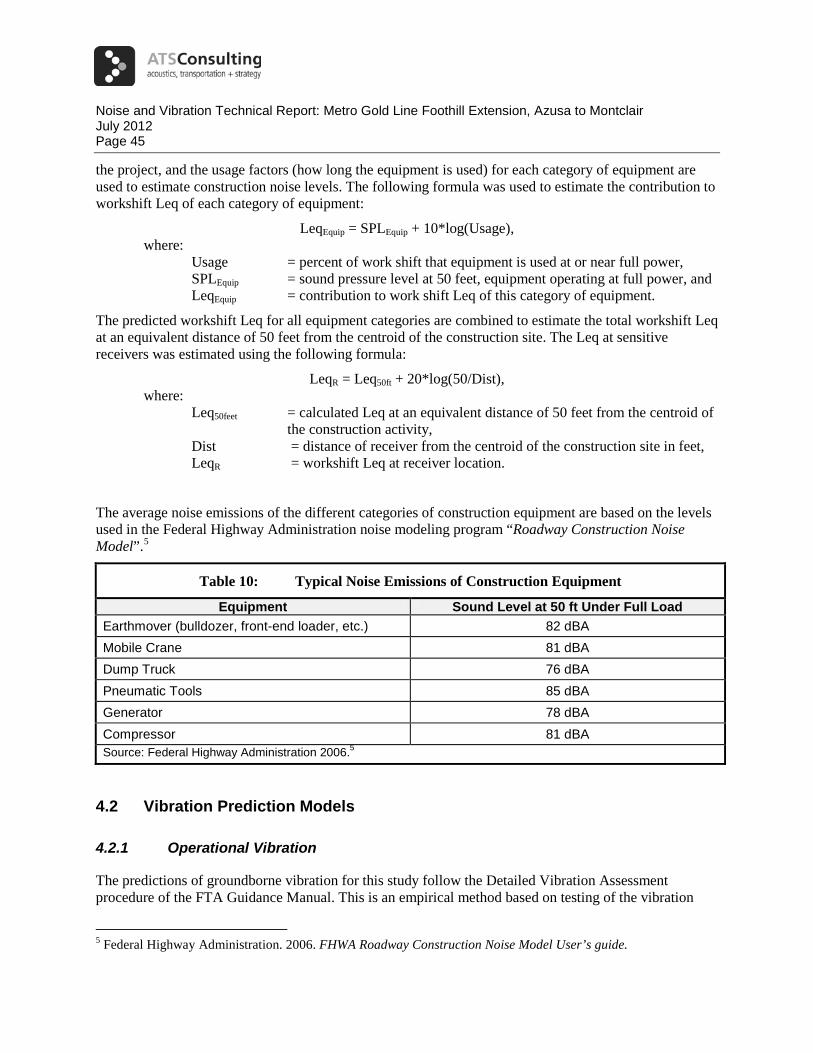
the project, and the usage factors (how long the equipment is used) for each category of equipment are used to estimate construction noise levels. The following formula was used to estimate the contribution to workshift Leq of each category of equipment:
LeqEquip = SPLEquip + 10*log(Usage), where: Usage = percent of work shift that equipment is used at or near full power, SPLEquip = sound pressure level at 50 feet, equipment operating at full power, and LeqEquip = contribution to work shift Leq of this category of equipment.
The predicted workshift Leq for all equipment categories are combined to estimate the total workshift Leq at an equivalent distance of 50 feet from the centroid of the construction site. The Leq at sensitive receivers was estimated using the following formula:
LeqR = Leq50ft + 20*log(50/Dist), where: Leq50feet = calculated Leq at an equivalent distance of 50 feet from the centroid of the construction activity, Dist = distance of receiver from the centroid of the construction site in feet, LeqR = workshift Leq at receiver location.
The average noise emissions of the different categories of construction equipment are based on the levels used in the Federal Highway Administration noise modeling program “Roadway Construction Noise Model”.5
Table 10: Typical Noise Emissions of Construction Equipment
Equipment Sound Level at 50 ft Under Full Load Earthmover (bulldozer, front-end loader, etc.) 82 dBA Mobile Crane 81 dBA Dump Truck 76 dBA Pneumatic Tools 85 dBA Generator 78 dBA Compressor 81 dBA Source: Federal Highway Administration 2006.5
4.2 Vibration Prediction Models
4.2.1 Operational Vibration
The predictions of groundborne vibration for this study follow the Detailed Vibration Assessment procedure of the FTA Guidance Manual. This is an empirical method based on testing of the vibration
5 Federal Highway Administration. 2006. FHWA Roadway Construction Noise Model User’s guide.

Noise and Vibration Technical Report: Metro Gold Line Foothill Extension, Azusa to Montclair July 2012 Page 46
propagation characteristics of the soil in the project corridor and measurements of the vibration characteristics of a similar light-rail vehicle. The vibration propagation test is used to determine the line source transfer mobility (LSTM). The LSTM quantifies how easily vibration travels through the earth (a high transfer mobility indicates that there is relatively little attenuation as vibration travels through the earth). The vibration characteristics of the light-rail vehicle is quantified by the force density level (FDL). The basic relationship used for the vibration predictions is:
Lv = LSTM + FDL,
where:
Lv = Train vibration velocity measured at the ground surface,
LSTM = Measured line source transfer mobility, and
FDL = Measured force density level that characterizes the vibration forces generated by the train and track.
The following procedure was used to develop vibration predictions:
1. Combine the LSTMs with similar results into groups. After inspection of the test results, the sites were combined into three groups: Glendora, San Dimas/La Verne, and Pomona/Claremont. Figures of the LSTM within each group are shown in 0.
2. Develop the worst-case LSTM curves for each group by enveloping the LSTM results for that group. Some LSTM results with poor coherence data or from outdated measurements were not included in the enveloping procedure.
3. The worst-case LSTM curves were combined with the FDL to develop predicted vibration level spectra.
4. Add 3 dB to each 1/3 octave band to account for potential amplification effects from buildings and other possible sources of error in the predictions (experimental error from LSTM and FDL measurements).
5. Include additional adjustments based on site-specific design:
• Speed Adjustment: 20*log(speed/reference speed)
• Crossover: +10 VdB amplification for sensitive receivers located within 100 feet from a crossover
• Aerial: -5 VdB attenuation for sensitive receivers where tracks would be on an aerial structure
• Distance: Use best-fit coefficients for each 1/3 octave band from the worst-case LSTM curves to calculate the LSTM values at the distance from the tracks to the nearest sensitive receiver in the cluster

Noise and Vibration Technical Report: Metro Gold Line Foothill Extension, Azusa to Montclair July 2012 Page 47
4.2.1.1 Force Density Level
The FDL is derived by measuring the LSTM and existing vibration levels (Lv) at a site with existing train operations. For this project, the FDL measurements were taken in 2008 at the historic Cornfield State Park, which is just north of the Chinatown Station of Gold Line Phase 1 (currently in operation). The measured FDL is shown in Figure 28. The vibration and LSTM measurements used to calculate the FDL are presented in 0. The train speeds during the existing vibration measurements were an average of 53 mph.
Figure 28: Force Density Level for 53 mph Gold Line Trains
4.2.1.2 LSTM Measurements
Vibration propagation tests were performed at 17 locations throughout the corridor. Five tests were performed in October 2003 (sites V-4 through V-8), two locations in July 2005 (V-10 and V-11) and ten locations in February and March 2011 (sites V-12 through V-21). The measured LSTM data from 2011 is presented in Section 2 and the measured LSTM data from the other tests can be found in the 2007 FEIR.
Best-fit curves for each of the measurement sites were used to compare the LSTM results and to combine the test sites with similar results into groups. After comparison of the test results, the sites were combined into three groups: Glendora test sites (V-4, and V-10 to V-14), San Dimas/La Verne test sites (V-5 , V-6, V-16, V-17), and Pomona/Claremont Test Sites (V-7, V-8, and V-18 to V-21). For each group, a worst-case LSTM curve was developed by using the highest LSTM value in each 1/3 octave band. Data with poor coherence or data from older measurements that were not consistent with updated measurements from 2011 was not included in the worst-case envelopes. 0 shows the best-fit LSTM results for each measurement site. The worst-case LSTM for each city is shown in Figure 29 below. The LSTM curves show:
• In Glendora, the LSTM has relatively high amplitude at close distances (25 to 50 feet), and shows moderate attenuation with distance.

Noise and Vibration Technical Report: Metro Gold Line Foothill Extension, Azusa to Montclair July 2012 Page 48
• In San Dimas/La Verne, the LSTM levels are lower than the Glendora and Pomona/Claremont groups, and show significant attenuation with distance, especially from 25 to 50 feet.
• In Pomona/Claremont, the LSTM shows little attenuation with distance, especially beyond 50 feet.

Noise and Vibration Technical Report: Metro Gold Line Foothill Extension, Azusa to Montclair July 2012 Page 49
Figure 29: Worst-Case LSTM Curves Used in Vibration Predictions

Noise and Vibration Technical Report: Metro Gold Line Foothill Extension, Azusa to Montclair July 2012 Page 50
4.2.1.3 Indoor Vibration Adjustment
The propagation of vibration from the building foundation into a room is very complex and dependent on the specific design of the building. The FTA Guidance Manual provides some generic adjustments to account for building response and floor resonances of buildings. The manual recommends a gain of approximately 6 dB should be applied to the frequency range of the fundamental response, noting that for a typical wood-frame residential structure the fundamental resonance is usually in the 15 to 20 Hz range. The FTA Manual suggests that measured values may be used in place of these generic adjustments. Measurements were taken indoors at residences throughout both the Pasadena to Azusa and Azusa to Montclair Foothill Extension alignments to identify the typical fundamental resonance of the residential buildings in the area.
LSTM measurements were taken indoors at four residences along the Pasadena to Azusa alignment and at four residences along the Azusa to Montclair alignment to assist in estimating the difference between outdoor and indoor vibration levels including any amplification from floor resonances. Six of the measurements were taken on the second-story of a multi-family residential unit (MFR), one on the first story of a MFR, and one on the first story of a single-family residence (SFR). The addresses for the indoor measurements are:
• 520 Cornell Drive, Arcadia (second story MFR)
• 1614 Unit D Mayflower Avenue, Monrovia (second story MFR)
• 1320 Three Ranch Road, Duarte (single story SFR)
• 824 Unit 22 Pasadena Avenue, Azusa (second story MFR)
• 412 East Lemon Avenue, Glendora (second floor, rear unit in MFR; vibration site V-13)
• 444 North Amelia Avenue Unit 31F, San Dimas (second floor unit in MFR; vibration site V-15)
• 949 Arrow Highway Unit 2, Claremont (first floor of unit in MFR; vibration site V-18)
• 115 North Mountain Avenue, Claremont (second floor corner unit of MFR; vibration site V-20)
The difference in indoor and outdoor vibration levels are presented in Figure 30 below. Positive values on the y-axis indicate amplification in vibration levels and negative values indicate attenuation. Only results from LSTM measurements with coherence greater than 0.2 are shown. There is a wide variation in attenuation levels across all 1/3 octave bands. The average attenuation is between +5 and -5 dB from 20 to 100 Hz. The wide spread in amplification results indicates that the fundamental resonance in the buildings varies significantly.
More detailed measurement data is shown in 0, which shows the indoor and outdoor LSTM levels as well as the coherence for each measurement site.
The following observations can be drawn from the amplification results:
• The Arcadia MFR shows a 5 dB amplification in the 40 Hz 1/3 octave band.

Noise and Vibration Technical Report: Metro Gold Line Foothill Extension, Azusa to Montclair July 2012 Page 51
• The Monrovia MFR shows 5 dB amplification in the 20 Hz 1/3 octave band and 3 dB amplification in the 63, 80, and 100 Hz 1/3 octave bands.
• The Duarte SFR shows amplification of 6 dB and 3 dB in the 25 Hz and 31.5 Hz 1/3 octave bands, respectively.
• The Azusa residence shows amplification of 5 dB or higher in all 1/3 octave bands up to 80 Hz. Amplification over such a wide frequency range is not typical and is probably due to specific aspects of the building construction and floor joists at the measurement position.
• The Glendora MFR shows no amplification. There is attenuation from the building structure in the 25 to 100 Hz frequency range.
• The San Dimas MFR shows poor coherence levels across the entire frequency spectrum. This indicates that the vibration generated from the drop hammer attenuated to levels below the ambient before arriving before at the measurement location Although the result shows some amplification, the coherence never exceeded 0.3, most likely because the line-source transfer mobility was also very low at this site.
• The Claremont second-story MFR measurement (site V-20) shows 15 dB of amplification in the 12.5 Hz 1/3 octave band, 8 dB of amplification in the 20 Hz 1/3 octave band, and 5 dB of amplification in the 31.5 Hz 1/3 octave band. There is high coherence (greater than 0.6) in the 12.5 Hz to 125 Hz frequency range. The result shows significant amplification in the low frequencies.
• The Claremont first-floor MFR indoor measurement (site V-19) shows no evidence of building amplification in any 1/3 octave band.
The measurements show that the fundamental resonant frequency and the amplitude of the resonance varies significantly between residences. In addition, the measurement at the Duarte SFR shows that floor resonances can occur in both one-story and two-story homes. To account for the potential for vibration amplification in residences, the predictions include a factor of +3 dB in all 1/3 octave bands for all residences. Several of the residences show amplification greater than 3 dB; however, many residences do not experience any amplification from floor resonances. An amplification adjustment of +3 dB was applied to the predictions for the following reasons:
• It is impossible to determine which residences through the corridor will see high amplification from floor resonances. Applying an overly conservative amplification adjustment factor will result in predicted levels that are too high throughout much of the corridor.
• There are many conservative assumptions in the prediction models, including using the worst case LSTM curve instead of an average LSTM curve.
• Treatment can be applied to the specific building (such as stiffening the floors) in residences where high levels of amplification is experienced once the system is operational.

Noise and Vibration Technical Report: Metro Gold Line Foothill Extension, Azusa to Montclair July 2012 Page 52
Figure 30: Indoor Minus Outdoor Vibration Levels
4.2.1.4 Metrolink Vibration Predictions
In the city of Claremont, the Metrolink tracks will be relocated south within the right-of-way, potentially increasing existing vibration levels. The existing vibration levels from the Metrolink trains were measured at vibration propagation site V-20 (115 North Mountain Avenue, Claremont) to derive an FDL for the Metrolink trains. The measured vibration levels are shown in 0 and the FDL is shown in Figure 31 below.
The basic relationship used for Metrolink vibration predictions is:
Lv = LSTM + FDL + 3 dB safety factor,
where:
Lv = Train vibration velocity measured at the ground surface,
LSTM = Measured line source transfer mobility,
FDL = Measured force density level that characterizes the vibration forces generated by the train and track, and
Safety Factor = Accounts for potential building amplification and uncertainty in the LSTM and FDL measurements.
The Metrolink FDL and the Claremont Worst-Case LSTM curve developed for the light-rail vibration predictions were used to predict future vibration levels from Metrolink trains where the tracks will be relocated closer to residences. All predictions for Metrolink vibration was based on a speed of 50 mph,

Noise and Vibration Technical Report: Metro Gold Line Foothill Extension, Azusa to Montclair July 2012 Page 53
the average speed of the Metrolink trains measured at site V-20. The site-specific adjustments for speed, special trackwork, and aerial track were not relevant and were not applied to the Metrolink vibration predictions. The +3 dB adjustment applied to account for potential floor resonances and other uncertainties in the LRT vibration predictions was also applied to the Metrolink predictions.
The FTA criteria for impact from the relocation of tracks within an existing right-of-way is a vibration level of 72 VdB and an increase of at least 3 VdB from existing vibration levels. Because it was not possible to measure the existing vibration levels at all residences affected by the relocation of the tracks, the current vibration levels from Metrolink trains were also predicted using the same prediction model, with the LSTM value adjusted for the current distance from the Metrolink tracks to the sensitive receiver instead of adjusted for the future distance from the Metrolink tracks to the sensitive receiver.
Figure 31: Metrolink Force Density Level
4.2.2 Construction Vibration
Some construction activities, such as pile driving, pavement breaking, and the use of tracked vehicles (e.g., bulldozers), could result in perceptible levels of groundborne vibration. However, these activities would be limited in duration and vibration levels are likely to be well below thresholds for minor cosmetic building damage. The approach used to estimate the vibration levels that would be generated during the construction of the proposed project is as follows:
1. Use the vibration source levels for construction equipment from the FTA Manual.
2. Calculate the vibration at the sensitive receiver using the source level in the following formula:
PPVeq = PPVref x (25/D)1.5,
where:

Noise and Vibration Technical Report: Metro Gold Line Foothill Extension, Azusa to Montclair July 2012 Page 54
PPVeq = peak particle velocity in in/sec of the equipment at the sensitive receiver,
PPVref = reference vibration level in in/sec at 25 feet,
D = distance from the equipment to the sensitive receiver.
5. NOISE AND VIBRATION IMPACT ASSESSMENT
5.1 No Build Alternative Under the No Build Alternative, no new infrastructure would be built within the Study Area, aside from projects currently under construction or projects funded for construction, environmentally cleared, planned to be in operation by 2035, and identified in the RTP (SCAG 2008) and LRTP (Metro 2008). Noise that would result from this alternative would be a continuation of the current Study Area noise levels.
Noise from motor vehicles travelling on the existing surface road network dominates the Study Area noise environment. The traffic study for the Project suggests that existing traffic patterns and volumes would remain essentially unchanged. Because traffic-carrying capacity is already at or near saturation, there is almost no opportunity for any appreciable increase in traffic volumes on the existing network. Any slight traffic volume increase would be accompanied by vehicle speeds being reduced, thus the net effect on Ldn is neutral with a slight bias toward a non-perceptible (<1dBA) traffic noise increase, if any change at all. The No Build Alternative would not result in a noise impact.
There would be no operational vibration associated with the No-Build Alternative. No vibration impacts are identified for the No-Build Alternative.
5.2 Transit System Management (TSM) Alternative
The TSM Alternative is a proposed bus rapid transit system that resembles the service of the Build Alternative. Although the number of buses per day would increase within the Study Area, the relative change in the overall number of buses is small compared to the very large existing and future volumes of automobiles and trucks using the area’s local and regional highways. Thus, the effect on the noise environment would be minimal and likely would not be perceptible (<1 dBA) on an Ldn basis. The TSM Alternative would result in no impact.
There would be no operational vibration associated with the TSM Alternative. No vibration impacts are identified for the TSM Alternative.
5.3 TSM Alternative Construction Noise and Vibration
The TSM Alternative would include minimal construction activity associated with the implementation of a bus rapid transit system, such as construction of stations. Until the location and extent of construction is known, accurate noise predictions cannot be made. However, since the construction would be minimal,

Noise and Vibration Technical Report: Metro Gold Line Foothill Extension, Azusa to Montclair July 2012 Page 55
the use of general good-practice noise control methods for construction would result in no significant noise impacts. General noise control methods include:
• Avoid nighttime construction,
• Locate equipment and staging areas as far from noise-sensitive receivers as possible, and
• Limit unnecessary idling of equipment.
The minimal construction activity for the TSM Alternative is unlikely to require activities resulting in groundborne vibration that approaches the vibration limits for damage for even the most fragile buildings. Based on the above, no construction noise or vibration impacts are identified for the TSM Alternative.
5.4 Operational Noise
Noise predictions were made for each cluster of sensitive receivers. The clusters used for assessment are shown in diagrams in Appendix B. The clusters are labeled numerically in ascending order from west to east in each city both north and south of the tracks. Clusters north of the right-of-way are considered westbound clusters (they are closer to the westbound track) and clusters south of the right-of-way are considered eastbound clusters.
The predicted noise levels are presented by city in Section 5.4.1 through Section 5.4.7 below. Two separate tables present the prediction results for each city. The first table in each section (titled Predicted Noise Levels and Impacts) presents the overall predicted noise level at each cluster and identifies those clusters where there are impacts. The second table in each section (titled Predicted Noise Levels by Source) provides the predicted noise levels for each of the noise sources included in the overall predicted noise level. Those noise sources include LRT operations, BNSF operations, BNSF horns, and in Claremont, Metrolink operations and horn noise. The noise source levels provide information on which source dominates the noise environment, and consequently, which noise source mitigation should be applied to if impact is identified at that cluster.
Following are detailed descriptions of the column headings for the Predicted Noise Levels and Impacts tables:
• Cluster No.: The label number used to identify the cluster in the diagrams presented in Appendix B.
• Eng. Station: The engineering station that corresponds to the location of the cluster.
• Dist., ft.: The distance in feet to the centerline of the near LRT track from the nearest building facade in the cluster.
• Speed, mph: The estimated speed of the train as it passes the cluster.
• Existing Ldn, dBA: The measured existing noise level from the closest measurement site that shares similar noise characteristics (e.g. distance to major traffic arterial and existing train lines).

Noise and Vibration Technical Report: Metro Gold Line Foothill Extension, Azusa to Montclair July 2012 Page 56
The results from the existing noise measurements are presented in Section 2: Affected Environment and Existing Conditions.
• Predicted Ldn, dBA: The decibel sum of the predicted LRT noise, BNSF train noise, and BNSF horn noise. In Claremont, the predicted Ldn also includes the Metrolink train noise and Metrolink horn noise.
• Threshold: The FTA threshold for allowable noise level. The threshold is the allowable increase in decibels over the existing noise levels. The FTA defines two thresholds: one for moderate impact (mod.) and one for severe impact (sev.).
• Impact: Indicates which clusters exceed the FTA threshold for moderate impact.
• No. of Impacts: For residential land uses, the number of impacts is the estimated number of dwelling units in the cluster where the predicted noise level will exceed the impact threshold. For hotels or motels, it is the estimated number of rooms where the predicted noise level will exceed the impact threshold.
Following are detailed descriptions of the column headings for the Noise Predictions by Source tables:
• LRT Ldn, dBA: The predicted noise level from LRT operations, including noise from both the near and far tracks.
• BNSF Ldn, dBA: The predicted noise level from BNSF freight operations, assuming the proposed future location of the BNSF tracks.
• BNSF Horn Ldn, dBA: The predicted noise level from BNSF horns. Clusters that are not located near an at-grade crossing do not include a predicted noise level for BNSF horns.
• Traffic Noise, Ldn, dBA: The estimated noise level from traffic. The traffic noise was estimated using the measured existing noise level, and subtracting noise from existing BNSF and Metrolink operations.
• Metrolink Ldn, dBA (only in Claremont): The predicted noise level from Metrolink operations, using the proposed future location of the Metrolink tracks.
• Metrolink Horn Ldn, dBA (only in Claremont): The predicted noise level from Metrolink horns. Clusters that are not located near an at-grade crossing do not include a predicted noise level from Metrolink horns.
5.4.1 Glendora
In Glendora, the light-rail tracks run in the northern portion of the right-of-way, closer to the westbound clusters (clusters located north of the right-of-way). The predicted overall noise levels and impacts are presented in Table 11 and the predicted noise levels by source are presented in Table 12. Moderate noise impacts are predicted at cluster WB1 through 1d and WB3a, and severe noise impacts are predicted at

Noise and Vibration Technical Report: Metro Gold Line Foothill Extension, Azusa to Montclair July 2012 Page 57
clusters WB2 and WB4 through WB20. The severe impacts are a result of relatively low existing noise levels and the short distances between the tracks and the residences. Moderate impacts are predicted at clusters EB6 through EB8, EB10, and EB11; and severe impacts are predicted at clusters EB1 through EB5a and EB9. The eastbound clusters also have relatively low existing noise levels and short distances between the proposed tracks and residences. In some cases, the predicted impact is due to the increase in freight train and horn noise levels that would result from relocating the BNSF tracks closer to eastbound clusters.
The highest predicted noise level is at clusters WB14 and WB15. The higher predicted noise level at these clusters is due to a crossover that would be located adjacent to the clusters; crossovers increase the levels of LRT noise by approximately 6 dB.

Noise and Vibration Technical Report: Metro Gold Line Foothill Extension, Azusa to Montclair July 2012 Page 58
Table 11: Predicted Noise Levels and Impacts in Glendora
Category 2 Land Uses
Cluster No.1
Eng. Station
Dist., ft2
Speed, mph
Existing Ldn, dBA
Predicted Ldn, dBA
Threshold3 Impact No. of Impacts Mod. Sev.
Glendora Westbound WB1 1453+00 156 65 55 58.8 3.2 7.1 Moderate 2 WB1a 1458+00 162 65 55 59.4 3.2 7.1 Moderate 13 WB1b 1465+00 156 65 55 58.5 3.2 7.1 Moderate 4 WB1c 1470+00 150 65 55 58.6 3.2 7.1 Moderate 13 WB1d 1477+50 114 65 55 61.1 3.2 7.1 Moderate 5 WB2 1494+00 54 65 58 64.1 2.4 5.8 Severe 5 WB3 1499+00 198 65 58 57.5 2.4 5.8 -- -- WB3a 1510+00 95 65 58 61.9 2.4 5.8 Moderate 19 WB4 1522+50 34 55 56 66.1 3.2 7.1 Severe 12 WB5 1527+00 22 55 56 67.3 3.2 7.1 Severe 8 WB6 1530+50 12 65 56 70.4 3.2 7.1 Severe 20 WB7 1540+00 28 65 56 66.9 3.2 7.1 Severe 20 WB8 1548+00 34 65 56 67.0 3.2 7.1 Severe 9 WB9 1553+00 30 65 56 67.4 3.2 7.1 Severe 4 WB10 1555+00 34 65 56 67.0 3.2 7.1 Severe 4 WB11 1559+00 16 65 56 69.5 3.2 7.1 Severe 5 WB12 1564+00 50 65 56 64.6 3.2 7.1 Severe 6 WB13 1568+00 46 65 56 66.0 3.2 7.1 Severe 4 WB14 1572+00 46 65 56 71.1 3.2 7.1 Severe 6 WB15 1576+00 44 65 56 71.0 3.2 7.1 Severe 7 WB16 1587+00 52 65 58 64.7 2.4 5.8 Severe 12 WB17 1594+00 50 65 58 64.9 2.4 5.8 Severe 5 WB18 1599+00 44 65 58 65.6 2.4 5.8 Severe 7 WB19 1616+00 50 65 58 64.9 2.4 5.8 Severe 17 WB20 1624+00 54 65 58 64.5 2.4 5.8 Severe 10
Glendora Eastbound EB1 1434+00 66 65 55 63.2 3.2 7.1 Severe 26 EB2 1444+00 50 65 55 64.9 3.2 7.1 Severe 11 EB3 1452+00 68 65 55 66.6 3.2 7.1 Severe 6 EB4 1457+00 54 65 55 68.9 3.2 7.1 Severe 5 EB5 1461+00 58 65 55 64.0 3.2 7.1 Severe 7 EB5a 1479+00 75 65 55 65.6 3.2 7.1 Severe 13 EB6 1504+00 110 45 58 61.1 2.4 5.8 Moderate 4 EB7 1537+00 86 65 56 61.6 3.2 7.1 Moderate 4 EB8 1542+00 112 65 56 60.1 3.2 7.1 Moderate 4 EB9 1587+00 52 65 58 65.0 2.4 5.8 Severe 6

Noise and Vibration Technical Report: Metro Gold Line Foothill Extension, Azusa to Montclair July 2012 Page 59
Table 11: Predicted Noise Levels and Impacts in Glendora
Category 2 Land Uses
Cluster No.1
Eng. Station
Dist., ft2
Speed, mph
Existing Ldn, dBA
Predicted Ldn, dBA
Threshold3 Impact No. of Impacts Mod. Sev.
EB10 1610+00 94 65 58 61.8 2.4 5.8 Moderate 4 EB11 1626+00 84 65 58 62.4 2.4 5.8 Moderate 4 EB12 1664+00 94 65 64 65.5 1.5 3.9 — --
Total Moderate Impacts in Glendora: 76 Total Severe Impacts in Glendora: 235
Source: ATS Consulting, 2011 Notes: 1The buildings included in each cluster are detailed in the figures in Appendix B. 2The distance in feet from the closest sensitive receiver in the cluster to the proposed near light-rail track. 3The threshold is the allowable increase in noise from the existing Ldn. The FTA designates two threshold levels: moderate and severe.

Noise and Vibration Technical Report: Metro Gold Line Foothill Extension, Azusa to Montclair July 2012 Page 60
Table 12: Predicted Noise Levels by Source in Glendora
Category 2 Land Uses
Cluster No.1
Eng. Station
Dist., ft2
LRT Ldn, dBA
BNSF Ldn, dBA
BNSF Horn Ldn, dBA
Traffic Noise Ldn,
dBA
Predicted Ldn3, dBA
Existing Ldn, dBA
Glendora Westbound
WB1 1453+00 156 56.5 38.4 53.1 50 58.8 55 WB1a 1458+20 162 56.2 38.2 52.9 54 59.4 55 WB1b 1465+00 156 56.5 38.4 -- 54 58.5 55 WB1c 1470+00 150 56.7 38.6 -- 54 58.6 55 WB1d 1477+50 114 58.8 40.0 54.6 54 61.1 55 WB2 1494+00 54 63.6 43.3 -- 54 64.1 58 WB3 1499+00 198 54.8 37.1 -- 54 57.5 58 WB3a 1510+00 95 59.6 41.0 55.5 54 61.9 58 WB4 1522+50 34 64.5 45.7 60.0 54 66.1 56 WB5 1527+00 22 66.1 45.9 60.1 54 67.3 56 WB6 1530+50 12 69.8 47.0 61.2 54 70.4 56 WB7 1540+00 28 66.7 45.3 -- 54 66.9 56 WB8 1548+00 34 65.9 44.8 59.1 54 67.0 56 WB9 1553+00 30 66.4 45.1 59.4 54 67.4 56 WB10 1555+00 34 65.9 44.8 59.1 54 67.0 56 WB11 1559+00 16 68.7 46.5 60.7 54 69.5 56 WB12 1564+00 50 64.1 43.5 0.0 54 64.6 56 WB13 1568+00 46 64.8 43.8 58.2 54 66.0 56 WB14 1572+00 46 70.8 43.8 58.2 54 71.1 56 WB15 1576+00 44 71.0 44.0 -- 54 71.0 56 WB16 1587+00 52 63.9 43.4 -- 57 64.7 58 WB17 1594+00 50 64.1 43.5 -- 57 64.9 58 WB18 1599+00 44 65.0 44.0 -- 57 65.6 58 WB19 1616+00 50 64.1 43.5 -- 57 64.9 58 WB20 1624+00 54 63.6 43.3 -- 57 64.5 58
Glendora Eastbound
EB1 1434+00 66 62.4 49.9 -- 54 63.2 55 EB2 1444+00 50 64.2 53.6 -- 54 64.9 55 EB3 1452+00 68 62.3 49.9 63.9 54 66.6 55 EB4 1457+00 54 63.7 53.0 66.9 54 68.9 55 EB5 1461+00 58 63.2 51.9 -- 54 64.0 55 EB5a 1479+00 75 61.5 48.7 62.8 54 65.6 55 EB6 1504+00 110 55.5 43.8 58.2 54 61.1 58 EB7 1537+00 86 60.5 47.2 -- 54 61.6 56

Noise and Vibration Technical Report: Metro Gold Line Foothill Extension, Azusa to Montclair July 2012 Page 61
Table 12: Predicted Noise Levels by Source in Glendora
Category 2 Land Uses
Cluster No.1
Eng. Station
Dist., ft2
LRT Ldn, dBA
BNSF Ldn, dBA
BNSF Horn Ldn, dBA
Traffic Noise Ldn,
dBA
Predicted Ldn3, dBA
Existing Ldn, dBA
EB8 1542+00 112 58.8 44.6 -- 54 60.1 56 EB9 1587+00 52 63.9 53.6 -- 57 65.0 58 EB10 1610+00 94 59.9 46.3 -- 57 61.8 58 EB11 1626+00 84 60.8 47.5 -- 57 62.4 58 EB12 1664+00 94 60.0 41.6 -- 64 65.5 64
Source: ATS Consulting, 2011 Notes: 1The buildings included in each cluster are detailed in the figures in Appendix B. 2The distance in feet from the closest sensitive receiver in the cluster to the proposed near light-rail track. 3The predicted Ldn is the sum of the LRT Ldn, BNSF Ldn, and BNSF horn Ldn.
5.4.2 San Dimas
The light-rail tracks in San Dimas run in the southern portion of the right-of-way, closer to the eastbound clusters. The predicted overall noise levels and impacts are presented in Table 13 and the predicted noise levels by source are presented in Table 14. Severe noise impact is predicted at cluster WB1 and EB1 (Red Roof Inn). The primary noise source at cluster WB1 is horn noise from the BNSF trains. The BNSF tracks would be located closer to residences along the westbound (north) side of the right-of-way in San Dimas, increasing the horn noise at those residences. Cluster EB1 is located on the edge of the right-of-way, only 14 feet from the eastbound light-rail track. Moderate noise impact is predicted at cluster WB2, WB3, WB7, WB8, EB3 and EB3a.
Table 13: Predicted Noise Levels and Impacts in San Dimas
Category 2 Land Uses
Cluster No.1
Eng. Station
Dist., ft2
Speed, mph
Existing Ldn, dBA
Predicted Ldn, dBA
Threshold3 Impact No. of Impacts Mod. Sev.
San Dimas Westbound WB1 1668+00 50 65 64 69.3 1.5 3.9 Severe 3 WB2 1680+00 56 65 64 66.8 1.5 3.9 Moderate 3 WB3 1683+00 76 65 60 63.5 2.0 5.0 Moderate 3 WB4 1691+00 176 65 60 60.7 2.0 5.0 — — WB5 1739+00 76 45 65 65.2 1.5 3.9 — — WB6 1745+00 94 65 64 64.9 1.5 3.9 — — WB7 1766+00 104 65 61 63.8 1.9 4.7 Moderate 5 WB8 1770+00 122 65 60 62.9 2.0 5.0 Moderate 5

Noise and Vibration Technical Report: Metro Gold Line Foothill Extension, Azusa to Montclair July 2012 Page 62
Table 13: Predicted Noise Levels and Impacts in San Dimas
Category 2 Land Uses
Cluster No.1
Eng. Station
Dist., ft2
Speed, mph
Existing Ldn, dBA
Predicted Ldn, dBA
Threshold3 Impact No. of Impacts Mod. Sev.
San Dimas Eastbound EB1 1686+00 14 65 60 69.6 2.0 5.0 Severe 20 EB2 1701+00 142 65 60 61.3 2.0 5.0 — — EB3 1705+00 82 65 60 64.0 2.0 5.0 Moderate 8 EB3a 1723+00 86 55 60 63.1 2.0 5.0 Moderate 5
Total Moderate Impacts in San Dimas: 29 Total Severe Impacts in San Dimas: 23
Source: ATS Consulting, 2011 Notes: 1The buildings included in each cluster are detailed in the figures in Appendix B. 2The distance in feet from the closest sensitive receiver in the cluster to the proposed near light-rail track. 3The threshold is the allowable increase in noise from the existing Ldn. The FTA designates two threshold levels: moderate and severe.
Table 14: Predicted Noise Levels by Source in San Dimas
Category 2 Land Uses
Cluster No.1
Eng. Station
Dist., ft2
LRT Ldn, dBA
BNSF Ldn, dBA
BNSF Horn Ldn, dBA
Traffic Noise Ldn,
dBA
Predicted Ldn3, dBA
Existing Ldn, dBA
San Dimas Westbound
WB1 1668+00 50 64.2 51.0 65.1 64 69.3 64 WB2 1680+00 56 63.4 49.9 -- 64 66.8 64 WB3 1683+00 76 61.4 47.0 -- 59 63.5 60 WB4 1691+00 176 55.6 40.1 -- 59 60.7 60 WB5 1739+00 76 57.9 48.6 62.7 59 65.2 65 WB6 1745+00 94 59.9 46.8 61.0 59 64.9 64 WB7 1766+00 104 59.3 45.3 59.6 58 63.8 61 WB8 1770+00 122 58.2 43.8 58.2 58 62.9 60
San Dimas Eastbound EB1 1686+00 14 69.2 48.3 -- 59 69.6 60 EB2 1701+00 142 57.4 39.3 -- 59 61.3 60 EB3 1705+00 82 60.9 42.4 56.8 59 64.0 60 EB3a 1723+00 86 59.0 42.0 56.4 59 63.1 60
Source: ATS Consulting, 2011 Notes: 1The buildings included in each cluster are detailed in the figures in Appendix B. 2The distance in feet from the closest sensitive receiver in the cluster to the proposed near light-rail track. 3The predicted Ldn is the sum of the LRT Ldn, BNSF Ldn, and BNSF horn Ldn.

Noise and Vibration Technical Report: Metro Gold Line Foothill Extension, Azusa to Montclair July 2012 Page 63
5.4.3 La Verne
The light-rail tracks in La Verne would be located in the southern portion of the right-of-way, closer to the eastbound clusters, and the BNSF track would be in the northern portion of the right-of-way. The overall noise predictions are presented in Table 15 and the predicted noise levels by source are presented in Table 16. Moderate impact is predicted at clusters WB2 through WB8. The light-rail tracks will be within 100 feet of the residences..
Table 15: Predicted Noise Levels and Impacts in La Verne
Category 2 Land Uses
Cluster No.1
Eng. Station
Dist., ft2
Speed, mph
Existing Ldn, dBA
Predicted Ldn, dBA
Threshold3 Impact No. of Impacts4 Mod. Sev.
La Verne Westbound WB1 1805+00 142 65 60 62.0 2.0 5.0 — — WB2 1817+00 80 65 63 65.0 1.6 4.1 Moderate 5 WB3 1820+00 86 65 62 65.0 1.7 4.4 Moderate 5 WB4 1825+00 74 65 63 65.4 1.6 4.1 Moderate 8 WB5 1829+00 76 65 62 65.3 1.7 4.4 Moderate 5 WB6 1832+00 78 65 62 65.1 1.7 4.4 Moderate 4 WB7 1850+00 98 65 62 63.8 1.7 4.4 Moderate 6
La Verne Eastbound EB1 1774+00 204 65 59 59.7 2.2 5.4 — — EB2 1876+00 250 55 59 61.1 2.2 5.4 — — EB3 1886+00 128 65 60 61.0 2.0 5.0 — — EB4 1891+00 132 65 60 61.7 2.0 5.0 — —
Total Moderate Impacts in La Verne: 33 Total Severe Impacts in La Verne: 0
Source: ATS Consulting, 2011 Notes: 1The buildings included in each cluster are detailed in the figures in Appendix B. 2The distance in feet from the closest sensitive receiver in the cluster to the proposed near light-rail track. 3The threshold is the allowable increase in noise from the existing Ldn. The FTA designates two threshold levels: moderate and severe.

Noise and Vibration Technical Report: Metro Gold Line Foothill Extension, Azusa to Montclair July 2012 Page 64
Table 16: Predicted Noise Levels by Source in La Verne
Category 2 Land Uses
Cluster No.1
Eng. Station
Dist., ft2
LRT Ldn, dBA
BNSF Ldn, dBA
BNSF Horn Ldn, dBA
Traffic Noise
Ldn, dBA
Predicted Ldn3, dBA
Existing Ldn, dBA
La Verne Westbound WB1 1805+00 142 57.1 41.8 56.2 58 62.0 60 WB2 1817+00 80 61.0 46.5 60.7 58 65.0 63 WB3 1820+00 86 61.7 45.9 60.1 58 65.0 62 WB4 1825+00 74 61.5 47.2 61.4 58 65.4 63 WB5 1829+00 76 61.4 47.0 61.2 58 65.3 62 WB6 1832+00 78 61.2 46.8 61.0 58 65.1 62 WB7 1850+00 98 59.7 44.8 59.1 58 63.8 62
La Verne Eastbound EB1 1784+00 204 54.6 36.7 — 58 59 59.7 EB2 1876+00 240 58.1 35.9 — 58 59 61.1 EB3 1886+00 128 57.9 39.4 — 58 60 61.0 EB4 1891+00 132 57.7 39.6 54.2 58 60 61.7
Source: ATS Consulting, 2011 Notes: 1The buildings included in each cluster are detailed in the figures in Appendix B. 2The distance in feet from the closest sensitive receiver in the cluster to the proposed near light-rail track. 3The predicted Ldn is the sum of the LRT Ldn, BNSF Ldn, and BNSF horn Ldn.
5.4.4 Pomona
There is a flyover at Towne Avenue in Pomona, moving the light-rail tracks to the north side of the right-of-way. All of the noise sensitive receivers in Pomona are located east of Towne Avenue. The overall noise predictions and impacts are presented in Table 17 and the noise predictions by source are presented in Table 18. Moderate noise impact is predicted at cluster WB2 which is 62 feet from proposed location of the nearest light-rail track. Existing noise levels in Pomona are relatively high. The dominant existing noise sources in the area are local vehicular traffic and noise from Metrolink commuter trains operating on tracks just south of the project right-of-way.
Table 17: Predicted Noise Levels and Impacts in Pomona
Category 2 Land Uses

Noise and Vibration Technical Report: Metro Gold Line Foothill Extension, Azusa to Montclair July 2012 Page 65
Cluster No.1
Eng. Station
Dist., ft2
Speed, mph
Existing Ldn, dBA
Predicted Ldn, dBA
Threshold3 Impact No. of Impacts Mod. Sev.
Pomona Westbound WB1 1964+00 86 65 62 63.0 1.7 4.4 — — WB2 1968+00 64 65 62 65.3 1.7 4.4 Moderate 6
Pomona Eastbound EB1 1929+00 158 65 62 63.5 1.7 4.4 — — EB2 1943+00 136 65 62 63.1 1.7 4.4 — — EB3 1967+00 238 65 62 62.7 1.7 4.4 — —
Total Moderate Impacts in Pomona: 6 Total Severe Impacts in Pomona: 0
Source: ATS Consulting, 2011 Notes: 1The buildings included in each cluster are detailed in the figures in Appendix B. 2The distance in feet from the closest sensitive receiver in the cluster to the proposed near light-rail track. 3The threshold is the allowable increase in noise from the existing Ldn. The FTA designates two threshold levels: moderate and severe.
Table 18: Predicted Noise Levels by Source in Pomona
Category 2 Land Uses
Cluster No.1
Eng. Station
Dist., ft2
LRT Ldn, dBA
BNSF Ldn, dBA
BNSF Horn Ldn, dBA
Traffic Noise Ldn,
dBA
Predicted Ldn3, dBA
Existing Ldn, dBA
Pomona Westbound
WB1 1964+00 86 55.6 44.8 — 62 63.0 62 WB2 1968+00 64 62.5 44.9 — 62 65.3 62
Pomona Eastbound EB1 1929+00 158 56.5 41.7 53.3 62 63.5 62 EB2 1943+00 136 52.9 42.4 54.0 62 63.1 62 EB3 1967+00 238 54.0 42.2 — 62 62.7 62
Source: ATS Consulting, 2011 Notes: 1The buildings included in each cluster are detailed in the figures in Appendix B. 2The distance in feet from the closest sensitive receiver in the cluster to the proposed near light-rail track. 3The predicted Ldn is the sum of the LRT Ldn, BNSF Ldn, and BNSF horn Ldn.
5.4.5 Claremont
The light-rail tracks in Claremont would be located in the northern half of the right-of-way and two Southern California Regional Rail Authority (SCRRA) tracks would be relocated to southern half of the right-of-way. Metrolink trains as well as the BNSF trains operate on the SCRRA tracks. The predicted overall noise levels and impacts are presented in Table 19 and the predicted noise levels by source are
Noise and Vibration Technical Report: Metro Gold Line Foothill Extension, Azusa to Montclair July 2012 Page 66
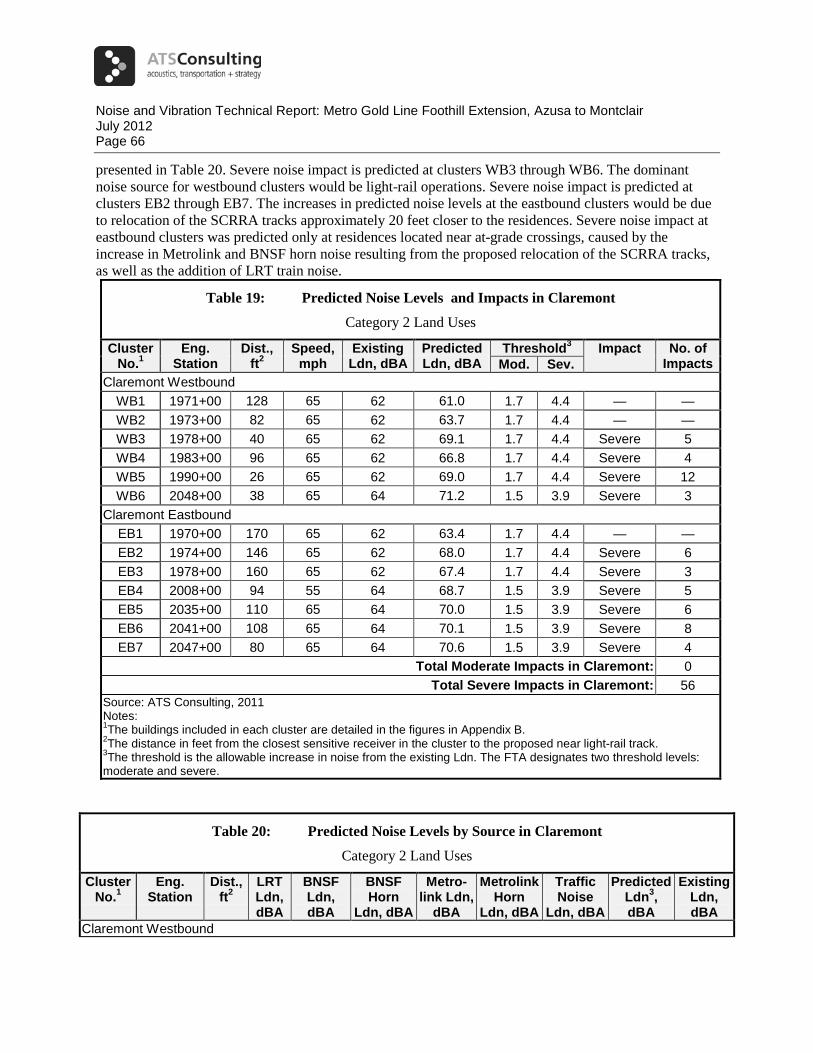
presented in Table 20. Severe noise impact is predicted at clusters WB3 through WB6. The dominant noise source for westbound clusters would be light-rail operations. Severe noise impact is predicted at clusters EB2 through EB7. The increases in predicted noise levels at the eastbound clusters would be due to relocation of the SCRRA tracks approximately 20 feet closer to the residences. Severe noise impact at eastbound clusters was predicted only at residences located near at-grade crossings, caused by the increase in Metrolink and BNSF horn noise resulting from the proposed relocation of the SCRRA tracks, as well as the addition of LRT train noise.
Table 19: Predicted Noise Levels and Impacts in Claremont
Category 2 Land Uses
Cluster No.1
Eng. Station
Dist., ft2
Speed, mph
Existing Ldn, dBA
Predicted Ldn, dBA
Threshold3 Impact No. of Impacts Mod. Sev.
Claremont Westbound WB1 1971+00 128 65 62 61.0 1.7 4.4 — — WB2 1973+00 82 65 62 63.7 1.7 4.4 — — WB3 1978+00 40 65 62 69.1 1.7 4.4 Severe 5 WB4 1983+00 96 65 62 66.8 1.7 4.4 Severe 4 WB5 1990+00 26 65 62 69.0 1.7 4.4 Severe 12 WB6 2048+00 38 65 64 71.2 1.5 3.9 Severe 3
Claremont Eastbound EB1 1970+00 170 65 62 63.4 1.7 4.4 — — EB2 1974+00 146 65 62 68.0 1.7 4.4 Severe 6 EB3 1978+00 160 65 62 67.4 1.7 4.4 Severe 3 EB4 2008+00 94 55 64 68.7 1.5 3.9 Severe 5 EB5 2035+00 110 65 64 70.0 1.5 3.9 Severe 6 EB6 2041+00 108 65 64 70.1 1.5 3.9 Severe 8 EB7 2047+00 80 65 64 70.6 1.5 3.9 Severe 4
Total Moderate Impacts in Claremont: 0 Total Severe Impacts in Claremont: 56
Source: ATS Consulting, 2011 Notes: 1The buildings included in each cluster are detailed in the figures in Appendix B. 2The distance in feet from the closest sensitive receiver in the cluster to the proposed near light-rail track. 3The threshold is the allowable increase in noise from the existing Ldn. The FTA designates two threshold levels: moderate and severe.
Table 20: Predicted Noise Levels by Source in Claremont
Category 2 Land Uses
Cluster No.1
Eng. Station
Dist., ft2
LRT Ldn, dBA
BNSF Ldn, dBA
BNSF Horn
Ldn, dBA
Metro- link Ldn,
dBA
Metrolink Horn
Ldn, dBA
Traffic Noise
Ldn, dBA
Predicted Ldn3, dBA
Existing Ldn, dBA
Claremont Westbound

Noise and Vibration Technical Report: Metro Gold Line Foothill Extension, Azusa to Montclair July 2012 Page 67
Table 20: Predicted Noise Levels by Source in Claremont
Category 2 Land Uses
Cluster No.1
Eng. Station
Dist., ft2
LRT Ldn, dBA
BNSF Ldn, dBA
BNSF Horn
Ldn, dBA
Metro- link Ldn,
dBA
Metrolink Horn
Ldn, dBA
Traffic Noise
Ldn, dBA
Predicted Ldn3, dBA
Existing Ldn, dBA
WB1 1971+00 128 57.8 41.0 — 56.0 — 54 61.0 62 WB2 1973+00 82 60.9 44.3 — 59.3 — 54 63.7 62 WB3 1978+00 40 65.3 48.0 59.3 62.9 62.1 54 69.1 62 WB4 1983+00 96 59.8 44.2 55.7 59.2 63.7 54 66.8 62 WB5 1990+00 26 66.9 49.3 — 64.3 — 54 69.0 62 WB6 2048+00 38 65.5 48.5 59.8 63.5 67.8 54 71.2 64
Claremont Eastbound EB1 1970+00 170 56.2 46.7 — 61.6 — 54 63.4 62 EB2 1974+00 146 57.0 46.3 57.6 61.2 65.6 54 68.0 62 EB3 1978+00 160 56.4 45.6 57.0 60.6 65.0 54 67.4 62 EB4 2008+00 94 58.5 49.8 61.0 64.7 63.4 54 68.7 64 EB5 2035+00 110 59.1 48.3 59.6 63.3 67.6 54 70.0 64 EB6 2041+00 108 59.3 48.5 59.8 63.5 67.8 54 70.1 64 EB7 2047+00 80 61.1 51.9 63.0 66.8 64.9 54 70.6 64
Source: ATS Consulting, 2011 Notes: 1The buildings included in each cluster are detailed in the figures in Appendix B. 2The distance in feet from the closest sensitive receiver in the cluster to the proposed near light-rail track. 3The predicted Ldn is the sum of the LRT Ldn, BNSF Ldn, and BNSF horn Ldn.
5.4.6 Montclair Noise predictions were not modeled for Montclair because there are no noise sensitive receivers in this segment of the alignment.
5.4.7 Institutional Land Uses
Similar to the Category 2 (residential) analysis, an assessment was conducted of noise and vibration impact for Category 3 (institutional) receivers. Seven Category 3 land uses were identified throughout the corridor. The main difference in the assessment of Category 2 and Category 3 land uses is that different impact thresholds are used. As discussed in Section 3: Regulatory Framework, noise exposure for Category 3 land uses is based on the maximum 1-hour Leq rather than the 24-hour Ldn that is used to assess Category 2 land uses. Because freight trains in the corridor run infrequently (about twice a day), but their horns are a major contribution to the noise environment, two predictions have been made for the Category 3 land uses near grade crossings: 1) the 1-hour Leq with only LRT trains and 2) the 1-hour Leq including LRT trains and one freight train with horn noise. The existing hourly Leqs with one freight train are based on the measured 1-hour Leq between 5 pm and 6 pm at long-term site 25 (1736 Park Street, La Verne), which included a freight train sounding the horn. The existing Leqs without freight trains are based on the short-term measurement closest to the sensitive receiver.

Noise and Vibration Technical Report: Metro Gold Line Foothill Extension, Azusa to Montclair July 2012 Page 68
The predicted noise levels for Category 3 land uses are shown in Table 21. Noise impact is predicted at the University of La Verne Arts and Communications building north of the right-of-way at the intersection of D Street and Arrow Highway in La Verne. The proposed location for the relocated freight tracks is only 18 feet from the building and freight train horns are sounded at the intersection with D Street. The primary noise source at the university building would be the freight train horns.
There are no Category 1 land uses within the study area.
Table 21: Predicted Noise Levels for Category 3 Land Uses City Land Use Dir1 Clust2 Eng.
Station Dist. (ft)3
Speed, mph
1-hr Leq, dBA Threshold4 Impact Exist. Pred. Mod. Sev.
Glendora Calvary Lutheran Church EB A 1430+00 136 65 50 57.0 8.9 14.7 --
Glendora Presbyterian Hospital EB B 1495+00 68 45 61 63.2 4.3 8.6 --
Glendora Foothill Christian Preshool (No freight)
EB C 1525+00 100 55 50 56.5 8.9 14.7 --
Glendora Foothill Christian Preschool (with Freight)
EB C 1525+00 100 55 75 73.9 1.2 4.9 --
Glendora Woodglen Medical Institute (no freight)
EB D 1527+00 78 55 50 57.8 8.9 14.7 --
Glendora Woodglen Medical Institute (with freight)
EB D 1527+00 78 55 75 75.8 1.2 4.9 --
San Dimas
Pioneer Park (no freight) EB E 1718+00 260 55 58 58.5 5.3 9.9 --
San Dimas
Pioneer Park (with freight) EB E 1718+00 260 55 75 65.4 1.2 4.9 --
La Verne University of La Verne (no freight)
WB F 1847+00 32 35 57 60.5 5.6 10.4 --
La Verne University of La Verne (with freight)
WB F 1847+00 32 35 75 84.3 1.2 4.9 Severe
Claremont Keck Graduate Institute EB G 1993+00 198 65 58 59.4 5.3 9.9 --
Source: ATS Consulting, 2011 Notes: 1EB clusters are located south of the right-of-way and WB clusters are located north of the right-of-way. 2 Clusters are shown in the figures in Appendix B. 3The distance in feet from the closest sensitive receiver in the cluster to the proposed near light-rail track. 4The threshold is the allowable increase in noise from the existing Ldn. The FTA designates two threshold levels: moderate and severe.
Noise and Vibration Technical Report: Metro Gold Line Foothill Extension, Azusa to Montclair July 2012 Page 69
5.5 Operational Vibration
Vibration levels from LRT operations were predicted for each identified cluster. The clusters used for impact assessment are shown in diagrams in Appendix B. The clusters are labeled numerically in ascending order form west to east in each city both north and south of the tracks. Clusters north of the right-of-way are considered westbound clusters (they are closer to the westbound track) and clusters south of the right-of-way are considered eastbound clusters.
The predicted vibration levels are predicted by city in Section 5.5.1 through Section 5.5.7. The predicted levels are for LRT vibration. Because the freight trains run infrequently, vibration from freight operation is not considered in the impact assessment (as described in Section 3: Regulatory Framework). The tables in each section present the predicted vibration level at each cluster and identifies those clusters where impact is predicted. Section 5.5.5: Claremont includes an additional table with predicted vibration levels from Metrolink vibration.
Following are detailed descriptions of the column headings for the tables:
• Cluster No.: The label number used to identify the cluster in the diagrams presented in Appendix B.
• Eng. Station: The engineering station that corresponds to the location of the cluster.
• Dist., ft.: The distance in feet to the centerline of the near LRT track from the nearest building facade in the cluster.
• Speed, mph: The estimated speed of the train as it passes the cluster.
• Threshold, VdB: The impact threshold defined by the FTA for the maximum allowable vibration level in any 1/3 octave band.
• Predicted Band Max., VdB: The predicted maximum vibration level in any 1/3 octave band.
• 1/3 Octave Band, Hz: The 1/3 octave band in which the predicted maximum vibration level occurs. Mitigation should be designed to attenuate vibration levels in this 1/3 octave band.
• Impact: Indicates whether the predicted band maximum exceeds the FTA threshold.
• No. of Impacts: For residential land uses, the number of impacts is the estimated number of dwelling units in the cluster where the predicted vibration level will exceed the impact threshold. For hotels or motels, it is the estimated number of rooms where the predicted vibration level will exceed the impact threshold.
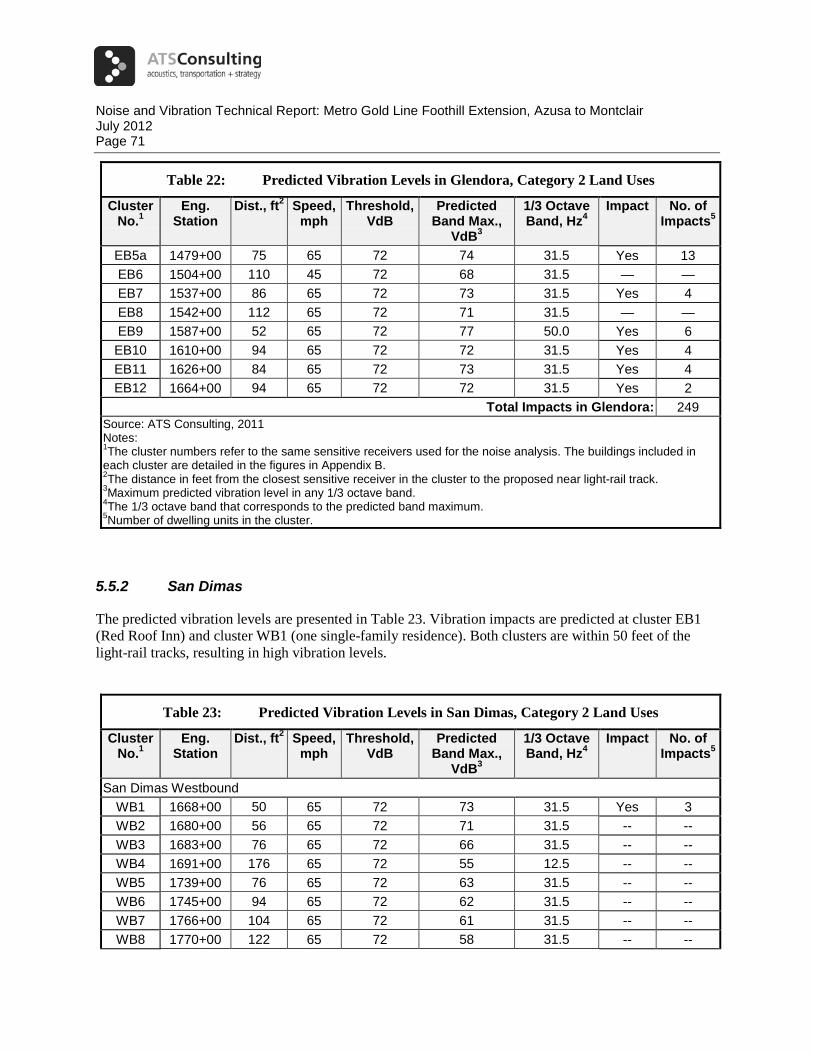
5.5.1 Glendora
The predicted vibration levels are presented in Table 22. Vibration impacts are predicted at clusters WB2, WB4 through WB20, EB1 through EB5a, EB7, and EB9 through EB12. Vibration impact is predicted at 236 dwelling units in Glendora. Impacts are identified at the majority of clusters in Glendora because the

Noise and Vibration Technical Report: Metro Gold Line Foothill Extension, Azusa to Montclair July 2012 Page 70
tracks are located relatively close to residences, and the vibration propagation tests showed relatively efficient vibration propagation (meaning vibration levels remain higher over a longer distance). The clusters where impact is predicted are a mix of multi- and single-family residences and include one hotel (20th Century Motor Lodge, cluster EB9).
Table 22: Predicted Vibration Levels in Glendora, Category 2 Land Uses
Cluster No.1
Eng. Station
Dist., ft2 Speed, mph
Threshold, VdB
Predicted Band Max.,
VdB3
1/3 Octave Band, Hz4
Impact No. of Impacts5
Glendora Westbound WB1 1453+00 156 65 72 68 31.5 — — WB1a 1458+00 162 65 72 68 31.5 — — WB1b 1465+00 156 65 72 68 31.5 — WB1c 1470+00 150 65 72 69 31.5 — — WB1d 1477+50 114 65 72 71 31.5 — — WB2 1494+00 54 65 72 76 50.0 Yes 5 WB3 1499+00 198 65 72 67 31.5 — — WB3a 1510+00 95 55 72 71 31.5 — — WB4 1522+50 34 55 72 81 50.0 Yes 12 WB5 1527+00 22 55 72 87 50.0 Yes 8 WB6 1530+50 12 65 72 96 50.0 Yes 20 WB7 1540+00 28 65 72 85 50.0 Yes 20 WB8 1548+00 34 65 72 82 50.0 Yes 9 WB9 1553+00 30 65 72 84 50.0 Yes 4 WB10 1555+00 34 65 72 82 50.0 Yes 4 WB11 1559+00 16 65 72 93 50.0 Yes 5 WB12 1564+00 50 65 72 77 50.0 Yes 6 WB13 1568+00 46 65 72 78 50.0 Yes 4 WB14 1572+00 46 65 72 88 50.0 Yes 6 WB15 1576+00 44 65 72 89 50.0 Yes 7 WB16 1587+00 52 65 72 77 50.0 Yes 12 WB17 1594+00 50 65 72 77 50.0 Yes 5 WB18 1599+00 44 65 72 79 50.0 Yes 7 WB19 1616+00 50 65 72 77 50.0 Yes 17 WB20 1624+00 54 65 72 76 50.0 Yes 10
Glendora Eastbound EB1 1434+00 66 65 72 74 31.5 Yes 26 EB2 1444+00 50 65 72 77 50.0 Yes 11 EB3 1452+00 68 65 72 74 31.5 Yes 6 EB4 1457+00 54 65 72 76 50.0 Yes 5 EB5 1461+00 58 65 72 75 31.5 Yes 7
Noise and Vibration Technical Report: Metro Gold Line Foothill Extension, Azusa to Montclair July 2012 Page 71
Table 22: Predicted Vibration Levels in Glendora, Category 2 Land Uses
Cluster No.1
Eng. Station
Dist., ft2 Speed, mph
Threshold, VdB
Predicted Band Max.,
VdB3
1/3 Octave Band, Hz4
Impact No. of Impacts5
EB5a 1479+00 75 65 72 74 31.5 Yes 13 EB6 1504+00 110 45 72 68 31.5 — — EB7 1537+00 86 65 72 73 31.5 Yes 4 EB8 1542+00 112 65 72 71 31.5 — — EB9 1587+00 52 65 72 77 50.0 Yes 6 EB10 1610+00 94 65 72 72 31.5 Yes 4 EB11 1626+00 84 65 72 73 31.5 Yes 4 EB12 1664+00 94 65 72 72 31.5 Yes 2
Total Impacts in Glendora: 249 Source: ATS Consulting, 2011 Notes: 1The cluster numbers refer to the same sensitive receivers used for the noise analysis. The buildings included in each cluster are detailed in the figures in Appendix B. 2The distance in feet from the closest sensitive receiver in the cluster to the proposed near light-rail track. 3Maximum predicted vibration level in any 1/3 octave band. 4The 1/3 octave band that corresponds to the predicted band maximum. 5Number of dwelling units in the cluster.
5.5.2 San Dimas
The predicted vibration levels are presented in Table 23. Vibration impacts are predicted at cluster EB1 (Red Roof Inn) and cluster WB1 (one single-family residence). Both clusters are within 50 feet of the light-rail tracks, resulting in high vibration levels.
Table 23: Predicted Vibration Levels in San Dimas, Category 2 Land Uses
Cluster No.1
Eng. Station
Dist., ft2 Speed, mph
Threshold, VdB
Predicted Band Max.,
VdB3
1/3 Octave Band, Hz4
Impact No. of Impacts5
San Dimas Westbound WB1 1668+00 50 65 72 73 31.5 Yes 3 WB2 1680+00 56 65 72 71 31.5 -- -- WB3 1683+00 76 65 72 66 31.5 -- -- WB4 1691+00 176 65 72 55 12.5 -- -- WB5 1739+00 76 65 72 63 31.5 -- -- WB6 1745+00 94 65 72 62 31.5 -- -- WB7 1766+00 104 65 72 61 31.5 -- -- WB8 1770+00 122 65 72 58 31.5 -- --

Noise and Vibration Technical Report: Metro Gold Line Foothill Extension, Azusa to Montclair July 2012 Page 72
Table 23: Predicted Vibration Levels in San Dimas, Category 2 Land Uses
Cluster No.1
Eng. Station
Dist., ft2 Speed, mph
Threshold, VdB
Predicted Band Max.,
VdB3
1/3 Octave Band, Hz4
Impact No. of Impacts5
San Dimas Eastbound EB1 1686+00 14 65 72 96 63 Yes 20 EB2 1701+00 142 65 72 56 12.5 -- -- EB3 1705+00 82 65 72 65 31.5 -- -- EB3a 1723+00 86 55 72 62 31.5 -- --
Total Impacts in San Dimas: 23 Source: ATS Consulting, 2011 Notes: 1The cluster numbers refer to the same sensitive receivers used for the noise analysis. The buildings included in each cluster are detailed in the figures in Appendix B. 2The distance in feet from the closest sensitive receiver in the cluster to the proposed near light-rail track. 3Maximum predicted vibration level in any 1/3 octave band. 4The 1/3 octave band that corresponds to the predicted band maximum. 5Number of dwelling units in the cluster.
5.5.3 La Verne
The vibration predictions are presented in Table 24. No vibration impact is predicted in La Verne. Predicted vibration levels are below the impact threshold because most residences would be at least 70 feet from the LRT tracks and because the vibration testing showed that vibration propagation is relatively inefficient (vibration levels decrease relatively quickly) in La Verne.
Table 24: Predicted Vibration Levels in La Verne, Category 2 Land Uses
Cluster No.1
Eng. Station
Dist., ft2 Speed, mph
Threshold, VdB
Predicted Band Max.,
VdB3
1/3 Octave Band, Hz4
Impact No. of Impacts5
La Verne Westbound WB1 1805+00 142 65 72 56 12.5 -- -- WB2 1817+00 80 65 72 65 31.5 -- -- WB3 1820+00 86 65 72 64 31.5 -- -- WB4 1825+00 74 65 72 66 31.5 -- -- WB5 1829+00 76 65 72 66 31.5 -- -- WB6 1832+00 78 65 72 65 31.5 -- -- WB7 1850+00 98 65 72 62 31.5 -- -- WB8 1868+50 80 65 72 65 31.5 -- --
La Verne Eastbound EB1 1774+00 204 65 72 54 12.5 -- --

Noise and Vibration Technical Report: Metro Gold Line Foothill Extension, Azusa to Montclair July 2012 Page 73
Table 24: Predicted Vibration Levels in La Verne, Category 2 Land Uses
Cluster No.1
Eng. Station
Dist., ft2 Speed, mph
Threshold, VdB
Predicted Band Max.,
VdB3
1/3 Octave Band, Hz4
Impact No. of Impacts5
EB2 1876+00 240 55 72 61 12.5 -- -- EB3 1886+00 128 65 72 57 31.5 -- -- EB4 1891+00 132 65 72 57 31.5 -- --
Total Impacts in La Verne: 0 Source: ATS Consulting, 2011 Notes: 1The cluster numbers refer to the same sensitive receivers used for the noise analysis. The buildings included in each cluster are detailed in the figures in Appendix B. 2The distance in feet from the closest sensitive receiver in the cluster to the proposed near light-rail track. 3Maximum predicted vibration level in any 1/3 octave band. 4The 1/3 octave band that corresponds to the predicted band maximum. 5Number of dwelling units in the cluster.
5.5.4 Pomona
Vibration predictions are presented in Table 25. Vibration impact is predicted at cluster WB2. The cluster is a multi-family residence at the Pomona/Claremont city boundary.
Table 25: Predicted Vibration Levels in Pomona, Category 2 Land Uses
Cluster No.1
Eng. Station
Dist., ft2 Speed, mph
Threshold, VdB
Predicted Band Max.,
VdB3
1/3 Octave Band, Hz4
Impact No. of Impacts5
Pomona Westbound WB1 1964+00 86 65 72 60 31.5 -- -- WB2 1968+00 64 65 72 72 31.5 Yes 6
Pomona Eastbound EB1 1929+00 158 65 72 67 31.5 -- -- EB2 1943+00 136 65 72 58 31.5 -- -- EB3 1967+00 238 65 72 65 31.5 -- --
Total Impacts in Pomona: 6 Source: ATS Consulting, 2011 Notes: 1The cluster numbers refer to the same sensitive receivers used for the noise analysis. The buildings included in each cluster are detailed in the figures in Appendix B. 2The distance in feet from the closest sensitive receiver in the cluster to the proposed near light-rail track. 3Maximum predicted vibration level in any 1/3 octave band. 4The 1/3 octave band that corresponds to the predicted band maximum. 5Number of dwelling units in the cluster.

Noise and Vibration Technical Report: Metro Gold Line Foothill Extension, Azusa to Montclair July 2012 Page 74
5.5.5 Claremont
The vibration predictions for light-rail operations are presented in Table 26. Vibration impact is predicted at westbound clusters 3, 5, and 6. The LRT tracks would be located within 50 feet of the residences at all clusters where impact is predicted.
The vibration predictions for Metrolink operations are presented in Table 27. Vibration impact is assessed if the future predicted vibration level exceeds the current level by 3 dB and if the future predicted level exceeds the 72 VdB threshold for light-rail operations. The Metrolink tracks would be relocated south from their current location, so there would be potential for impact only at eastbound clusters. At eastbound clusters 1, 2, and 3, the Metrolink tracks will remain at the same location within the right-of-way, so there would be no potential for impact. Vibration impact is predicted at clusters EB4 and EB7, multi-family residential complexes. The vibration levels at both of these clusters would exceed 72 VdB and increase by at least 3 dB as a result of the project.
Table 26: Predicted Vibration Levels in Claremont, Category 2 Land Uses
Cluster No.1
Eng. Station
Dist., ft2 Speed, mph
Threshold, VdB
Predicted Band Max.,
VdB3
1/3 Octave Band, Hz4
Impact No. of Impacts5
Claremont Westbound WB1 1971+00 128 65 72 66 50 -- -- WB2 1973+00 82 65 72 70 50 -- -- WB3 1978+00 40 65 72 77 63 Yes 5 WB4 1983+00 96 65 72 69 50 -- -- WB5 1990+00 26 65 72 81 63 Yes 12 WB6 2048+00 38 65 72 77 63 Yes 3
Claremont Eastbound EB1 1970+00 170 65 72 65 31.5 -- -- EB2 1974+00 146 65 72 65 31.5 -- -- EB3 1978+00 160 65 72 65 31.5 -- -- EB4 2008+00 94 55 72 63 50 -- -- EB5 2035+00 110 65 72 66 50 -- -- EB6 2041+00 108 65 72 67 50 -- -- EB7 2047+00 80 65 72 70 50 -- --
Total Impacts in Claremont: 20 Source: ATS Consulting, 2011 Notes: 1The cluster numbers refer to the same sensitive receivers used for the noise analysis. The buildings included in each cluster are detailed in the figures in Appendix B. 2The distance in feet from the closest sensitive receiver in the cluster to the proposed near light-rail track. 3Maximum predicted vibration level in any 1/3 octave band. 4The 1/3 octave band that corresponds to the predicted band maximum. 5Number of dwelling units in the cluster.

Noise and Vibration Technical Report: Metro Gold Line Foothill Extension, Azusa to Montclair July 2012 Page 75
Table 27: Predicted Metrolink Vibration Levels in Claremont, Category 2 Land Uses
Cluster No.1
Eng. Station
Dist., ft
Change in Dist.,
ft
Predicted Current Band
Max., VdB
Predicted Future Band Max., VdB2
1/3 Octave Band, Hz
Impact3 No. of Impacts4
Claremont Eastbound 1 1970+00 94 0 — — -- -- -- 2 1974+00 100 0 — — -- -- -- 3 1978+00 110 0 — — -- -- -- 4 2008+00 60 22 69 72 50 Yes 5 5 2035+00 74 20 67 70 50 -- -- 6 2041+00 72 20 67 70 50 -- -- 7 2047+00 46 20 71 75 50 Yes 4
Total Impacts in Claremont: 9 Source: ATS Consulting, 2011 Notes: 1The cluster numbers refer to the same sensitive receivers used for the noise analysis. The buildings included in each cluster are detailed in the figures in Appendix B. 2Maximum predicted vibration level in any 1/3 octave band. 3There is impact if the predicted future band maximum exceeds 72 VdB and the predicted future level exceeds the predicted current level by at least 3 dB. 4Number of dwelling units in the cluster.
5.5.6 Montclair Vibration predictions were not modeled for Montclair because there are no vibration sensitive receivers in this segment of the alignment.
5.5.7 Institutional Land Uses
The predicted vibration levels for Category 3 land uses are shown in Table 28. Vibration impact is predicted at the University of La Verne Arts and Communications building. The building is located only 34 feet from the nearest light-rail track.
The Keck Graduate Institute is the only institutional land use that could be affected by an increase in Metrolink vibration levels. The predicted Metrolink vibration levels at the Keck Graduate Institute do not exceed the vibration impact threshold.
There are no Category 1 land uses identified along the right-of-way.
Table 28: Predicted Vibration Levels for Category 3 Land Uses

Noise and Vibration Technical Report: Metro Gold Line Foothill Extension, Azusa to Montclair July 2012 Page 76
City Land Use Dir.1 Clust2 Eng. Station
Dist., ft3
Speed, mph
Theshold (VdB)
Pred. Band
Max4, VdB 1/3 Octave Band, Hz5 Impact6
Glendora Calvary
Lutheran Church
EB A 1430+00 136 65 75 69 31.5 --
Glendora Presbyterian Hospital EB B 1495+00 68 45 75 71 31.5 --
Glendora Foothill
Christian Preshool
EB C 1525+00 100 55 75 70 31.5 --
Glendora Woodglen Medical Institute
EB D 1527+00 78 55 75 72 31.5 --
San Dimas
Pioneer Park EB E 1718+00 260 55 75 63 31.5 --
La Verne University of La Verne WB F 1847+00 32 35 75 78 50 Yes
Claremont Keck
Graduate Institute
EB G 1993+00 198 65 75 67 31.5 --
Source: ATS Consulting, 2011 Notes: 1EB clusters are located south of the right-of-way and WB clusters are located north of the right-of-way. 2The cluster labels refer to the same sensitive receivers used for the noise analysis. The Noise and Vibration Technical Background Report includes an appendix that shows the locations and buildings of each cluster. 3The distance in feet from the closest sensitive receiver in the cluster to the proposed near light-rail track. 4Maximum predicted vibration level in any 1/3 octave band. 5The 1/3 octave band that corresponds to the predicted band maximum. 6Number of dwelling units in the cluster.
5.5.8 Ancillary Equipment Predictions and Impacts
Traction power substation (TPSS) units are the only ancillary equipment associated with the proposed project with the potential for causing noise impacts. There is no ancillary equipment with the potential for causing vibration impacts. There are 11 proposed TPSS units distributed throughout the corridor. Several of the selected sites are adjacent to residential land uses.
The TPSS units will be designed to comply with the MTA Design Criteria for noise from a transit system ancillary facility. The MTA design levels will ensure that noise from the units does not exceed the FTA Noise Impact Criteria at any noise-sensitive receivers. The Metro Design Criteria are presented in Table 29. The residential areas near any proposed TPSS locations for the proposed project are considered average residential density. The TPSS units are assumed to run continuously. At the residential locations, the TPSS units will be designed so as not to exceed a maximum noise level of 45 dBA at a distance of 50 feet from the unit or at the setback line of the nearest building, whichever is closer.
The estimated TPSS unit noise levels over a 24-hour period (Ldn) are presented in Table 30 along with the measured existing noise levels and the FTA moderate noise impact criteria for the nearest identified sensitive receiver to each proposed TPSS location. Assuming a maximum noise level of 45 dBA at the

Noise and Vibration Technical Report: Metro Gold Line Foothill Extension, Azusa to Montclair July 2012 Page 77
residence, the 24-hour noise level (Ldn) from a continuously running TPSS unit is 51 dBA. The TPSS noise does not exceed the FTA threshold at any of the proposed locations if the Metro design criteria is met.
Table 29: Metro Design Criteria for Noise from Transit System Ancillary Facilities
Community Area Maximum Noise Level (dBA)1
Transient Continuous Low Density Residential 50 40
Average Residential 55 45 High-density residential 60 50
Commercial 65 55 Industrial/highway 75 65
Source: Metro Design Criteria, Table 2-9 (Metro 2009) 1Maximum noise level at a distance of 50 feet, or at the setback line of the nearest building, whichever is closer.
Table 30: Predicted TPSS Noise Levels
City TPSS Eng. Station
Dist., ft1
Measured Existing
Noise Level Ldn, dBA
Estimated TPSS
Noise Ldn, dBA2
FTA Criteria, Ldn dBA Impact
Glendora B1 1595+50 64 58 51 57 No Glendora B2 1560+02 82 56 51 56 No Glendora B3 1639+50 No noise sensitive receivers near this TPSS location
San Dimas B4 1682+63 50 60 51 58 No San Dimas B5 1725+40 90 60 51 58 No La Verne B6 1805+62 88 64 51 61 No La Verne B7 1861+52 No noise sensitive receivers near this TPSS location Pomona B8 1928+37 116 62 51 59 No
Claremont B9 1977+87 50 62 51 59 No Claremont B10 2030+96 No noise sensitive receivers near this TPSS location Montclair B11 2083+20 No noise sensitive receivers near this TPSS location
Source: ATS Consulting, 2011 Notes: 1The distance in feet from the closest sensitive receiver in the cluster to the proposed TPSS location. 2The estimated level is based on the Metro design criteria of 45 dBA at the nearest residence.

Noise and Vibration Technical Report: Metro Gold Line Foothill Extension, Azusa to Montclair July 2012 Page 78
5.6 Construction Noise and Vibration
5.6.1 Construction Noise
The construction of LRT guideways requires the use of heavy earth-moving equipment, pneumatic tools, generators, concrete pumps, and similar equipment. Table 31 shows the equipment likely to be used during the noisiest periods of track construction, the typical noise generated by this equipment, the usage factors (or percent of time the equipment is operating under full load), and the estimated Leq for an eight hour workshift. The work-shift Leq for the construction scenario presented in Table 31 is 84 dBA at 50 feet.
The FTA guidance manual does provide guidance on appropriate impact thresholds for construction noise but states that the limits are for guidance and should not be considered “standardized criteria.” The manual recommends a reasonable threshold for construction noise is an 8-hour Leq of 80 dBA at residential land uses.
Based on the predicted construction activities generating a workshift Leq of 84 dBA at 50 feet, construction noise is likely to exceed the impact thresholds imposed by the Construction Authority in areas near residences.
Table 31: Construction Noise Predictions
Equipment Sound Level at 50 ft Under Load
Usage Factor (% of time under full load)
Leq (8 hr workshift)
Earthmover (bulldozer, front-end loader, etc.) 82 dBA 40% 78 dBA
Mobile Crane 81 dBA 20% 74 dBA Dump Truck 76 dBA 40% 72 dBA Pneumatic Tools 85 dBA 30% 80 dBA Generator 78 dBA 40% 74 dBA Compressor 81 dBA 40% 77 dBA
Combined Leq: 84 dBA Source: USDOT 2006; ATS Consulting
Construction noise impacts are likely unless the contractor is required to implement noise control measures when working near residences. There are several methods of reducing noise levels associated with the construction phase of the project. Potential methods include:
• Avoid nighttime construction
• Use specialty equipment with enclosed engines and/or high performance mufflers
• Locate equipment and staging areas as far from noise-sensitive receivers as possible
• Limit unnecessary idling of equipment

Noise and Vibration Technical Report: Metro Gold Line Foothill Extension, Azusa to Montclair July 2012 Page 79
• Install temporary noise barriers
• Reroute construction related truck traffic away from residential streets
• Avoid impact pile driving where possible (drilled piles or vibratory pile driving are quieter alternatives, where geological conditions permit)
A specific noise control plan should be implemented by the contractor with special attention given to sensitive noise receivers, such as residences, schools, and parks. The plan should also include a noise monitoring program, to ensure that noise thresholds are not being exceeded. In addition, representatives from the Construction Authority should be available during construction to discuss resident and business owner noise complaints and to take appropriate action where possible to minimize noise impacts.
5.6.2 Construction Vibration
Some activities, such as pile driving, pavement breaking, and the use of tracked vehicles (e.g., bulldozers), could result in perceptible levels of groundborne vibration. However, these activities would be limited in duration and vibration levels are likely to be well below thresholds for minor cosmetic building damage. Typical vibration limits are shown in Table 32. Given that planned construction would include a limited number of activities expected to generate vibration that approaches the lowest limit in Table 32, no special mitigation measures are required to avoid vibration impact during construction.
In the event that equipment producing high levels of vibration need to be used for a sustained period of time near residences, the noise control plan should also include measures to minimize vibration impacts during construction.
Table 32: Vibration Velocity Levels at Which Damage Occurs
Building Type PPV1 (in/sec)
Source
Typical Modern Construction 2.0 Building of Mines Bulletin 656, 1971 Extremely fragile buildings 0.2 FTA, 2006 Historic and ancient buildings 0.12 German Standard DIN 4150 Notes: 1 Peak particle velocity
6. MITIGATION
6.1 Operational Noise
The noise analysis identified noise sensitive receivers where there is potential for future noise levels to exceed the applicable FTA noise impact threshold. Mitigation measures that may be implemented to reduce noise to below the FTA thresholds are described below: