4. CHEMICAL REACTION EQUILIBRIA - users.metu.edu.trusers.metu.edu.tr/olguny/files/2044.pdf ·...
14
4. CHEMICAL REACTION EQUILIBRIA 4.1. Introduction In materials processing or materials in service, chemical reactions take place. For example, in the production of steel, liquid iron containing impurities are subjected a reaction with gaseous oxygen. When a material is exposed to an atmosphere, it may be capable of reacting with other constituents of the environment. 4.2. Chemical Reaction Equilibrium Consider a general equilibrium, aA + bB = cC + dD ————— ————— Reactants Products Under constant T and P G = 0 (Criteria for equilibrium) G = Gproducts - Greactants = cG C + dG D - aG A - bG B For condensed phases: G i = o i G + R T ln a i For gases, G i = o i G + R T ln P i Therefore, activity is replaced by partial pressure for gases; Then G = c G C o + cRT ln a C + d G D o + dRT ln a D - a G A o - aRT ln a A - b G B o - bRT ln a B G = G + R T ln b B a A d D c C a a a a
Transcript of 4. CHEMICAL REACTION EQUILIBRIA - users.metu.edu.trusers.metu.edu.tr/olguny/files/2044.pdf ·...

4. CHEMICAL REACTION EQUILIBRIA
4.1. Introduction
In materials processing or materials in service, chemical reactions take place.
For example, in the production of steel, liquid iron containing impurities are
subjected a reaction with gaseous oxygen. When a material is exposed to an
atmosphere, it may be capable of reacting with other constituents of the
environment.
4.2. Chemical Reaction Equilibrium
Consider a general equilibrium,
aA + bB = cC + dD ————— —————
Reactants Products
Under constant T and P
G = 0 (Criteria for equilibrium)
G = Gproducts - Greactants
= cGC + dGD - aGA - bGB
For condensed phases:
Gi = o
iG + R T ln ai
For gases,
Gi = o
iG + R T ln Pi
Therefore, activity is replaced by partial pressure for gases; Then
G = cGCo + cRT ln aC + dGD
o + dRT ln aD - aGA
o - aRT ln aA - bGB
o - bRT ln aB
G = G + R T ln b
B
a
A
d
D
c
C
aa
aa

Activity can be replaced by partial pressure for gases. For pure condensed
phases activity can be taken as unity.
This equation can be written as: G = G + R T ln Q
Q is called reaction quotient.
G = f(T) tabulated
Since, G = H - T S
at any temperature T
G = Ho298 + Cp dT - T(S o
298 + Cp dT
T)
Cp = a + bT + cT-2
Cp = a + bT + cT-2
where
a = aprod - areact
the same way b and c are differences between b and c constants of the
products and the reactants.
G = Ho298 + (a + b T + c T-2) dT - T(S o
298 + a bT cT
TdT
2
)
G =Ho298 + (
a T
bT c T
T
2
2
298/ - T(S o
298 + (
a T bTc
TT
ln
2
2
298)
Replacement of the upper and the lower limits yields
G = Io + I1 T -
aT Tb
Tc
Tln
2 2
2 1
where, Io = Ho298 - (
a
bc298
2298 2982 / )
I1 = a - S o298 +
a b
cln 298 298
2298 2

4.3. Oxidation of Metals
One important equilibrium; between condensed phases (metals and oxides)
and a gaseous phase (oxygen containing) is oxidation of metals. Consider
the oxidation of copper
4 Cu(s) + O2(g) = 2 Cu2O(s)
Ho298 = -334400 J
S o298 = -152.07 J/K
Cp = 4.18 + 18.39x10⁻³ T + 1.67x10⁵ T-2 J/K
Using above values
Io = -334400 - 1500
I1 = 4.18 + 152.07 + 28.35
Go, purely from thermochemical data is
Go = -335900 + 184.59 T - 4.18 T ln T - 9.2x10⁻³ T2 - 0.84x10⁵ T-1 J (a)
If pure Cu reacting with oxygen to form pure Cu2O;
Go = R T ln PO2(eqm')
Experimental variation of Go with T can be calculated from the measured
oxygen partial pressure, PO2(eqm') that is in equilibrium with Cu and Cu2O.
When experimental Go vs. T is fit to
Go = A + B T log T + C T
for oxidation of copper
Go = -338580 - 32.77 T log T + 246.62 T (J) (b)
The comparison of Go calculated from (a) and (b) is shown in Table. The
difference in the temperature range 400 to 1200 K is between 293 to 794 J.
2-term fit
Go = A + B T
Go = -328500 + 137.94 T (J) (c)
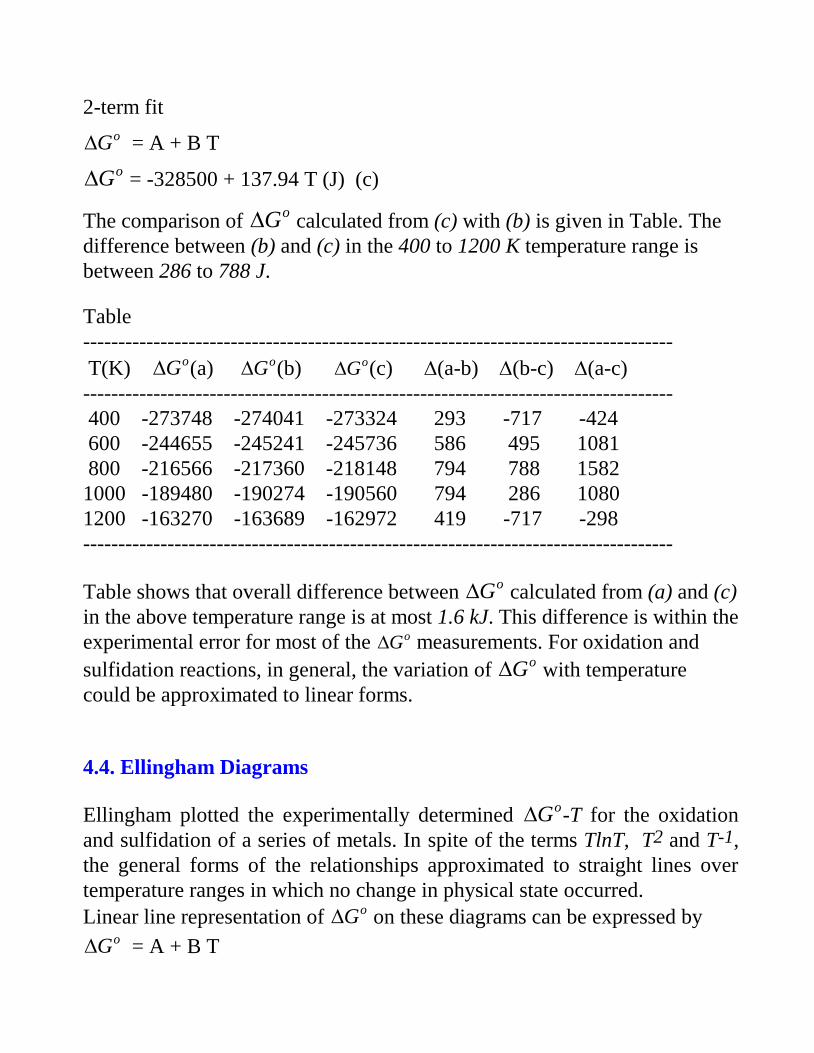
The comparison of Go calculated from (c) with (b) is given in Table. The
difference between (b) and (c) in the 400 to 1200 K temperature range is
between 286 to 788 J.
Table
------------------------------------------------------------------------------------
T(K) Go(a) Go(b) Go(c) (a-b) (b-c) (a-c)
------------------------------------------------------------------------------------
400 -273748 -274041 -273324 293 -717 -424
600 -244655 -245241 -245736 586 495 1081
800 -216566 -217360 -218148 794 788 1582
1000 -189480 -190274 -190560 794 286 1080
1200 -163270 -163689 -162972 419 -717 -298
------------------------------------------------------------------------------------
Table shows that overall difference between Go calculated from (a) and (c)
in the above temperature range is at most 1.6 kJ. This difference is within the
experimental error for most of the Go measurements. For oxidation and
sulfidation reactions, in general, the variation of Go with temperature
could be approximated to linear forms.
4.4. Ellingham Diagrams
Ellingham plotted the experimentally determined Go-T for the oxidation
and sulfidation of a series of metals. In spite of the terms TlnT, T2 and T-1,
the general forms of the relationships approximated to straight lines over
temperature ranges in which no change in physical state occurred.
Linear line representation of Go on these diagrams can be expressed by
Go = A + B T

Since, Go = H - T S
A, which is the intercept at 0 K, is the temperature independent H
B, the slope, -S
All these imply that Cp 0, for oxidation reactions.
Another important characteristic of Ellingham Diagram is that; all the lines
represent reactions involving one mole of oxygen.
2x/y M + O2 = 2/y MxOy
Therefore, the ordinate (G) of all the oxidation reactions become
R T ln P eqmO2( )
Almost all the G lines have positive slopes.
Slope = -S; S < 0
For oxidation
M(s) + O2(g) = MO2(s)
S = S S SMOo
Mo
Oo
2 2
Generally in the temperature range where M and MO2 are solid SOo
2is
dominant. Therefore,
S -SOo
2
Since all the standard entropies are positive, slopes are also positive. In
addition, in the temperature range where metal and oxide are solid, the
slopes are approximately equal. So, in this temperature range, almost all the
lines are parallel to each other.
Examples:
Using standard entropies at 298 K SOo
2= 205.11 J/mol.K
Ni(s) : 29.8; NiO(s): 38.09
2 Ni(s) + O2(g) = 2 NiO(s) S = -188.53 J/K
Sn(s): 51.49; SnO2(s) : 48.56
Sn(s) + O2(g) = SnO2(s) S = -208.04 J/K

The exceptions to above statements are:
C(s) + O2(g) = CO2(g) S 0
and
2 C(s) + O2(g) = 2 CO(g) S > 0

4.4.1. Effect of Phase Transformation
Lines on Ellingham diagrams often have sharp breaks in them. These sharp
breaks are caused by phase transformations. The straight line representation
of Go vs. T relationships are valid if there is no physical change taking
place for any one of the components taking part in the reaction equilibrium.
Straight line indicates that
Go = A + B T
A = H Temperature independent
B = -S Temperature independent
which implies that Cp = 0 for oxidation reactions.
Consider the transformation of M(s) to M(l) at Tm(M)
H
TTm(M)
S
TTm(M)
0
Since, Go = H - T S
-T S

TTm(M)
M(s)
M(l)
0
G
TTm(M)
M(s)
M(l)
The net effect of phase transformation of a reactant from a low temperature
to a high temperature phase is increase in slope.
Now, consider the transformation of product MO2(s) to MO2(l) at Tm(MO2)
H
TTm(MO)
S
TTm(MO)
0
Since, Go = H - T S

-T S
TTm(MO)
MO(s) MO(l)
0
G
TTm(MO)
MO(s)
MO(l)
The net effect of phase transformation of a product from a low temperature
to a high temperature phase is decrease in slope.
Effect of evaporation on G vs. T plots is similar to melting, but more
pronounced. This is because Hv is about 10Hm. Of course, slope changes
for allotropic transformations will be less than that for melting.
G
T
Tm(M)
M(s)
M(l)
Tb(M)
M(g)

Above figure illustrates the effects of melting and evaporation of a reactant
metal on Ellingham diagram.
It can be easily seen from the applicationof subtraction, that
M(s) + O2(g) = MO2(s) ∆H1
M(l) + O2(g) = MO2(s) ∆H2
M(s) = M(l) ∆Hm = ∆H2 - ∆H1
When there are more than one phase transformations;

4.4.2. Stability of Oxides
The Ellingham line for the M/MO2 equilibrium is shown in figure.
Go
MMO
2
( MO2
,O 2)
( M, O2
)
T
All along the line G = 0 and oxygen partial pressure is P(O2)(eqm'). When
a metal is exposed to an oxidizing atmosphere, let the partial pressure of
oxygen in this environment as PO2(actual). Then

G G RTP actual
o
O
ln( )
1
2
Then, G RT P eqm RT P actualO O ln ( ) ln ( )2 2
At any point above the line P actualO2( )> P eqmO2
( )
Then, G < 0.
This implies that, MO2 formation is spontaneous. Therefore, MO2 is stable.
At any point below the line P actualO2( )< P eqmO2
( )
Then, G > 0.
This implies that, MO2 formation is impossible. Therefore, M is stable.
Stability regions for M and MO2 are indicated in the figure. M-MO2-O2
coexist together on the line.
4.4.3. Relative Stabilities of Oxides
Most of the lines on Ellingham diagram are almost parallel to each other.
Consider two lines for M/MO and N/NO equilibria. Stability regions for M,
N, MO and NO are indicated in figure.
Go
MMO
( MO, NO
( M, N )
T
NNO
M, NO
)
( )
The oxide whose region of stability is larger is more stable. From the figure,
it can be said that NO is relatively more stable than MO. The element whose
oxide is more stable is more reactive. The element of the less stable oxide is
more stable in elemental form. M is more stable than N.

Oxidation-Reduction Reactions:
MO can be reduced by N
Ellingham lines are not always parallel to each other, sometimes they
intercept each other. Consider the two lines for X/XO and Y/YO equilibria. X,
Y, XO and YO stability regions are indicated in figure.
Go
T
X
XO
Y YO
( XO, YO )
( X, YO )
( Y, XO )
( X, Y )
TE
In this case relative stability changes with temperature. Below TE, YO is
more stable than XO, but above this temperature XO becomes more stable.
At the temperature TE, all the components, X, Y, XO and YO could coexist.
Another important information that could be seen here is, no stability region
for Y and XO together below TE and for X and YO together above TE. This
indicates that if Y and XO are brought together at a temperature below TE,
they are not stable together; therefore Y will be oxidized while XO is being
reduced.