4 Chapter 8 Graphs and Functions - Birkbeck, University of ... · 87 Chapter 8 – Graphs and...
14
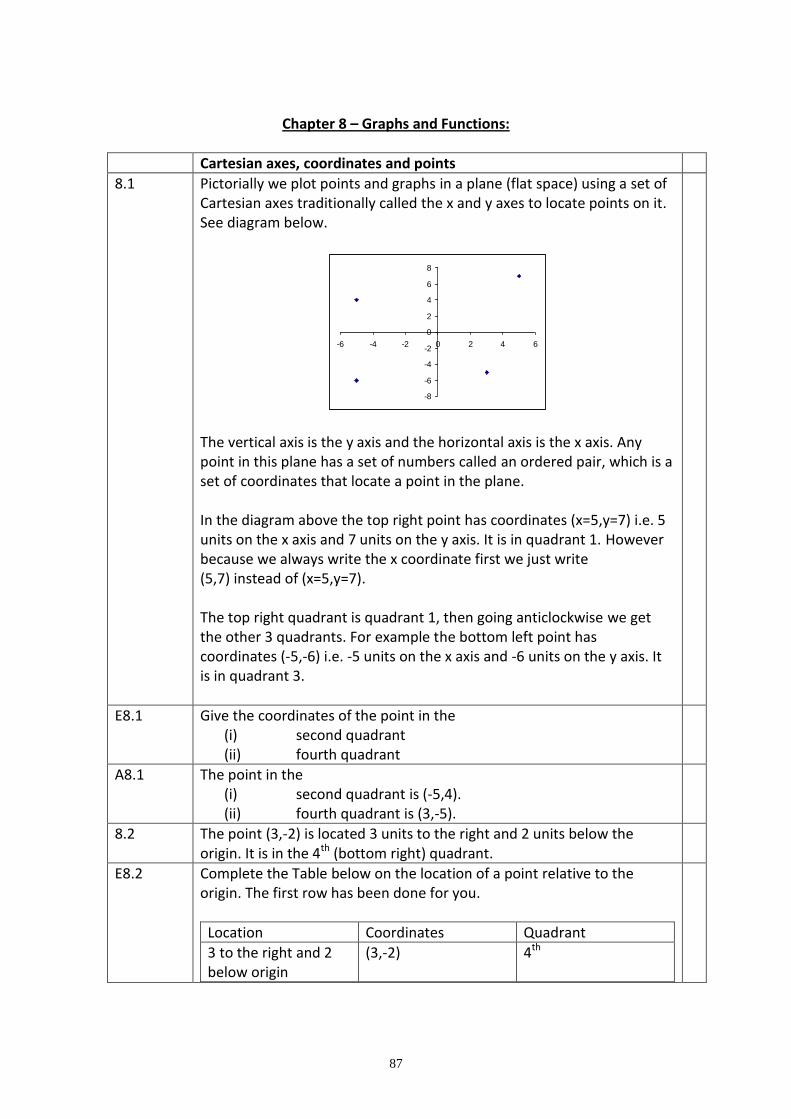
87 Chapter 8 – Graphs and Functions: Cartesian axes, coordinates and points 8.1 Pictorially we plot points and graphs in a plane (flat space) using a set of Cartesian axes traditionally called the x and y axes to locate points on it. See diagram below. -8 -6 -4 -2 0 2 4 6 8 -6 -4 -2 0 2 4 6 The vertical axis is the y axis and the horizontal axis is the x axis. Any point in this plane has a set of numbers called an ordered pair, which is a set of coordinates that locate a point in the plane. In the diagram above the top right point has coordinates (x=5,y=7) i.e. 5 units on the x axis and 7 units on the y axis. It is in quadrant 1. However because we always write the x coordinate first we just write (5,7) instead of (x=5,y=7). The top right quadrant is quadrant 1, then going anticlockwise we get the other 3 quadrants. For example the bottom left point has coordinates (-5,-6) i.e. -5 units on the x axis and -6 units on the y axis. It is in quadrant 3. E8.1 Give the coordinates of the point in the (i) second quadrant (ii) fourth quadrant A8.1 The point in the (i) second quadrant is (-5,4). (ii) fourth quadrant is (3,-5). 8.2 The point (3,-2) is located 3 units to the right and 2 units below the origin. It is in the 4 th (bottom right) quadrant. E8.2 Complete the Table below on the location of a point relative to the origin. The first row has been done for you. Location Coordinates Quadrant 3 to the right and 2 below origin (3,-2) 4 th
Transcript of 4 Chapter 8 Graphs and Functions - Birkbeck, University of ... · 87 Chapter 8 – Graphs and...
87
Chapter 8 – Graphs and Functions:
Cartesian axes, coordinates and points
8.1 Pictorially we plot points and graphs in a plane (flat space) using a set of Cartesian axes traditionally called the x and y axes to locate points on it. See diagram below.
-8
-6
-4
-2
0
2
4
6
8
-6 -4 -2 0 2 4 6
The vertical axis is the y axis and the horizontal axis is the x axis. Any point in this plane has a set of numbers called an ordered pair, which is a set of coordinates that locate a point in the plane. In the diagram above the top right point has coordinates (x=5,y=7) i.e. 5 units on the x axis and 7 units on the y axis. It is in quadrant 1. However because we always write the x coordinate first we just write (5,7) instead of (x=5,y=7). The top right quadrant is quadrant 1, then going anticlockwise we get the other 3 quadrants. For example the bottom left point has coordinates (-5,-6) i.e. -5 units on the x axis and -6 units on the y axis. It is in quadrant 3.
E8.1 Give the coordinates of the point in the (i) second quadrant (ii) fourth quadrant
A8.1 The point in the (i) second quadrant is (-5,4). (ii) fourth quadrant is (3,-5).
8.2 The point (3,-2) is located 3 units to the right and 2 units below the origin. It is in the 4th (bottom right) quadrant.
E8.2 Complete the Table below on the location of a point relative to the origin. The first row has been done for you.
Location Coordinates Quadrant
3 to the right and 2 below origin
(3,-2) 4th

88
(-5, 2)
At the origin Junction of all 4
( , 4) Boundary Between 1st and 2nd.
(-2,0)
4 to the left and 2 above.
(5, ) Boundary between 1st and 4th
Plot these points on the axes above.
A8.2
Location Coordinates Quadrant
3 to the right and 2 directly below origin
(3,-2) 4th
5 to the left, 2 below (-5, 2) 2nd
At the origin (0,0) Junction of all 4
4 above the origin (0, 4) Boundary Between 1st and 2nd.
2 to the left (-2,0) Between 2nd And 3rd.
4 to the left and 2 above.
(-4,2) 2nd
5 to the right (5,0 ) Boundary between 1st and 4th
Equations with infinite solutions
8.3 We know that x + 3 = 5 is an equation that we can solve by inspection. There is only one solution,
x = 2. Now consider the equation, x + y =10. It has two unknowns and we can produce many solutions by inspection such as x = 5 and y = 5, x = 0 and y = 10, x = 1 and y = 9. Also solutions with negative values such as x = -4 and y = 14 etc. Why does the first equation have one solution and the second equation have an infinite number? The reason is that the first equation has just one unknown, x whereas the second equation has two unknowns x and y and yet we have just one piece of information.
E8.3 How many solutions do the following equations have?

89
(i) 2x + 7 = 9. Identify it. (ii) 5x + 6y = 10
Can you identify some of them?
A8.3 (i) 2x + 7 = 9. Has 1 solution, x = 1. (ii) 5x + 2y = 10. Has an infinite number of solutions e.g.
(2,0), (0,5), (1,2.5) etc. Can you identify some of them?
8.4 Since 1 equation with two unknowns has an infinite number of solutions we can produce a graph by plotting the set of solutions on a set of Cartesian axes. Here are some solutions to the equation: y = 2x + 3 (0,3) because y = 3 when x = 0. (2,7) because y = 7 when x = 2. (-3, -3) because when x = -3, y = -3.
E8.4 Complete the following coordinates for some of the solutions of the equation: y = 2x + 3 (-2, ) ; (-3, ) ; (-1, ) ; (1, ) ; ( , 4) ; ( , -3) ; (0, ) Plot the points on the axes given below.
A8.4 Complete the following coordinates for some of the solutions of the equation: y = 2x + 3 (-2,-1) ; (-3,-3) ; (-1,1) ; (1,5) ; (0.5, 4) ; (-3, -3) ; (0,3)
-4
-2
0
2
4
6
8
10
12
14
-4 0 2 4 6

90
Linear graphs
8.5 What is the graph of the entire solution set? It is a straight line as shown below:
-4
-2
0
2
4
6
8
10
12
14
-4 -2 0 2 4 6
Graph of y =2x + 3
E8.5 Examine the graph and identify the points where the graph crosses the y axis and the x axis. Graph crosses y axis at (0,3) and cross the x axis at (-1.5,0)
8.6 In graphing the equation, y = 2x + 3 let’s see what the significance of the coefficient of 2 and and the constant term 3 is. Note the 2 is the coefficient of the x term (linear term) and the 3 is the constant term. First consider the constant term, 3. Notice that when x = 0 then y = 3. Hence (0,3) is a point on the graph. Which quadrant is it in? It is on the boundary between the 1st and 2nd quadrants i.e. it lies on the y axis. We call this point the y intercept. So we say either the y intercept is 3 or we say the y intercept is the point (0,3). We say that in the graph y = mx + c, c is the y intercept.
E8.6 What is the y intercept of the following graphs? (i) y = 2x + 4 (ii) y = 2x – 3 (iii) y = 2x?
A8.6 The y intercept of (i) y = 2x + 4 is 4 i.e. the point (0,4). (ii) y = 2x – 3 is -3 i.e. the point (0,-3). (iii) y = 2x is 0 i.e. the point (0,0).
8.7 Now what is the significance of the coefficient of x of the RHS (2 in this case) in the graph of
y = 2x + 3?

91
Let us look at two random points on the graph, say point A at (1,5) and point B at (3,9) We can by looking at the x coordinates of the two points determine that B is 2 units to the right of A. We write ∆x = x value of B – x value of A. = 3 – 1 =2 We can by looking at the y coordinates of the two points determine that B is 4 units above A. We write ∆y = y value of B – y value of A = 9 – 5 = 4 So in going from A to B the graph is climbing 4 units up for every 2 units to the right. So we say the graph has a slope or gradient of ‘4 in 2’ which we write as
.22
4
x
y gradient
So the coefficient of the x term in the equation y = 2x + 3 is the gradient. Summarise: constant term = 3 is the y intercept coefficient of x term = the slope or gradient of the line given by
x
y gradient
E8.7 Complete the Table below: The first row has been done for you.
Equation of line Slope Y intercept
y = 2x + 3 2 3
4 -1
y = 3x – 4
-2 2
y = 4x
0 -4
y = 5 – 2x
y = 4
5 0
A8.7
Equation of line Slope Y intercept
y = 2x + 3 2 3
y = 4x – 1 4 -1
y = 3x – 4 3 -4
y = -2x + 2 -2 2
y = 4x 4 0
y = -4 0 -4

92
y = 5 – 2x -2 5
y = 4 0 4
y = 5x 5 0
8.8 What is the equation of the line that passes through the points (0,3) and has a slope of -2? We know that in general the equation is of the form:
y = mx + c, where m is the slope (coefficient of x term) and y intercept is c (the constant term). Since the slope is -2 (i.e. the coefficient of x is -2) y = mx + c becomes y = -2x + c. Since the graph passes through (0,3) we know the y intercept is 3; So c is 3 and y = -2x + c becomes y = -2x + 3. So the equation is y = -2x + 3 OR y = 3 – 2x.
E8.8 What is the equation of the line that passes through the point i. (0 , -1) and has a slope of 2 ii. (0, 2) and has a slope of -3 iii. (0,0) and has a slope of 1
A8.8 i. y = 2x – 1 ii. y = -3x + 2 iii. y = x
8.9 What is the equation of the line that passes through the points (0,3) and (2,5)? We know that in general the equation is of the form:
y = mx + c, where m is the slope (coefficient of x term) and y intercept is c (the constant term). Since the graph passes through (0,3), which is on the y axis, we know the y intercept is 3; so c is 3, so y = mx + c becomes y = mx + 3. The point (2,5) is 2 units to the right (2 – 0) and 2 units above (5 – 3) the point (0,3).
.12
2
0-2
3-5
x
y gradient
So the slope is 2 in 2 i.e. m=1
93
so y = mx + 3 becomes y = x + 3. So the equation of the line is y = x + 3
E8.9 What is the equation of the line that passes through the points (0,-1) and (1,4)?
A8.9 (0,-1) tells us that the y intercept is -1 so we can write y = mx – 1. (0,-1) and (1,4) tells us that the gradient is 5. So y = 5x – 1.
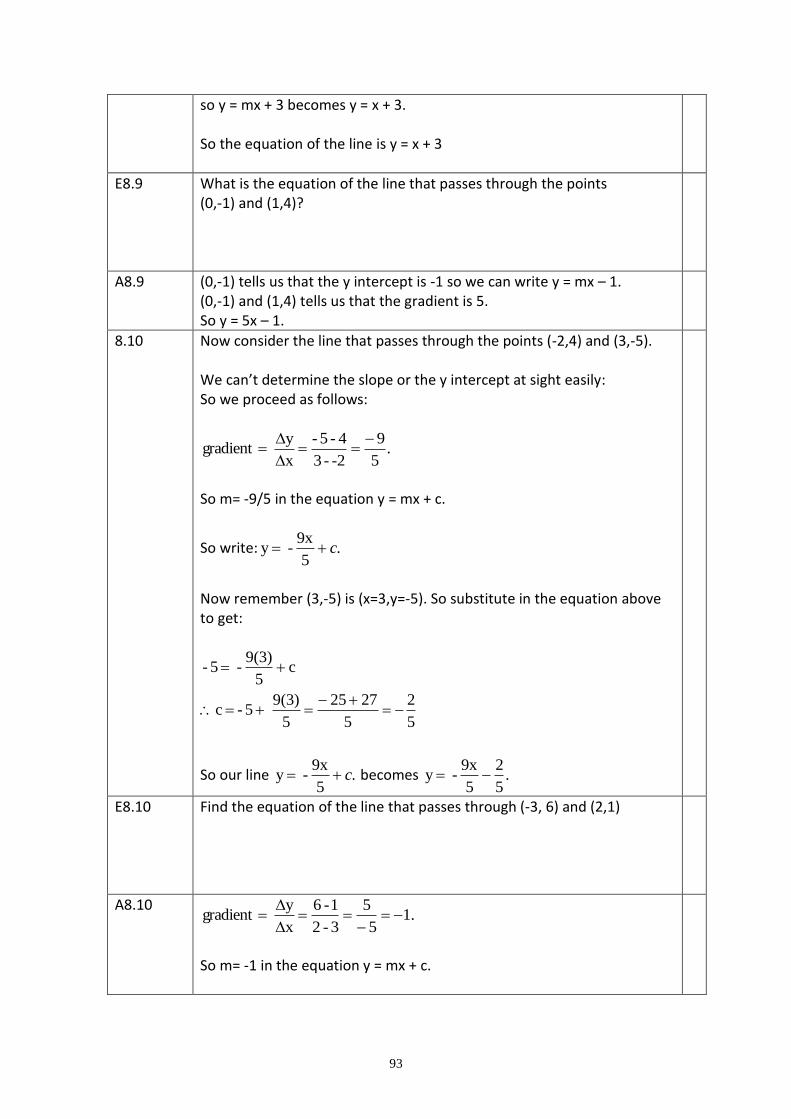
8.10 Now consider the line that passes through the points (-2,4) and (3,-5). We can’t determine the slope or the y intercept at sight easily: So we proceed as follows:
.5
9
-2-3
4-5-
x
y gradient
So m= -9/5 in the equation y = mx + c.
So write: .5
9x- y c
Now remember (3,-5) is (x=3,y=-5). So substitute in the equation above to get:
5
2
5
2725
5
9(3) 5- c
c5
9(3)- 5-
So our line .5
9x- y c becomes .
5
2
5
9x- y
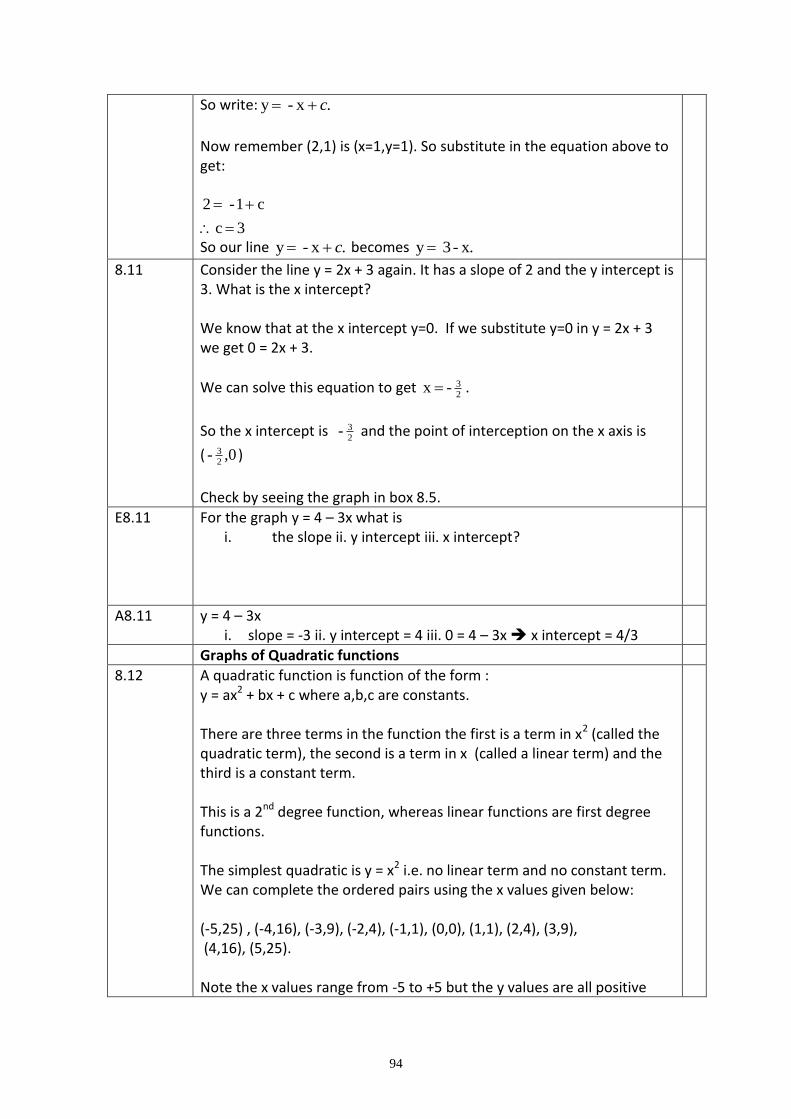
E8.10 Find the equation of the line that passes through (-3, 6) and (2,1)
A8.10 .1
5
5
3-2
1-6
x
y gradient
So m= -1 in the equation y = mx + c.
94
So write: .x- y c
Now remember (2,1) is (x=1,y=1). So substitute in the equation above to get:
3 c
c1- 2
So our line .x- y c becomes . x- 3 y
8.11 Consider the line y = 2x + 3 again. It has a slope of 2 and the y intercept is 3. What is the x intercept? We know that at the x intercept y=0. If we substitute y=0 in y = 2x + 3 we get 0 = 2x + 3.
We can solve this equation to get 23- x .
So the x intercept is 23- and the point of interception on the x axis is
( 0,-23 )
Check by seeing the graph in box 8.5.
E8.11 For the graph y = 4 – 3x what is i. the slope ii. y intercept iii. x intercept?
A8.11 y = 4 – 3x i. slope = -3 ii. y intercept = 4 iii. 0 = 4 – 3x x intercept = 4/3
Graphs of Quadratic functions
8.12 A quadratic function is function of the form : y = ax2 + bx + c where a,b,c are constants. There are three terms in the function the first is a term in x2 (called the quadratic term), the second is a term in x (called a linear term) and the third is a constant term. This is a 2nd degree function, whereas linear functions are first degree functions. The simplest quadratic is y = x2 i.e. no linear term and no constant term.
We can complete the ordered pairs using the x values given below: (-5,25) , (-4,16), (-3,9), (-2,4), (-1,1), (0,0), (1,1), (2,4), (3,9), (4,16), (5,25). Note the x values range from -5 to +5 but the y values are all positive

95
because the square of a number is always +ve.
E8.12 Complete the following points on this quadratic: ( ,25), ( ,0), ( ,25) so that the points are distinct (i.e. separate)
A8.12 ( -5,25), (0,0), (5,25)
8.13 The graph is plotted below
0
5
10
15
20
25
30
-10 -5 0 5 10
E8.13 What is the y intercept? What is the y intercept? the x intercept? What is the axis of symmetry? What is the minimum point? What is the minimum y value?
A8.13 y intercept is 0, the x intercept is 0, the axis of symmetry is x = 0, the minimum point is (0,0), the minimum value is 0.
8.14 Now suppose we want to sketch (rather than draw) the quadratic, y = x2 – 2x – 15
We can find the y intercept by putting x = 0 in
y = x2 – 2x – 15 to get y = -15. So the graph crosses the y axis at (0,-15). Now to find the x intercepts we put y = 0 to get: 0 = x2 – 2x – 15. Write this as x2 – 2x – 15 = 0 and solve viz.
(x – 5)(x + 3) = 0 So x = -3 and x = 5. The graph crosses the x axis at (-3,0) and (5,0). The axis of symmetry is a vertical line bisecting the line joining (-3,0) and (5,0).
96
How do we find it? The middle value of any two numbers is its arithmetic average.
The average of x = -3 and x = 5 is thus
1x
2
5) (-3 x
The axis of symmetry is x = 1. Now we get the minimum y value using the fact that minimum y value is on the axis of symmetry, x = 1. So putting x=1 in y = x2 – 2x – 15 we get
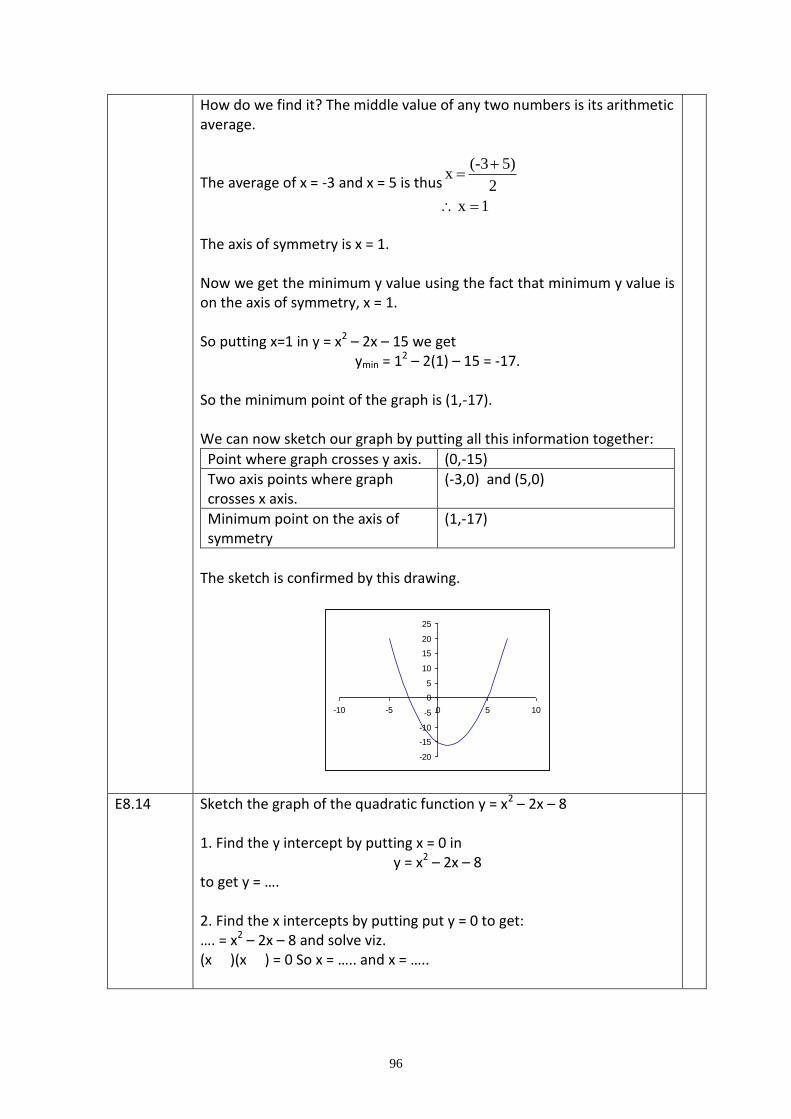
ymin = 12 – 2(1) – 15 = -17. So the minimum point of the graph is (1,-17). We can now sketch our graph by putting all this information together:
Point where graph crosses y axis. (0,-15)
Two axis points where graph crosses x axis.
(-3,0) and (5,0)
Minimum point on the axis of symmetry
(1,-17)
The sketch is confirmed by this drawing.
-20
-15
-10
-5
0
5
10
15
20
25
-10 -5 0 5 10
E8.14 Sketch the graph of the quadratic function y = x2 – 2x – 8 1. Find the y intercept by putting x = 0 in
y = x2 – 2x – 8 to get y = …. 2. Find the x intercepts by putting put y = 0 to get: …. = x2 – 2x – 8 and solve viz. (x )(x ) = 0 So x = ….. and x = …..

97
The two points of interception on the x axis are (…,….) and (…,…) The axis of symmetry is a vertical line bisecting the line joining (….,…) and (…,…) The middle x value is its arithmetic average. The average of x = … and x = … is thus x = ….. The axis of symmetry is x = …... The minimum y value is on the axis of symmetry, x = ….. So putting x=…. in y = x2 – 2x – 8 we get
ymin = …. So the minimum point of the graph is (….,….). We can now sketch our graph by putting all this information together:
Point of interception on y axis ( , )
Two points of interception on x axis
( , ) and ( , )
Minimum point on the axis of symmetry
( , )
Sketch:
A8.14 Sketch the graph of the quadratic function y = x2 – 2x – 8 1. Find the y intercept by putting x = 0 in
y = x2 – 2x – 8 to get y = -8. So the y intercept is the point (0,-8). 2. Find the x intercepts by putting put y = 0 to get: 0 = x2 – 2x – 8 and solve viz. (x – 4)(x + 2) = 0 So x = 4 and x = -2 are the x intercepts.
98
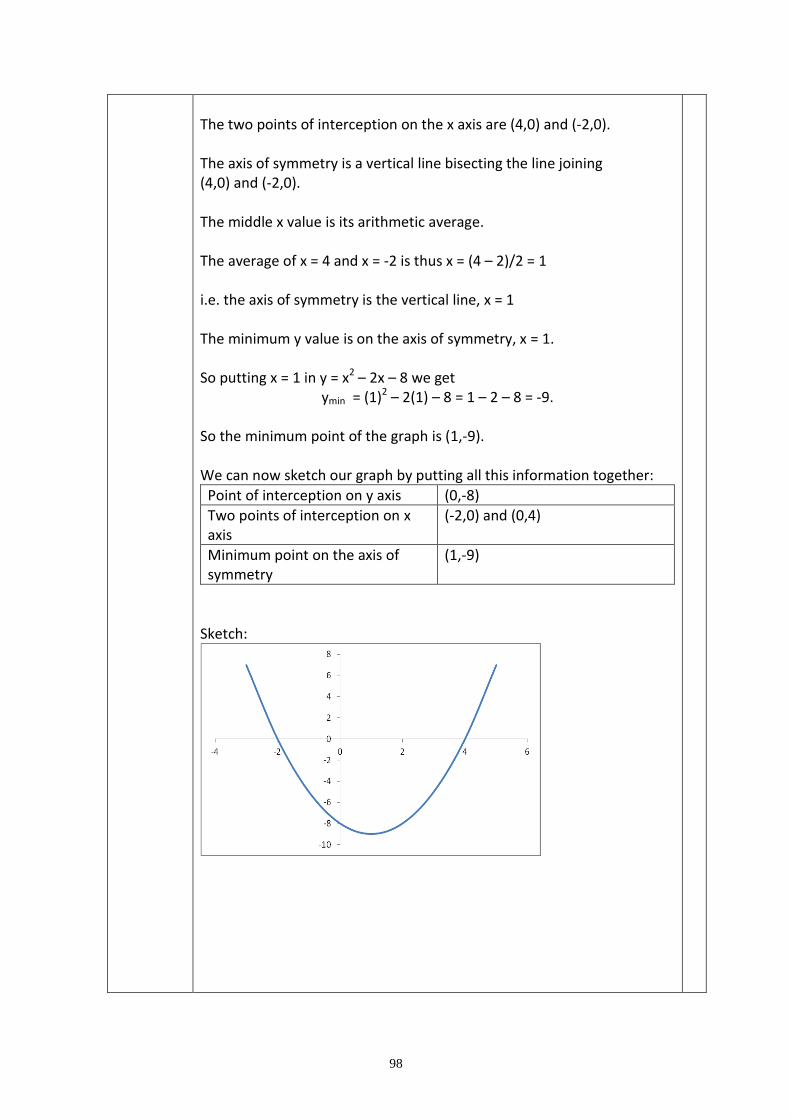
The two points of interception on the x axis are (4,0) and (-2,0). The axis of symmetry is a vertical line bisecting the line joining (4,0) and (-2,0). The middle x value is its arithmetic average. The average of x = 4 and x = -2 is thus x = (4 – 2)/2 = 1 i.e. the axis of symmetry is the vertical line, x = 1 The minimum y value is on the axis of symmetry, x = 1. So putting x = 1 in y = x2 – 2x – 8 we get
ymin = (1)2 – 2(1) – 8 = 1 – 2 – 8 = -9. So the minimum point of the graph is (1,-9). We can now sketch our graph by putting all this information together:
Point of interception on y axis (0,-8)
Two points of interception on x axis
(-2,0) and (0,4)
Minimum point on the axis of symmetry
(1,-9)
Sketch:

99

100
Exercise 8
1. Find the equation of the straight line with a gradient of 2 passing thru the point (-1,1). 2. A line passes thru the points (0,3)and (3,0). Find Delta-x, Delta-y, the slope, and the equation of the line. 3. A variable P changes from 20 to 30. This causes a dependent variable Q to change from 100 to 25. Find Delta-P, delta-Q, the slope, the proportional change in P, proportional change in Q and the ratio of the proportional change in P to the proportional change in Q. 4.
(i) Sketch the graph of the straight line y = 2 – 3x (ii) what is the gradient? (iii) what is the y intercept? (iv) what is the x intercept?
5 Sketch the quadratic y = x2 – 2x – 8