4 - Changes in Impacts of Climate Extremes: Human … · Changes in Impacts of Climate Extremes:...
60
231 Coordinating Lead Authors: John Handmer (Australia), Yasushi Honda (Japan), Zbigniew W. Kundzewicz (Poland/Germany) Lead Authors: Nigel Arnell (UK), Gerardo Benito (Spain), Jerry Hatfield (USA), Ismail Fadl Mohamed (Sudan), Pascal Peduzzi (Switzerland), Shaohong Wu (China), Boris Sherstyukov (Russia), Kiyoshi Takahashi (Japan), Zheng Yan (China) Review Editors: Sebastian Vicuna (Chile), Avelino Suarez (Cuba) Contributing Authors: Amjad Abdulla (Maldives), Laurens M. Bouwer (Netherlands), John Campbell (New Zealand), Masahiro Hashizume (Japan), Fred Hattermann (Germany), Robert Heilmayr (USA), Adriana Keating (Australia), Monique Ladds (Australia), Katharine J. Mach (USA), Michael D. Mastrandrea (USA), Reinhard Mechler (Germany), Carlos Nobre (Brazil), Apurva Sanghi (World Bank), James Screen (Australia), Joel Smith (USA), Adonis Velegrakis (Greece), Walter Vergara (World Bank), Anya M. Waite (Australia), Jason Westrich (USA), Joshua Whittaker (Australia), Yin Yunhe (China), Hiroya Yamano (Japan) This chapter should be cited as: Handmer, J., Y. Honda, Z.W. Kundzewicz, N. Arnell, G. Benito, J. Hatfield, I.F. Mohamed, P. Peduzzi, S. Wu, B. Sherstyukov, K. Takahashi, and Z. Yan, 2012: Changes in impacts of climate extremes: human systems and ecosystems. In: Managing the Risks of Extreme Events and Disasters to Advance Climate Change Adaptation [Field, C.B., V. Barros, T.F. Stocker, D. Qin, D.J. Dokken, K.L. Ebi, M.D. Mastrandrea, K.J. Mach, G.-K. Plattner, S.K. Allen, M. Tignor, and P.M. Midgley (eds.)]. A Special Report of Working Groups I and II of the Intergovernmental Panel on Climate Change (IPCC). Cambridge University Press, Cambridge, UK, and New York, NY, USA, pp. 231-290. 4 Changes in Impacts of Climate Extremes: Human Systems and Ecosystems
-
Upload
truongnhan -
Category
Documents
-
view
217 -
download
0
Transcript of 4 - Changes in Impacts of Climate Extremes: Human … · Changes in Impacts of Climate Extremes:...

231
Coordinating Lead Authors:John Handmer (Australia), Yasushi Honda (Japan), Zbigniew W. Kundzewicz (Poland/Germany)
Lead Authors:Nigel Arnell (UK), Gerardo Benito (Spain), Jerry Hatfield (USA), Ismail Fadl Mohamed (Sudan),Pascal Peduzzi (Switzerland), Shaohong Wu (China), Boris Sherstyukov (Russia), Kiyoshi Takahashi(Japan), Zheng Yan (China)
Review Editors:Sebastian Vicuna (Chile), Avelino Suarez (Cuba)
Contributing Authors:Amjad Abdulla (Maldives), Laurens M. Bouwer (Netherlands), John Campbell (New Zealand),Masahiro Hashizume (Japan), Fred Hattermann (Germany), Robert Heilmayr (USA), Adriana Keating(Australia), Monique Ladds (Australia), Katharine J. Mach (USA), Michael D. Mastrandrea (USA),Reinhard Mechler (Germany), Carlos Nobre (Brazil), Apurva Sanghi (World Bank), James Screen(Australia), Joel Smith (USA), Adonis Velegrakis (Greece), Walter Vergara (World Bank), Anya M. Waite(Australia), Jason Westrich (USA), Joshua Whittaker (Australia), Yin Yunhe (China), Hiroya Yamano(Japan)
This chapter should be cited as:
Handmer, J., Y. Honda, Z.W. Kundzewicz, N. Arnell, G. Benito, J. Hatfield, I.F. Mohamed, P. Peduzzi, S. Wu, B. Sherstyukov,
K. Takahashi, and Z. Yan, 2012: Changes in impacts of climate extremes: human systems and ecosystems. In: Managing the
Risks of Extreme Events and Disasters to Advance Climate Change Adaptation [Field, C.B., V. Barros, T.F. Stocker, D. Qin,
D.J. Dokken, K.L. Ebi, M.D. Mastrandrea, K.J. Mach, G.-K. Plattner, S.K. Allen, M. Tignor, and P.M. Midgley (eds.)]. A Special
Report of Working Groups I and II of the Intergovernmental Panel on Climate Change (IPCC). Cambridge University Press,
Cambridge, UK, and New York, NY, USA, pp. 231-290.
4Changes in Impactsof Climate Extremes: HumanSystems and Ecosystems

Changes in Impacts of Climate Extremes: Human Systems and Ecosystems
232
Executive Summary .................................................................................................................................234
4.1. Introduction..............................................................................................................................237
4.2. Climatic Extremes in Natural and Socioeconomic Systems.....................................................2374.2.1. How Do Climate Extremes Impact on Humans and Ecosystems?....................................................................................2374.2.2. Complex Interactions among Climate Events, Exposure, and Vulnerability ....................................................................238
4.3. System- and Sector-Based Aspects of Vulnerability, Exposure, and Impacts...........................2394.3.1. Introduction......................................................................................................................................................................2394.3.2. Water ................................................................................................................................................................................2414.3.3. Ecosystems .......................................................................................................................................................................2444.3.3.1. Heat Waves.......................................................................................................................................................................................2444.3.3.2. Drought ............................................................................................................................................................................................2464.3.3.3. Floods ...............................................................................................................................................................................................2464.3.3.4. Other Events .....................................................................................................................................................................................2464.3.4. Food Systems and Food Security .....................................................................................................................................2464.3.5. Human Settlements, Infrastructure, and Tourism.............................................................................................................2474.3.5.1. Human Settlements ..........................................................................................................................................................................2474.3.5.2. Infrastructure ....................................................................................................................................................................................2484.3.5.3. Tourism .............................................................................................................................................................................................2504.3.6. Human Health, Well-Being, and Security..........................................................................................................................251
4.4. Regionally Based Aspects of Vulnerability, Exposure, and Impacts.........................................2524.4.1. Introduction......................................................................................................................................................................2524.4.2 Africa ................................................................................................................................................................................2534.4.2.1. Introduction ......................................................................................................................................................................................2534.4.2.2. Droughts and Heat Waves ................................................................................................................................................................2534.4.2.3. Extreme Rainfall Events and Floods..................................................................................................................................................2534.4.2.4. Dust Storms ......................................................................................................................................................................................2544.4.3. Asia...................................................................................................................................................................................2544.4.3.1. Tropical Cyclones (Typhoons or Hurricanes)......................................................................................................................................2544.4.3.2. Flooding............................................................................................................................................................................................2544.4.3.3. Temperature Extremes ......................................................................................................................................................................2554.4.3.4. Droughts ...........................................................................................................................................................................................2554.4.3.5. Wildfires ...........................................................................................................................................................................................2554.4.4. Central and South America ..............................................................................................................................................2554.4.4.1. Extreme Rainfalls in South America..................................................................................................................................................2554.4.4.2. Wildfires ...........................................................................................................................................................................................2554.4.4.3. Regional Costs..................................................................................................................................................................................2564.4.5. Europe ..............................................................................................................................................................................2564.4.5.1. Introduction ......................................................................................................................................................................................2564.4.5.2. Heat Waves.......................................................................................................................................................................................2564.4.5.3. Droughts and Wildfires .....................................................................................................................................................................2564.4.5.4. Coastal Flooding...............................................................................................................................................................................2564.4.5.5. Gale Winds .......................................................................................................................................................................................2574.4.5.6. Flooding............................................................................................................................................................................................258
Chapter 4
Table of Contents

233
4.4.5.7. Landslides .........................................................................................................................................................................................2584.4.5.8. Snow.................................................................................................................................................................................................2584.4.6. North America ..................................................................................................................................................................2584.4.6.1. Introduction ......................................................................................................................................................................................2584.4.6.2. Heat Waves.......................................................................................................................................................................................2584.4.6.3. Drought and Wildfire ........................................................................................................................................................................2594.4.6.4. Inland Flooding.................................................................................................................................................................................2594.4.6.5. Coastal Storms and Flooding............................................................................................................................................................2594.4.7. Oceania.............................................................................................................................................................................2604.4.7.1. Introduction ......................................................................................................................................................................................2604.4.7.2. Temperature Extremes ......................................................................................................................................................................2604.4.7.3. Droughts ...........................................................................................................................................................................................2604.4.7.4. Wildfire .............................................................................................................................................................................................2614.4.7.5. Intense Precipitation and Floods ......................................................................................................................................................2614.4.7.6. Storm Surges ....................................................................................................................................................................................2614.4.8. Open Oceans ....................................................................................................................................................................2614.4.9. Polar Regions ...................................................................................................................................................................2614.4.9.1. Introduction ......................................................................................................................................................................................2614.4.9.2. Warming Cryosphere ........................................................................................................................................................................2624.4.9.3. Floods ...............................................................................................................................................................................................2624.4.9.4. Coastal Erosion.................................................................................................................................................................................2634.4.10. Small Island States...........................................................................................................................................................263
4.5. Costs of Climate Extremes and Disasters ................................................................................2644.5.1. Framing the Costs of Extremes and Disasters .................................................................................................................2644.5.2. Extreme Events, Impacts, and Development....................................................................................................................2654.5.3. Methodologies for Evaluating Impact and Adaptation Costs of Extreme Events and Disasters ....................................2664.5.3.1. Methods and Tools for Costing Impacts............................................................................................................................................2664.5.3.2. Methods and Tools for Evaluating the Costs of Adaptation..............................................................................................................2674.5.3.3. Attribution of Impacts to Climate Change: Observations and Limitations........................................................................................2684.5.4. Assessment of Impact Costs ............................................................................................................................................2694.5.4.1. Estimates of Global and Regional Costs of Disasters .......................................................................................................................2694.5.4.2. Potential Trends in Key Extreme Impacts ..........................................................................................................................................2714.5.5. Assessment of Adaptation Costs .....................................................................................................................................2734.5.6. Uncertainty in Assessing the Economic Costs of Extremes and Disasters ......................................................................274
References ...............................................................................................................................................275
Chapter 4 Changes in Impacts of Climate Extremes: Human Systems and Ecosystems

234
Chapter 4Changes in Impacts of Climate Extremes: Human Systems and Ecosystems
Extreme impacts can result from extreme weather and climate events, but can also occur without extremeevents. This chapter examines two broad categories of impacts on human and ecological systems, both of which areinfluenced by changes in climate, vulnerability, and exposure: first, the chapter primarily focuses on impacts thatresult from extreme weather and climate events, and second, it also considers extreme impacts that are triggered byless-than-extreme weather or climate events. These two categories of impacts are examined across sectors, systems,and regions. Extreme events can have positive as well as negative impacts on ecosystems and human activities.
Economic losses from weather- and climate-related disasters have increased, but with large spatial andinterannual variability (high confidence, based on high agreement, medium evidence). Global weather- andclimate-related disaster losses reported over the last few decades reflect mainly monetized direct damages to assets,and are unequally distributed. Estimates of annual losses have ranged since 1980 from a few US$ billion to above200 billion (in 2010 dollars), with the highest value for 2005 (the year of Hurricane Katrina). In the period 2000 to2008, Asia experienced the highest number of weather- and climate-related disasters. The Americas suffered the mosteconomic loss, accounting for the highest proportion (54.6%) of total loss, followed by Asia (27.5%) and Europe(15.9%). Africa accounted for only 0.6% of global economic losses. Loss estimates are lower bound estimates becausemany impacts, such as loss of human lives, cultural heritage, and ecosystem services, are difficult to value and monetize,and thus they are poorly reflected in estimates of losses. Impacts on the informal or undocumented economy, as wellas indirect effects, can be very important in some areas and sectors, but are generally not counted in reported esti-mates of losses. [4.5.1, 4.5.3.3, 4.5.4.1]
Economic, including insured, disaster losses associated with weather, climate, and geophysical events arehigher in developed countries. Fatality rates and economic losses expressed as a proportion of grossdomestic product (GDP) are higher in developing countries (high confidence). During the period from 1970 to2008, over 95% of deaths from natural disasters occurred in developing countries. Middle-income countries withrapidly expanding asset bases have borne the largest burden. During the period from 2001 to 2006, losses amountedto about 1% of GDP for middle-income countries, while this ratio has been about 0.3% of GDP for low-income coun-tries and less than 0.1% of GDP for high-income countries, based on limited evidence. In small exposed countries, par-ticularly small island developing states, losses expressed as a percentage of GDP have been particularly high, exceed-ing 1% in many cases and 8% in the most extreme cases, averaged over both disaster and non-disaster years for theperiod from 1970 to 2010. [4.5.2, 4.5.4.1]
Increasing exposure of people and economic assets has been the major cause of long-term increases ineconomic losses from weather- and climate-related disasters (high confidence). Long-term trends ineconomic disaster losses adjusted for wealth and population increases have not been attributed to climatechange, but a role for climate change has not been excluded (high agreement, medium evidence). Theseconclusions are subject to a number of limitations in studies to date. Vulnerability is a key factor in disaster losses, yetnot well accounted. Other limitations are: (i) data availability, as most data are available for standard economic sec-tors in developed countries; and (ii) type of hazards studied, as most studies focus on cyclones, where confidence inobserved trends and attribution of changes to human influence is low. The second conclusion is subject to additionallimitations: the processes used to adjust loss data over time, and record length. [4.5.3.3]
Settlement patterns, urbanization, and changes in socioeconomic conditions have all influenced observedtrends in exposure and vulnerability to climate extremes (high confidence). Settlements concentrate theexposure of humans, their assets, and their activities. The most vulnerable populations include urban poor in informalsettlements, refugees, internally displaced people, and those living in marginal areas. Population growth is also a driv-er of changing exposure and vulnerability. [4.2.1, 4.2.2, 4.3.5.1]
In much of the developed world, societies are aging and hence can be more vulnerable to climateextremes, such as heat waves. For example, Europe currently has an aging population, with a higher population
Executive Summary

235
Chapter 4 Changes in Impacts of Climate Extremes: Human Systems and Ecosystems
density and lower birth rate than any other continent. Nonetheless, exposure to climate extremes in Europe hasincreased whereas vulnerability has decreased as a result of implementation of policy, regulations, risk prevention, andrisk management. Urban heat islands pose an additional risk to urban inhabitants, most affecting the elderly, ill, andsocially isolated. [4.3.5.1, 4.3.6, 4.4.5]
Transportation, infrastructure, water, and tourism are sectors sensitive to climate extremes. Transportinfrastructure is vulnerable to extremes in temperature, precipitation/river floods, and storm surges, which can lead todamage in road, rail, airports, and ports, and electricity transmission infrastructure is also vulnerable to extreme stormevents. The tourism sector is sensitive to climate, given that climate is the principal driver of global seasonality intourism demand. [4.3.5.2, 4.3.5.3]
Agriculture is also an economic sector exposed and vulnerable to climate extremes. The economies of manydeveloping countries rely heavily on agriculture, dominated by small-scale and subsistence farming, and livelihoods inthis sector are especially exposed to climate extremes. Droughts in Africa, especially since the end of the 1960s, haveimpacted agriculture, with substantial famine resulting. [4.3.4, 4.4.2]
Coastal settlements in both developed and developing countries are exposed and vulnerable to climateextremes. For example, the major factor increasing the vulnerability and exposure of North America to hurricanes isthe growth in population and increase in property values, particularly along the Gulf and Atlantic coasts of the UnitedStates. Small island states are particularly vulnerable to climate extremes, especially where urban centers and/or islandinfrastructure predominate in coastal locations. Asia’s mega-deltas are also exposed to extreme events such as flood-ing and have vulnerable populations in expanding urban areas. Mountain settlements are also exposed and vulnerableto climate extremes. [4.3.5.1, 4.4.3, 4.4.6, 4.4.9, 4.4.10]
In many regions, the main drivers of future increases in economic losses due to some climate extremes willbe socioeconomic in nature (medium confidence, based on medium agreement, limited evidence). Thefrequency and intensity of extreme weather and climate events are only one factor that affects risks, but few studieshave specifically quantified the effects of changes in population, exposure of people and assets, and vulnerability asdeterminants of loss. However, these studies generally underline the important role of projected changes (increases) inpopulation and capital at risk. Additionally, some researchers argue that poorer developing countries and smallereconomies are more likely to suffer more from future disasters than developed countries, especially in relation toextreme impacts. [4.5.2, 4.5.4.2]
Increases in exposure will result in higher direct economic losses from tropical cyclones. Losses willdepend on future changes in tropical cyclone frequency and intensity (high confidence). Overall losses due toextratropical cyclones will also increase, with possible decreases or no change in some areas (medium confidence).Although future flood losses in many locations will increase in the absence of additional protection measures (highagreement, medium evidence), the size of the estimated change is highly variable, depending on location, climatescenarios used, and methods used to assess impacts on river flow and flood occurrence. [4.5.4.2]
Extreme events will have greater impacts on sectors with closer links to climate, such as water, agricultureand food security, forestry, health, and tourism. For example, while it is not currently possible to reliably projectspecific changes at the catchment scale, there is high confidence that changes in climate have the potential to serious-ly affect water management systems. However, climate change is in many instances only one of the drivers of futurechanges in supply reliability, and is not necessarily the most important driver at the local scale. The impacts of changesin flood characteristics are also highly dependent on how climate changes in the future, and as noted in Section 3.5.2,there is low confidence in projected changes in flood magnitude or frequency. However, based on the availableliterature, there is high confidence that, in some places, climate change has the potential to substantially affect floodlosses. Climate-related extremes are also expected to produce large impacts on infrastructure, although detailed
236
Chapter 4Changes in Impacts of Climate Extremes: Human Systems and Ecosystems
analysis of potential and projected damages are limited to a few countries, infrastructure types, and sectors.[4.3.2, 4.3.5.2]
Estimates of adaptation costs to climate change exhibit a large range and relate to different assessmentperiods. For 2030, the estimated global cost ranges from US$ 48 to 171 billion per year (in 2005 US$) with recentestimates for developing countries broadly amounting to the average of this range with annual costs of up to US$ 100billion. Confidence in individual estimates is low because the estimates are derived from only three relativelyindependent studies. These studies have not explicitly separated costs of adapting to changes in climate extremesfrom other climate change impacts, do not include costs incurred by all sectors, and are based on extrapolations ofbottom-up assessments and on top-down analysis lacking site-specificity. [4.5.3, 4.5.5, 4.5.6]

237
4.1. Introduction
Chapter 3 evaluates observed and projected changes in the frequency,intensity, spatial extent, and duration of extreme weather and climateevents. This physical basis provides a picture of climate change andextreme events. But it does not by itself indicate the impacts experiencedby humans or ecosystems. For example, for some sectors and groups ofpeople, severe impacts may result from relatively minor weather andclimate events. To understand impacts triggered by weather and climateevents, the exposure and vulnerability of humans and ecological systemsneed to be examined. The emphasis of this chapter is on negativeimpacts, in line with this report’s focus on managing the risks of extremeevents and disasters. Weather and climate events, however, can and oftendo have positive impacts for some people and ecosystems.
In this chapter, two different types of impacts on human and ecologicalsystems are examined: (i) impacts of extreme weather and climateevents; and (ii) extreme impacts triggered by less-than-extreme weatheror climate events (in combination with non-climatic factors, such ashigh exposure and/or vulnerability). Where data are available, impactsare examined from sectoral and regional perspectives. Throughout thischapter, the term ‘climate extremes’ will be used to refer in brief to‘extreme weather and extreme climate events,’ as defined in theGlossary and discussed more extensively in Section 3.1.2.
Activities undertaken as disaster risk reduction may also act as adaptationto trends in climate extremes resulting from climate change, and theymay thereby act to reduce impacts. Strategies to reduce risk from onetype of climate extreme may act to increase or decrease the risk fromanother. In writing this chapter, we have not considered these issues assubsequent chapters are dedicated to adaptation. Here, impacts areassessed without discussion of the specific possible adaptation or disasterrisk reduction strategies or policies evaluated in subsequent chapters.
Examination of trends in impacts and disasters highlights the difficultiesin attributing trends in weather- and climate-related disasters to climatechange. Trends in exposure and vulnerability and their relationship withclimate extremes are discussed. The chapter then examines system- andsector-based aspects of vulnerability, exposure, and impacts, bothobserved and projected. The same issues are examined regionally beforethe chapter concludes with a section on the costs of weather- andclimate-related impacts, disasters, and adaptation.
4.2. Climatic Extremes in Naturaland Socioeconomic Systems
4.2.1. How Do Climate Extremes Impacton Humans and Ecosystems?
The impacts of weather and climate extremes are largely determined byexposure and vulnerability. This is occurring in a context where all threecomponents – exposure, vulnerability, and climate – are highly dynamic
and subject to continuous change. Some changes in exposure andvulnerability can be considered as adaptive actions. For example, migrationaway from high-hazard areas (see Chapter 1 and the Glossary for adefinition of the term ‘hazard’) reduces exposure and the chance ofdisaster and is also an adaptation to increasing risk from climateextremes (Adger et al., 2001; Dodman and Satterthwaite, 2008; Revi,2008). Similar adaptive actions are reflected in changes in buildingregulations and livelihoods, among many other examples.
Extreme impacts on humans and ecosystems can be conceptualized as‘disasters’ or ‘emergencies.’ Many contemporary definitions emphasizeeither that a disaster results when the impact is such that local capacityto cope is exceeded or such that it severely disrupts normal activities.There is a significant literature on the definitional issues, which includefactors of scale and irreversibility (Quarantelli, 1998; Handmer andDovers, 2007). Disasters result from impacts that require both exposureto the climate event and a susceptibility to harm by what is exposed.Impacts can include major destruction of assets and disruption toeconomic sectors, loss of human lives, mental health effects, or loss andimpacts on plants, animals, and ecosystem services. The Glossary providesthe definition of disaster used in this chapter.
Exposure can be conceptualized as the presence of human and ecosystemtangible and intangible assets and activities (including services) in areasaffected by climate extremes (see Sections 1.1.2 and 2.2 and theGlossary for definitional discussion). Without exposure there is noimpact. Temporal and spatial scales are also important. Exposure can bemore or less permanent; for example, exposure can be increased bypeople visiting an area or decreased by evacuation of people andlivestock after a warning. As human activity and settlements expandinto an exposed area, more people will be subject to and affected bylocal climatic hazards. Population growth is predominantly in developingcountries (Peduzzi et al., 2011; UNISDR, 2011). Newly occupied areasaround or in urban areas were previously left vacant because they areprone to the occurrence of climatic hazards (Handmer and Dovers,2007; Satterthwaite et al., 2007; Wilbanks et al., 2007), for example withmovement of squatters to and development of informal settlements inareas prone to flooding (Huq et al., 2007) and landslides (Anderson etal., 2007). ‘Informal settlements’ are characterized by an absence ofinvolvement by government in planning, building, or infrastructure andlack of secure tenure. In addition, there are affluent individuals pursuingenvironmental amenity through coastal canal estates, riverside, andbush locations, which are often at greater risk from floods and fires(Handmer and Dovers, 2007).
Exposure is a necessary but not sufficient condition for impacts. Forexposed areas to be subjected to significant impacts from a weather orclimate event there must be vulnerability. Vulnerability is composed of(i) susceptibility of what is exposed to harm (loss or damage) from theevent, and (ii) its capacity to recover (Cutter and Emrich, 2006; seeSections 1.1.2 and 2.2 and the Glossary). Vulnerability is defined here asin the Glossary as the propensity or predisposition to be adverselyaffected. For example, those whose livelihoods are weather-dependent
Chapter 4 Changes in Impacts of Climate Extremes: Human Systems and Ecosystems

238
or whose housing offers limited protection from weather events will beparticularly susceptible to harm (Dodman and Satterthwaite, 2008).Others with limited capacity to recover include those with limitedpersonal resources for recovery or with no access to external resourcessuch as insurance or aid after an event, and those with limited personalsupport networks (Handmer and Dovers, 2007). Knowledge, health, andaccess to services of all kinds including emergency services and politicalsupport help reduce both key aspects of vulnerability.
The concept of ‘resilience’ (developed in an ecological context by Holling,1978; in a broad social sustainability context by Handmer and Dovers,2007; and by Adger, 2000; Folke et al., 2002; see also the Glossary)emphasizes the positive components of resistance or adaptability in theface of an event and ability to cope and recover. This concept of‘resilience’ is often seen as a positive way of expressing a similarconcept to that contained in the term ‘vulnerability’ (Handmer, 2003).
Refugees, internally displaced people, and those driven into marginalareas as a result of violence can be dramatic examples of peoplevulnerable to the negative effects of weather and climate events, cut offfrom coping mechanisms and support networks (Handmer and Dovers,2007). Reasons for the increase in vulnerability associated with warfareinclude destruction or abandonment of infrastructure (e.g., transport,communications, health, and education) and shelter, redirection ofresources from social to military purposes, collapse of trade andcommerce, abandonment of subsistence farmlands, lawlessness, anddisruption of social networks (Levy and Sidel, 2000; Collier et al., 2003).The proliferation of weapons and minefields, the absence of basichealth and education, and collapse of livelihoods can ensure that theeffects of war on vulnerability to disasters are long lasting, althoughsome also benefit (Korf, 2004). These areas are also characterized by anexodus of trained people and an absence of inward investment.
Many ecosystems are dependent on climate extremes for reproduction(e.g., through fire and floods), disease control, and in many casesgeneral ecosystem health (e.g., fires or windstorms allowing newgrowth to replace old). How such extreme events interact with othertrends and circumstances can be critical to the outcome. For example,floods that would normally be essential to river gum reproduction maycarry disease and water weeds (Rogers and Ralph, 2010).
Climate extremes can cause substantial mortality of individual speciesand contribute to determining which species exist in ecosystems(Parmesan et al., 2000). For example, drought plays an important role inforest dynamics, as a major influence on the mortality of trees (Villalbaand Veblen, 1997; Breshears and Allen, 2002; Breshears et al., 2005).
4.2.2. Complex Interactions among Climate Events,Exposure, and Vulnerability
There exist complex interactions between different climatic and non-climatic hazards, exposure, and vulnerability that have the potential of
triggering complex, scale-dependent impacts. Anthropogenic changes inatmospheric systems are influencing changes in many climatic variablesand the corresponding physical impacts (see Chapter 3). However, theimpacts that climatic extremes have on humans and ecosystems(including those altered by humans) depend also on several other non-climatic factors (Adger, 2006). This section will explore these factors,drawing on examples of flooding and drought.
Changes in socioeconomic status are a key component of exposure; inparticular, population growth is a major driver behind changing exposureand vulnerability (Downton et al., 2005; Barredo, 2009). In manyregions, people have been encroaching into flood-prone areas whereeffective flood protection is not assured, due to human pressure and lackof more suitable and available land (McGranahan et al., 2007; Douglaset al., 2008). Urbanization, often driven by rural poverty, drives suchmigration (Douglas et al., 2008). In these areas, both population andwealth are accumulating, thereby increasing the flood damage potential.In many developed countries, population and wealth accumulation alsooccur in hazard-prone areas for reasons of lifestyle and/or lower cost(e.g., Radeloff et al., 2005). Here, a tension between climate changeadaptation and development is seen; living in these areas withoutappropriate adaptation may be maladaptive from a climate changeperspective, but this may be a risk people are willing to take, or a riskover which they have limited choice, considering their economiccircumstances (Wisner et al., 2004). Furthermore, there is often adeficient risk perception present, stemming from an unjustified faith inthe level of safety provided by flood protection systems and dikes inparticular (Grothmann and Patt, 2005) (e.g., 2005 Hurricane Katrina inNew Orleans).
Economic development and land use change can also lead to changesin natural systems. Land cover changes induce changes in rainfall-runoffpatterns, which can impact on flood intensity and frequency (e.g.,Kundzewicz and Schellnhuber, 2004). Deforestation, urbanization,reduction of wetlands, and river regulation (e.g., channel straightening,shortening, and embankments) change the percentage of precipitationbecoming runoff by reducing the available water storage capacity (Few,2003; Douglas et al., 2008). The proportion of impervious areas (e.g.,roofs, yards, roads, pavements, parking lots, etc.) and the value of therunoff coefficient are increased. As a result, water runs off faster torivers or the sea, and the flow hydrograph has a higher peak and ashorter time-to-peak (Cheng and Wang, 2002; Few, 2003; Douglas et al.,2008), reducing the time available for warnings and emergency action.In mountainous areas, developments extending into hilly slopes arepotentially endangered by landslides and debris flows triggered byintense rains. These changes have resulted in rain that is less extremeleading to serious impacts (Crozier, 2010).
Similarly, the socioeconomic impacts of droughts may arise from theinteraction between natural conditions and human water use, whichcan be conceptualized as a combination of supply and demand factors.Human activities (such as over-cultivation, overgrazing, deforestation)have exacerbated desertification of vulnerable areas in Africa and Asia,
Chapter 4Changes in Impacts of Climate Extremes: Human Systems and Ecosystems

239
where soil and bio-productive resources became permanently degraded(Dregne, 1986). An extreme example of a human-made, pronouncedhydrological drought comes from the Aral Sea basin in Central Asia. Dueto excessive and non-sustainable water withdrawals from thetributaries (Syr Darya and Amu Darya), their inflow into the Aral Sea hasshrunk in volume by some 75% (Micklin, 2007; Rodell et al., 2009)resulting in severe economic and ecological impacts.
The changing impacts of climate extremes on sectors, such as water andfood, depend not only on changes in the characteristics of climate-related variables relevant to a given sector, but also on sector-relevantnon-climatic stressors, management characteristics (includingorganizational and institutional aspects), and adaptive capacity(Kundzewicz, 2003).
There also may be increasing risks from possible interactions of hazards(Cruz, 2005; see Sections 3.1.3 and 3.1.4 for discussion of interactionsand feedbacks). One hazard may influence other hazards or exacerbatetheir effects, also with dependence on scale (Buzna et al., 2006). Forinstance, temperature rise can lead to permafrost thaw, reduced slopestability, and damage to buildings. Another example is that intenseprecipitation can lead to flash flood, landslides, and infrastructure damage,for example, collapse of bridges, roads, and buildings, and interruptionof power and water supplies. In the Philippines, two typhoons hittingthe south of Luzon Island in 2004 caused a significant flood disaster aswell as landslides on the island, leading to 900 fatalities (Pulhin et al.,2010). It is worthwhile to note that cascading system failures (e.g.,
among infrastructure) can happen rapidly and over large areas due totheir interdependent nature.
4.3. System- and Sector-Based Aspectsof Vulnerability, Exposure, and Impacts
4.3.1. Introduction
In this subsection, studies evaluating impacts and risks of extremeevents are surveyed for major affected sectors and systems. Sectors andsystems considered here include water; ecosystems; food systems andfood security; human settlements, infrastructure, and tourism; andhuman health, well-being, and security. Impacts of climate extremes aredetermined by the climate extremes themselves as well as by exposureand vulnerability. Climate extremes, exposure, and vulnerability arecharacterized by uncertainty and continuous change, and shifts in anyof these components of risk will have implications for the impacts ofextreme events. Generally, there is limited literature on the potentialfuture impacts of extreme events; most literature analyzes currentimpacts of extreme events. This focus may result in part from incompleteknowledge and uncertainties regarding future changes in some extremeevents (see, for example, Section 3.2.3 and Tables 3-1 and 3-3) as wellas from uncertainties regarding future exposure and vulnerabilities.Nonetheless, understanding current impacts can be important fordecisionmakers preparing for future risks. Analyses of both observedand projected impacts due to extreme climate and weather events are
Chapter 4 Changes in Impacts of Climate Extremes: Human Systems and Ecosystems
Box 4-1 | Evolution of Climate, Exposure, and Vulnerability – The Melbourne Fires, 7 February 2009
The fires in the Australian state of Victoria, on 7 February 2009, demonstrate the evolution of risk through the relationships between theweather- and climate-related phenomena of a decade-long drought, record extreme heat, and record low humidity of 5% (Karoly, 2010;Trewin and Vermont, 2010) interacting with rapidly increasing exposure. Together the climate phenomena created the conditions formajor uncontrollable wildfires (Victorian Bushfires Royal Commission, 2010).
The long antecedent drought, record heat, and a 35-day period with no rain immediately before the fires turned areas normally seen aslow to medium wildfire risk into very dry high-risk locations. A rapidly expanding urban-bush interface and valuable infrastructure (Berry,2003; Burnley and Murphy, 2004; Costello, 2007, 2009) provided the values exposed and the potential for extreme impacts that wasrealized with the loss of 173 lives and considerable tangible and intangible damage. There was a mixture of natural and human sourcesof ignition, showing that human agency can trigger such fires and extreme impacts.
Many people were not well-prepared physically or psychologically for the fires, and this influenced the level of loss and damage theyincurred. Levels of physical and mental health also affected people’s vulnerability. Many individuals with ongoing medical conditions,special needs because of their age, or other impairments struggled to cope with the extreme heat and were reliant on others to respondsafely (Handmer et al., 2010). However, capacity to recover in a general sense was high for humans and human activities throughinsurance, government support, private donations, and nongovernmental organizations (NGOs) and was variable for the affected bushwith some species and ecosystems benefitting (Lindenmayer et al., 2010; Banks et al., 2011; see also Case Study 9.2.2).
Chapter 3 details projected changes in climate extremes for this region that could increase fire risk, in particular warm temperatureextremes, heat waves, and dryness (see Table 3-3 for summary).

240
Chapter 4Changes in Impacts of Climate Extremes: Human Systems and Ecosystems
Box 4-2 | Observed and Projected Trends in Human Exposure: Tropical Cyclones and Floods
The International loss databases with global coverage such as EM-DAT, NatCat, and Sigma (maintained by the Centre for theEpidemiology of Disasters, Munich Re, and Swiss Re, respectively) present an increase in reported disasters through time. Although thenumber of reported tropical cyclone disasters, for example, has increased from a yearly average of 21.7 during the 1970s to 63 duringthe 2000s (see Table 4-1), one should not simply conclude that the number of disasters is increasing due to climate change. There arefour factors that may individually or together explain this increase: improved access to information, higher population exposure, highervulnerability, and higher frequency and/or intensity of hazards (Dao and Peduzzi, 2004; Peduzzi et al., 2009). Due to uncertainties in thesignificance of the role of each of these four possible factors (especially regarding improved access to information), a vulnerability andrisk trend analysis cannot be performed based on reported losses (e.g., from EM-DAT or Munich Re). To better understand this trend,international loss databases would have to be standardized.
Here for both tropical cyclones and floods, we overview a method for better understanding these factors through calculation of pasttrends and future projections of human exposure at regional and global scales. Changes in population size strongly influence changes in
exposure to hazards. It is estimated that currently about 1.15billion people live in tropical cyclone-prone areas. The physicalexposure (yearly average number of people exposed) to tropicalcyclones is estimated to have increased from approximately73 million in 1970 to approximately 123 million in 2010(Figure 4-1; Peduzzi et al., 2011). The number of times thatcountries are hit by tropical cyclones per year is relativelysteady (between 140 and 155 countries per year1 on average;see Table 4-1 (UNISDR, 2011).
In most oceans, the frequency of tropical cyclones is likely todecrease or remain unchanged while mean tropical cyclone
Number of tropical cyclones as identified in best track data (average per year)
Number of countries hit by tropical cyclones as detected by satellite (average per year)
Number of disasters triggered by tropical cyclones as reported by EM-DAT (average per year)
Reported disasters as a percentage of number of countries hit by tropical cyclones
88.4 88.2 87.2 86.5
142.1 144.0 155.0 146.3
21.7 37.5 50.6 63.0
15% 26% 33% 43%
1970 - 79 1980 - 89 1990 - 99 2000 - 09
Table 4-1 | Trend in tropical cyclone disasters reported versus tropical cyclones detectedby satellite during the last four decades. The reported disasters as a percentage of thenumber of countries hit by tropical cyclones increased three-fold. Note that ‘best trackdata’ generally comprise four-times daily estimates of tropical cyclone intensity andposition; these data are based on post-season reprocessing of data that were collectedoperationally during each storm’s lifetime. Source: UNISDR, 2011.
Figure 4-1 | Average physical exposure to tropical cyclones assuming constant hazard (in thousands of people per year). Data from Peduzzi et al., 2011.
in 2030
in 1970
Circles are proportional to the number of persons affected
4,870
30100
50100
ISLANDSIndian Ocean, Pacific Ocean, Caribbean and other Islands
4,
1
ISLANDS
68,000
125,950
NORTHAMERICA
CENTRAL ANDSOUTH AMERICA
AFRICA ASIA
AUSTRALIANEW ZEALAND
2,610
500
2,280
1,9103,490
Average Physical Exposure to Tropical Cyclones Assuming Constant Hazard in thousands of people per year
____________
1 This is the number of intersections between countries and tropical cyclones.One cyclone can affect several countries, but also many tropical cyclonesoccur only over the oceans.
Continued next page

241
thus assessed. Sections 4.3.2 to 4.3.6, building on an understanding ofexposure and vulnerability, evaluate knowledge of current and futurerisks of extreme events by sectors and systems.
4.3.2. Water
Past and future changes in exposure and vulnerability to climateextremes in the water sector are driven by both changes in the volume,timing, and quality of available water and changes in the property, lives,and systems that use the water resource or that are exposed to water-related hazards (Aggarwal and Singh, 2010). With a constant resourceor physical hazard, there are two opposing drivers of change in exposure
and vulnerability. On the one hand, vulnerability increases as moredemands are placed on the resource (due to increased water consumption,for example, or increased discharge of polluting effluent) or exposureincreases as more property, assets, and lives encounter flooding. On theother hand, vulnerability is reduced as measures are implemented toimprove the management of resources and hazards and to enhance theability to recover from extreme events. For example, enhancing watersupplies, improving effluent treatment, and employing flood managementmeasures (including the provision of insurance or disaster relief) wouldall lead to reductions in vulnerability in the water sector. Such measureshave been widely implemented, and the runoff regime of many rivershas been considerably altered (Vörösmarty, 2002). The change in exposureand vulnerability in any place is a function of the relationship between
Chapter 4 Changes in Impacts of Climate Extremes: Human Systems and Ecosystems
maximum wind speed is likely to increase (see Section 3.4.4). Figure 4-1 provides the modeled change in human exposure at constanthazard (without forecast of the influence of climate change on the hazard). It shows that the average number of people exposed totropical cyclones per year globally would increase by 11.6% from 2010 to 2030 from population growth only. In relative terms, Africahas the largest percentage increase in physical exposure to tropical cyclones. In absolute terms, Asia has more than 90% of the globalpopulation exposed to tropical cyclones.
In terms of exposure to flooding, about 800 million people are currently living in flood-prone areas, and about 70 million people currentlyliving in flood-prone areas are, on average, exposed to floods each year (UNISDR, 2011). Given the lack of complete datasets on pastflood events, and the uncertainty associated with projected trends in future flood frequencies and magnitudes (see Section 3.5.2), it isdifficult to estimate future flood hazards. However, using population increase in the flood-prone area, it is possible to look at trends inthe number of people exposed per year on average at constant hazard (UNISDR, 2011). Figure 4-2 shows that population growth willcontinue to increase exposure to floods. Due to model constraints, areas north of 60°N and south of 60°S, as well as catchments smallerthan 1,000 km2 (typically small islands) are not modeled. The data provided in Figure 4-2 correspond to river flooding.
A number of factors underlie increases in impacts from floods and cyclones. However, trends in the population exposed to these hazardsare an important factor. Population projections in tropical cyclone areas and flood-prone areas imply that impacts will almost certainlycontinue to increase based on this factor alone.
29,780
77,640
NORTHAMERICA
CENTRAL ANDSOUTH AMERICA
AFRICAASIA
AUSTRALIANEW ZEALAND
640
850
3,640Average Physical Exposure to Floods Assuming Constant Hazard in thousands of people per year
CARIBBEAN*
EUROPE
in thousandds of
in 2030
in 1970
Circles are proportional to the number of persons affected
1,190
550
1,320
3060
*Only catchments bigger than 1,000 km2 were included in this analysis. Therefore, only the largest islands in the Caribbean are covered.
70180
1,6501,870
Figure 4-2 | Average physical exposure to floods assuming constant hazard (in thousands of people per year). Data from Peduzzi et al., 2011.

242
these two opposing drivers, which also interact. Flood or watermanagement measures may reduce vulnerability in the short term, butincreased security may generate more development and ultimately leadto increased exposure and vulnerability.
Extreme events considered in this section can threaten the ability of thewater supply ‘system’ (from highly managed systems with multiplesources to a single rural well) to supply water to users. This may bebecause a surplus of water affects the operation of systems, but moretypically results from a shortage of water relative to demands – adrought. Water supply shortages may be triggered by a shortage of riverflows and groundwater, deterioration in water quality, an increase indemand, or an increase in vulnerability to water shortage. There ismedium confidence that since the 1950s some regions of the worldhave experienced more intense and longer droughts, in particular insouthern Europe and West Africa (see Section 3.5.1), but it is not possibleto attribute trends in the human impact of drought directly or just tothese climatic trends because of the simultaneous change in the otherdrivers of drought impact.
There is medium confidence that the projected duration and intensity ofhydrological drought will increase in some regions with climate change(Section 3.5.1), but other factors leading to a reduction in river flows orgroundwater recharge are changes in agricultural land cover andupstream interventions. A deterioration in water quality may be drivenby climate change (as shown for example by Delpla et al., 2009;Whitehead et al., 2009; Park et al., 2010), change in land cover, orupstream human interventions. An increase in demand may be driven bydemographic, economic, technological, or cultural drivers as well as byclimate change (see Section 2.5). An increase in vulnerability to watershortage may be caused, for example, by increasing reliance on specificsources or volumes of supply, or changes in the availability of alternatives.Indicators of hydrological and water resources drought impact includelost production (of irrigated crops, industrial products, and energy), thecost of alternative or replacement water sources, and altered humanwell-being, alongside consequences for freshwater ecosystems (impactsof meteorological and agricultural droughts on production of rain-fedcrops are summarized in Section 4.3.4).
Few studies have so far been published on the effect of climate changeon the impacts of drought in water resources terms at the local catchmentscale. Virtually all of these have looked at water system supply reliabilityduring a drought, or the change in the yield expected with a givenreliability, rather than indicators such as lost production, cost, or well-being. Changes in the reliability of a given yield, or yield with a givenreliability, of course vary with local hydrological and water managementcircumstances, the details of the climate scenarios used, and otherdrivers of drought risk. Some studies show large potential reductions insupply reliability due to climate change that challenge existing watermanagement systems (e.g., Fowler et al., 2003; Kim et al., 2009; Takaraet al., 2009; Vanham et al., 2009); some show relatively small reductionsthat can be managed – albeit at increased cost – by existing systems(e.g., Fowler et al., 2007), and some show that under some scenarios the
reliability of supply increases (e.g., Kim and Kaluarachchi, 2009; Li et al.,2010). While it is not currently possible to reliably project specificchanges at the catchment scale, there is high confidence that changesin climate have the potential to seriously affect water managementsystems. However, climate change is in many instances only one of thedrivers of future changes in supply reliability, and is not necessarily themost important driver at the local scale. MacDonald et al. (2009), forexample, demonstrate that the future reliability of small-scale rural watersources in Africa is largely determined by local demands, biologicalaspects of water quality, or access constraints, rather than changes inregional recharge, because domestic supply requires only 3-10 mm ofrecharge per year. However, they noted that up to 90 million people inlow rainfall areas (200-500 mm) would be at risk if rainfall reduces tothe point at which groundwater resources become nonrenewable.
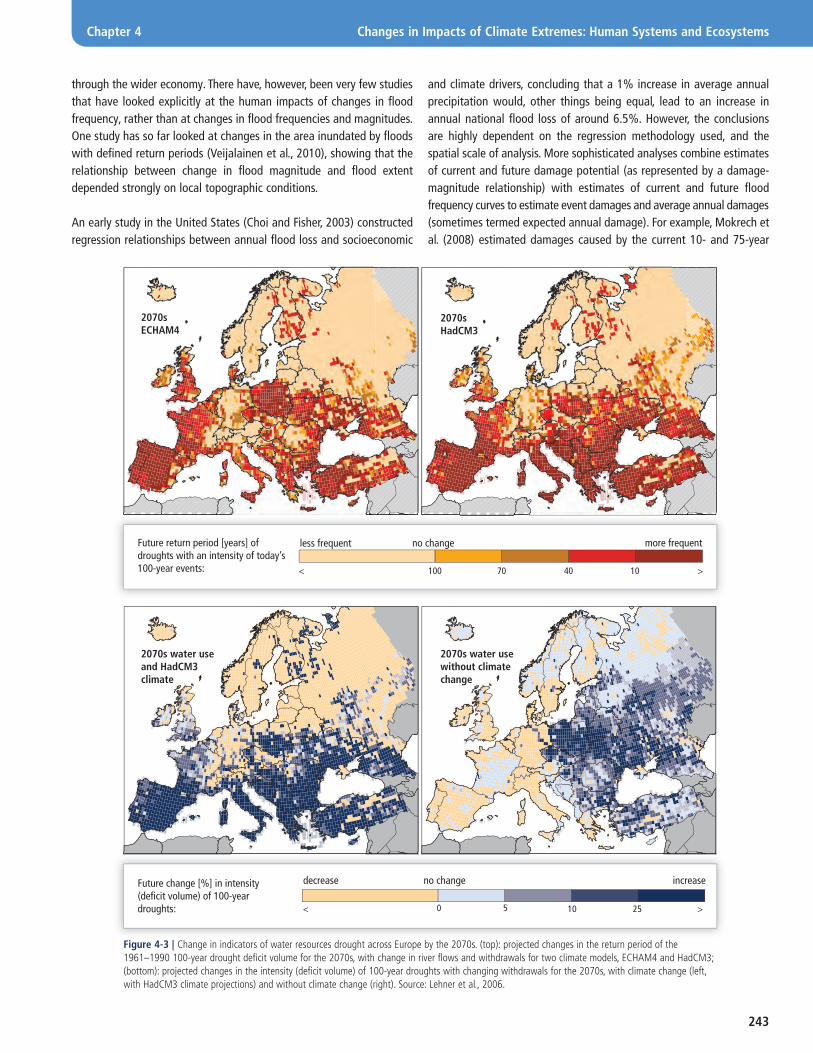
There have been several continental- or global-scale assessments ofpotential change in hydrometeorological drought indicators (seeSection 3.5.1), but relatively few on measures of water resourcesdrought or drought impacts. This is because these impacts are verydependent on context. One published large-scale assessment (Lehner etal., 2006) used a generalized drought deficit volume indicator, calculatedby comparing simulated river flows with estimated withdrawals formunicipal, industrial, and agricultural uses. The indicator was calculatedacross Europe, using climate change projections from two climatemodels and assuming changes in withdrawals over time. They showedsubstantial changes in the return period of the drought deficit volume,comparing the 100-year return period for the 1961-1990 period withprojections for the 2070s (Figure 4-3). Across large parts of Europe, the1961-1990 100-year drought deficit volume is projected to have areturn period of less than 10 years by the 2070s. Lehner et al. (2006)also demonstrated that this projected pattern of change was generallydriven by changes in climate, rather than the projected changes inwithdrawals of water (Figure 4-3). In southern and western Europe,changing withdrawals alone only are projected to increase deficitvolumes by less than 5%, whereas the combined effect of changingwithdrawals and climate change is projected to increase deficit volumesby at least 10%, and frequently by more than 25%. In eastern Europe,increasing withdrawals are projected to increase drought deficitvolumes by over 5%, and more than 10% across large areas, but this isoffset under both climate scenarios by increasing runoff.
Climate change has the potential to change river flood characteristicsthrough changing the volume and timing of precipitation, by altering theproportions of precipitation falling as snow and rain, and to a lesserextent, by changing evaporation and hence accumulated soil moisturedeficits. However, there is considerable uncertainty in the magnitude,frequency, and direction of change in flood characteristics (Section3.5.2). Changes in catchment surface characteristics (such as landcover), floodplain storage, and the river network can also lead tochanges in the physical characteristics of river floods (e.g., along theRhine: Bronstert et al., 2007). The impacts of extreme flood eventsinclude direct effects on livelihoods, property, health, production, andcommunication, together with indirect effects of these consequences
Chapter 4Changes in Impacts of Climate Extremes: Human Systems and Ecosystems
243
through the wider economy. There have, however, been very few studiesthat have looked explicitly at the human impacts of changes in floodfrequency, rather than at changes in flood frequencies and magnitudes.One study has so far looked at changes in the area inundated by floodswith defined return periods (Veijalainen et al., 2010), showing that therelationship between change in flood magnitude and flood extentdepended strongly on local topographic conditions.
An early study in the United States (Choi and Fisher, 2003) constructedregression relationships between annual flood loss and socioeconomic
and climate drivers, concluding that a 1% increase in average annualprecipitation would, other things being equal, lead to an increase inannual national flood loss of around 6.5%. However, the conclusionsare highly dependent on the regression methodology used, and thespatial scale of analysis. More sophisticated analyses combine estimatesof current and future damage potential (as represented by a damage-magnitude relationship) with estimates of current and future floodfrequency curves to estimate event damages and average annual damages(sometimes termed expected annual damage). For example, Mokrech etal. (2008) estimated damages caused by the current 10- and 75-year
Chapter 4 Changes in Impacts of Climate Extremes: Human Systems and Ecosystems
2070sECHAM4
2070s water useand HadCM3 climate
2070s water usewithout climate change
2070sHadCM3
Future return period [years] of droughts with an intensity of today’s 100-year events:
Future change [%] in intensity (deficit volume) of 100-year droughts:
more frequentno change
no change
less frequent
decrease increase
100< 70 40 10 >
0 5 10 25 ><
Figure 4-3 | Change in indicators of water resources drought across Europe by the 2070s. (top): projected changes in the return period of the1961–1990 100-year drought deficit volume for the 2070s, with change in river flows and withdrawals for two climate models, ECHAM4 and HadCM3;(bottom): projected changes in the intensity (deficit volume) of 100-year droughts with changing withdrawals for the 2070s, with climate change (left,with HadCM3 climate projections) and without climate change (right). Source: Lehner et al., 2006.

244
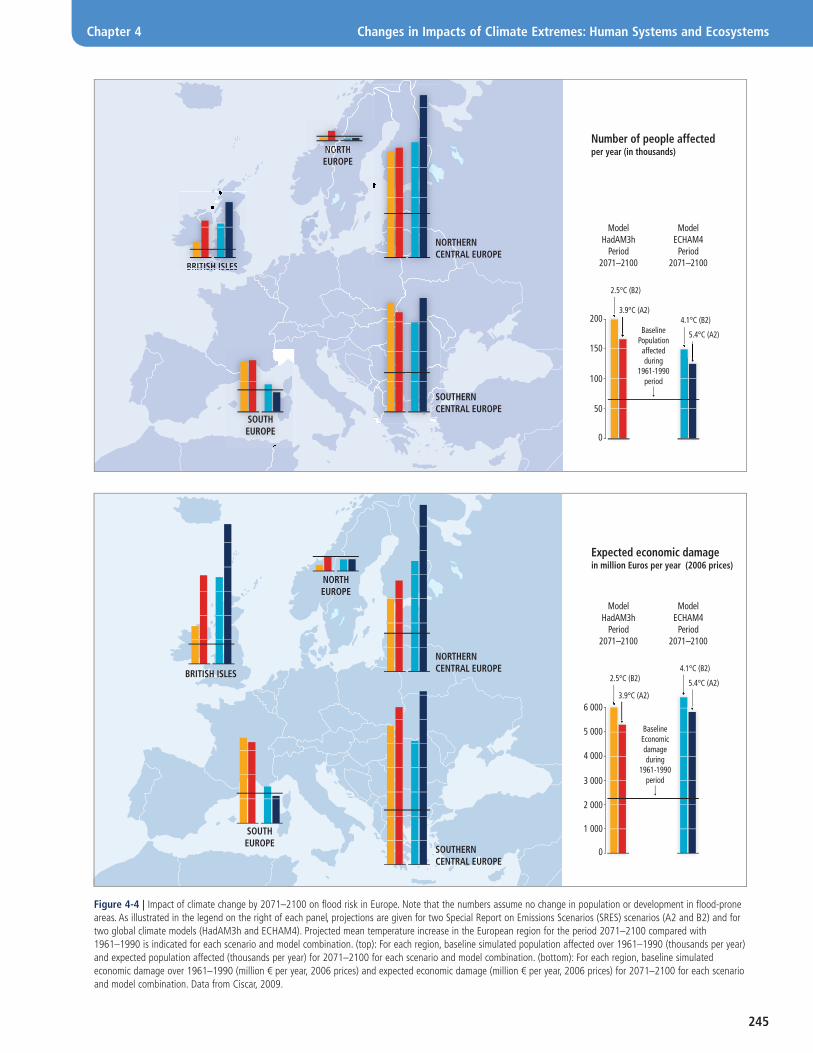
events in two regions of England, combining fluvial and coastal flooding.The two main conclusions from their work were as follows. First, thepercentage change in cost was greater for the rarer event than the morefrequent event. Second, the absolute value of impacts, and therefore thepercentage change from current impacts, was found to be highlydependent on the assumed socioeconomic change. In one region, eventdamage varied, in monetary terms, between four and five times acrosssocioeconomic scenarios. An even wider range in estimated averageannual damage was found in the UK Foresight Future Flooding andCoastal Defence project (Evans et al., 2004; Hall et al., 2005), whichcalculated average annual damage in 2080 of £1.5 billion, £5 billion, and£21 billion under similar climate scenarios but different socioeconomicfutures (current average annual damage was estimated at £1 billion).The Foresight project represented the effect of climate change on floodfrequency by altering the shape of the flood frequency curve usingprecipitation outputs from climate models and rainfall-runoff models fora sample of UK catchments. The EU-funded Projection of Economicimpacts of climate change in Sectors of the European Union based onboTtom-up Analysis (PESETA) project (Ciscar, 2009; Feyen et al., 2009)used a hydrological model to simulate river flows, flooded areas, and floodfrequency curves from climate scenarios derived from regional climatemodels, but – in contrast to the UK Foresight project – assumed nochange in economic development in flood-prone areas. Figure 4-4summarizes estimated changes in the average annual number of peopleflooded and average annual damage, by European region (Ciscar, 2009).There are strong regional variations in impact, with particularly largeprojected increases in both number of people flooded and economicdamage (over 200%) in central and Eastern Europe, while in parts ofNorth Eastern Europe, average annual flood damages decrease.
At the global scale, two studies have estimated the numbers of peopleaffected by increases (or decreases) in flood hazard. Kleinen and Petschel-Held (2007) calculated the percentage of population living in river basinswhere the return period of the current 50-year event becomes shorter,for three climate models and a range of increases in global meantemperature. With an increase in global mean temperature of 2°C (abovelate 20th-century temperatures), between (approximately) 5 and 27%of the world’s population would live in river basins where the current50-year return period flood occurs at least twice as frequently. Hirabayashiand Kanae (2009) used a different metric, counting each year the numberof people living in grid cells where the flood peak exceeded the (current)100-year magnitude, using runoff as simulated by a high-resolutionclimate model fed through a river routing model. Beyond 2060, theyfound that at least 300 million people could be affected by substantialflooding even in years with relatively low flooding, with of the order oftwice as many being flooded in flood-rich years (note that they usedonly one climate scenario with one climate model). This compares witha current range (using the same index) of between 20 and 300 millionpeople. The largest part of the projected increase is due to increases inthe occurrence of floods, rather than increases in population.
The impacts of changes in flood characteristics are highly dependent onhow climate changes in the future, and as noted in Section 3.5.2, there
is low confidence in projections of changes in flood magnitude orfrequency. However, based on the available literature, there is highconfidence that, in some places, climate change has the potential tosubstantially affect flood losses.
4.3.3. Ecosystems
Available information shows that high temperature extremes (i.e., heatwave), drought, and floods substantially affect ecosystems. Increasinggaps and overall contraction of the distribution range for specieshabitat could result from increases in the frequency of large-scaledisturbances due to extreme weather and climate events (Opdam andWascher, 2004). Fischlin et al. (2007), from assessment of 19 studies,found that 20 to 30% of studied plant and animal species may be at anincreased risk of extinction if warming exceeds 2 to 3°C above thepreindustrial level. Changes due to climate extremes could also entailshifts of ecosystems to less-desired states (Scheffer et al., 2001; Chapinet al., 2004; Folke et al., 2004) through, for example, the exceedance ofcritical temperature thresholds, with potential loss of ecosystem servicesdependent on the previous state (Reid et al., 2005; see also Fischlin etal., 2007).
4.3.3.1. Heat Waves
Heat waves can directly impact ecosystems by, for example, constrainingcarbon and nitrogen cycling and reducing water availability, with theresult of potentially decreasing production or even causing speciesmortality.
Warming can decrease net ecosystem carbon dioxide (CO2) exchangeby inducing drought that suppresses net primary productivity. Morefrequent warm years may lead to a sustained decrease in CO2 uptake byterrestrial ecosystems (Arnone et al., 2008). Extreme temperatureconditions can shift forest ecosystems from being a net carbon sink tobeing a net carbon source. For example, tall-grass prairie net ecosystemCO2 exchange levels decreased in both an extreme warming year(2003) and the following year in grassland monoliths from centralOklahoma, United States (Arnone et al., 2008). A 30% reduction in grossprimary productivity together with decreased ecosystem respirationover Europe during the heat wave in 2003 resulted in a strong netsource of CO2 (0.5 Pg C yr-1) to the atmosphere and reversed the effectof four years of net ecosystem carbon sequestration. Such a reductionin Europe’s primary productivity is unprecedented during the last century(Ciais et al., 2005).
Impacts are determined not only by the magnitude of warming but alsoby organisms’ physiological sensitivity to that warming and by theirability to compensate behaviorally and physiologically. For example,warming may affect tropical forest lizards’ physiological performance insummer, as well as their ability to compete with warm-adapted, open-habitat competitors (Huey et al., 2009). Projected increases in maximum
Chapter 4Changes in Impacts of Climate Extremes: Human Systems and Ecosystems
245
Chapter 4 Changes in Impacts of Climate Extremes: Human Systems and Ecosystems
Figure 4-4 | Impact of climate change by 2071–2100 on flood risk in Europe. Note that the numbers assume no change in population or development in flood-proneareas. As illustrated in the legend on the right of each panel, projections are given for two Special Report on Emissions Scenarios (SRES) scenarios (A2 and B2) and fortwo global climate models (HadAM3h and ECHAM4). Projected mean temperature increase in the European region for the period 2071–2100 compared with1961–1990 is indicated for each scenario and model combination. (top): For each region, baseline simulated population affected over 1961–1990 (thousands per year)and expected population affected (thousands per year) for 2071–2100 for each scenario and model combination. (bottom): For each region, baseline simulatedeconomic damage over 1961–1990 (million € per year, 2006 prices) and expected economic damage (million € per year, 2006 prices) for 2071–2100 for each scenarioand model combination. Data from Ciscar, 2009.
BRITISH ISLES
NORTHEUROPENOORTHO
BRITISITISH ISLES
SOUTHEUROPE
Number of people affected per year (in thousands)
BaselinePopulationaffectedduring
1961-1990period
0
50
100
150
200
2.5°C (B2)
3.9°C (A2)4.1°C (B2)
5.4°C (A2)
ModelHadAM3hPeriod
2071—2100
ModelECHAM4Period
2071—2100
BRITISH ISLES
NORTHEUROPE
NORTHERNCENTRAL EUROPE
NORTHERNCENTRAL EUROPE
SOUTHERNCENTRAL EUROPE
SOUTHERNCENTRAL EUROPE
SOUTHEUROPE
Expected economic damage in million Euros per year (2006 prices)
ModelHadAM3hPeriod
2071—2100
ModelECHAM4Period
2071—2100
BaselineEconomicdamageduring
1961-1990period
2.5°C (B2)
3.9°C (A2)
4.1°C (B2)
5.4°C (A2)
0
1 000
2 000
3 000
4 000
5 000
6 000
246
air temperatures may increase evaporative water requirements in birds,thus influencing survival during extreme heat events (McKechnie andWolf, 2010). Heat waves could also cause increased likelihood ofcatastrophic avian mortality events (McKechnie and Wolf, 2010).
4.3.3.2. Drought
A rapid, drought-induced die-off of overstory woody plants at asubcontinental scale was triggered by the 2000–2003 drought insouthwestern North America. Following 15 months of diminished soilwater content, more than 90% of the dominant tree species, Pinus edulis,died. Limited observations indicate that die-off was more extensive thanduring the previous drought of the 1950s, also affecting wetter siteswithin the tree species’ distribution (Breshears et al., 2005). Regional-scale piñon pine mortality was observed following an extended drought(2000–2004) in northern New Mexico (Rich et al., 2008). Dominantplant species from diverse habitat types (i.e., riparian, chaparral, andlow-to high-elevation forests) exhibited significant mortality during adrought in the southwestern United States; average mortality amongdominant species was 3.3 to 41.4% (Gitlin et al., 2006).
Evergreen coniferous species mortality caused by the coupling of droughtand higher temperatures from winter to spring has been observed in theRepublic of Korea (Lim et al., 2010). In 1998, 2002, 2007, and 2009, yearsof high winter-spring temperatures and lower precipitation, P. densifloraand P. koraiensis were affected by droughts, with many dying in thecrown layer, while deciduous species survived. Similarly, Abies koreana,an endemic species in Korea, at high elevation has declined following arise in winter temperatures since the late 1990s (Lim et al., 2010). Beechcrown condition was observed to decline following severe drought in1976 (Power, 1994), 1989 (Innes, 1992), and 1990 (Stribley andAshmore, 2002). Similarly, the percentage of moderately or severelydamaged trees displayed an upward trend after the 1989 drought inCentral Italy, especially for P. pinea and Fagus sylvatica (Bussotti et al.,1995). As final examples, defoliation and mortality in Scots pine observedin each year during 1996 to 2002 was related to the precipitation deficitand hot conditions of the previous year in the largest inner-alpinevalley of Switzerland (Valais) (Rebetez and Dobbertin, 2004), and bothgross primary production and total ecosystem respiration decreased in2003 in many regions of Europe (Granier et al., 2007).
In a shallow temperate southern European estuary, the Mondego Estuaryin Portugal, the severe drought in 2004–2005 was responsible forspatial shifts in the estuary’s zooplankton community, with an increasein abundance and diversity during the period of low freshwater flow(Marques et al., 2007).
4.3.3.3. Floods
Floods also impact ecosystems. Floods can cause population- andcommunity-level changes superimposed on a background of more
gradual trends (Thibault and Brown, 2008). As an example, an extremeflood event affected a desert rodent community (that had beenmonitored for 30 years) by inducing a large mortality rate, eliminatingthe advantage of previously dominant species, resetting long-termpopulation and community trends, altering competitive and meta-population dynamics, and reorganizing the community (Thibault andBrown, 2008).
4.3.3.4. Other Events
Other events, such as hurricanes and storms, can also impact ecosystems.Hurricanes can cause widespread mortality of wild birds, and theiraftermath may cause declines due to the birds’ loss of resourcesrequired for foraging and breeding (Wiley and Wunderle, 1994). Winterstorms can also impact forest ecosystems, particularly in pre-alpine andalpine areas (Faccio, 2003; Schelhaas et al., 2003; Fuhrer et al., 2006). Inaddition, saltmarshes, mangroves, and coral reefs can be vulnerable toclimate extremes (e.g., Bertness and Ewanchuk, 2002; Hughes et al.,2003; Fischlin et al., 2007).
4.3.4. Food Systems and Food Security
Food systems and food security can be affected by extreme events thatimpair food production and food storage and delivery systems (foodlogistics). Impacts transmitted through an increase in the price of foodcan be especially challenging for the urban poor in developing countries(FAO, 2008). Global food price increases are borne disproportionally bylow-income countries, where people spend more of their income onfood (OECD-FAO, 2008).
When agricultural production is not consumed where it is produced, itmust be transported and often processed and stored. This processinvolves complex interdependent supply chains exposed to multiplehazards. At every step of the process, transport and associatedinfrastructure such as roads, railways, bridges, warehouses, airports,ports, and tunnels can be at risk of direct damage from climateevents, making the processing and delivery chain as a whole at risk ofdisruption resulting from damage or blockages at any point in thechain.
The economies of many developing countries rely heavily on agriculture,dominated by small-scale and subsistence farming. People’s livelihoodsin this sector are especially exposed to weather extremes (Easterlingand Apps, 2005; Easterling et al., 2007). Subsistence farmers can beseverely impacted by climate and weather events. For example, themajority of households produce maize in many African countries, butonly a modest proportion sells it – the great majority eat all theyproduce. In Kenya for example, nearly all households grow maize, butonly 36% sell it, with 20% accounting for the majority of sales (FAO,2009). Both such famers and their governments have limited capacityfor recovery (Easterling and Apps, 2005).
Chapter 4Changes in Impacts of Climate Extremes: Human Systems and Ecosystems

247
Evidence that the current warming trends around the world havealready begun to impact agriculture is reported by Lobell et al. (2011). Theyshow that crop yields have already declined due to warmer conditionscompared to the expected yields without warming. Both Schlenker andRoberts (2009) and Muller et al. (2011), after their evaluation of projectedtemperature effects on crops in the United States and Africa, concludedthat climate change would have negative impacts on crop yields. Theseeffects were based on temperature trends and an expected increase inthe probability of extremes during the growing season; however, thereis also the potential occurrence of extreme events after the crop isgrown, which could affect harvest and grain quality. Fallon and Betts(2010) stated that increasing flooding and drought risks could affectagricultural production and require the adoption of robust managementpractices to offset these negative impacts. Their analysis for Europeshowed a probable increase in crop productivity in northern regionsbut a decrease in the southern regions, leading to a greater disparity inproduction.
In a recent evaluation of high temperature as a component of climatetrends, Battisti and Naylor (2009) concluded that future growing seasontemperatures are very likely to exceed the most extreme temperaturesobserved from 1900 to 2006, for both tropical and subtropical regions,with substantial potential implications for food systems around the world.
The effects of temperature extremes on a number of different cropspecies have been summarized in Hatfield et al. (2011). Many crops areespecially sensitive to extreme temperatures that occur just prior to orduring the critical pollination phase of crop growth (Wheeler et al., 2000;Hatfield et al., 2008, 2011). Crop sensitivity and ability to compensateduring later improved weather will depend on the length of time foranthesis in each crop.
Extreme temperatures can negatively impact grain yield (Kim et al.,1996; Prasad et al., 2006). For example, Tian et al. (2010) observed in ricethat high temperatures (>35°C) coupled with high humidity and lowwind speed caused panicle temperatures to be as much as 4°C higherthan air temperature, inducing floret sterility. Impacts of temperatureextremes may not be limited to daytime events. Mohammed and Tarpley(2009) observed that rice yields were reduced by 90% when nighttemperatures were increased from 27 to 32°C. An additional impact ofextremes has been found in the quality of the grain. Kettlewell et al.(1999) found that wheat quality in the United Kingdom was related tothe North Atlantic Oscillation and probably caused by variation inrainfall during the grain-filling period. In a more recent study, Hurkmanet al. (2009) observed that high-temperature events during grain-fillingof wheat altered the protein content of the grain, and these responseswere dependent upon whether the exposure was imposed early ormidway through the grain-filling period. Skylas et al. (2002) observed thathigh temperature during grain-filling was one of the most significantfactors affecting both yield and flour quality in wheat.
Drought causes yield variation, and an example from Europe demonstratesthat historical yield records show that drought has been a primary cause
of interannual yield variation (Hlavinka et al., 2009; Hatfield, 2010).Water supply for agricultural production will be critical to sustainproduction and even more important to provide the increase in foodproduction required to sustain the world’s growing population. Withglaciers retreating due to global warming and El Niño episodes, theAndean region faces increasing threats to its water supply (Mark andSeltzer, 2003; Cadier et al., 2007). With precipitation limited to only a fewmonths of the year, melt from glaciers is the only significant source ofwater during the dry season (Mark and Seltzer, 2003). Glacier recessionreduces the buffering role of glaciers, hence inducing more floods duringthe rainy season and more water shortages during the dry season.Cadier et al. (2007) found that warm anomalies of the El Niño-SouthernOscillation (ENSO) corresponded to an increase in melting four monthslater.
Food security is linked to our ability to adapt agricultural systems toextreme events using our understanding of the complex system ofproduction, logistics, utilization of the produce, and the socioeconomicstructure of the community. The spatial variability and context sensitivityof each of these factors points to the value of downscaled scenarios ofclimate change and extreme events.
4.3.5. Human Settlements, Infrastructure, and Tourism
4.3.5.1. Human Settlements
Settlements concentrate the exposure of humans, their assets, and theiractivities. In the case of very large cities, these concentrations canrepresent a significant proportion of national wealth and may result inadditional forms of vulnerability (Mitchell, 1998). Flooding, landslides,storms, heat waves, and wildfires have produced historically importantdamages in human settlements, and the characteristics of these eventsand their underlying climate drivers are projected to change (seeChapter 3; Kovats and Akhtar, 2008; Satterthwaite, 2008). Theconcentration of economic assets and people creates the possibilityof large impacts, but also the capacity for recovery (Cutter et al.,2008). Coastal settlements are especially at risk with sea level riseand changes in coastal storm activity (see Sections 3.4.4 and 3.4.5and Case Study 9.2.8).
At very high risk of impacts are the urban poor in informal settlements(Satterthwaite, 2008; Douglas, 2009). Worldwide, about one billionpeople live in informal settlements, and informal settlements aregrowing faster than formal settlements (UN-HABITAT, 2008; UNISDR,2011). Informal settlements are also found in developed countries; forexample, there are about 50 million people in such areas in Europe(UNECE, 2009). Occupants of informal settlements are typically moreexposed to climate events with no or limited hazard-reducinginfrastructure. The vulnerability is high due to very low-quality housingand limited capacity to cope due to a lack of assets, insurance, andmarginal livelihoods, with less state support and limited legal protection(Dodman and Satterthwaite, 2008).
Chapter 4 Changes in Impacts of Climate Extremes: Human Systems and Ecosystems

248
The number and size of coastal settlements and their associatedinfrastructure have increased significantly over recent decades(McGranahan et al., 2007; Hanson et al., 2011; see also Case Study9.2.8). In many cases these settlements have affected the ability ofnatural coastal systems to respond effectively to extreme climate eventsby, for example, removing the protection provided by sand dunes andmangroves. Small island states, particularly small island developingstates (see Case Study 9.2.9), may face substantial impacts from climatechange-related extremes.
Urbanization exacerbates the negative effects of flooding throughgreatly increased runoff concentration, peak, and volume, the increasedoccupation of flood plains, and often inadequate drainage planning(McGranahan et al., 2007; Douglas et al., 2008). These urbanizationissues are universal but often at their worst in informal settlements,which are generally the most exposed to flooding and usually do nothave the capacity to deal with the issues (Hardoy et al., 2001). Floodingregularly disrupts cities, and urban food production can be severelyaffected by flooding, undermining local food security in poor communities(Douglas, 2009; Aggarwal and Singh, 2010). A further concern for low-and middle-income cities as a result of flooding, particularly in developingcountries, is human waste, as most of these cities are not served byproper water services such as sewers, drains, or solid waste collectionservices (Hardoy et al., 2001).
Slope failure can affect settlements in tropical mountainous areas,particularly in deforested areas (e.g., Vanacker et al., 2003)and hillyareas (Loveridge et al., 2010), and especially following heavy prolongedrain (e.g., see Case Study 9.2.5). Informal settlements are often exposedto potential slope failure as they are often located on unstable land withno engineering or drainage works (Alexander, 2005; Anderson et al.,2007). Informal settlements have been disproportionately badly impactedby landslides in Colombia and Venezuela in the past (e.g., Takahashi etal., 2001; Ojeda and Donnelly, 2006) and were similarly affected in 2010during unusual heavy rains associated with the La Niña weatherphenomenon (NCDC, 2011). Densely settled regions in the Alps (Crostaet al., 2004) and Himalayas have been similarly impacted (Petley et al.,2007).
Cities can substantially increase local temperatures and reducetemperature drop at night (e.g., see Case Study 9.2.1). This is the urbanheat island effect resulting from the large amount of heat-absorbingmaterial, building characteristics, and emissions of anthropogenic heatfrom air conditioning units and vehicles (e.g., Rizwan et al., 2008; for acritical review of heat island research, see Stewart, 2011). Heat wavescombined with urban heat islands (Basara et al., 2010; Tan et al., 2010)can result in large death tolls with the elderly, the unwell, the sociallyisolated, and outdoor workers (Maloney and Forbes, 2011) beingespecially vulnerable, although acclimatization and heat health-warningsystems can substantially reduce excess deaths (Fouillet et al., 2008).Heat waves thus pose a future challenge for major cities (e.g., Endlicheret al., 2008; Bacciniet al., 2011; for London, Wilby, 2003). In urban areas,heat waves also have negative effects on air quality and the number of
days with high pollutants, ground level ozone, and suspended particleconcentrations (Casimiro and Calheiros, 2002; Sanderson et al., 2003;Langner et al., 2005).
The largest impacts from coastal inundation due to sea level rise (and/orrelative sea level rise) in low-elevation coastal zones (i.e., coastal areaswith an elevation less than 10 m above present mean sea level; seeMcGranahan et al., 2007) are thought to be associated with extremesea levels due to tropical and extratropical storms (e.g., Ebersole et al.,2010; Mozumder et al., 2011) that will be superimposed upon the long-term sea level rise (e.g., Frazier et al., 2010). An increase in the meanmaximum wind speed of tropical cyclones is likely over the 21st century,but possibly not in all ocean basins (see Table 3-1). The destructivepotential of tropical cyclones may increase in some regions as a resultof this projected increase in intensity of mean maximum wind speedand tropical cyclone-related rainfall rates (see Section 3.4.4). Stormsgenerally result in considerable disruption and local destruction, butcyclones and their associated storm surges have in some cases causedvery substantial destruction in modern cities (e.g., New Orleans andDarwin; see also Case Study 9.2.5). The impacts are considered to bemore severe for large urban centers built on deltas and small islandstates (McGranahan et al., 2007; Love et al., 2010; Wardekker et al.,2010), particularly for those at the low end of the international incomedistribution (Dasgupta et al., 2009). The details of exposure will becontrolled by the natural or human-induced characteristics of the system,for example, the occurrence/distribution of protecting barrier islandsand/or coastal wetlands that may attenuate surges (see, e.g., Irish et al.,2010; Wamsley et al., 2010) or changes such as land reclamation (Guoet al., 2009). Recent studies (Nicholls et al., 2008; Hanson et al., 2011)have assessed the asset exposure of port cities with more than onemillion inhabitants (in 2005). They demonstrated that large populationsare already exposed to coastal inundation (~40 million people or 0.6%of the global population) by a 1-in-100-year extreme event, while thetotal value of exposed assets was estimated at US$ 3,000 billion (~ 5%of the global GDP in 2005). By the 2070s, population exposure wasestimated to triple, whereas asset exposure could grow tenfold to someUS$ 35,000 billion; these estimates, however, do not account for thepotential construction of effective coastal protection schemes (see alsoDawson et al., 2005), with the exposure growth rate being more rapid indeveloping countries (e.g., Adamo, 2010). Lenton et al. (2009) estimated asubstantial increase in the exposure of coastal populations to inundation(see Figure 4-5).
4.3.5.2. Infrastructure
Weather- and climate-related extremes are expected to produce largeimpacts on infrastructure, although detailed analyses of potential andprojected damages are limited to a few countries (e.g., Australia,Canada, the United States; Holper et al., 2007), infrastructure types(e.g., power lines), and sectors (e.g., transport, tourism). Inadequateinfrastructure design may increase the impacts of climate and weatherextremes, and some infrastructure may become inadequate where climate
Chapter 4Changes in Impacts of Climate Extremes: Human Systems and Ecosystems

249
change alters the frequency and severity of extremes, for example, anincrease in heavy rainfalls may affect the capacity and maintenance ofstorm water, drainage, and sewerage infrastructure (Douglas et al., 2008).In some infrastructure, secondary risks in case of extreme weather maycause additional hazards (e.g., extreme rainfall can damage dams). Thesame is true for industrial and mining installations containing hazardoussubstances (e.g., heavy rainfall is the main cause of tailings dam failure,accounting for 25% of incidents worldwide and 35% in Europe; Rico etal., 2008).
In many parts of the world, including Central Asia and parts of Europe,aging infrastructure, high operating costs, low responsiveness tocustomers, and poor access to capital markets may limit the operabilityof sewerage systems (Evans and Webster, 2008). Moreover, most urbancenters in sub-Saharan Africa and in Asia have no sewers (Hardoy et al.,2001). Current problems of pollution and flooding will be exacerbatedby an increase in climatic and weather extremes (e.g., intense rainfall;see Table 3-3 for projected regional changes).
Major settlements are dependent on lengthy infrastructure networks forwater, power, telecommunications, transport, and trade, which are exposedto a wide range of extreme events (e.g., heavy precipitation and snow,gale winds). Modern logistics systems are intended to minimize slackand redundancies and as a result are particularly vulnerable to disruptionby extreme events (Love et al., 2010).
Transport infrastructure is vulnerable to extremes in temperature,precipitation/river floods, and storm surges, which can lead to damagein roads, rail, airports, and ports. Impacts on coastal infrastructure, on
services, and particularly on ports, key nodes of international supplychains, are expected (e.g., Oh and Reuveny, 2010). This may have far-reaching implications for international trade, as more than 80% of globaltrade in goods (by volume) is carried by sea (UNCTAD, 2009). All coastalmodes of transportation are considered vulnerable, but exposure andimpacts will vary, for example, by region, mode of transportation, location/elevation, and condition of transport infrastructure (NRC, 2008; UNCTAD,2009). Coastal inundation due to storm surges and river floods can affectterminals, intermodal facilities, freight villages, storage areas, and cargoand disrupt intermodal supply chains and transport connectivity (seeFigure 4-6). These effects would be of particular concern to small islandstates, whose transportation facilities are mostly located in low-elevationcoastal zones (UNCTAD, 2009; for further examples, see Love et al., 2010).
Regarding road infrastructure, Meyer (2008) pointed to bridges andculverts as vulnerable elements in areas with projected increases inheavy precipitation. Moreover, the lifetime of these rigid structures islonger than average road surfaces and they are costly to repair orreplace. Increased temperatures could reduce the lifetime of asphalt onroad surfaces (Meizhu et al., 2010). Extreme temperature may causeexpansion and increased movement of concrete joints, protectivecladding, coatings, and sealants on bridges and airport infrastructure,impose stresses in the steel in bridges, and disrupt rail travel (e.g., Arkelland Darch, 2006). Nevertheless, roads and railways are typically replacedevery 20 years and can accommodate climate change at the time ofreplacement (Meyer, 2008).
Electricity transmission infrastructure is also vulnerable to extremestorm events, particularly wind and lightning, and in some cases heat
Chapter 4 Changes in Impacts of Climate Extremes: Human Systems and Ecosystems
Figure 4-5 | For low-elevation coastal areas, current and future (2050) population exposure to inundation in the case of the 1-in-100-year extreme storm for sea level rise of0.15 m and for sea level rise of 0.50 m due to the partial melting of the Greenland and West Antarctic Ice Sheets. Data from Lenton et al., 2009.
Population exposedin 2050 in millions
0.50m SLR
0.15m SLR
Current populationexposed
6.2 11.7
3.8
60.2
2.32.7
Height of columns represents the number of exposed persons.
5.82.8
47.8
9.6
4.6
4.8
1.8
82.7
16.4
7.4
8.9
NORTHAMERICA
SOUTHAMERICA
EUROPE
AFRICA
ASIA
OCEANIA
5.6

250
waves (McGregor et al., 2007). The passage of the Lothar and Martinstorms across France in 1999 caused the greatest devastation to anelectricity supply network ever seen in a developed country, as 120high-voltage transmission pylons were toppled, and 36 high-tensiontransmission lines (one-quarter of the total lines in France) were lost(Abraham et al., 2000). Severe droughts may also affect the supply ofcooling water to power plants, disrupting the ongoing supply of power(see Box 4-4; Rübbelke and Vögele, 2011).
Buildings and urban facilities may be vulnerable to increasing frequencyof heavy precipitation events (see Section 3.3.2). Those close to thecoast are particularly at risk when storm surges are combined with sealevel rise. In commercial buildings, vulnerable elements are lightweightroofs commonly used for warehouses, causing water spoilage to storedgoods and equipment. During the Lothar and Martin storms, the mostvulnerable public facilities were schools, particularly those built in the1960s and 1970s and during the 1990s with the use of lightweightarchitectural elements of metal, plastic, and glass in walls and roofs(Abraham et al., 2000).
4.3.5.3. Tourism
The tourism sector is highly sensitive to climate, since climate is theprincipal driver of global seasonality in tourism demand (Lise and Tol,2002; Becken and Hay, 2007). Approximately 10% of global GDP isspent on recreation and tourism, constituting a major source of incomeand foreign currency in many developing countries (Berrittella et al.,
2006). Extreme events may play an important role in tourist decisions(e.g., Hein et al., 2009; Yu et al., 2009).
There are three broad categories of impacts of climate extremes thatcan affect tourism destinations, competitiveness, and sustainability (Scottet al., 2008): (1) direct impacts on tourist infrastructure (hotels, accessroads, etc.), on operating costs (heating/cooling, snowmaking, irrigation,food and water supply, evacuation, and insurance costs), on emergencypreparedness requirements, and on business disruption (e.g., sun-and-seaor winter sports holidays); (2) indirect environmental change impactsof extreme events on biodiversity and landscape change (e.g., coastalerosion), which may negatively affect the quality and attractiveness oftourism destinations; and (3) tourism-adverse perception of particulartouristic regions after occurrence of the extreme event itself. For example,adverse weather conditions or the occurrence of an extreme event canreduce a touristic region’s popularity among tourists during the followingseason.
Apart from extreme events, large impacts on some tourist destinationsmay be produced by medium-term projected climate change effects (e.g.,Bigano et al., 2008). Salinization of the groundwater resources due tosea level rise, land reclamation, and overexploitation of coastal aquifers(e.g., Alpa, 2009) as well as changing weather extreme patterns (Heinet al., 2009) will pose additional stresses for the industry. Nevertheless,the potential impacts on the tourist industry will depend also ontourists’ perceptions of the coastal destinations (e.g., of destinationsexperiencing beach erosion) that, however, cannot be easily predicted(Buzinde et al., 2009). Capacity to recover is related to the degree of
Chapter 4Changes in Impacts of Climate Extremes: Human Systems and Ecosystems
Figure 4-6 | Freight-handling port facilities at risk from storm surge of 5.5 and 7 m on the US Gulf Coast. Adapted from CCSP, 2008.
Galveston
Pascagoula
Gulfport/Biloxi
Freeport
South Louisiana
Port Arthur
Texas CityPlaquemines
Mobile
Houston
Beaumont
New Orleans
Baton Rouge
Lake Charles
Galveston
Pascagoula
Gulfport/Biloxi
Freeport
South Louisiana
Port Arthur
Texas CityPlaquemines
Red River
Mobile
Houston
Beaumont
New Orleans
Baton Rouge
Lake Charles
Miss
issip
pi R
iver
Mob
ile R
iver
Texas
Louisiana
Mississippi Alabama
Florida
0 50 100 150 20025 Miles
States
Study Area Counties
Rivers
USACE Cargo Ports
18 to 23 feet
Below 18 feet
Elevation
251
dependence on tourism, with diversified economies being more robust(Ehmer and Heymann, 2008). However, low-lying coastal areas and areascurrently on the edge of the snow limit may have limited alternatives.Some ski resorts will be able to adapt using snowmaking, which hasbecome an integral component of the ski industry in Europe (Elsasserand Bürki, 2002), although at the expense of high water and energyconsumption.
In some regions, the main impact of extreme events on tourism is declinein revenue, with loss of livelihoods for those working in the sector(Hamilton et al., 2005; Scott et al., 2008; Hein et al., 2009). Quantitativeregional climate projections of the frequency or magnitude of certainweather and climate extremes (e.g., heat waves and droughts; see, forexample, Table 3-3) inform qualitative understanding of regional impactson tourism activities (see Box 4-3). The vulnerable hotspot regions interms of extreme impacts of climate change on tourism include the
Mediterranean, Caribbean, small islands of the Indian and PacificOceans, and Australia and New Zealand (Scott et al., 2008). Direct andindirect effects of extremes in these regions will vary greatly withlocation (Gössling and Hall, 2006a,b; Wilbanks et al., 2007).
Box 4-3 points out a number of potential climate extreme impacts ontourism regions and activities.
4.3.6. Human Health, Well-Being, and Security
Climate extremes, such as heat waves, floods, droughts, and cyclones,influence human health, well-being, and security.
Heat waves have affected developed countries, as exemplified by the2003 European heat wave (see Case Study 9.2.1 and Box 4-4). In much
Chapter 4 Changes in Impacts of Climate Extremes: Human Systems and Ecosystems
Box 4-3 | Regional Examples of Potential Impacts of Climate Extremes on Tourism
TropicsProjections indicate a likely increase in mean maximum wind speed (but not in all basins) and in tropical cyclone-related rainfall rates(see Table 3-1). In the Caribbean, tourist activities may be reduced where beaches erode with sea level rise and where coral is bleached,impacting snorkelers and divers (Uyarra et al., 2005).
Small island states are dependent on tourism, and the tourism infrastructure that lies on the coast is threatened by climate change(Berrittella et al., 2006). Sea level rise in the 20th century – with an average rate of 1.7 mm yr-1 and a significantly higher rate(3.1 mm yr-1) for the period 1993–2003 (Bindoff et al., 2007) – poses risks for many touristic resorts of small islands in the Pacific andIndian Oceans (Becken and Hay, 2007; Scott et al., 2008).
Alpine RegionsWarming temperatures will raise the snowline elevation (Elsasser and Bürki, 2002; Scott et al., 2006). In Switzerland, only 44% of skiresorts are projected to be above the ‘snow-reliable’ altitude (snow for 100 days per season) by approximately 2030, as opposed to 85%today (Elsasser and Bürki, 2002). In Austria, 83% of ski resorts are currently snow-reliable but an increase in temperature of 1 and 2°C isprojected to reduce this number to 67 and 50%, respectively (Abegg et al., 2007). Ski season simulations show that snowmakingtechnology can maintain snow-reliable conditions in Austria until the 2040s (A1B) to the 2050s (B1), but by the end of the century therequired production in snow volume is projected to increase by up to 330% (Steiger, 2010). This artificial snow production will increasevulnerability to water shortage and local water conflicts, in particular in the French Alps (EEA, 2009).
Mediterranean CountriesMore frequent heat waves and tropical nights (>20°C) in summer (see Table 3-3) may lead to exceedance of comfortable temperaturelevels and reduce the touristic flow by 2060 (Hein et al., 2009). Tourism occupancy may increase during spring and autumn and decreasein summer (Perry, 2003; Esteban-Talaya et al., 2005). Northern European countries are expected to become relatively more attractive,closing their gap with the currently popular southern European countries (Hamilton et al., 2005).
There are major regional gaps in understanding how climate change may affect the natural and cultural resources in Africa and SouthAmerica, preventing further insight on corresponding impacts for tourism activities (Scott et al., 2008).
In many regions, some types of tourism will benefit from, or be unaffected by, climate extremes (Scott et al., 2008). When an area isimpacted directly by an extreme event, tourists will often go to another destination with the result that one area’s loss becomes another’sgain. The impacted area may also gain in the longer term through the provision of new infrastructure. City and cultural tourism isgenerally seen as relatively unaffected by climate and weather events (Scott et al., 2008).

252
of the developed world, societies are aging and hence can be moresensitive to climate extremes, such as heat waves (Hennessy et al.,2007). Heat extremes can claim casualties even in tropical countries,where people are acclimatized to the hot climate; McMichael et al.(2008) evaluated the relation between daily temperature and mortalityin middle- and low-income countries, and reported that higher mortalitywas observed on very hot days in most of the cities, including tropicalcities, such as Bangkok, Thailand; Delhi, India; and Salvador, Brazil.
Floods can cause deaths and injuries and can be followed by infectiousdiseases (such as diarrhea) and malnutrition due to crop damage (seeSection 4.4.2.3). In Dhaka, Bangladesh, the severe flood in 1998 wasassociated with an increase in diarrhea during and after the flood, andthe risk of non-cholera diarrhea was higher among those from a lowersocioeconomic group and not using tap water (Hashizume et al., 2008).Floods may also lead to a geographical shift of malaria epidemicregions by changing breeding sites for vector mosquitoes. Outbreaks ofmalaria were associated with changes in habitat after the 1991 floods inCosta Rica’s Atlantic region (Saenz et al., 1995; for another example, seeCase Study 9.2.6). Malaria epidemics can also occur when people withlittle immunity move into endemic regions, although the displacementof large populations has rarely occurred as a result of acute naturaldisasters (Toole, 1997).
Drought can affect water security, as well as food security throughreduction of agricultural production (MacDonald, 2010), and it can be afactor contributing to human-ignited forest fires, which can lead towidespread deforestation and carbon emissions (D’Almeida et al., 2007;van der Werf et al., 2008; Field et al., 2009; Phillips et al., 2009; Costaand Pires, 2010). Also, drought can increase or decrease the prevalenceof mosquito-borne infectious diseases such as malaria, depending on thelocal conditions (Githeko et al., 2000), and is associated with meningitis(Molesworth et al., 2003). Studies indicate that there is a climate signalin forest fires throughout the American West and Canada and that thereis a projected increase in severe wildfires in many areas (Gillett et al.,2004; Westerling et al., 2006; Westerling and Bryant, 2008). As describedby McMichael et al. (2003a), the direct effects of fire on human healthcan include burns and smoke inhalation, with indirect health impactspotentially resulting from loss of vegetation on slopes, increased soilerosion, and resulting increased risk of landslides.
Evaluation of how impacts of climate extremes affect human health tendto focus on the direct, immediate effects of the event, using parametersthat are often easier to obtain and quantify like death statistics orhospitalizations. These direct observable outcomes are used todemonstrate the extremity of an event and as a comparison metric tomeasure against other extreme events. However, indirect health impactsare not often reported, because they are one step removed from theevent. Because indirect impacts are hard to monitor and are oftentemporally separated from the event, they are effectively removed fromthe cause-and-effect linkage to that event. Examples of indirect healthimpacts from extreme weather events include illnesses or injury resultingfrom disruption of human infrastructure built to deal with basic needs like
medical services; exposure to infectious or toxic agents after an extremeevent like cyclones or flooding (Schmid et al., 2005); stress, anxiety, andmental illness after evacuation or geographical displacement (Fritze etal., 2008) as well as increased susceptibility to infection (Yee et al.,2007); and disruption of socioeconomic structures and food productionthat leads to increases of malnutrition that might not manifest untilmonths after an extreme event (Haines et al., 2006; McMichael et al.,2006). Indirect health impacts are therefore a potentially large butunder-examined outcome of extreme weather events that lead to asubstantial underestimation of the total health burden.
There is a growing body of evidence that the mental health impact fromextreme events is substantial (Neria et al., 2008; Berry et al., 2010).Often overshadowed by the physical health outcomes of an event, thepsychological effects can be long lasting and can affect a large portion ofa population (Morrissey and Reser, 2007). An extreme event may affectmental health directly from acute traumatic stress from an event, withcommon outcomes of anxiety and depression. It can also have indirectimpacts during the recovery period associated with the stress andchallenges of loss, disruption, and displacement. Furthermore, indirectmental health impacts could even affect individuals not directly associatedwith an event, like grieving friends and family of those who die from anevent or the rescue and aid workers who suffer post-traumatic stressdisorder (PTSD) after their aid efforts. Long-term mental health impactsare not often adequately monitored, but the body of research conductedafter natural disasters in the past three decades suggests that the burdenof PTSD among persons exposed to disasters is substantial (Neria et al.,2008). A range of other stress-related problems such as grief, depression,anxiety disorders, somatoform disorders, and drug and alcohol abuse(Fritze et al., 2008) have lasting effects, long after the causative event.
There remain large limitations in evaluating health impacts of climatechange. The largest research gap is a lack of information on impactoutcomes themselves in developing countries in general. This includes themortality/morbidity data and information on other contributing factorssuch as nutritional status or access to safe water and medical facilities.
4.4. Regionally Based Aspects ofVulnerability, Exposure, and Impacts
4.4.1. Introduction
The regional subsections presented here discuss the impacts of extremeweather and climate events within the context of other issues andtrends. Regional perspective, in social and economic dimensions, isimportant especially since decisionmaking often has a strong regionalcontext. For a comprehensive assessment of observed and projectedregional changes in climate extremes, see Sections 3.3 to 3.5 andTables 3-2 and 3-3.
For various climate extremes, the following aspects are considered on aregional basis: exposure of humans and their activities to given climate
Chapter 4Changes in Impacts of Climate Extremes: Human Systems and Ecosystems
253
extremes; the vulnerability of what is exposed to the climate extreme;and the resulting impacts. The individual sections below are structuredas is most logical for the trends relevant to each region.
4.4.2. Africa
4.4.2.1. Introduction
Climate extremes exert a significant control on the day-to-day economicdevelopment of Africa, particularly in traditional rain-fed agricultureand pastoralism, and water resources, at all scales. Floods and droughtscan cause major human and environmental impacts on and disruptionsto the economies of African countries, thus exacerbating vulnerability(AMCEN/UNEP, 2002; Scholes and Biggs, 2004; Washington et al., 2004;Thornton et al., 2006). There is still limited scientific information availableon observed frequency and projections of many extreme events in Africa(e.g., see Tables 3-2 and 3-3), despite frequent reporting of such events,including their impacts.
Agriculture as an economic sector is most vulnerable and most exposedto climate extremes in Africa. It contributes approximately 50% toAfrica’s total export value and approximately 21% of its total GDP(Mendelsohn et al., 2000; PACJA, 2009). In particular, with an inefficientagriculture industry, sub-Saharan Africa is extremely vulnerable to climateextremes. This vulnerability is exacerbated by poor health, education, andgovernance standards (Brooks et al., 2005). Reid et al. (2007) projectclimate impacts on Namibia’s natural resources that would cause annuallosses of 1 to 6% of GDP, of which livestock production, traditionalagriculture, and fishing are expected to be hardest hit, with a combinedloss of US$ 461 to 2,045 million per year by 2050.
4.4.2.2. Droughts and Heat Waves
An overall increase in dryness in Africa has been observed (mediumconfidence), with prolonged Sahel drought, but regional variability isobserved (see Table 3-2). Droughts have affected the Sahel, the Horn ofAfrica, and Southern Africa particularly since the end of the 1960s(Richard et al., 2001; L’Hôte et al., 2002; Brooks, 2004; Christensen et al.,2007; Trenberth et al., 2007). One of the main consequences of multi-year drought periods is severe famine, such as the one associated withthe drought in the Sahel in the 1980s, causing many casualties andimportant socioeconomic losses. The people in Africa who live indrought-prone areas are vulnerable to the direct impacts of droughts(e.g., famine, death of cattle, soil salinization), as well as indirectimpacts (e.g., illnesses such as cholera and malaria) (Few et al., 2004).
The water sector is strongly influenced by, and sensitive to, periods ofprolonged drought conditions in a continent with limited water storageinfrastructure. Natural water reservoirs such as lakes experiencea marked interannual water level fluctuation related to rainfall interannualvariability (Nicholson et al., 2000; Verschuren et al., 2000).
Large changes in hydrology and water resources linked to climatevariability have led to water stress conditions in human and ecologicalsystems in a number of African countries (Schulze et al., 2001; New, 2002;Legesse et al., 2003; Eriksen et al., 2005; de Wit and Stankiewicz, 2006;Nkomo and Bernard, 2006). Twenty-five percent of the contemporaryAfrican population has limited water availability and thus constitutes adrought-sensitive population, whereas 69% of the population experiencesrelative water abundance (Vörösmarty et al., 2005). Even for this latterpart of the population, however, relative abundance does not necessarilycorrespond to access to safe drinking water and sanitation, and thiseffective reduction of the quantity of freshwater available for human usenegatively affects vulnerability. Despite the considerable improvementsin access to freshwater in the 1990s, only about 62% of the Africanpopulation had access to improved water supplies in 2000 (WHO/UNICEF, 2000). As water demand increases, the population exposed todifferent drought conditions (agricultural, climate, urban) is expected toincrease as well.
Increasing drought risk may cause a decline in tourism, fisheries, andcropping (UNWTO, 2003). This could reduce the revenue available togovernments, enterprises, and individuals, and hence further deterioratethe capacity for adaptation investment. For example, the 2003-2004drought cost the Namibian Government N$ 275 million (US$ 43-48million) in provision of emergency relief (Reid et al., 2007). Cameroon’seconomy is highly dependent on rain-fed agriculture; a 14% reduction inrainfall is projected to cause significant losses, of up to US$ 4.56 billion(Molua and Lambi, 2006).
4.4.2.3. Extreme Rainfall Events and Floods
There are inconsistent patterns of change in heavy precipitation inAfrica and partial lack of data; hence there is low confidence inobserved precipitation trends (see Table 3-2). Heavy precipitation mayinduce landslides and debris flows in tropical mountain regions (Thomasand Thorp, 2003) with potential impacts for human settlements. In thearid and semi-arid areas of countries of the Horn of Africa, extremerainfall events are often associated with a higher risk of the vector andepidemic diseases of malaria, dengue fever, cholera, Rift Valley fever,and hantavirus pulmonary syndrome (Anyamba et al., 2006; McMichaelet al., 2006).
The periods of extreme rainfall and recurrent floods seem to correlatewith the El Niño phase (Reason and Kiebel, 2004; Reason et al., 2005;Washington and Preston, 2006; Christensen et al., 2007) of ENSO events(e.g., 1982-1983, 1997-1998, 2006-2007). When such events occur,important economic and human losses result. In 2000, floods inMozambique (see Case Study 9.2.6), particularly along the valleys of therivers Limpopo, Save, and Zambezi, resulted in 700 reported deaths andabout half a million homeless. The floods had a devastating effect onlivelihoods, destroying agricultural crops, disrupting electricity supplies,and demolishing basic infrastructure (Osman-Elasha et al., 2006).However, floods can be highly beneficial in African drylands (e.g.,
Chapter 4 Changes in Impacts of Climate Extremes: Human Systems and Ecosystems
254
Sahara and Namib Deserts) since the floodwaters infiltrate and rechargealluvial aquifers along ephemeral river pathways, extending wateravailability to dry seasons and drought years (Morin et al., 2009; Benitoet al., 2010), and supporting riparian systems and human communities(e.g., Walvis Bay in Namibia).
Damage to African port cities from flooding, storm surge, and high windsmight increase due to climate change. For instance, it is indicated that inAlexandria, US$ 563.28 billion worth of assets could suffer damageor be lost because of coastal flooding alone by 2070 (Nicholls et al.,2008).
4.4.2.4. Dust Storms
Atmospheric dust is a major element of the Saharan and Sahelianenvironments. The Sahara Desert is the world’s largest source ofairborne mineral dust, which is transported over large distances,traversing northern Africa and adjacent regions and depositing dust onother continents (Osman-Elasha et al., 2006; Moulin et al., 1997). Duststorms have negative impacts on agriculture, health, and structures.They erode fertile soil; uproot young plants; bury water canals, homes,and properties; and cause respiratory problems. Meningitis transmissionis associated with dust in semi-arid conditions and overcrowded livingconditions. The frequency of dust events has increased in the Sahelzone, but studies of observations and in particular studies of projectionsof dust activity are limited (see Section 3.5.8).
4.4.3. Asia
Asia includes mega-deltas, which are susceptible to extreme impacts dueto a combination of the following factors: high-hazard rivers, coastalflooding, and increased population exposure from expanding urbanareas with large proportions of high vulnerability groups (Nicholls et al.,2007). Asia can also expect changes in the frequency and magnitude ofextreme weather and climate events, such as heat waves and heavyprecipitation (see, e.g., Table 3-3). Such changes may have ramificationsnot only for physical and natural systems but also for human systems.
4.4.3.1. Tropical Cyclones (Typhoons or Hurricanes)
Damage due to storm surge is sensitive to any changes in the magnitudeof tropical cyclones (Xiao and Xiao, 2010). For example, changes instorm surge and associated damage were projected for the inner partsof three major bays (Tokyo, Ise, and Osaka) in Japan (Suzuki, 2009). Theprojections were based on calculations of inundations for different sealevels and different strengths of typhoons, using a spatial model withinformation on topography and levees. The research indicated that atyphoon that is 1.3 times as strong as the design standard with a sealevel rise of 60 cm would cause damage costs of about US$ 3, 40, and27 billion, respectively, in the investigated bays.
Awareness, improved governance, and development are essential incoping with extreme tropical cyclone and typhoon events in developingAsian countries (Cruz et al., 2007). For example, two cyclones in theIndian Ocean (Sidr and Nargis) of similar magnitude and strengthcaused a significantly different number of fatalities. A comparison ispresented in Case Study 9.2.5.
For the period from 1983 to 2006, the direct economic losses in Chinaincreased, but there is no trend if the losses are normalized by annualtotal GDP and GDP per capita, suggesting Chinese economic developmentcontributed to the upward trend. This hypothesis is consistent with dataon tropical cyclone casualties, which showed no significant trend overthe 24 years (Zhang et al., 2009). Similarly, normalized losses fromtyphoons on the Indian southeast coast since 1977 show no increases(Raghavan and Rajesh, 2003).
4.4.3.2. Flooding
The geographical distribution of flood risk is heavily concentrated inIndia, Bangladesh, and China, causing high human and material losses(Brouwer et al., 2007; Dash et al., 2007; Shen et al., 2008). Regardingthe occurrence of the extreme events themselves, different floodingtrends have been detected and projected in various catchments, but theevidence for broader regional trends is limited (see Section 3.5.2).
In July 2005, severe flooding occurred in Mumbai, India, after 944 mmof rain fell in a 24-hour period (Kshirsagar et al., 2006). The consequentflooding affected households, even in more affluent neighborhoods.Poor urban drainage systems in many parts of India can be easilyblocked. Ranger et al. (2011) analyzed risk from heavy rainfall in the city ofMumbai, concluding that total losses (direct plus indirect) for a 1-in-100year event could triple by the 2080s compared with the present(increasing from US$ 700 to 2,305 million), and that adaptation couldhelp reduce future damages.
As noted in the final report for the Ministry of Environment and Forest(2005) of the People’s Republic of Bangladesh, flooding in Bangladeshis a normal, frequently recurrent, phenomenon. Bangladesh experiencesfour types of floods: flash floods from the overflowing of hilly rivers; rainfloods due to poor drainage; monsoon floods in the flood plains ofmajor rivers; and coastal floods following storm surge. In a normal year,river spills and drainage congestions cause inundation of 20 to 25% ofthe country’s area. Inundation areas for 10-, 50-, and 100-year floodsconstitute 37, 52, and 60% of the country’s area, respectively. In 1987,1988, and 1998, floods inundated more than 60% of the country.The 1998 flood alone led to 1,100 deaths, caused inundation of nearly100,000 km2, left 30 million people homeless, and substantiallydamaged infrastructure.
There have been increases in flood impacts associated with changes insurrounding environments. Flooding has increased over the past fewdecades in the Poyang Lake, South China, due to levee construction
Chapter 4Changes in Impacts of Climate Extremes: Human Systems and Ecosystems

255
protecting a large rural population (Shankman et al., 2006). Such leveesreduce the area for floodwater storage, leading to higher lake stagesduring the summer flood season and then levee failures. The mostextreme floods occurred during or immediately following El Niño events(Shankman et al., 2006). Fengqing et al. (2005) analyzed losses fromflooding in the Xinjiang autonomous region of China, and found anincrease that seems to be linked to changes in rainfall and flash floodssince 1987.
Heavy rainfall and flooding also affect environmental health in urbanareas because surface water can be quickly contaminated. Urban poorpopulations in low- and middle-income countries can experience higherrates of infectious disease after floods, such as cholera, cryptosporidiosis,and typhoid fever (Kovats and Akhtar, 2008).
4.4.3.3. Temperature Extremes
Increases in warm days/nights and heat wave duration, frequency,and/or intensity are observed and projected in Asia (see Tables 3-2 and3-3), with adverse impacts on both human and natural systems. In 2002,a heat wave was reported to have killed 622 people in the southernIndian state of Andhra Pradesh. Persons living in informal settlementsand structures are more exposed to high temperatures (Kovats andAkhtar, 2008).
Agriculture is also affected directly by temperature extremes. For example,rice, the staple food in many parts of Asia, is adversely affected byextremely high temperature, especially prior to or during critical pollinationphases (see Section 4.3.4).
4.4.3.4. Droughts
Asia has a long history of drought, which has been linked with otherclimate extremes. Spatially varying trends have been observed duringthe second half of the 20th century, with increasing dryness noted insome areas, particularly in East Asia (see Table 3-2), adversely affectingsocioeconomic, agricultural, and environmental conditions. Droughtcauses water shortages, crop failures, starvation, and wildfire.
In Southeast Asia, El Niño is associated with comparatively dryconditions: 93% of droughts in Indonesia between 1830 and 1953occurred during El Niño years (Quinn et al., 1978). In four El Niño yearsbetween 1973 and 1992, the average annual rainfall amounted to onlyaround 67% of the 20-year average in two major rice growing areas inJava, Indonesia, causing a yield decline of approximately 50% (Amienet al., 1996).
During drought, severe water scarcity results from one of, or acombination of, the following mechanisms: insufficient precipitation;high evapotranspiration; and over-exploitation of water resources(Bhuiyan et al., 2006).
About 15% (23 million ha) of Asian rice areas experience frequent yieldloss due to drought (Widawsky and O’Toole, 1990). The problem isparticularly pertinent to eastern India, where the area of drought-pronefields exceeds more than 10 million ha (Pandey et al., 2000). Even whenthe total rainfall is adequate, shortages during critical periods reduceyield (Kumar et al., 2007). Lowland rice production in the Mekongregion is generally reduced because crops are cultivated under rain-fedconditions, rather than irrigated, and often exposed to drought. InCambodia, severe drought that affects grain yield mostly occurs late inthe growing season, and longer-duration genotypes are more likely toencounter drought during grain filling (Tsubo et al., 2009).
Asian wetlands provide resources to people in inundation areas, whoare susceptible to droughts. For achieving the benefits from fertilizationfor inundation agriculture in Cambodia, wide areas along the riversneed to be flooded (Kazama et al., 2009). Flood protection in this areaneeds to consider this benefit of inundation.
4.4.3.5. Wildfires
Grassland fire disaster is a critical problem in China (Su and Liu, 2004;Zhang et al., 2006), especially in northwestern and northeastern Chinadue to expansive territory and complex physiognomy. Statistical analysisof historical grassland fire disaster data has suggested a gradualincrease in grassland fire disasters with economic development andpopulation growth in 12 northern provinces of China between 1991 and2006 (Liu et al., 2006).
In tropical Asia, although humans are igniting the fires, droughts arepredisposing factors for fire occurrence (Field et al., 2009). Droughtepisodes, forest fires, drainage of rice fields, and oil palm plantations aredrying peatlands, which are then more susceptible to fires (van der Werfet al., 2008). Peatland fires are an important issue given the difficultiesof extinguishing them and their potential effects on climate.
4.4.4. Central and South America
4.4.4.1. Extreme Rainfalls in South America
Extreme rainfall episodes have caused disasters in parts of SouthAmerica, with hundreds to thousands of fatalities in mudslides andlandslides, as typified, for example, by the December 1999 incident inVenezuela (Lyon, 2003). However, there is low to medium confidence inobserved (Table 3-2) and in projected (Table 3-3) changes in heavyprecipitation in the region.
4.4.4.2. Wildfires
There is a low to medium confidence in projections of trends in drynessin South America (see Table 3-3). Magrin et al. (2007) indicated that
Chapter 4 Changes in Impacts of Climate Extremes: Human Systems and Ecosystems

256
more frequent wildfires are probable (an increase in frequency of 60%for a temperature increase of 3°C) in much of South America. In most ofcentral and northern Mexico, the semi-arid vegetation could be replacedby the vegetation of arid regions (Villers and Trejo, 2004). Due to theinterrelated nature of forest fires, deforestation, drought, and climatechange, isolating one of the processes fails to describe the complexityof the interconnected whole.
4.4.4.3. Regional Costs
Climatic disasters account for the majority of natural disasters in CentralAmerica, with most of its territory located in tropical and equatorial areas.Low-lying states are especially vulnerable to hurricanes and tropicalstorms. In October 1998, Hurricane Mitch, one of the most powerfulhurricanes of the tropical Atlantic Basin of the 20th century, causeddirect and indirect damages to Honduras of US$ 5 billion, equivalent to95% of Honduras’ 1998 GDP (Cardemil et al., 2000). Some literatureindicates that hurricane losses, when corrected for population andwealth in Latin America and the Caribbean, have not increased since the1940s (Pielke Jr. et al., 2003); and that increasing population and assetsat risk are the main reason for increasing impacts.
4.4.5. Europe
4.4.5.1. Introduction
This section assesses vulnerability and exposure to climate extremes inEurope, evaluating observed and projected impacts, disasters, and risks.Europe has a higher population density and lower birth rate than anyother continent. It currently has an aging population; life expectancyis high and increasing, and child mortality is low and decreasing(Eurostat, 2010). European exposure to climate- and weather-relatedhazards has increased whereas vulnerability has decreased as a resultof implementation of policy, regulations, and risk prevention andmanagement (EEA, 2008; UNISDR, 2009).
4.4.5.2. Heat Waves
Summer heat waves have increased in frequency and duration in mostof Europe (Section 3.3.1 and Table 3-2) and have affected vulnerablesegments of European society. During the 2003 heat wave, several tensof thousands of additional heat-related deaths were recorded (see CaseStudy 9.2.1 and Box 4-4). Urban heat islands pose an additional risk tourban inhabitants. Those most affected are the elderly, ill, and sociallyisolated (Kunst et al., 1993; Laschewski and Jendritzky, 2002; seeCase Study 9.2.1). There are mounting concerns about increasing heatintensity in major European cities (Wilby, 2003) because of the largepopulation that inhabits urban areas. Building characteristics, emissionsof anthropogenic heat from air conditioning units and vehicles, as wellas lack of green open areas in some parts of the cities, may exacerbate
heat load during heat waves (e.g., Stedman, 2004; Wilby, 2007).However, as high summer temperatures and urban heat waves becomemore common, populations are able to adapt to such ‘expected’temperature conditions, decreasing mortality during subsequent heatwaves (Fouillet et al., 2008).
4.4.5.3. Droughts and Wildfires
Drought risk is a function of the frequency, severity, and spatial andtemporal extent of dry spells and of the vulnerability and exposure of apopulation and its economic activity (Lehner et al., 2006). InMediterranean countries, droughts can lead to economic damageslarger than floods or earthquakes (e.g., the drought in Spain in 1990affected 6 million people and caused material losses of US$ 4.5 billion;after CRED, 2010). The most severe human consequences of droughtsare often found in semiarid regions where water availability is alreadylow under normal conditions, water demand is close to, or exceeds,natural availability, and/or society lacks the capacity to mitigate oradapt to drought (Iglesias et al., 2009). Direct drought impacts affectall forms of water supply (municipal, industrial, and agricultural).Other sectors and systems affected by drought occurrence arehydropower generation, tourism, forestry, and terrestrial and aquaticecosystems.
Forest fire danger (length of season, frequency, and severity) dependson the occurrence of drought. There is medium confidence in observedchanges in drought in Europe (Table 3-2). Projections indicate increasingdryness in central Europe and the Mediterranean, with no major changein Northern Europe (medium confidence) (see Table 3-3). In theMediterranean, an increase in dryness may lead to increased dominanceof shrubs over trees (Mouillot et al., 2002); however, it does not translatedirectly into increased fire occurrence or changes in vegetation (Thonickeand Cramer, 2006). Analysis of post-fire forest resilience contributes toidentifying ‘risk hotspots’ where post-fire management measuresshould be applied as a priority (Arianoutsou et al., 2011).
4.4.5.4. Coastal Flooding
Coastal flooding is an important natural disaster, since many Europeanslive near the coasts. Storm surges can be activated as a result of wind-driven waves and winter storms (Smith et al., 2000), whereas long-termprocesses are linked to global mean sea level rise (Woodworth et al.,2005). Locations currently experiencing adverse impacts such as coastalerosion and inundation will continue to do so in the future (see Section3.5.5). Expected sea level rise is projected to have impacts on Europe’scoastal areas including land loss, groundwater and soil salinization, anddamage to property and infrastructure (Devoy, 2008). Hinkel et al.(2010) found that the total monetary damage in coastal areas of theMember Countries of the European Union caused by flooding, salinityintrusion, land erosion, and migration is projected to rise withoutadaptation by 2100 to roughly € 17 billion per year under the A2 and
Chapter 4Changes in Impacts of Climate Extremes: Human Systems and Ecosystems
257
B1 emission scenarios. The Netherlands is an example of a country thatis highly susceptible to both sea level rise and coastal flooding, withdamage costs relative to GDP of up to 0.3% of GDP under the A2scenario (Hinkel et al., 2010). By 2100, adaptation can reduce thenumber of people flooded by two orders of magnitude and the totaldamage costs by a factor of seven to nine (Hinkel et al., 2010).
4.4.5.5. Gale Winds
Storms have been one of the most important climate hazards for theinsurance industry in Europe (Munich Re NatCatSERVICE data cited inEEA, 2008). In the most severe extratropical windstorm month,December 1999, when three events struck Europe (Anatol – December 3,Denmark; Lothar – December 26, France, Germany, and Switzerland;and Martin – December 28, France, Spain, and Italy), insured damagewas in excess of US$ 12 billion (Schwierz et al., 2010). Typical economiclosses were generated by gale winds via effects on electrical distributionsystems, transportation, and communication lines; by damage tovulnerable elements of buildings (e.g., lightweight roofs); and by trees
falling on houses. Some researchers have found no contribution fromclimate change to trends in the economic losses from floods in Europesince the 1970s (Barredo, 2009). Some studies have found evidence ofincreasing damages to forests in Sweden and Switzerland (Nilsson etal., 2004; Usbeck et al., 2010). Still other studies assert that increases inforest disturbances in Europe are mostly due to changes in forestmanagement (e.g., Schelhaas et al., 2003).
There is medium confidence in projected poleward shifts of mid-latitudestorm tracks but low confidence in detailed regional projections (seeSection 3.4.5). According to a study by Swiss Re (2009), if by the end ofthis century once-in-a-millennium storm surge events strike northernEurope every 30 years, this could potentially result in a disproportionateincrease in annual expected losses from a current € 0.6 to 2.6 billion byend of the century. Similar results are obtained from global and regionalclimate models run under the IPCC SRES A1B emission scenario (Donatet al., 2010). Adaptation to the changing wind climate may reduce byhalf the estimated losses (Leckebusch et al., 2007; Donat et al., 2010),indicating that adaptation through adequate sea defenses and themanagement of residual risk is beneficial.
Chapter 4 Changes in Impacts of Climate Extremes: Human Systems and Ecosystems
Box 4-4 | Extraordinary Heat Wave in Europe, Summer 2003
The extraordinarily severe heat wave over large parts of the European continent in the summer of 2003 produced record-breakingtemperatures particularly during June and August (Beniston, 2004; Schär et al., 2004). Average summer (June to August) temperatureswere by up to five standard deviations above the long-term mean, implying that this was an extremely unusual event (Schär andJendritzky, 2004). Regional climate model simulations suggest the 2003 heat wave bears resemblance to summer temperatures in thelate 21st century under the A2 scenario (Beniston, 2004).
Electricity demand increased with the high heat levels. Additionally, drought conditions created stress on health, water supplies, foodstorage, and energy systems; for example, reduced river flows reduced the cooling efficiency of thermal power plants (conventional andnuclear), and six power plants were shut down completely (Létard et al., 2004). Many major rivers (e.g., the Po, Rhine, Loire, and Danube)were at record low levels, resulting in disruption of inland navigation and irrigation, as well as power plant cooling (Beniston and Díaz,2004; Zebisch et al., 2005). In France, electricity became scarce, construction productivity fell, and the cold storage systems of approximately20 to 30% of all food-related establishments were found to be inadequate (Létard et al., 2004). The (uninsured) economic losses for theagriculture sector in the European Union were estimated at € 13 billion (Sénat, 2004). A record drop in crop yield of 36% occurred inItaly for maize grown in the Po valley, where extremely high temperatures prevailed (Ciais et al., 2005). The hot and dry conditions led tomany very large wildfires. Glacier melting in the Alps prevented even lower river flows in the Danube and Rhine (Fink et al., 2004).
Health and health service-related impacts of the heat wave were dramatic, with excess deaths of about 35,000 (Kosatsky, 2005). Elderlypeople were among those most affected (WHO, 2003; Borrell et al., 2006; Kovats and Ebi, 2006), but deaths were also associated withhousing and social conditions, for example, being socially isolated or living on the top floor (Vandentorren et al., 2006). The high mortalityduring the 2003 heat wave marked an inflexion point in public awareness of the dangers of high temperatures, conducive to increasingthe preventive measures set up by health institutions and authorities (Koppe et al., 2004; Pascal et al., 2006).
During the July 2006 heat wave, about 2,000 excess deaths occurred in France (Rey et al., 2007). The excess mortality during the 2006heat wave was markedly lower than that predicted by Fouillet et al. (2008) based on the quantitative association between temperatureand mortality observed during 1975-2003. Fouillet et al. (2008) interpreted this mortality reduction (~4,400 deaths) as a decrease in thepopulation’s vulnerability to heat, together with increased awareness of the risk related to extreme temperatures, preventive measures,and the warning system established after the 2003 heat wave.

258
4.4.5.6. Flooding
Flooding is the most frequent natural disaster in Europe (EEA, 2008).Economic losses from flood hazards in Europe have increased considerablyover previous decades (Lugeri et al., 2010), and increasing exposure ofpeople and economic assets is probably the major cause of the long-term changes in economic disaster losses (Barredo, 2009). Exposure isinfluenced by socioeconomic development, urbanization, and infrastructureconstruction on flood-prone areas. Large flood impacts have been causedby a few individual flood events (e.g., the 1997 floods in Poland andCzech Republic, the 2002 floods in much of Europe, and the 2007 summerfloods in the United Kingdom). The projected increase in frequency andintensity of heavy precipitation over large parts of Europe (Table 3-3) mayincrease the probability of flash floods, which pose the highest risk offatality (EEA, 2004). Particularly vulnerable are new urban developmentsand tourist facilities, such as camping and recreation areas (e.g., a largeflash flood in 1996 in the Spanish Pyrenees, conveying a large amountof water and debris to a camping site, resulted in 86 fatalities; Benito etal., 1998). Apart from new developed urban areas, linear infrastructure,such as roads, railroads, and underground rails with inadequate drainage,will probably suffer flood damage (DEFRA, 2004; Arkell and Darch, 2006).Increased runoff volumes may increase risk of dam failure (small waterreservoirs and tailings dams) with high environmental and socioeconomicdamages as evidenced by historical records (Rico et al., 2008).
In glaciated areas of Europe, glacial lake outburst floods, althoughinfrequent, have the potential to produce immense socioeconomic andenvironmental impacts. Glacial lakes dammed by young, unstable, andunconsolidated moraines, and lakes in contact with the active ice bodyof a glacier, increase the potential of triggering an event (e.g., Huggel etal., 2004). Intense lake level and dam stability monitoring on most glaciallakes in Europe helps prevent major breach catastrophes. In case offlooding, major impacts are expected on infrastructure and settlementseven at long distances downstream from the hazard source area(Haeberli et al., 2001; Huggel et al., 2004).
4.4.5.7. Landslides
There is a general lack of information on trends in landslide activity, andfor regions with reasonably well-established databases (e.g., Switzerland),significant trends have not been found in the number of events andimpacts (Hilker et al., 2009). Reactivation of large movements usuallyoccurs in areas with groundwater flow and river erosion. In southernEurope the risk is reduced through revegetation on scree slopes, whichenhances cohesion and slope stability coupled with improved hazardmitigation (Corominas, 2005; Clarke and Rendell, 2006).
4.4.5.8. Snow
Snow avalanches are an ever-present hazard with the potential for lossof life, property damage, and disruption of transportation. Due to an
increased use of mountainous areas for recreation and tourism, there isincreased exposure for the population leading to an increased rate ofmortality due to snow avalanches. During the period 1983 to 2003,avalanche fatalities have averaged about 25 per year in Switzerland(McClung and Schaerer, 2006). In economic terms, direct losses related toavalanches are small (Voigt et al., 2010), although short-term reactions bytourists may result in a reduction in overnight stays one year after adisaster (Nöthiger and Elsasser, 2004). Increased winter precipitationmay result in higher than average snow depth or duration of snowcover, which could contribute to avalanche formation (Schneebeli et al.,1997). Climate change impacts on snow cover also include decreases inits duration, depth, and extent and a possible altitudinal shift of thesnow/rain limit (Beniston et al., 2003), with adverse consequences towinter tourism. Increased avalanche occurrence would have a negativeimpact on humans (loss of life and infrastructure) but could have apositive result in mountain forests due to higher biodiversity within theaffected areas (Bebi et al., 2009).
4.4.6. North America
4.4.6.1. Introduction
North America (Canada, Mexico, and the United States) is relatively welldeveloped, although differentiation in living standards exists across andwithin countries. This differentiation in adaptive capacity, combinedwith a decentralized and essentially reactive response capability,underlies the region’s vulnerability (Field et al., 2007). Furthermore,population trends within the region have increased vulnerability byheightening exposure of people and property in areas that are affectedby extreme events. For example, population in coastline regions of theGulf of Mexico region in the United States increased by 150% from1960 to 2008, while total US population increased by 70% (U.S. CensusBureau, 2010).
4.4.6.2. Heat Waves
For North America, there is medium confidence in observations (Table 3-2)and high confidence in projections (Table 3-3) of increasing trends inheat wave frequency and duration.
Heat waves have impacts on many sectors, most notably on human health,agriculture, forestry and natural ecosystems, and energy infrastructure.One of the most significant concerns is human health, in particularmortality and morbidity. In 2006 in California, at least 140 deaths andmore than 1,000 hospitalizations were recorded during a severe heatwave (CDHS, 2007; Knowlton et al., 2008). In 1995 in Chicago, morethan 700 people died during a severe heat wave. Following that 1995event, the city developed a series of response measures through anextreme heat program. In 1999, the city experienced another extremeheat event but far fewer lives were lost. While conditions in the 1999event were somewhat less severe, the city’s response measures were
Chapter 4Changes in Impacts of Climate Extremes: Human Systems and Ecosystems

259
also credited with contributing to the lower mortality (Palecki et al.,2001).
While heat waves are projected to increase in intensity and duration(Table 3-3), their net effect on human health is uncertain, largely becauseof uncertainties about the structure of cities in the future, adaptationmeasures, and access to cooling (Ebi and Meehl, 2007). Many citieshave installed heat watch warning systems. Several studies show thatthe sensitivity of the population of large US cities to extreme heatevents has been declining over time (e.g., Davis et al., 2003; Kalksteinet al., 2011).
Heat waves have other effects. There is increased likelihood of disruptionof electricity supplies during heat waves (Wilbanks et al., 2008). Airquality can be reduced, particularly if stagnant high-pressure systemsincrease in frequency and intensity (Wang and Angell, 1999).Additionally, extreme heat can reduce yields of grain crops such as cornand increase stress on livestock (Karl et al., 2009).
4.4.6.3. Drought and Wildfire
There is medium confidence in an overall slight decrease in drynesssince 1950 across the continent, with regional variability (Table 3-2).For some regions of North America, there is medium confidence inprojections of increasing dryness (Table 3-3).
Droughts are currently the third most costly category of natural disasterin the United States (Carter et al., 2008). The effects of drought includereduced water quantity and quality, lower streamflows, decreased cropproduction, ecosystem shifts, and increased wildfire risk. The severity ofimpacts of drought is related to the exposure and vulnerability ofaffected regions.
From 2000 to 2010, excluding 2003, crop losses accounted for nearly alldirect damages resulting from US droughts (NWS, 2011). Similarly,drought has had regular recurring impacts on agricultural activities inNorthern Mexico (Endfield and Tejedo, 2006). In addition to impacts oncrops and pastures, droughts have been identified as causes of regional-scale ecosystem shifts throughout southwestern North America (Allenand Breshears, 1998; Breshears et al., 2005; Rehfeldt et al., 2006).
Drought also has multiple indirect impacts in North America, althoughthey are more difficult to quantify. Droughts pose a risk to NorthAmerican power supplies due to associated reliance on sufficient watersupplies for hydropower generation and cooling of nuclear, coal, andnatural gas generation facilities (Goldstein, 2003; Wilbanks et al., 2008).Studies of water availability in heavily contested reservoir systems suchas the Colorado River Basin indicate that climate change is projected toreduce states’ abilities to meet existing agreements (Christensen et al.,2004). The effects of climate change on the reliability of the watersupply have been thoroughly explored by Barnett and Pierce (2008,2009).
Additionally, droughts and dry conditions more generally have beenlinked to increases in wildfire activity in North America. Westerling et al.(2006) found that wildfire activity in the western United States increasedsubstantially in the late 20th century and that the increase is caused byhigher temperatures and earlier snowmelt. Similarly, increases in wildfireactivity in Alaska from 1950 to 2003 have been linked to increasedtemperatures (Karl et al., 2009). Anthropogenic warming was identifiedas a contributor to increases in Canadian wildfires (Gillett et al., 2004).
In Canada, forest fires are responsible for one-third of all particulateemissions, leading to heightened incidence of respiratory and cardiacillnesses as well as mortality (Rittmaster et al., 2006). Wildfires not onlycause direct mortality, but the air pollution produces increases in eyeand respiratory illnesses (Ebi et al., 2008). The principal economic costsof wildfires include timber losses, property destruction, fire suppression,and reductions in the tourism sector (Butry et al., 2001; Morton et al., 2003).
4.4.6.4. Inland Flooding
There has been a likely increase in heavy precipitation in many areas ofNorth America since 1950 (Table 3-2), with projections suggestingfurther increases in heavy precipitation in some regions (Table 3-3).Flooding and heavy precipitation events have a variety of significantdirect and indirect human health impacts (Ebi et al., 2008). Heavyprecipitation events are strongly correlated with the outbreak ofwaterborne illnesses in the United States – 51% of waterborne diseaseoutbreaks were preceded by precipitation events in the top decile(Curriero et al., 2001). In addition, heavy precipitation events have beenlinked to North American outbreaks of vector-borne diseases such asHantavirus and plague (Engelthaler et al., 1999; Parmenter et al., 1999;Hjelle and Glass, 2000).
Beyond direct destruction of property, flooding has important negativeimpacts on a variety of economic sectors including transportation andagriculture. Heavy precipitation and field flooding in agricultural systemsdelays spring planting, increases soil compaction, and causes crop lossesthrough anoxia and root diseases; variation in precipitation is responsiblefor the majority of the crop losses (Mendelsohn, 2007). In 1993, heavyprecipitation flooded 8.2 million acres (~3.3 million ha) of AmericanMidwest soybean and corn fields, leading to a 50% decrease in corn yieldsin Iowa, Minnesota, and Missouri, and a 20 to 30% decrease in Illinois,Indiana, and Wisconsin (Changnon, 1996). Furthermore, flood impactsinclude temporary damage or permanent destruction of infrastructurefor most modes of transportation (Zimmerman and Faris, 2010). Forexample, heavy precipitation events are a very costly weather conditionfacing US rail transportation (Changnon, 2006).
4.4.6.5. Coastal Storms and Flooding
Global observed and projected changes in coastal storms and floodingare complex. Since 1950, there has been a likely increase in extreme sea
Chapter 4 Changes in Impacts of Climate Extremes: Human Systems and Ecosystems
260
level, related to trends in mean sea level. With upward trends in sealevel very likely to continue (Section 3.5.3), there is high confidence thatlocations currently experiencing coastal erosion and inundation willcontinue to do so in the future (Section 3.5.5).
North America is exposed to coastal storms, and in particular, hurricanes.2005 was a particularly severe year with 14 hurricanes (out of 27 namedstorms) in the Atlantic (NCDC, 2005). There were more than 2,000 deathsduring 2005 (Karl et al., 2009) and widespread destruction on the GulfCoast and in New Orleans in particular. Property damages exceededUS$ 100 billion (Beven et al., 2008; Pielke Jr. et al., 2008). HurricanesKatrina and Rita destroyed more than 100 oil and gas platforms in theGulf and damaged 558 pipelines, halted all oil and gas production in theGulf, and disrupted 20% of US refining capacity (Karl et al., 2009). It isreported that the direct overall losses of Hurricane Katrina were aboutUS$ 138 billion in 2007 dollars (Spranger, 2008). However, 2005 may bean outlier for a variety of reasons – the year saw storms of higher thanaverage frequency, with greater than average intensity, which mademore frequent landfall, including in the most vulnerable region of thecountry (Nordhaus, 2010). The major factor increasing the vulnerabilityand exposure of North America to hurricanes is the growth in population(see, e.g., Pielke Jr. et al., 2008) and increase in property values, particularlyalong the Gulf and Atlantic coasts of the United States. While some ofthis increase has been offset by adaptation and improved buildingcodes, Nordhaus (2010) suggests the ratio of hurricane damages tonational GDP has increased by 1.5% per year over the past half-century.However, the choice of start and end dates influences this figure.
Future sea level rise and potential increases in storm surge couldincrease inundation and property damage in coastal areas. Hoffman etal. (2010) assumed no acceleration in the current rate of sea level risethrough 2030 and found that property damage from hurricanes wouldincrease by 20%. Frey et al. (2010) simulated the combined effects ofsea level rise and more powerful hurricanes on storm surge in southernTexas in the 2080s. They found that the area inundated by storm surgecould increase from 6-25% to 60-230% across scenarios evaluated. Noadaptation measures were assumed in either study. Globally, uncertaintiesassociated with changes in tropical and extratropical cyclones meanthat a general assessment of the projected effects of storminess onfuture storm surge is not currently possible (Section 3.5.3).
4.4.7. Oceania
The region of Oceania consists of Australia, New Zealand, and severalsmall island states that are considered separately in Section 4.4.10.
4.4.7.1. Introduction
Extreme events have severe impacts in both Australia and New Zealand.In Australia, weather- and climate-related events cause around 87% ofeconomic damage due to natural disasters (storms, floods, cyclones,
earthquakes, fires, and landslides; BTE, 2001). In New Zealand, floodsand droughts are the most costly climate disasters (Hennessy et al.,2007). Economic damage from extreme weather is projected to increaseand provide challenges for adaptation (Hennessy et al., 2007).
Observed and projected trends in temperature and precipitationextremes for the region are extensively covered in Chapter 3 (e.g.,Tables 3-2 and 3-3). ENSO is a strong driver of climate variability in thisregion (see Section 3.4.2).
4.4.7.2. Temperature Extremes
During the Eastern Australian heat wave, in February 2004, temperaturesreached 48.5°C in western New South Wales. About two-thirds ofcontinental Australia recorded maximum temperatures over 39°C. Dueto heat-related stresses, the Queensland ambulance service recorded a53% increase in ambulance call-outs (Steffen et al., 2006). A week-longheat wave in Victoria in 2009 corresponded with a sharp increase indeaths in the state. For the week of the heat wave a total of 606 deathswere expected and there were a total of 980 deaths, representing a62% increase (DHS, 2009).
An increase in heat-related deaths is projected given a warming climate(Hennessy et al., 2007). In Australian temperate cities, the number ofdeaths is projected to more than double in 2020 from 1,115 per year atpresent and to increase to between 4,300 and 6,300 per year by 2050for all emission scenarios, including demographic change (McMichael etal., 2003b). In Auckland and Christchurch, a total of 14 heat-related deathsoccur per year in people aged over 65, but this number is projected torise approximately two-, three-, and six-fold for warming of 1, 2, and 3°C,respectively (McMichael et al., 2003b). An aging society in Australia andNew Zealand would amplify these figures. For example, it has beenprojected that, by 2100, the Australian annual death rate in people agedover 65 would increase from a 1999 baseline of 82 per 100,000 to arange of between 131 and 246 per 100,000 in 2100 for the scenariosexamined (SRES B2 and A2, with stabilization of atmospheric CO2 at450 ppm; Woodruff et al., 2005). In Australia, cities with a temperateclimate are expected to experience more heat-related deaths than thosewith a tropical climate (McMichael et al., 2003b).
4.4.7.3. Droughts
There is a complex pattern of observed and projected changes in drynessover the region, with increasing dryness in some areas, and decreasingdryness or inconsistent signals in others (Tables 3-2 and 3-3). However,several high-impact drought events have been recorded (OCDESC,2007).
In Australia, the damages due to the droughts of 1982-1983, 1991-1995,and 2002-2003 were US$ 2.3, 3.8, and 7.6 billion, respectively (Hennessyet al., 2007). Droughts have a negative impact on water security in the
Chapter 4Changes in Impacts of Climate Extremes: Human Systems and Ecosystems
261
Murray-Darling Basin in Australia, as it accounts for most of the waterfor irrigated crops and pastures in the country.
New Zealand has a high level of economic dependence on agriculture,and drought can cause significant disruption for this industry. The1997-1998 El Niño resulted in severe drought conditions across large areasof New Zealand with losses estimated at NZ$ 750 million (2006 values)or 0.9% of GDP (OCDESC, 2007). Severe drought in two consecutivesummers, 2007-2009, affected a large area of New Zealand and causedon-farm net income to drop by NZ$ 1.9 billion (Butcher and Ford, 2009).Drought conditions also have a serious impact on electricity production inNew Zealand where around two-thirds of supply is from hydroelectricityand low precipitation periods result in increased use of fossil fuel forelectricity generation, a maladaptation to climate change. Auckland,New Zealand’s largest city, suffered from significant water shortages inthe early 1990s, but has since established a pipeline to the WaikatoRiver to guarantee supply (OCDESC, 2007).
Climate change may cause land use change in southern Australia.Cropping could become non-viable at the dry margins if rainfallsubstantially decreases, even though yield increases from elevated CO2partly offset this effect (Luo et al., 2003).
4.4.7.4. Wildfire
Wildfires around Canberra in January 2003 caused AUS$ 400 milliondamage (Lavorel and Steffen, 2004), with about 500 houses destroyed,four people killed, and hundreds injured. Three of the city’s four waterstorage reservoirs were contaminated for several months by sediment-laden runoff (Hennessy et al., 2007). The 2009 fire in the state of Victoriacaused immense damage (see Box 4-1 and Case Study 9.2.2).
An increase in fire danger in Australia is associated with a reducedinterval between fire events, increased fire intensity, a decrease in fireextinguishments, and faster fire spread (Hennessy et al., 2007). Insoutheast Australia, the frequency of very high and extreme fire dangerdays is expected to rise 15 to 70% by 2050 (Hennessy et al., 2006). Bythe 2080s, the number of days with very high and extreme fire dangerare projected to increase by 10 to 50% in eastern areas of New Zealand,the Bay of Plenty, Wellington, and Nelson regions (Pearce et al., 2005),with even higher increases (up to 60%) in some western areas. In bothAustralia and New Zealand, the fire season length is expected to beextended, with the window of opportunity for fuel reduction burningshifting toward winter (Hennessy et al., 2007).
4.4.7.5. Intense Precipitation and Floods
There has been a likely decrease in heavy precipitation in many parts ofsouthern Australia and New Zealand (Table 3-2), while there is generallylow to medium confidence in projections due to a lack of consistencybetween models (Table 3-3).
Floods are New Zealand’s most frequently experienced hazard (OCDESC,2007) affecting both agricultural and urban areas. Being long and narrow,New Zealand is characterized by small river catchments and accordinglyshorter time-to-peak and shorter flood warning times, posing a difficultpreparedness challenge. Projected increases in heavy precipitationevents across most parts of New Zealand (Table 3-3) is expected tocause greater erosion of land surfaces, more landslides, and a decreasein the protection afforded by levees (Hennessy et al., 2007).
4.4.7.6. Storm Surges
Over 80% of the Australian population lives in the coastal zone, andoutside of the major capital cities is also where the largest populationgrowth occurs (Harvey and Caton, 2003; ABS, 2010). Over 500,000addresses are within 3 km of the coast and less than 5 m above sealevel (Chen and McAneney, 2006). As a result of being so close to sealevel, the risk of inundation from sea level rise and large storm surgesincreases with climate change (Hennessy et al., 2007). The risk of a1-in-100 year storm surge in Cairns is expected to more than double by2050 (McInnes et al., 2003). Projected changes in coastal hazards fromsea level rise and storm surge are also an issue for New Zealand (e.g.,Ministry for the Environment, 2008).
4.4.8. Open Oceans
The ocean’s huge mass in comparison to the atmosphere gives it a crucialrole in global heat budgets and chemical budgets. Possible extremeimpacts can be triggered by (1) warming of the surface ocean, with amajor cascade of physical effects, (2) ocean acidification induced byincreases in atmospheric CO2, and (3) reduction in oxygen concentrationin the ocean due to a temperature-driven change in gas solubility andphysical impacts from (1). All have potentially nonlinear multiplicativeimpacts on biodiversity and ecosystem function, and each may increasethe vulnerability of ocean systems, triggering an extreme impact(Kaplan et al., 2010; Griffith et al., 2011). Surface warming of the oceanscan itself directly impact biodiversity by slowing or preventing growth intemperature-sensitive species. One of the most well-known biologicalimpacts of warming is coral bleaching, but ocean acidification can alsoaffect coral growth rates (Bongaerts et al., 2010). The seasonal sea icecycle affects biological habitats. Such species of Arctic mammals aspolar bears, seals, and walruses depend on sea ice for habitat, hunting,feeding, and breeding. Declining sea ice can decrease polar bear numbers(Stirling and Parkinson, 2006).
4.4.9. Polar Regions
4.4.9.1. Introduction
The polar regions consist of the Arctic and the Antarctic, includingassociated water bodies. The Arctic region consists of a vast treeless
Chapter 4 Changes in Impacts of Climate Extremes: Human Systems and Ecosystems

262
permafrost territory (parts of northern Europe, northern Asia, and NorthAmerica, and several islands including Greenland). Delimitation of theArctic may differ according to different disciplinary and political definitions(ACIA, 2004). Population density in the polar regions is low, so thatimpacts of climate change and extremes on humans may not be asnoticeable as elsewhere throughout the world. The territory of theRussian Arctic is more populated than other polar regions, henceimpacts of climate change are most noticeable there as they affecthuman activities. Specific impacts of climate extremes on the naturalphysical environment in polar regions are discussed in Section 3.5.7.
4.4.9.2. Warming Cryosphere
Polar regions have experienced significant warming in recent decades.Warming has been most pronounced across the Arctic Ocean Basin andalong the Antarctic Peninsula, with significant decreases in the extentand seasonal duration of sea ice, while in contrast, temperatures overmainland Antarctica have not warmed over recent decades (Lemke etal., 2007; Trenberth et al., 2007). Sea ice serves as primary habitat formarine organisms central to the food webs of these regions. Changesin the timing and extent of sea ice can impose temporal and spatialmismatches between energy requirements and food availability formany higher trophic levels, leading to decreased reproductive success,lower abundances, and changes in distribution (Moline et al., 2008).
Warming in the Arctic may be leading to a shift of vegetation zones(e.g., Sturm et al., 2001; Tape et al., 2006; Truong et al., 2006), bringingwide-ranging impacts and changes in species diversity and distribution.
In the Russian North, the seasonal soil thawing depth has increasedoverall over the past four decades (Sherstyukov, 2009). As frozenground thaws, many existing buildings, roads, pipelines, airports, andindustrial facilities are destabilized. In the 1990s, the number ofdamaged buildings increased by 42 to 90% in comparison with the1980s in the north of western Siberia (Anisimov and Belolutskaya,2002; Anisimov and Lavrov, 2004). Arctic infrastructure faces increasedrisks of damage due to changes in the cryosphere, particularly the lossof permafrost and land-fast sea ice (SWIPA, 2011).
An apartment building collapsed in the upper part of the Kolyma RiverBasin, and over 300 buildings were severely damaged in Yakutsk as aresult of retreating permafrost (Anisimov and Belolutskaya, 2002;Anisimov and Lavrov, 2004). Changes in permafrost damage thefoundations of buildings and disrupt the operation of vital infrastructurein human settlements (Anisimov et al., 2004; see also Case Study 9.2.10).Transport options and access to resources are altered by differences inthe distribution and seasonal occurrence of snow, water, ice, andpermafrost in the Arctic. This affects both daily living and commercialactivities (SWIPA, 2011).
In conditions of land impassability, frozen rivers are often used astransport ways. In the conditions of climate warming, rivers freeze later
and melt earlier than before, and the duration of operation of transportroutes to the far north of Russia decreases with the increase in airtemperature in winter and spring (Mirvis, 1999).
Ice cover does not allow ship navigation. Navigation in the Arctic Oceanis only possible during the ice-free period off the northern coasts ofEurasia and North America. During periods of low ice concentration,ships navigate toward ice-free passages, away from multi-year ice that hasaccumulated over several years. Regional warming provides favorableconditions for sea transport going through the Northern Sea Routealong the Eurasian coasts and through the Northwest Passage in thenorth of Canada and Alaska (ACIA, 2004).
In September 2007, when the Arctic Sea ice area was extremely low, theNorthwest Passage was opened up. In Russia, this enabled service toports of the Arctic region and remote northern regions (import of fuel,equipment, food, timber, and export of timber, oil, and gas). However,owing to deglaciation in Greenland, New Land, and Northern Land, thenumber of icebergs may increase, creating navigation hazards(Roshydromet, 2005, 2008; Rignot et al., 2010, Straneo et al., 2010).
4.4.9.3. Floods
From the mid-1960s to the beginning of the 1990s, winter runoff in thethree largest rivers of Siberia (Yenisei, Lena, and Ob; jointly contributingapproximately 70% of the global river runoff to the Arctic Ocean)increased by 165 km3 (Savelieva et al., 2004).
Rivers in Arctic Russia experience floods, but their frequency, stage, andincidence are different across the region, depending on flood formationconditions. Floods on the Siberian rivers can be produced by a highpeak of the spring flood, by rare heavy rain, or by a combination ofsnow and rain, as well as by ice jams, hanging dams, and combinationsof factors (Semyonov and Korshunov, 2006).
Maximum river discharge was found to decrease from the mid-20thcentury through 1980 in Western Siberia and the Far East (except forthe Yenisei and the Lena rivers). However, since 1980, maximumstreamflow values began to increase over much of Russia (Semyonovand Korshunov, 2006).
Snowmelt and rain continue to be the most frequent cause of hazardousfloods on the rivers in the Russian Arctic (85% of all hazardous floodsin the past 15 years). Hazardous floods produced by ice jams and windtides make up 10 and 5% of the total number of hazardous floods,respectively. For the early 21st century, Pomeranets (2005) suggeststhat the probability of catastrophic wind tide-related floods and icejam-related floods increased. The damage from floods depends not onlyon their level, but also on the duration of exposure. On average, a floodlasts 5 to 10 days, but sometimes high water marks have been recordedto persist longer, for example, for 20 days or more (Semyonov andKorshunov, 2006).
Chapter 4Changes in Impacts of Climate Extremes: Human Systems and Ecosystems

263
4.4.9.4. Coastal Erosion
Coastal erosion is a significant problem in the Arctic, where coastlinesare highly variable due to environmental forcing (wind, waves, sea levelchanges, sea ice, etc.), geology, permafrost, and other elements(Rachold et al., 2005). For example, the amount of coastal erosion alonga 60 km stretch of Alaska’s Beaufort Sea doubled between 2002 and2007. Jones et al. (2009) considered contributing factors to be meltingsea ice, increasing summer sea surface temperature, sea level rise, andincreases in storm power and associated stronger ocean waves.
Increasing coastal retreat will have further ramifications for Arcticlandscapes, including losses in freshwater and terrestrial wildlife habitats,in subsistence grounds for local communities, and in disappearingcultural sites, as well as adverse impacts on coastal villages and towns.In addition, oil test wells may be impacted (Jones et al., 2009). Coastalerosion has also become a problem for residents of Inupiat and on theisland of Sarichev (Russian Federation) (Revich, 2008).
Permafrost degradation along the coast of the Kara Sea may lead tointensified coastal erosion, driving the coastline back by up to 2 to 4 mper year (Anisimov and Belolutskaya, 2002; Anisimov and Lavrov, 2004).Coastline retreat poses considerable risks for coastal population centersin Yamal and Taymyr and other littoral lowland areas.
4.4.10. Small Island States
Small Island States (SIS) in the Pacific, Indian, and Atlantic Oceans havebeen identified as being among the most vulnerable to climate changeand climate extremes (e.g., UNFCCC, 1992; DSD, 1994; UNISDR, 2005).In the light of current experience and model-based projections, SIS, withhigh vulnerability and low adaptive capacity, have substantial futurerisks (Mimura et al., 2007). Smallness renders island countries at risk ofhigh proportionate losses when impacted by a climate extreme (Pellingand Uitto, 2001; see also Case Study 9.2.9 and Box 3-4).
Sea level rise could lead to a reduction in island size (FitzGerald et al.,2008). Island infrastructure, including international airports, roads, andcapital cities, tends to predominate in coastal locations (Hess et al.,2008). Sea level rise exacerbates inundation, erosion, and other coastalhazards; threatens vital infrastructure, settlements, and facilities; andthus compromises the socioeconomic well-being of island communitiesand states (Hess et al., 2008).
In 2005, regionally averaged temperatures were the warmest in thewestern Caribbean for more than 150 years (Eakin et al., 2010). Theseextreme temperatures caused the most severe coral bleaching everrecorded in the Caribbean: more than 80% of the corals surveyed werebleached, and at many sites more than 40% died. Recovery from suchlarge-scale coral mortality is influenced by the extent to which coralreef health has been compromised and the frequency and severity ofsubsequent stresses to the system.
Since the early 1950s, when the quality of disaster monitoring andreporting improved in the Pacific Islands region, there has been ageneral increasing trend in the number of disasters reported annually(Hay and Mimura, 2010).
Pacific Island Countries and Territories (PICs) exhibit a variety ofcharacteristics rendering generalization difficult (see Table 4-2;Campbell, 2006). One form of PICs is large inter-plate boundary islandsformed by subduction and found in the southwest Pacific Ocean. Thesemay be compared to the Oceanic (or intra-plate) islands which were, orare being, formed over ‘hot spots’ in the Earth’s mantle into volcanichigh islands. Some of these are still being formed and some are heavilyeroded with steep slopes and barrier reefs. Another form of PICs isatolls that consist of coral built on submerging former volcanic highislands, through raised limestone islands (former atolls stranded abovecontemporary sea levels). Each island type has specific characteristics inrelation to disaster risk reduction, with atolls being particularly vulnerableto tropical cyclones, where storm surges can completely inundate themand there is no high ground to which people may escape. In contrast,the inter-plate islands are characterized by large river systems and fertileflood plains in addition to deltas, both of which tend to be heavilypopulated. Fatalities in many of the worst weather- and climate-relateddisasters in the region have been mostly from river flooding (AusAID,2005). Raised atolls are often saved from the storm surge effects of
Chapter 4 Changes in Impacts of Climate Extremes: Human Systems and Ecosystems
90,5 x 244,4
Island Type Exposure to climate risks
Plate-Boundary Islands • Large land area • High elevations • High biodiversity • Well-developed soils • River flood plains • Orographic rainfall
These islands are located in the western Pacific. River flooding is more likely to be a problem than in other island types. In Papua New Guinea, high elevations expose areas to frost (extreme during El Niño). Most major settlements are on the coast and exposed to storm damage.
Intra-Plate (Oceanic) Islands Volcanic High Islands
• Steep slopes • Different stages of erosion • Barrier reefs • Relatively small land area • Less well-developed river systems • Orographic rainfall
Because of size these islands have substantial exposure to tropical cyclones, which cause the most damage in coastal areas and catchments. Streams and rivers are subject to flash flooding. Most islands are exposed to drought. Barrier reefs may ameliorate storm surge and tsunamis.
Atolls • Very small land areas • Very low elevations • No or minimal soil • Small islets surround a lagoon • Shore platform on windward side • Larger islets on windward side • No surface (fresh) water • Ghyben Herzberg (freshwater) lens • Convectional rainfall
These islands are exposed to storm surge, ‘king’ tides, and high waves. They are exposed to freshwater shortages and drought. Freshwater limitations may lead to health problems.
Raised Limestone Islands • Steep outer slopes • Concave inner basin • Sharp karst topography • Narrow coastal plains • No surface water • No or minimal soil
Depending on height these islands may be exposed to storm surges and wave damage during cyclones and storms. They are exposed to freshwater shortages and drought. Freshwater problems may lead to health problems.
Table 4-2 | Pacific Island type and exposure to climate extremes. Adapted fromCampbell, 2006.
264
tropical cyclones, but during Cyclone Heta that struck Niue in 2004, thecliffs were unable to provide protection.
Drought is a hazard of considerable importance in SIS. In particular,atolls have very limited water resources, being dependent on theirfreshwater lens, whose thickness decreases with sea level rise (e.g.,Kundzewicz et al., 2007), floating above sea water in the pervious coral,and is replenished by convectional rainfall. During drought events,water shortages in SIS become acute on atolls in particular, resulting inrationing in some cases (Campbell, 2006).
The main impacts from climatic extremes in PICs are damage tostructures, infrastructure, and crops during tropical cyclones and cropdamage and water supply shortages during drought events. On atolls,salinization of the freshwater lens and garden areas is a serious problemfollowing storm surges, high wave events, and ‘king’ tides (Campbell,2006).
4.5. Costs of Climate Extremes and Disasters
The following section focuses on the economic costs imposed by climateextremes and disasters on humans, societies, and ecosystems and the costsof adapting to the impacts. Cost estimates are composed of observedand projected economic impacts, including economic losses, futuretrends in extreme events and disasters in key regions, and the costs ofadaptation. The section stands at the interface between chapters, usingthe conceptual framework of Chapters 1 and 2 and the scientificfoundation of Chapter 3 and earlier subsections in this chapter, andleading into the following Chapters 5 through 9.
4.5.1. Framing the Costs of Extremes and Disasters
The economic costs associated with climate extremes and disasters can besubdivided into impact or damage costs (or simply losses) and adaptationcosts. Costs arise due to economic, social, and environmental impacts ofa climate extreme or disaster and adaptation to those impacts in keysectors. Residual damage costs are the impact and damage costs afterall desirable and practical adaptation actions have been implemented.Conceptually, comparing costs of adaptation with damages beforeadaptation and residual damages can help in assessing the economicefficiency of adaptation (Parry et al., 2009).
The impact of climate extremes and disasters on economies, societies,and ecosystems can be measured as the damage costs and losses ofeconomic assets or stocks, as well as consequential indirect effects oneconomic flows, such as on GDP or consumption. In line with generaldefinitions in Chapters 1 and 2, economic disaster risk may be definedas a probability distribution indicating potential economic damage costsand associated return periods. The cost categories of direct, indirect, andintangible are rarely fully exclusive, and items or activities can haveelements in all categories.
Direct damage costs or losses are often defined as those that are adirect consequence of the weather or climate event (e.g., floods,windstorms, or droughts). They refer to the costing of the physicalimpacts of climate extremes and disasters – on the lives and health ofdirectly affected persons; on all types of tangible assets, includingprivate dwellings, and agricultural, commercial, and industrial stocks andfacilities; on infrastructure (e.g., transport facilities such as roads, bridges,and ports, energy and water supply lines, and telecommunications); onpublic facilities (e.g., hospitals, schools); and on natural resources(ECLAC, 2003; World Bank, 2010).
Indirect impact costs generally arise due to the disruption of the flowsof goods and services (and therefore economic activity) because of adisaster, and are sometimes termed consequential or secondary impactsas the losses typically flow from the direct impact of a climate event(ECLAC, 2003; World Bank, 2010). Indirect damages may be caused bythe direct damages to physical infrastructure or sources of livelihoods,or because reconstruction pulls resources away from production.Indirect damages include additional costs incurred from the need to usealternative and potentially inferior means of production and/or distributionof normal goods and services (Cavallo and Noy, 2010). For example,electricity transmission lines may be destroyed by wind, a direct impact,causing a key source of employment to cease operation, putting manypeople out of work, and in turn creating other problems that can beclassified as indirect impacts. These impacts can emerge later in theaffected location, as well as outside the directly affected location (Pellinget al., 2002; ECLAC, 2003; Cavallo and Noy, 2010). Indirect impactsinclude both negative and positive factors – for example, transportdisruption, mental illness or bereavement resulting from disaster shock,rehabilitation, health costs, and reconstruction and disaster-proofinvestment, which can include changes in employment in a disaster-hitarea (due to reconstruction and other recovery activity) or additionaldemand for goods produced outside of a disaster-affected area (ECLAC,2003; World Bank, 2010). As another example, long-running droughtscan induce indirect losses such as local economic decline, out-migration,famine, the partial collapse of irrigation areas, or loss of livelihoodsdependent on hydroelectricity or rain-fed agriculture. It is important tonote that impacts on the informal or undocumented economy may bevery important in some areas and sectors, but are generally not countedin reported estimates of losses.
Many impacts, such as loss of human lives, cultural heritage, andecosystem services, are difficult to measure as they are not normallygiven monetary values or bought and sold, and thus they are also poorlyreflected in estimates of losses. These items are often referred to asintangibles in contrast to tangibles such as tradable assets, structures,and infrastructure (Handmer et al., 2002; Pelling et al., 2002; Benson andClay, 2003; ECLAC, 2003; Cavallo and Noy, 2010; World Bank, 2010).
Adaptation costs are those associated with adaptation and facilitationin terms of planning (e.g., developing appropriate processes includingkey stakeholders), actual adaptation (e.g., risk prevention, preparedness,and risk financing), reactive adaptation (e.g., emergency disaster responses,
Chapter 4Changes in Impacts of Climate Extremes: Human Systems and Ecosystems

265
rehabilitation, and reconstruction), and finally the implementation ofadaptation measures (including transition costs) (Smit et al., 2001; alsosee the Glossary). The benefits of adaptation can generally be assessedas the value of avoided impacts and damages as well as the co-benefitsgenerated by the implementation of adaptation measures (Smit et al.,2001). The value of all avoidable damage can be taken as the gross (ortheoretically maximum) benefit of adaptation and risk management,which may be feasible to adapt to but not necessarily economically efficient(Pearce et al., 1996; Tol, 2001; Parry et al., 2009). The adaptation deficitis identified as the gap between current and optimal levels of adaptationto climate change (Burton and May, 2004). However, it is difficult toassess the optimal adaptation level due to the uncertainties inherent inclimate scenarios, the future patterns of exposure and vulnerability toclimate events, and debates over methodological issues such as discountrates. In addition, as social values and technologies change, what isconsidered avoidable also changes, adding additional uncertainty tofuture projections.
4.5.2 Extreme Events, Impacts, and Development
The relationship between socioeconomic development and disasters,including those triggered by climatic events, has been explored by anumber of researchers over the last few years using statisticaltechniques and numerical modeling approaches. It has been suggestedthat natural disasters exert adverse impacts on the pace and nature ofeconomic development (Benson and Clay, 1998, 2003; Kellenberg andMobarak, 2008). (The ‘poverty trap’ created by disasters is discussed inChapter 8.) A growing literature has emerged that identifies theseimportant adverse macroeconomic and developmental impacts of naturaldisasters (Cuny, 1983; Otero and Marti, 1995; Benson and Clay, 1998,2000, 2003, 2004; Charveriat, 2000; Crowards, 2000; ECLAC, 2003;Mechler, 2004; Raddatz, 2009; Noy, 2009; Okuyama and Sahin, 2009;Cavallo and Noy, 2010). Yet, confidence in the adverse economicimpacts of natural disasters is only medium, as, although the bulk ofstudies identify negative effects of disasters on shorter-term economicgrowth (up to three years after an event), others find positive effects(Albala-Bertrand, 1993; Skidmore and Toya, 2002; Caselli and Malhotra,2004; see Section 4.2). Differences can be partly explained by the lackof a robust counterfactual in some studies (e.g., what would GDP havebeen if a disaster had not occurred?), failure to account for the informalsector, varying ways of accounting for insurance and aid flows, differentpatterns of impacts resulting from, for example, earthquakes versusfloods, and the fact that national accounting does not record thedestruction of assets, but reports relief and reconstruction as additionsto GDP (World Bank and UN, 2010). In terms of longer-run economicgrowth (beyond three years after events), there are mixed findings withthe exception of very severe disasters, which have been found to setback development (World Bank and UN, 2010).
In terms of the nexus between development and disaster vulnerability,researchers argue that poorer developing countries and smallereconomies are more likely to suffer more from future disasters than
developed countries, especially in relation to extreme impacts(Hallegatte et al., 2007; Heger et al., 2008; Hallegatte and Dumas, 2009;Loayza et al., 2009; Raddatz, 2009). In general, the observed or modeledrelationship between development and disaster impacts indicates thata wealthier country is better equipped to manage the consequences ofextreme events by reducing the risk of impacts and by managing theimpacts when they occur. This is due (inter alia) to higher income levels,more governance capacity, higher levels of expertise, amassed climate-proof investments, and improved insurance systems that can act totransfer costs in space and time (Wildavsky, 1988; Albala-Bertrand,1993; Burton et al., 1993; Tol and Leek, 1999; Mechler, 2004;Rasmussen, 2004; Brooks et al., 2005; Kahn, 2005; Toya and Skidmore,2007; Raschky, 2008; Noy, 2009). While the countries with highestincome account for most of the total economic and insured losses fromdisasters (Swiss Re, 2010), in developing countries there are higherfatality rates and the impacts consume a greater proportion of GDP. Thisin turn imposes a greater burden on governments and individuals indeveloping countries. For example, during the period from 1970 to 2008over 95% of deaths from natural disasters occurred in developingcountries (Cavallo and Noy, 2010; CRED, 2010). From 1975 to 2007,Organisation for Economic Co-operation and Development (OECD)countries accounted for 71.2% of global total economic losses fromtropical cyclones, but only suffered 0.13% of estimated annual loss ofGDP (UNISDR, 2009).
There is general consensus that, as compared to developed countries,developing countries are more economically vulnerable to climateextremes largely because: (i) developing countries have less resilienteconomies that depend more on natural capital and climate-sensitiveactivities (cropping, fishing, etc.; Parry et al., 2007); (ii) they are oftenpoorly prepared to deal with the climate variability and physical hazardsthey currently face (World Bank, 2000); (iii) more damages are causedby maladaptation due to the absence of financing, information, andtechniques in risk management, as well as weak governance systems;(iv) there is generally little consideration of climate-proof investment inregions with a fast-growing population and asset stocks (such as in coastalareas) (IPCC, 2001; Nicholls et al., 2008); (v) there is an adaptation deficitresulting from the low level of economic development (World Bank,2007) and a lack of ability to transfer costs through insurance and fiscalmechanisms; and vi) they have large informal sectors. However, in somecases like Hurricane Katrina in New Orleans, United States, developedcountries also suffer severe disasters because of social vulnerability andinadequate disaster protection (Birch and Wachter, 2006; Cutter andFinch, 2008).
While some literature has found that the relationship between incomeand some natural disaster consequences is nonlinear (Kellenberg andMobarak, 2008; Patt et al., 2010), much empirical evidence supports anegative relationship between the relative share of GDP and fatalities,with fatalities from hydrometeorological extreme events falling withrising level of income (Kahn, 2005; Toya and Skidmore, 2007; WorldBank and UN, 2010). Some emerging developing countries, such as China,India, and Thailand, are projected to face increased future exposure to
Chapter 4 Changes in Impacts of Climate Extremes: Human Systems and Ecosystems

266
extremes, especially in highly urbanized areas, as a result of the rapidurbanization and economic growth in those countries (Bouwer et al.,2007; Nicholls et al., 2008).
It should also be noted that in a small country, a disaster can directlyaffect much of the country and therefore the magnitude of losses andrecovery demands can be extremely high relative to GDP and publicfinancial resources (Mechler, 2004). This is particularly the case in theevent of multiple and/or consecutive disasters in short periods. Forexample, in Fiji, consecutive natural disasters have resulted in reducednational GDP as well as decreased socioeconomic development ascaptured by the Human Development Index (HDI) (Lal, 2010). In Mexico,natural disasters resulted in the HDI regressing by approximately twoyears and in an increase in poverty levels (Rodriguez-Oreggia et al., 2010).Patt et al. (2010) indicated that vulnerability in the least-developedcountries will rise most quickly, which implies an urgent need forinternational assistance.
Costs and impacts not only vary among developing and developedcountries, but also between and within countries, regions, local areas,sectors, systems, and individuals due to the heterogeneity of vulnerabilityand resilience (see Chapter 2). Some individuals, sectors, and systemswould be less affected, or may even benefit, while other individuals,sectors, and systems may suffer significant losses in the same event.In general, the poorest and those who are socially or economicallymarginalized will be the most at risk in terms of being exposed andvulnerable (Wisner et al., 2004). For example, women and children arefound to be more vulnerable to disasters in many countries, with largerdisasters having an especially unequal impact (Neumayer and Plümper,2007).
4.5.3. Methodologies for Evaluating Impact andAdaptation Costs of Extreme Events and Disasters
4.5.3.1. Methods and Tools for Costing Impacts
Direct, tangible impacts are comparatively easy to measure, but costingapproaches are not necessarily standardized and assessments are oftenincomplete, which can make aggregation and comparability across theliterature difficult. In some countries, flood impact assessment has longbeen standardized, for example, in Britain and parts of the United States(e.g., Handmer et al., 2002). Intangible losses can generally be estimatedusing valuation techniques such as loss of life/morbidity (usuallyestimated using value of statistical life benchmarks), replacement value,benefits transfer, contingent evaluation, travel cost, hedonic pricingmethods, and so on (there is a vast literature on this subject, e.g.,Handmer et al., 2002; Carson et al., 2003; Pagiola et al., 2004; Readyand Navrud, 2006; TEEB, 2009). Yet, assessing the intangible impacts ofextremes and disasters in the social, cultural, and environmental fieldsis more difficult, and there is little agreement on methodologies (Albala-Bertrand, 1993; Tol, 1995; Hall et al., 2003; Huigen and Jens, 2006;Schmidt et al., 2009).
Studies and reports on the economic impacts of extremes, such asinsurance or post-disaster reports, have mostly focused on direct andtangible losses, such as on impacts on produced capital and economicactivity. Intangibles such as loss of life and impacts on the naturalenvironment are generally not considered using monetary metrics (Parryet al., 2009). Loss of life due to natural disasters, including futurechanges, is accounted for in some studies (e.g., BTE, 2001; Jonkman,2007; Jonkman et al., 2008; Maaskant et al., 2009). Estimates of impactsthat account for tangibles and intangibles are expected to be muchlarger than those that consider tangible impacts only (Handmer et al.,2002; Parry et al., 2009). Potential impacts include all direct, indirect,and intangible costs, including the losses from public goods and naturalcapital (in particular ecosystem services), as well as the longer-termeconomic impact of disasters. Indirect impacts and intangible impactscan outweigh those of direct impacts. There will therefore often be alarge gap between potential impacts and the estimates from studiesthat consider only direct impacts.
Indirect economic loss assessment methodologies exist but produceuncertain and method-dependent results. Such assessments atnational, regional, and global levels fall into two categories: a ‘topdown’ approach that uses models of the whole economy understudy, and a bottom-up or partial equilibrium approach that identifiesand values changes in specific parts of an economy (van der Veen,2004).
The top-down approach is grounded in macroeconomics under which theeconomy is described as an ensemble of interacting economic sectors.Most studies have focused on impact assessment remodeling actualevents in the past and aim to estimate the various, often hidden follow-on impacts of disasters (e.g., Ellson et al., 1984; Yezer and Rubin, 1987;Guimaraes et al., 1993; West and Lenze, 1994; Brookshire et al., 1997;Hallegatte et al., 2007; Rose 2007). Existing macroeconomic or top-down approaches utilize a range of models such as the Input-Output,Social Accounting Matrix multiplier, Computable General Equilibriummodels, economic growth frameworks, and simultaneous-equationeconometric models. These models attempt to capture the impact of theextreme event as it is felt throughout the whole economy. Only a fewmodels have aimed at representing extremes in a risk-based frameworkin order to assess the potential impacts of events and their probabilitiesusing a stochastic approach, which is desirable given the fact that extremeevents are non-normally distributed and the tails of the distributionmatter (Freeman et al., 2002; Mechler, 2004; Hallegatte and Ghil, 2007;Hallegatte, 2008).
The bottom-up approach, derived from microeconomics, scales up datafrom sectors at the regional or local level to aggregate an assessmentof disaster costs and impacts (see van der Veen, 2004). The bottom-upapproach to disaster impact assessment attempts to evaluate the impactof an actual or potential disaster on consumers’ willingness to pay (orwillingness to accept). This approach values direct loss of or damage toproperty, as well as that of the interruption to the economy, impacts onhealth and well-being, and impacts on environmental amenity and
Chapter 4Changes in Impacts of Climate Extremes: Human Systems and Ecosystems

267
ecosystem services. In short, it attempts to value the impact of thedisaster on society.
Overall, measuring the many effects of disasters is problematic, prone toboth overestimation (for example, double counting) and underestimation(because it is difficult to value loss of life or damage to the environment).Both over- and underestimation can be issues in different parts of the sameimpact assessment, for example, ecological and quality of life impacts maybe ignored, while double counting occurs in the measurement of indirectimpacts. As discussed earlier in this section, most large-scale estimatesleave out significant areas of cost and are therefore underestimates.Biases also affect the accuracy of estimates; for example, the prospectof aid may create incentives to inflate losses. How disaster impacts areevaluated depends on numerous factors, such as the types of impactsbeing evaluated, the objective of the evaluation, the spatial and temporalscale under consideration, and importantly, the information, expertise,and data available. In practice, the great majority of post-disasterimpact assessments are undertaken pragmatically using whatever dataand expertise are available. Many studies utilize both partial and generalequilibrium analysis in an ‘integrated assessment’ that attempts to captureboth the bottom-up and the economy-wide impacts of disasters (Ciscar,2009; World Bank, 2010).
4.5.3.2. Methods and Tools for Evaluating the Costs of Adaptation
Over the last few years, a wide range of methodologies using differentmetrics, time periods, and assumptions has been developed and appliedfor assessing adaptation costs and benefits. However, much of theliterature remains focused on gradual changes such as sea level rise andeffects on agriculture (IPCC, 2007). Extreme events are generallyrepresented in an ad hoc manner using add-on damage functions basedon averages of past impacts and contingent on gradual temperatureincrease (see comment in Nordhaus and Boyer, 2000). In a review ofexisting literature, Markandya and Watkiss (2009) identify the followingtypes of analyses: investment and financial flows; impact assessments(scenario-based assessments); vulnerability assessments; adaptationassessments; risk management assessments; economic integratedassessment models; multi-criteria analysis; computable generalequilibrium models; cost-benefit analysis; cost effectiveness analysis;and portfolio/real options analysis.
Global and regional assessments of adaptation costs, the focus of thissection, have essentially used two approaches: (1) determining thepure financial costs, that is, outlays necessary for specific adaptationinterventions (known as investment and financial flow analyses); and(2) economic costs involving estimating the wider overall costs andbenefits to society and comparing this to mitigation, often usingIntegrated Assessment Models (IAMs). The IAM approach leads to abroader estimate of costs (and benefits) over long time scales, butrequires detailed models of the economies under study (UNFCCC,2007). One way of measuring the costs of adaptation involves firstestablishing a baseline development path (for a country or all countries)
with no climate change, and then altering the baseline to take intoaccount the impacts of climate change (World Bank, 2010). Then thepotential effects of various adaptation strategies on development orgrowth can be examined. Adaptation cost estimates are based onvarious assumptions about the baseline scenario and the effectivenessof adaptation measures. The difference between these assumptionsmakes it very difficult to compare or aggregate results (Yohe et al.,1995, 1996; West et al., 2001).
An example illustrating methodological challenges comes from agriculture,where estimates have been made using various assumptions aboutadaptation behavior (Schneider et al., 2000). These assumptions aboutbehavior range from the farmers who do not react to observed changes inclimate conditions (especially in studies that use crop yield sensitivity toweather variability) (Deschênes and Greenstone, 2007; Lobell et al., 2008;Schlenker and Lobell, 2010), to the introduction of selected adaptationmeasures within crop yield models (Rosenzweig and Parry, 1994), to theassumption of ‘perfect’ adaptation – that is, farmers have complete or‘perfect’ knowledge and apply that knowledge in ways that ensureoutcomes align exactly with theoretical predictions (Kurukulasuriya andMendelsohn, 2008a,b; Seo and Mendelsohn, 2008). Realistic assessmentsfall between these extremes, and a realistic representation of futureadaptation patterns depends on the in-due-time detection of the climatechange signal (Schneider et al., 2000; Hallegatte, 2009); the inertia inadoption of new technologies (Reilly and Schimmelpfennig, 2000); theexistence of price signals (Fankhauser et al., 1999); and assessments ofplausible behavior by farmers.
Cost-benefit analysis (CBA) is an established tool for determining theeconomic efficiency of development interventions. CBA compares thecosts of conducting such projects with their benefits and calculates thenet benefits or economic efficiency (Benson and Twigg, 2004). Ideally CBAaccounts for all costs and benefits to society including environmentalimpacts, not just financial impacts on individual businesses. All costsand benefits are monetized so that tradeoffs can be compared with acommon measure. The fact that intangibles and other items that aredifficult to value are often left out is one of the major criticisms of theapproach (Gowdy, 2007). In the case of disaster risk reduction (DRR)and adaptation interventions, CBA weighs the costs of the DRR projectagainst the disaster damage costs avoided. While the benefits createdby development interventions are the additional benefits due to, forexample, improvements in physical or social infrastructure, in DRR thebenefits are mostly the avoided or reduced potential damages and losses(Smyth et al., 2004). The net benefit can be calculated in terms of netpresent value, the rate of return, or the benefit-cost ratio. OECDcountries such as the United Kingdom and the United States, as well asinternational financial institutions such as the World Bank, AsianDevelopment Bank, and Inter-American Development Bank, have usedCBA for evaluating disaster risk management (DRM) in the context ofdevelopment assistance (Venton and Venton, 2004; Ghesquiere et al.,2006) and use it routinely for assessing engineering DRM strategiesdomestically. CBA can be, and has been, applied at any level from theglobal to local (see Kramer, 1995; Benson and Twigg, 2004; Venton and
Chapter 4 Changes in Impacts of Climate Extremes: Human Systems and Ecosystems

268
Venton, 2004; UNFCCC, 2007; Mechler, 2008). Because the chance ofoccurrence of a disaster event can be expressed as a probability, itfollows that the benefits of reducing the impact of that event can beexpressed in probabilistic terms. Costs and benefits should be calculatedby multiplying probability by consequences; this leads to risk estimatesthat account for hazard intensity and frequency, vulnerability, andexposure (Smyth et al., 2004; Ghesquiere et al., 2006).
National-level studies of adaptation effectiveness in the EuropeanUnion, the United Kingdom, Finland, and The Netherlands, as well as ina larger number of developing countries using the National AdaptationProgramme of Action approach, have been conducted or are underway(Ministry of Agriculture and Forestry, 2005; DEFRA, 2006; Lemmen et al.,2008; de Bruin et al., 2009; Parry et al., 2009). Yet the evidence base onthe economic aspects including economic efficiency of adaptationremains limited and fragmented (Adger et al., 2007; Moench et al.,2007; Agrawala and Fankhauser, 2008; Parry et al., 2009). As noted atthe start of Section 4.5.3.2, many adaptation studies focus on gradualchange, especially for agriculture. Those studies considering extremeevents, and finding or reporting net benefits over a number of keyoptions (Agrawala and Fankhauser, 2008; Parry et al., 2009), do so bytreating extreme events similarly to gradual onset phenomena andusing deterministic impact metrics, which is problematic for disasterrisk. A recent, risk-focused study (ECA, 2009) concentrating on nationaland sub-national levels went so far as to suggest an adaptation costcurve, which organizes relevant adaptation options around their cost-benefit ratios. However, given available data including future projectionsof risk and the effectiveness of options, this is probably at most heuristicrather than a basis for policy.
There are several complexities and uncertainties inherent in the estimatesrequired for a CBA of DRR. As these are compounded by climate change,CBA’s utility in evaluating adaptation may be reduced. These includedifficulties in handling intangibles and, as is particularly important forextremes, in the discounting of future impacts; CBA does not accountfor the distribution of costs and benefits or the associated equity issues.Moench et al. (2007) argue that CBA is most useful as a decision supporttool that helps the policymaker categorize, organize, assess, and presentinformation on the costs and benefits of a potential project, rather thangive a definite answer. Overall, the applicability of rigorous CBAs forevaluations of adaptation is thus limited based on limited evidence andmedium agreement.
4.5.3.3. Attribution of Impacts to Climate Change:Observations and Limitations
Attribution of the impacts of climate change can be defined and used in away that parallels the well-developed applications for the physical climatesystem (IPCC, 2010). Detection is the process of demonstrating that asystem affected by climate has changed in some defined statisticalsense, without providing a reason for that change. Attribution isthe process of establishing the most probable causes, natural or
anthropogenic, for the detected change with some defined level ofconfidence.
The IPCC Working Group II Fourth Assessment Report found, with veryhigh confidence, that observational evidence shows that biologicalsystems on all continents and in most oceans are already being affectedby recent climate changes, particularly regional temperature increases(Rosenzweig et al., 2007).
Attribution of changes in individual weather and climate events toanthropogenic forcing is complicated because any such event mighthave occurred by chance in an unmodified climate as a result of naturalclimate variability (see FAQ 3.2). An approach that addresses this problemis to look at the likelihood of such an event occurring, rather than theoccurrence of the event itself (Stone and Allen, 2005). For example,human-induced changes in mean temperature have been shown toincrease the likelihood of extreme heat waves (Meehl and Tebaldi, 2004;Stott et al., 2004). For a large region of continental Europe, Stott et al.(2004) showed that anthropogenic climate change very likely doubledthe probability of surpassing a mean summer temperature not exceededsince advent of the instrumental record in 1851, but which was by the2003 event in Europe. More recent work provides further support forsuch a linkage (Barriopedro et al., 2011; see Section 3.3.1).
Most published studies on the attribution of impacts of extremes tonatural and anthropogenic climate change have focused on long-termrecords of disaster losses, or examine the likelihood of the event occurring.Most published effort has gone into the analysis of long-term disasterloss records.
There is high confidence, based on high agreement and mediumevidence, that economic losses from weather- and climate-relateddisasters have increased (Cutter and Emrich, 2005; Peduzzi et al., 2009,2011; UNISDR, 2009; Mechler and Kundzewicz, 2010; Swiss Re 2010;Munich Re, 2011). A key question concerns whether trends in suchlosses, or losses from specific events, can be attributed to climatechange. In this context, changes in losses over time need to becontrolled for exposure and vulnerability. Most studies of long-termdisaster loss records attribute these increases in losses to increasingexposure of people and assets in at-risk areas (Miller et al., 2008;Bouwer, 2011), and to underlying societal trends – demographic,economic, political, and social – that shape vulnerability to impacts(Pielke Jr. et al., 2005; Bouwer et al., 2007). Some authors suggest thata (natural or anthropogenic) climate change signal can be found in therecords of disaster losses (e.g., Mills, 2005; Höppe and Grimm, 2009),but their work is in the nature of reviews and commentary rather thanempirical research. Attempts have been made to normalize loss recordsfor changes in exposure and wealth. There is medium evidence and highagreement that long-term trends in normalized losses have not beenattributed to natural or anthropogenic climate change (Choi and Fisher,2003; Crompton and McAneney, 2008; Miller et al., 2008; Neumayerand Barthel, 2011). The evidence is medium because of the issues setout toward the end of this section.
Chapter 4Changes in Impacts of Climate Extremes: Human Systems and Ecosystems
269
The statement about the absence of trends in impacts attributableto natural or anthropogenic climate change holds for tropical andextratropical storms and tornados (Boruff et al., 2003; Pielke Jr. et al.,2003, 2008; Raghavan and Rajesh, 2003; Miller et al 2008; Schmidt et al.,2009; Zhang et al., 2009; see also Box 4-2). Most studies related increasesfound in normalized hurricane losses in the United States since the1970s (Miller et al., 2008; Schmidt et al., 2009; Nordhaus, 2010) to thenatural variability observed since that time (Miller et al., 2008; Pielke Jr. etal., 2008). Bouwer and Botzen (2011) demonstrated that other normalizedrecords of total economic and insured losses for the same series ofhurricanes exhibit no significant trends in losses since 1900.
The absence of an attributable climate change signal in losses also holdsfor flood losses (Pielke Jr. and Downton, 2000; Downton et al., 2005;Barredo, 2009; Hilker et al., 2009), although some studies did find recentincreases in flood losses related in part to changes in intense rainfallevents (Fengqing et al., 2005; Chang et al., 2009). For precipitation-related events (intense rainfall, hail, and flash floods), the picture ismore diverse. Some studies suggest an increase in damages related toa changing incidence in extreme precipitation (Changnon, 2001, 2009),although no trends were found for normalized losses from flash floodsand landslides in Switzerland (Hilker et al., 2009). Similarly, a study ofnormalized damages from bushfires in Australia also shows that increasesare due to increasing exposure and wealth (Crompton et al., 2010).
Increasing exposure of people and economic assets has been the majorcause of long-term increases in economic losses from weather- andclimate-related disasters (high confidence). The attribution of economicdisaster losses is subject to a number of limitations in studies to date:data availability (most data are available for standard economic sectorsin developed countries); type of hazards studied (most studies focus oncyclones, where confidence in observed trends and attribution ofchanges to human influence is low; Section 3.4.4); and the processesused to normalize loss data over time. Different studies use differentapproaches to normalization, and most normalization approaches takeaccount of changes in exposure of people and assets, but use only limited,if any, measures of vulnerability trends, which is questionable. Differentapproaches are also used to handle variations in the quality andcompleteness of data on impacts over time. Finding a trend or ‘signal’in a system characterized by large variability or ‘noise’ is difficult andrequires lengthy records. These are all areas of potential weakness inthe methods and conclusions of longitudinal loss studies and moreempirical and conceptual efforts are needed. Nevertheless, the results ofthe studies mentioned above are strengthened as they show similarresults, although they have applied different data sets and methodologies.
A general area of uncertainty in the studies concerns the impacts ofweather and climate events on the livelihoods and people of informalsettlements and economic sectors, especially in developing countries.Some one billion people live in informal settlements (UNISDR, 2011),and over half the economy in some developing countries is informal(Schneider et al., 2010). These impacts have not been systematicallydocumented, with the result that they are largely excluded from both
longitudinal impact analysis and attribution to defined weatherepisodes.
Another general area of uncertainty comes from confounding factorsthat can be identified but are difficult to quantify, and relates to theusual assumption of constant vulnerability in studies of loss trends.These include factors that would be expected to increase resilience(Chapters 2 and 5 of this report) and thereby mask the influence ofclimate change, and those that could act to increase the impact ofclimate change. Those that could mask the effects of change includegradual improvements in warnings and emergency management (Adgeret al., 2005), building regulations (Crichton, 2007), and changinglifestyles (such as the use of air conditioning), and the almost instantmedia coverage of any major weather extreme that may help reducelosses. In the other direction are changes that may be increasing risk,such as the movement of people in many countries to coastal areasprone to cyclones (Pompe and Rinehart, 2008) and sea level rise.
4.5.4. Assessment of Impact Costs
Much work has been conducted on the analysis of direct economic lossesfrom natural disasters. The examples mentioned below mainly focus onnational and regional economic losses from particular climate extremesand disasters, and also discuss uncertainty issues related to the assessmentof economic impacts.
4.5.4.1. Estimates of Global and Regional Costs of Disasters
Observed trends in extreme impacts: Data on global weather- andclimate-related disaster losses reported since the 1960s reflect mainlymonetized direct damages to assets, and are unequally distributed.Estimates of annual losses have ranged since 1980 from a few US$billion to above 200 billion (in 2010 dollars) for 2005 (the year ofHurricane Katrina) (UNISDR, 2009; Swiss Re 2010; Munich Re, 2011).These estimates do not include indirect and intangible losses.
On a global scale, annual material damage from large weather andclimate events has been found to have increased eight-fold between the1960s and the 1990s, while the insured damage has been found to haveincreased by 17-fold in the same interval, in inflation-adjusted monetaryunits (Mechler and Kundzewicz, 2010). Between 1980 and 2004, thetotal costs of extreme weather events totaled US$ 1.4 trillion, of whichonly one-quarter was insured (Mills, 2005). Material damages caused bynatural disasters, mostly weather- and water-related, have increasedmore rapidly than population or economic growth, so that these factorsalone may not fully explain the observed increase in damage. The lossof life has been brought down considerably (Mills, 2005; UNISDR, 2011).
Developing regions are vulnerable both because of exposure toweather- and climate-related extremes and their status as developingeconomies. However, disaster impacts are unevenly distributed by type of
Chapter 4 Changes in Impacts of Climate Extremes: Human Systems and Ecosystems

270
disaster, region, country, and the exposure and vulnerability of differentcommunities and sectors.
Percentage of direct economic losses by regions: The concentration ofinformation on disaster risk generally is skewed toward developedcountries and the Northern Hemisphere (World Bank and UN, 2010).Some global databases, however, do allow a regional breakdown ofdisaster impacts. The unequal distribution of the human impact of naturaldisasters is reflected in the number of disasters and losses across regions(Figure 4-7). In the period 2000 to 2008, Asia experienced the highestnumber of weather- and climate-related disasters. The Americas sufferedthe most economic loss, accounting for the highest proportion (54.6%)of total loss, followed by Asia (27.5%) and Europe (15.9%). Africaaccounted for only 0.6% of global economic losses, but economic damagesfrom natural disasters are underreported in these data compared toother regions (Vos et al., 2010). Although reporting biases exist, they arejudged to provide robust evidence of the regional distribution of thenumber of disasters and of direct economic losses for this recent period2000 to 2008, and there is high agreement regarding this distributionamong different databases collected by independent organizations(Guha-Sapir et al., 2011; Munich Re, 2011; Swiss Re, 2011).
Damage losses in percentage of GDP by regions: The relative economicburden in terms of direct loss expressed as a percentage of GDP has beensubstantially higher for developing states. Middle-income countries
with rapidly expanding asset bases have borne the largest burden,where during the period from 2001 to 2006 losses amounted to about1% of GDP, while this ratio has been about 0.3% of GDP for low-incomecountries and less than 0.1% of GDP for high-income countries, basedon limited evidence (Cummins and Mahul, 2009). In small exposedcountries, particularly small island developing states, these wealth lossesexpressed as a percentage of GDP and averaged over both disaster andnon-disaster years can be considerably higher, exceeding 1% in manycases and 8% in the most extreme cases over the period from 1970 to2010 (World Bank and UN, 2010), and individual events may consumemore than the annual GDP (McKenzie et al., 2005). This indicates a farhigher vulnerability of the economic infrastructure in developingcountries (Cavallo and Noy 2009; UNISDR, 2009).
Increasing weather- and climate-related disasters: The number of reportedweather- and climate-related disasters and their direct financial costshave increased over the past decades. Figure 4-8 illustrates an increasingtrend (coupled with large interannual variability) in losses based ondata for large weather-and climate-related disasters over the period1980 to 2010, for which data have been gathered consistently andsystematically (see Neumayer and Barthel, 2011).
This increase in affected population and direct economic losses is alsocoupled with the increasing numbers of reported weather- and climate-related disasters (UNISDR, 2009; Munich Re, 2011; Swiss Re 2011).
Chapter 4Changes in Impacts of Climate Extremes: Human Systems and Ecosystems
0.5
9
18
6055
22.82
13
13.1745.28
87
18
13
136
17
32
58
13
48
1.19
AMERICAS
EUROPE
AFRICA
ASIA
OCEANIA
Number of disasters
Meteorological
Climatological
Hydrological
Damages
Height of columns represents the number of disasters or damages in billion dollars.
Figure 4-7 | Weather- and climate-related disaster occurrence and regional average impacts from 2000 to 2008. The number of climatological (e.g., extreme temperature, drought,wildfire), meteorological (e.g., storm), and hydrological (e.g., flood, landslides) disasters is given for each region, along with damages (2009 US$ billion). Data from Vos et al., 2010.

271
These statistics imply the increasing cost of such disasters to society,regardless of cause. It is also important to note that the number ofweather- and climate-related disasters has increased more rapidly thanlosses from non-weather disasters (Mills, 2005; Munich Re, 2011; SwissRe, 2011). This could indicate a change in climate extremes, but thereare other possible explanations (Bouwer, 2011). Drought and floodlosses may have grown due to a number of non-climatic factors, such asincreasing water withdrawals effectively exacerbating the impact ofdroughts, decrease in storage capacity in catchments (urbanization,deforestation, sealing surfaces, channelization) adversely affecting bothflood and drought preparedness, increase in runoff coefficients, andgrowing settlements in floodplains around urban areas (see Section4.2.2; Field et al., 2009).
4.5.4.2. Potential Trends in Key Extreme Impacts
As indicated in Sections 3.3 to 3.5 and Tables 3-1 and 3-3, climateextremes may have different trends in the future; some such as heatwaves are projected to increase over most areas in length, frequency,and intensity, while projected changes in some other extremes are givenwith less confidence. However, uncertainty is a key aspect of disaster/climate change trend analysis due to attribution issues discussed above,
incomparability of methods, changes in exposure and vulnerability overtime, and other non-climatic factors such as mitigation and adaptation.A challenge is ensuring that the projections of losses from futurechanges in extreme events are examined not for current populationsand economies, but for scenarios of possible future socioeconomicdevelopment. See Box 4-2 for a discussion of this with respect tocyclones.
It is more likely than not that the frequency of the most intense tropicalcyclones will increase substantially in some ocean basins (Section 3.4.4).Many studies have investigated impacts from tropical cyclones (e.g.,ABI, 2005a, 2009; Hallegatte, 2007; Pielke Jr., 2007; Narita et al., 2009;Bender et al., 2010; Nordhaus, 2010; Crompton et al., 2011). Table 4-3presents the projected percentage increase in direct economic losses fromtropical cyclones from a number of these studies, scaled to the year 2040relative to a common baseline (year 2000). There is high confidence thatincreases in exposure will result in higher direct economic losses fromtropical cyclones and that losses will also depend on future changes intropical cyclone frequency and intensity. One study, building on globalclimate model results from Bender et al. (2010), found that to attributeincreased losses to increased tropical cyclone activity in the UnitedStates with a high degree of certainty would take another 260 years ofrecords, due to the high natural variability of storms and their impacts
Chapter 4 Changes in Impacts of Climate Extremes: Human Systems and Ecosystems
0
50
100
150
200
250
US$
bill
ions
Overall Losses in 2010 Values
Of Which Insured in 2010 Values
0
0
0
0
0
Overall Losses in 2010 Values
Of Which Insured in 2010 Values
2010200520001995199019851980
Figure 4-8 | The overall losses and insured losses from weather- and climate-related disasters worldwide (in 2010 US$). These data for weather- and climate-related ‘great’ and‘devastating’ natural catastrophes are plotted without inclusion of losses from geophysical events. A catastrophe in this data set is considered ‘great’ if the number of fatalitiesexceeds 2,000, the number of homeless exceeds 200,000, the country’s GDP is severely hit, and/or the country is dependent on international aid. A catastrophe is considered‘devastating’ if the number of fatalities exceeds 500 and/or the overall loss exceeds US$ 650 million (in 2010 values). Data from Munich Re, 2011.

272
(Crompton et al., 2011). See Section 4.5.3.3 on attribution and the useof a risk-based approach to cope with this issue. Other studies haveinvestigated impacts from increases in the frequency and intensity ofextratropical cyclones at high latitudes (Dorland et al., 1999; ABI,2005a, 2009; Narita et al., 2010; Schwierz et al., 2010; Donat et al.,2011). In general there is medium confidence that increases in lossesdue to extratropical cyclones will occur with climate change, withpossible decreases or no change in some areas. Projected increasesgenerally are slightly lower than increases in tropical cyclone losses (seeTable 4-3). Patt et al. (2010) projected future losses due to weather- andclimate-related extremes in least-developed countries.
Many studies have addressed future economic losses from river floods,most of which are focused on Europe, including the United Kingdom(Hall et al., 2003, 2005; ABI, 2009), Spain (Feyen et al., 2009), and TheNetherlands (Bouwer et al., 2010) (see Table 4-3). Maaskant et al.(2009) is one of the few studies that addresses future loss of life fromflooding, and projects up to a four-fold increase in potential floodvictims in The Netherlands by the year 2040, when population growth
is accounted for. Some studies are available on future coastal flood risks(Hall et al., 2005; Mokrech et al., 2008; Nicholls et al., 2008; Dawson etal., 2009; Hallegatte et al., 2010). Although future flood losses in manylocations will increase in the absence of additional protection measures(high agreement, medium evidence), the size of the estimated change ishighly variable, depending on location, climate scenarios used, andmethods used to assess impacts on river flow and flood occurrence (seeTable 4-3 for a comparison of some regional studies) (Bouwer, 2010).
Some studies have addressed economic losses from other types ofweather extremes, often smaller-scale compared to river floods andcyclones. These include hail damage, for which mixed results are found:McMaster (1999) and Niall and Walsh (2005) found no significanteffect on hailstorm losses for Australia, while Botzen et al. (2010) find asignificant increase (up to 200% by 2050) for damages in the agriculturalsector in The Netherlands, although the approaches used varyconsiderably. Rosenzweig et al. (2002) report on a possible doublingof losses to crops due to excess soil moisture caused by more intenserainfall. Hoes (2007), Hoes and Schuurmans (2006), and Hoes et al.
Chapter 4Changes in Impacts of Climate Extremes: Human Systems and Ecosystems
Pielke (2007) Tropical storm Atlantic 58 1,365 417
30
Nordhaus (2010) Tropical storm United States 12 92 47
Narita et al. (2009) Tropical storm Global 23 130 46
Hallegatte (2007) Tropical storm United States - - 22
ABI (2005a,b) Tropical storm United States, Caribbean 19 46 32
ABI (2005a,b) Tropical storm Japan 20 45 30
ABI (2009) Tropical storm China 9 19 14
Schmidt et al. (2009) Tropical storm United States - - 9
Bender et al. (2010) Tropical storm United States -27 36 14
Narita et al. (2010) Extra-tropical storm High latitude -11 62 22
15
Schwierz et al. (2010) Extra-tropical storm Europe 6 25 16
Leckebusch et al. (2007) Extra-tropical storm United Kingdom, Germany -6 32 11
ABI (2005a,b) Extra-tropical storm Europe - - 14
ABI (2009) Extra-tropical storm United Kingdom -33 67 15
Dorland et al. (1999) Extra-tropical storm Netherlands 80 160 120
Bouwer et al. (2010) River flooding Netherlands 46 201 124
65
Feyen et al. (2009) River flooding Europe - - 83
ABI (2009) River flooding United Kingdom 3 11 7
Feyen et al. (2009) River flooding Spain (Madrid) - - 36
Schreider et al. (2000) Local flooding Australia 67 514 361
Hoes (2007) Local flooding Netherlands 16 70 47
Pielke (2007) Tropical storm Atlantic 164 545 355
Schmidt et al. (2009) Tropical storm United States - - 240
Dorland et al. (1999) Extra-tropical storm Netherlands 12 93 50
Bouwer et al. (2010) River flooding Netherlands 35 172 104
Feyen et al. (2009) River flooding Spain (Mad) - - 349
Hoes (2007) Local flooding Netherlands -4 72 29
172
A. Impact of projected climate change
B. Impact of projected exposure change
Study Hazard type RegionMin Max Mean Median
Estimated loss change [%] in 2040
Study Hazard type RegionMin Max Mean Median
Estimated loss change [%] in 2040
Table 4-3 | Estimated change in disaster losses in 2040 under projected climate change and exposure change, relative to 2000, from 21 impact studies including median estimatesby type of weather hazard. Source: Bouwer, 2010.

273
(2005) estimated increases in damages due to extreme rainfall in TheNetherlands by mid-century.
It is well known that the frequency and intensity of extreme weatherand climate events are only one factor that affects risks, as changes inpopulation, exposure of people and assets, and vulnerability determineloss potentials (see Sections 4.2 to 4.4). Few studies have specificallyquantified these factors. However, the ones that do generally underlinethe important role of projected changes (increases) in population andcapital at risk. Some studies indicate that the expected changes inexposure are much larger than the effects of climate change (see Table4-3), which is particularly true for tropical and extratropical storms(Pielke Jr., 2007; Feyen et al., 2009; Schmidt et al., 2009). Other studiesshow that the effect of increasing exposure is about as large as the effectof climate change (Hall et al., 2003; Maaskant et al., 2009; Bouwer et al.,2010), or estimate that these are generally smaller (Dorland et al., 1999;Hoes, 2007). There is therefore medium confidence that, for some climateextremes in many regions, the main driver for future increasing lossesin many regions will be socioeconomic in nature (based on mediumagreement and limited evidence). Finally, many studies underline thatboth factors need to be taken into account, as the factors do in factamplify each other, and therefore need to be studied jointly whenexpected losses from climate change are concerned (Hall et al., 2003;Bouwer et al., 2007, 2010; Pielke Jr., 2007; Feyen et al., 2009).
4.5.5. Assessment of Adaptation Costs
The World Bank (2006) estimated the cost of climate-proofing foreigndirect investments, gross domestic investments, and Official DevelopmentAssistance, which was taken up and modified by Stern (2007), Oxfam(2007), and UNDP (2007). The second source of adaptation cost estimatesis UNFCCC (2007), which calculated the value of existing and plannedinvestment and financial flows required for the international community
to effectively and appropriately respond to climate change impacts. Thethird source is World Bank (2010), which also conducted a number ofcountry-level studies to complement the global assessment, followingUNFCCC (2007), but aimed at improving upon this by assessing theclimate-proofing of existing and new infrastructure, using more preciseunit cost estimates and including the costs of maintenance as well asthose of port upgrading and the risks from sea level rise and stormsurges. Also, the investment in education necessary to neutralizeimpacts of extreme weather is calculated. Estimates of costs to adapt toclimate change (rather than simply to extremes and disasters), whichhave mostly been made for developing countries, exhibit a large rangeand relate to different assessment periods (such as today, 2015, or 2030).For 2030, the estimated global cost from UNFCCC (2007) ranges fromUS$ 48 to 171 billion per year for developed and developing countries,and US$ 28 to 67 billion per year for developing countries (in 2005dollars). Recent estimates from World Bank (2010) for developingcountries lead to higher projected costs and broadly amount to theaverage of this range with annual costs of up to US$ 100 billion (in2005 US$) (see Table 4-4). Confidence in individual global estimates islow because, as mentioned above and discussed by Parry et al. (2009),the estimates are derived from only three relatively independent studies,which explains the seeming convergence of the estimates in latterstudies. As well, Parry et al. (2009) consider the estimates a significantunderestimation by at least a factor of two to three and possibly moreif the costs incurred by other sectors were included, such as ecosystemservices, energy, manufacturing, retailing, and tourism. The adaptationcost estimates are also based mostly on low levels of investment due toan existing adaptation deficit in many regions. Unavoidable residualdamages remain absent from these analyses.
In terms of regional costs and as reported in the World Bank (2010)study, the largest absolute adaptation costs would arise in East Asia andthe Pacific, followed by the Latin American and Caribbean region as wellas sub-Saharan Africa. This pattern held for the two scenarios assessed
Chapter 4 Changes in Impacts of Climate Extremes: Human Systems and Ecosystems
Study Results (billion US$ yr-1)
Time Frame and Coverage Sectors Methodology and Comment
World Bank (2006) 9–411
Present, developing countries Unspecified
Cost of climate-proofing foreign direct investments, gross domestic investments, and Official Development Assistance
Stern (2007) 4–371 Present, developing countries Unspecified Update of World Bank (2006)
Oxfam (2007) >501 Present, developing countries Unspecified World Bank (2006) plus extrapolation of cost estimates from National
Adaptation Programmes of Action and NGO projects
UNDP (2007) 86–1092 In 2015, developing countries Unspecified World Bank (2006) plus costing of targets for adapting poverty reduction
programs and strengthening disaster response systems
UNFCCC (2007)
48–171 (28–67 for developing countries)2
In 2030, developed and developing countries
Agriculture, forestry, and fisheries; watersupply; human health; coastal zones; infrastructure; ecosystems (but no estimate for 2030 for ecosystem adaptation)
Additional investment and financial flows needed for adaptation in 2030
World Bank (2010) 70–1002
Annual from 2010 to 2050, developing countries
Agriculture, forestry, and fisheries; water supply and flood protection; human health; coastal zones; infrastructure; extreme weather events
Impact costs linked to adaptation costs, improvement upon UNFCCC (2007): climate-proofing existing and new infrastructure, more precise unit cost, inclusion of cost of maintenance and port upgrading, risks from sea level rise and storm surges, riverine flood protection, education investment to neutralize impacts of extreme weather events
Notes: 1. in 2000 US$; 2. in 2005 US$.
Table 4-4 | Estimates of global costs of adaptation to climate change. Source: Extended based on Agrawala and Fankhauser (2008) and Parry et al. (2009).

274
in the study, which were a scenario with the most precipitation (‘wet’)and one with the least precipitation (‘dry’) among all scenarios chosenfor the study, which employ socioeconomic driver information fromIPCC’s SRES A2 scenario (see Table 4-5).
Taking Africa as an example, based on various estimates the potentialadditional costs of adaptation investment range from US$ 3 to 10 billionper year by 2030 (UNFCCC, 2007; PACJA, 2009). However, this could bealso an underestimate considering the desirability of improving Africa’sresilience to climate extremes as well as the flows of internationalhumanitarian aid in the aftermath of disasters.
4.5.6. Uncertainty in Assessing theEconomic Costs of Extremes and Disasters
Upon reviewing the estimates to date, the costing of weather- andclimate-related disasters and estimating adaptation costs is stillpreliminary, incomplete, and subject to a number of assumptions withthe result that there is considerable uncertainty (Agrawala andFankhauser, 2008; Parry et al., 2009). This is largely due to modelinguncertainties in climate change and damage estimates, limited dataavailability, and methodological shortcomings in analyzing disasterdamage statistics. Such costing is further limited by the interactionbetween numerous adaptation options and assumptions about futureexposure and vulnerabilities, social preferences, and technology, as wellas levels of resilience in specific societies. Additionally the followingchallenges can be identified.
Risk assessment methods: Technical challenges remain in developingrobust risk assessment and damage costing methods. Study results canvary significantly between top-down and bottom-up approaches. Risk-based approaches are utilized for assessing and projecting disaster risk(Jones, 2004; Carter et al., 2007), for which input from both climate andsocial scenarios is required. All climatic phenomena are subject to thelimitation that historically based relationships between damages anddisasters cannot be used with confidence to deduce future risk ofextreme events under changing characteristics of frequency and intensity(UNDP, 2004). Yet climate models are today challenged when reproducingspatially explicit climate extremes, due to coarse resolution and physicalunderstanding of the relevant process, as well as challenges in modelinglow-probability, high-impact events (see Section 3.2.3). Therefore,
projections of future extreme event risk involve uncertainties that canlimit understanding of sudden onset risk, such as flood risk. Futuresocioeconomic development is also inherently uncertain. A uniform setof assumptions can help to provide a coherent global picture andcomparison and extrapolation between regions.
Data availability and consistency: Lack of data and robust informationincreases the uncertainty of costing when scaling up to global levels froma very limited (and often very local) evidence base. There are double-counting problems and issues of incompatibility between types ofimpacts in the process of multi-sectoral and cross-scale analyses,especially for the efforts to add both market and non-market values (e.g.,ecosystem services) (Downton and Pielke Jr., 2005; Pielke Jr. et al., 2008;Parry et al., 2009). Moreover the full impacts of weather- and climate-related extremes in developing countries are not fully understood, anda lack of comprehensive studies on damage, adaptation, and residualcosts indicates that the full costs are underestimated.
Information on future vulnerability: Apart from climate change,vulnerability and exposure will also change over time, and theinteraction of these aspects should be considered (see, e.g., Hallegatte,2008; Hochrainer and Mechler, 2011). This has been recognized andassessments of climate change impacts, vulnerability, and risk arechanging in focus, leading to more integration across questions. Whileinitial studies focused on an analysis of the problem, the field proceededto assess potential impacts and risks, and now more recently started tocombine such assessments with the consideration of specific riskmanagement methods (Carter et al., 2007).
Some studies have suggested incorporating an analysis of the ongoingor chronic economic impact of disasters into the adaptation planningprocess (Freeman, 2000). A fuller assessment of disaster cost at varyingspatial and temporal scales and costs related to impacts on human,social, built, and natural capital, and their associated services at differentlevels can set the stage for comparisons of post-disaster developmentstrategies. This would make disaster risk reduction planning andpreparedness investment more cost-effective (Gaddis et al., 2007). Forexample, there is consensus on the important role of ecosystems in riskreduction and well-being, which would make the value of ecosystemservices an integral part of key policy decisions associated with adaptation(Tallis and Kareiva, 2006; Costanza and Farley, 2007).
Chapter 4Changes in Impacts of Climate Extremes: Human Systems and Ecosystems
Wet 25.7 12.6 21.3 3.6 17.1 17.1 97.5
Dry 17.7 6.5 14.5 2.4 14.6 13.8 69.6
East Asia & Pacific
Europe & Central Asia
Latin America & Caribbean
Middle East & North America
sub-Saharan Africa TotalSouth AsiaScenario/Region
Table 4-5 | Range of regionalized annual costs of adaptation for wet and dry scenarios (in 2005 US$ billion). Reflecting the full range of estimated costs, the wet scenario costsdo not include benefits from climate change while the dry scenario costs include benefits from climate change within and across countries. Source: World Bank, 2010.

275
References
A digital library of non-journal-based literature cited in this chapter thatmay not be readily available to the public has been compiled as part ofthe IPCC review and drafting process, and can be accessed via either theIPCC Secretariat or IPCC Working Group II web sites.
Abegg, B., S. Agrawala, F. Crick, and A. Montfalcon, 2007: Climate change impactsand adaptation in winter tourism. In: Climate Change in the European Alps:Adapting Winter Tourism and Natural Hazards Management [S. Agrawala (ed.)].Organisation for Economic Co-operation and Development, Paris, France, pp.25-60.
ABI, 2005a: Financial Risks of Climate Change: Summary Report. Association ofBritish Insurers, London, UK, 129 pp.
ABI, 2005b: Financial Risks of Climate Change: Technical Annexes. Climate RiskManagement Ltd. for the Association of British Insurers, London, UK, 125 pp.
ABI, 2009. The Financial Risk of Climate Change. Research Paper No. 19, Associationof British Insurers, London, UK, 107 pp.
Abraham, J., F. Bendimerad, A. Berger, A. Boissonnade, O. Collignon, E. Couchmann,F. Grandjean, S. McKay, C. Miller, C. Mortgat, R. Muir-Wood, B. Page, T. Shah, S.Smith, P. Wiart, and Y. Xien, 2000: Windstorms Lothar and Martin. December 26-28, 1999. Risk Management Solutions, Newark, CA, 20 pp.
ABS, 2010: Regional Population Growth, Australia, 2008-09.Australian Bureau ofStatistics, Canberra, Australia, abs.gov.au/ausstats/[email protected]/Products/3218.0~2008-09~Main+Features~Main+Features?OpenDocument#PARALINK5.
ACIA, 2004: Impacts of a Warming Arctic. Overview Report of the Arctic ClimateImpact Assessment, Cambridge University Press, Cambridge, UK, 139 pp.
Adamo, S.B., 2010: Environmental migration and cities in the context of globalenvironmental change. Current Opinion in Environmental Sustainability, 2(3),161-165, doi:10.1016/j.cosust.2010.06.005.
Adger, W.N., 2000. Social and ecological resilience: Are they related? Progress inHuman Geography, 24, 347-364.
Adger, W.N., 2006: Vulnerability. Global Environmental Change, 16(3), 268-281.Adger, W.N., T.A. Benjaminsen, K. Brown, and H. Svarstad, 2001: Advancing a
political ecology of global environmental discourses. Development and Change,32(4), 681-715. doi:10.1111/1467-7660.00222.
Adger, W.N., T.P. Hughes, C. Folke, S.R. Carpenter, and J. Rockstrom, 2005: Social-ecological resilience to coastal disasters. Science, 309(5737), 1036-1039.
Adger, W.N., S. Agrawala, M.M.Q. Mirza, C. Conde, K. O’Brien, J. Pulhin, R. Pulwarty,B. Smit, and K. Takahashi, 2007: Assessment of adaptation practices, options,constraints and capacity. In: Climate Change 2007: Impacts, Adaptation andVulnerability. Contribution of Working Group II to the Fourth Assessment Reportof the Intergovernmental Panel on Climate Change [Parry, M.L., O.F. Canziani,J.P. Palutikof, P.J. van der Linden and C.E. Hanson (eds.)]. Cambridge UniversityPress, Cambridge, UK, pp. 717-743.
Aggarwal, P.K. and A.K. Singh, 2010: Implications of global climatic change onwater and food security. In: Global Change: Impacts on Water and Food Security[Ringler, C., A.K. Biswas, and S. Kline (eds.)]. Springer-Verlag, Berlin andHeidelberg, Germany, pp. 49-63.
Agrawala, S. and S. Fankhauser (eds.), 2008: Economic Aspects of Adaptation toClimate Change: Costs, Benefits and Policy Instruments. Organisation forEconomic Co-operation and Development, Paris, France, 133 pp.
Albala-Bertrand, J., 1993: Political Economy of Large Natural Disasters. OxfordUniversity Press, New York, NY, 272 pp.
Alexander, D., 2005: Vulnerability to landslides. In: Landslide Hazards and Risk[Glade, T., M. Anderson, and M. Crozier (eds.)]. Wiley & Sons, Sussex, UK,pp.175-198.
Allen, C.D. and D.D. Breshears, 1998: Drought-induced shift of a forest–woodlandecotone: Rapid landscape response to climate variation. Proceedings of theNational Academy of Sciences, 95(25), 14839 -14842.
Alpa, B., 2009: Vulnerability of Turkish coasts to accelerated sea-level rise.Geomorphology, 107, 58-63.
AMCEN/UNEP, 2002: Africa environment outlook: past, present and futureperspectives. United Nations Environmental Programme and the AfricanMinisterial Conference on the Environment, Earthprint, Stevenage, UK, 422 pp.
Amien, I., P. Rejekiningrum, A. Pramudia, and E. Susanti, 1996: Effects of interannualclimate variability and climate change on rice yields in Java, Indonesia. Water,Air &Soil Pollution, 92, 29-39.
Anderson, M.G., L. Holcombe, and J.-P. Renaud, 2007: Assessing slope stability inunplanned settlements in developing countries. Journal of EnvironmentalManagement, 85(1), 101-111.
Anisimov, O.A. and M.A. Belolutskaya, 2002: Assessment of the impact of climatechange and permafrost degradation on infrastructure in northern regions ofRussia. Meteorology and Hydrology, 6, 15-22.
Anisimov, O.A. and S.A. Lavrov, 2004: Global warming and permafrost melting:assessment of risks for energy-sector industrial facilities. Tekhnologii TEK, 3, 78-83.
Anisimov, O.A., A.A. Velichko, P.F. Demchenko, A.V. Yeliseyev, I.I. Mokhov, and V.P.Nechaev, 2004: Impact of climate change on permafrost in the past, presentand future. Physics of Atmosphere and Oceans, 38(1), 25-39.
Anyamba, A., J-P. Chretien, J. Small, C.J. Tucker, and K.J. Linthicum, 2006: Developingglobal climate anomalies suggest potential disease risks for2006-2007. International Journal of Health Geographics, 5(60),doi:10.1186/1476-072X-5-60.
Arianoutsou, M., S. Koukoulas, and D. Kazanis, 2011: Evaluating post-fire forestresilience using GIS and multi-criteria analysis: an example from Cape SounionNational Park, Greece. Journal of Environmental Management, 47, 384-397.
Arkell, B.P. and G.J.C. Darch, 2006: Impact of climate change on London’s transportnetwork. Proceedings of the Institute of Civil Engineers – Municipal Engineer,159(4), 231-237.
Arnone, III, J.A., P.S.J. Verburg, D.W. Johnson, J.D. Larsen, R.L. Jasoni, L.J. Annmarie,C.M. Batts, C. von Nagy, W.G. Coulombe, D.E. Schorran, P.E. Buck, B.H. Braswell,J.S. Coleman, R.A. Sherry, L.L. Wallace, Y. Luo, and D.S. Schimel,2008: Prolonged suppression of ecosystem carbon dioxide uptake after ananomalously warm year. Nature, 455, 383-386.
AusAID, 2005: Economic Impact of Natural Disasters on Development in the Pacific.Volume 1: Research Report, Australian Agency for International Development,Canberra, Australia, 92 pp., ausaid.gov.au/publications/pdf/impact_pacific_report.pdf.
Baccini, M., T. Kosatsky, A. Analitis, H.R. Anderson, M. D’Ovidio, B. Menne, P.Michelozzi, A. Biggeri, and the PHEWE Collaborative Group, 2011: Impact ofheat on mortality in 15 European cities: attributable deaths under differentweather scenarios. Journal of Epidemiology and Community Health,65(1), 64-70, doi:10.1136/jech.2008.085639.
Banks, S., M. Blyton, D. Blair, L. McBurney, and D. Lindenmayer, 2011: Adaptiveresponses and disruptive effects: how major wildfire influences kinship-basedsocial interactions in a forest marsupial. Molecular Ecology, doi:10.1111/j.1365-294X.2011.05282.x.
Barnett, T.P. and D.W. Pierce, 2008: When will Lake Mead run dry? Journal of WaterResources Research, 44, W03201, doi:10.1029/2007WR006704.
Barnett, T.P. and D.W. Pierce, 2009: Sustainable water deliveries from the ColoradoRiver in a changing climate. Proceedings of the National Academy of Sciences,106(18), 7334-7338, doi:10.1073/pnas.0812762106.
Barredo, J.I., 2009: Normalised flood losses in Europe: 1970-2006. Natural Hazardsand Earth System Sciences, 9, 97-104.
Barriopedro, D., E.M. Fischer, J. Luterbacher, R.M. Trigo, and R. Garcia-Herrara, 2011:The hot summer of 2010: redrawing the temperature record map of Europe.Science, 332, 220-224.
Basara, J.B., H.G. Basara, B.G. Illston, and K.C. Crawford, 2010: The impact of theurban heat island during an intense heat wave in Oklahoma City. Advances inMeteorology, (2010), 230365, doi:10.1155/2010/230365.
Battisti, D.S. and R.L. Naylor, 2009: Historical warnings of future food insecurity withunprecedented seasonal heat. Science, 323, 240-244.
Chapter 4 Changes in Impacts of Climate Extremes: Human Systems and Ecosystems
276
Bebi, P., D. Kulakowski, and C. Rixen, 2009: Snow avalanche disturbances in forestecosystems – State of research and implications for management. ForestEcology and Management, 257(9), 1883-1892.
Becken, S. and J.E. Hay, 2007: Tourism and climate change: risks and opportunities.Climate Change, Economies and Society Series, Channel View Publications,Clevedon, UK, 352 pp.
Bender, M.A., T.R. Knutson, R.E. Tuleya, J.J. Sirutis, G.A. Vecchi, S.T. Garner, and I.M.Held, 2010: Modeled impact of anthropogenic warming on the frequency ofintense Atlantic hurricanes. Science, 327, 454-458.
Beniston, M., 2004: The 2003 heatwave in Europe: A shape of things to come? Ananalysis based on Swiss climatological data and model simulations.Geophysical Research Letters, 31, L02202.
Beniston, M. and H. Diaz, 2004: The 2003 heatwave as an example of summers in agreenhouse climate? Observations and climate model simulations for Basel,Switzerland. Global and Planetary Change, 44(1-4), 73-81.
Beniston, M., F. Keller, and S. Goyette, 2003: Snow pack in the Swiss Alps underchanging climatic conditions: An empirical approach for climate impact studies.Theoretical and Applied Climatology, 74, 19-31.
Benito, G., T. Grodek, and Y. Enzel, 1998: The geomorphic and hydrologic impacts ofthe catastrophic failure of flood-control-dams during the 1996-Biescas flood(Central Pyrennes, Spain). Zeitschrift für Geomorphologie, 42(4), 417-437.
Benito, G., R.F. Rohde, M. Seely, C. Kulls, O. Dahan, Y. Enzel, S. Todd, B. Botero, and T.Grodek, 2010: Management of alluvial aquifers in two southern Africanephemeral rivers: implications for IWRM. Water Resources Management, 24,641-667.
Benson, C. and E. Clay, 1998: The Impact of Drought on Sub-Saharan AfricanEconomies: A Preliminary Examination. World Bank Technical Paper Series No.401, World Bank, Washington, DC, 80 pp.
Benson, C. and E.J. Clay, 2000: Developing countries and the economic impacts ofnatural disasters. In: Managing disaster risk in emerging economies [Kreimer, A.and A. Margaret (eds.)]. Disaster Risk Management Series No. 2, World Bank,Washington, DC, pp. 11-21.
Benson, C. and E. Clay, 2003: Disasters, vulnerability, and global economy. In:Building Safer Cities: The Future of Disaster Risk [Kreimer, A., M. Arnold, and A.Carlin (eds.)]. Disaster Risk Management Series No. 3, World Bank, Washington,DC, pp. 3-31.
Benson, C. and E. Clay, 2004: Understanding the Economic and Financial Impacts ofNatural Disasters. Disaster Risk Management Series, No. 4, World Bank,Washington, DC, 119 pp..
Benson, C. and J. Twigg, 2004. Measuring Mitigation: Methodologies for assessingnatural hazard risks and the net benefits of mitigation — A Scoping Study. TheInternational Federation of Red Cross and Red Crescent Societies/TheProVention Consortium, Geneva, Switzerland, 149 pp.
Berrittella M., A. Bigano, and R.S.J. Tol, 2006: A general equilibrium analysis ofclimate change impacts on tourism. Tourism Management, 27(5), 913-924.
Berry, M., 2003: Why is it important to boost the supply of affordable housing inAustralia - and how can we do it? Urban Policy and Research, 21, 413-435.
Berry, H., K. Bowen, and T. Kjellstrom, 2010: Climate change and mental health: acausal pathways framework. International Journal of Public Health, 55, 123-132.
Bertness, M.D. and P.J. Ewanchuk, 2002: Latitudinal and climate-driven variation inthe strength and nature of biological interactions in New England salt marshes.Oecologia, 132, 392-401.
Beven, J.L., L.A. Avila, E.S. Blake, D.P. Brown, J.L. Franklin, R.D. Knabb, R.J. Pasch, J.R.Rhome, and S.R. Stewart, 2008: Atlantic hurricane season of 2005. MonthlyWeather Review, 136, 1109-1173.
Bhuiyan, C., R.P. Singh, and F.N. Kogan, 2006: Monitoring drought dynamics in theAravalli region (India) using different indices based on ground and remote sens-ing data. International Journal of Applied Earth Observation andGeoinformation, 8(4), 289-302.
Bigano, A., F. Bosello, R. Roson, R.S.J. Tol, 2008: Economy-wide impacts of climatechange: a joint analysis for sea level rise and tourism. Mitigation and AdaptionStrategies for Global Change, 13, 765-791.
Bindoff, N., J. Willebrand, V. Artale, A. Cazenave, J. Gregory, S. Gulev, K. Hanawa, C.Le Quéré, S. Levitus, Y. Nojiri, C.K. Shum, L.D. Talley and A. Unnikrishnan, 2007:Observations: Oceanic climate change and sea level. In: Climate Change 2007:The Physical Science Basis, Contribution of Working Group I to the FourthAssessment Report of the Intergovernmental Panel on Climate Change[Solomon, S., D. Qin, M. Manning, Z. Chen, M. Marquis, K.B. Averyt, M. Tignor,and H.L. Miller (eds.)]. Cambridge University Press, Cambridge, UK, pp. 385-432.
Birch, E.L. and S.M. Wachter (eds.), 2006: Rebuilding Urban Places after Disaster:Lessons from Hurricane Katrina. University of Pennsylvania Press, Philadelphia,PA, 375 pp.
Bongaerts, P., T. Ridgeway, E.M. Sampayo, and O. Hoegh-Guldberg, 2010: Assessingthe ‘deep reef refugia’ hypothesis: focus on Caribbean reefs. Coral Reefs, 29,309-327.
Borrell, C, M. Marí-Dell’Olmo, M. Rodríguez-Sanz, P.Garcia-Olalla, J.A. Caylà, J.Benach, and C. Muntaner, 2006: Socioeconomic position and excess mortalityduring the heat wave of 2003 in Barcelona. European Journal of Epidemiology,21(9), 633-640.
Boruff, B.J., J.A. Easoz, S.D. Jones, H.R. Landry, J.D. Mitchem, and S.L. Cutter, 2003:Tornado hazards in the United States. Climate Research, 24, 103-117.
Botzen, W.J.W., L.M. Bouwer, and J.C.J.M. van den Bergh, 2010: Climate change andhailstorm damage: Empirical evidence and implications for agriculture andinsurance. Resource and Energy Economics, 32, 341-362.
Bouwer, L.M., 2010: Disasters and climate change: analysis and methods forprojecting future losses from extreme weather. Ph.D. thesis, Vrije Universiteit,Amsterdam, The Netherlands, 141 pp., dare.ubvu.vu.nl/bitstream/1871/16355/1/dissertation.pdf.
Bouwer, L.M., 2011: Have disaster losses increased due to anthropogenic climatechange? Bulletin of the American Meteorological Society, 92, 39-46.
Bouwer, L.M. and W.J.W. Botzen, 2011: How sensitive are US hurricane damages toclimate? Comment on a paper by W.D. Nordhaus. Climate Change Economics,2, 1-7.
Bouwer, L.M., R.P. Crompton, E. Faust, P. Höppe, and R.A. Pielke Jr., 2007:Confronting disaster losses. Science, 318, 753.
Bouwer, L.M., P. Bubeck, and J.C.J.H. Aerts, 2010: Changes in future flood risk due toclimate and development in a Dutch polder area. Global EnvironmentalChange, 20, 463-471.
Breshears, D.D. and C.D. Allen, 2002: The importance of rapid, disturbance-inducedlosses in carbon management and sequestration. Global Ecology andBiogeography, 11, 1-5.
Breshears, D.D., N.S. Cobb, P.M. Rich, K.P. Price, C.D. Allen, R.G. Balice, W.H. Romme,J.H. Kastens, M.L. Floyd, J. Belnap, J.J. Anderson, O.B. Myers, and C.W. Meyer,2005: Regional vegetation die-off in response to global-change-type drought.Proceedings of the National Academy of Sciences, 102(42), 15144-15148.
Bronstert, A., A. Bárdossy, C. Bismuth, H. Buiteveld, M. Disse, H. Engel, U. Fritsch, Y.Hundecha, R. Lammersen, D. Niehoff, and N. Ritter, 2007: Multi-scale modellingof land-use change and river training effects on floods in the Rhine basin. RiverResearch and Applications, 23(10), 1102-1125.
Brooks, N., 2004: Drought in the Africa Sahel: long-term perspectives and futureprospects. Working paper 61, Tyndall Centre for Climate Research, University ofEast Anglia, Norwich, UK, 31 pp.
Brooks, N., W.N. Adger, and P.M. Kelly, 2005: The determinants of vulnerability andadaptive capacity at the national level and the implications for adaptation.Global Environmental Change, 15, 151-163.
Brookshire, D.S., S.E. Chang, H. Cochrane, R.A. Olson, A. Rose, and J. Steenson, 1997:Direct and indirect economic losses from earthquake damage. EarthquakeSpectra, 13, 683-701.
Brouwer, R., S. Akter, L. Brander, and E. Haque, 2007: Socioeconomic vulnerabilityand adaptation to environmental risk: acase study of climate change andflooding in Bangladesh. Risk Analysis, 27, 313-326.
BTE, 2001: Economic costs of natural disasters in Australia. Report 103, Bureau ofTransport Economics, Canberra, Australia, 170 pp.
Burnley, I. and P. Murphy, 2004: Sea Change: Movement from Metropolitan toArcadian Australia. UNSW Press, Sydney, Australia, 272 pp.
Chapter 4Changes in Impacts of Climate Extremes: Human Systems and Ecosystems

277
Burton, I. and E. May, 2004: The adaptation deficit in water resources management.IDS Bulletin, 35(3), 31-37.
Burton, K., R. Kates, and G. White, 1993: The Environment as Hazard. 2nd ed.Guilford Press, New York, NY, 290 pp.
Bussotti, F., E. Cenni, M. Ferretti, A. Cozzi, L. Brogi, and A. Mecci, 1995: Forest conditionin Tuscany (Central Italy) - Field surveys 1987-1991. Forestry, 68(1), 11-24.
Butcher, G.V. and S. Ford, 2009: Modeling the regional economic impacts of the2007/08 drought: results and lessons. Paper presented at the 2009 NZARESConference, Nelson, New Zealand, 27-28 August 2009, 11 pp.,ageconsearch.umn.edu/bitstream/97167/2/2009_22_Economic%20Impact%20of%202007-08%20Drought_ButcherG.pdf.
Butry, D., E. Mercer, J. Prestemon, J. Pye, and T. Holmes, 2001: What is the price ofcatastrophic wildfire? Journal of Forestry, 99(11), 9-17.
Buzinde, C.N., D. Manuel-Navarrete, E.E. Yoo, and D. Morais, 2010: Tourists’perceptions in a climate of change: Eroding destinations. Annals of TourismResearch, 37(2), 333-354.
Buzna, L., K. Peters, and D. Helbing, 2006: Modelling the dynamics of disasterspreading in networks. Physica A: Statistical Mechanics and its Applications,363(1), 132-140.
Cadier, E., M. Villacis, A. Graces, P. Lhuissier, L. Maisincho, R. Laval, D. Paredes, B.Caceres, and B. Francou, 2007: Variation of a low latitude Andean glacieraccording to global and local climate variations: first results. In: Glacier MassBalances and Meltwater Discharge [Ginot, P. and J.E. Sicart (eds.)]. IAHS Pub.No. 318, International Association of Hydrological Sciences, Wallingford, UK, pp.66-74.
Campbell, J.R., 2006: Traditional Disaster Reduction in Pacific IslandCommunities.GNS Science Report 2006/38, Institute of Geological and NuclearSciences, Lower Hutt, New Zealand, 46 pp.
Cardemil, L., J.C. Di Tata, and F. Frantischek, 2000: Central America: adjustment andreforms in the 1990s. Finance and Development, 37(1), 34-37,www.imf.org/external/pubs/ft/fandd/2000/03/cardemil.htm.
Carson, R., R. Mitchell, M. Hanemann, R. Kopp, S. Presser, and P. Ruud, 2003:Contingent valuation and lost passive use: damages from the Exxon Valdez oilspill. Environmental and Resource Economics, 25, 257-286.
Carter, L.M., S.J. Cohen, N.B. Grimm, and J.L. Hatfield, 2008: Weather and ClimateExtremes in a Changing Climate, Regions of Focus: North America, Hawaii,Caribbean and U.S. Pacific Islands. Synthesis and Assessment Product 3.3,Report by the U.S. Climate Change Science Program and the Subcommittee onGlobal Change, Washington, DC, 162 pp.
Carter, M.R., P.D. Little, T. Mogues, and W. Negatu, 2007: Poverty traps and naturaldisasters in Ethiopia and Honduras. World Development, 35(5), 835-856,doi:10.1016/j.worlddev.2006.09.010.
Caselli, F. and P. Malhotra, 2004: Natural Disasters and Growth: from ThoughtExperiment to Natural Experiment, International Monetary Fund, Washington,DC, 29 pp.
Casimiro, E. and J.M. Calheiros, 2002: Human health. In: Climate Change inPortugal. Scenarios, Impacts and Adaptation Measures—SIAM Project [SantosF.D., K. Forbes, and R. Moita (eds.)]. Gradiva Publishers, Lisbon, Portugal, pp.241-300.
Cavallo, E. and I. Noy, 2009: The Economics of Natural Disasters: A Survey. IDB WorkingPaper 09-19, Inter-American Development Bank, Washington, DC, 48 pp.
Cavallo, E. and I. Noy, 2010: The Economics of Natural Disasters: A Survey. IDBWorking Paper Series, No. IDB-WP-124, Inter-American Development Bank,Washington, DC, 50 pp., www.iadb.org/res/publications/pubfiles/pubIDB-WP-124.pdf.
CCSP, 2008: Impacts of Climate Change and Variability on Transportation Systemsand Infrastructure: Gulf Coast Study, Phase I. A Report by the U.S. ClimateChange Science Program and the Subcommittee on Global Change Research[Savonis, M.J., V.R. Burkett, and J.R. Potter (eds.)]. Department of Transportation,Washington, DC, 445 pp.
CDHS, 2007: Review of July 2006 Heatwave Related Fatalities in California. CDHSReport, Epidemiology and Prevention for Injury Control Branch, CaliforniaDepartment of Health Services, Sacramento, CA, 10 pp.
Chang, H., J. Franczyk, and C. Kim, 2009: What is responsible for increasing floodrisks? The case of Gangwon Province, Korea. Natural Hazards, 48, 399-354.
Changnon, S. (ed.), 1996: The Great Flood of 1993. Westview Press, Boulder, CO, 321pp.
Changnon, S.A., 2001: Damaging thunderstorm activity in the United States. Bulletinof the American Meteorological Society, 82, 597-608.
Changnon, S.A., 2006: Railroads and Weather: From Fogs to Floods and Heat toHurricanes, the Impacts of Weather and Climate on American Railroading.American Meteorological Society, Boston, MA, 136 pp.
Changnon, S.A., 2009: Increasing major hail losses in the U.S. Climatic Change, 96,161-166.
Chapin, F.S., T.V. Callaghan, Y. Bergeron, M. Fukuda, J.F. Johnstone, G. Juday, and S.A.Zimov, 2004: Global change and the boreal forest: thresholds, shifting states orgradual change? Ambio, 33, 361-365.
Charveriat, C., 2000: Natural Disasters in Latin America and the Caribbean: AnOverview of Risk. IDB Working Paper 434, Inter-American Development Bank,Washington, DC, 104 pp.
Chen, K. and J. McAneney, 2006: High-resolution estimates of Australia’s coastalpopulation with validations of global population, shoreline and elevationdatasets. Geophysical Research Letters, 33, L16601, doi:10.1029/2006GL026981.
Cheng, S. and R. Wang, 2002: An approach for evaluating the hydrological effects ofurbanization and its application. Hydrological Processes, 16(7), 1403-1418.
Choi, O. and A. Fisher, 2003: The impacts of socioeconomic development and climatechange on severe weather catastrophe losses: Mid-Atlantic Region (MAR) andthe US. Climatic Change, 58(1-2), 149-170.
Christensen, J.H., B. Hewitson, A. Busuioc, A. Chen, X. Gao, I. Held, R. Jones, R.K.Kolli, W. Kwon, R. Laprise, V.M. Rueda, L. Mearns, C.G. Menéndez, J. Räisänen,A. Rinke, A. Sarr, and P. Whetton, 2007: Regional climate projections. In: ClimateChange 2007: The Physical Science Basis. Contribution of Working Group I tothe Fourth Assessment Report of the Intergovernmental Panel on ClimateChange [Solomon, S., D. Qin, M. Manning, Z. Chen, M. Marquis, K.B. Averyt, M.Tignor, and H.L. Miller (eds.)]. Cambridge University Press, Cambridge, UK, pp.847-933.
Christensen, N.S., A.W. Wood, N. Voisin, D.P. Lettenmaier, and R.N. Palmer, 2004: Theeffects of climate change on the hydrology and water resources of the ColoradoRiver basin. Climatic Change, 62(1), 337-363.
Ciais, P., M. Reichstein, N. Viovy, A. Granier, J. Ogée, V. Allard, M. Aubinet, N.Buchmann, Chr. Bernhofer, A. Carrara, F. Chevallier, N. De Noblet, A.D. Friend, P.Friedlingstein, T. Grünwald, B. Heinesch, P. Keronen, A. Knohl, G. Krinner, D.Loustau, G. Manca, G. Matteucci, F. Miglietta, J.M. Ourcival, D. Papale, K.Pilegaard, S. Rambal, G. Seufert, J.F. Soussana, M.J. Sanz, E.D. Schulze, T. Vesala,and R. Valentini, 2005: Europe-wide reduction in primary productivity caused bythe heat and drought in 2003. Nature, 437(7058), 529-533.
Ciscar, J.C. (ed.), 2009: Climate Change Impacts in Europe: Final Report of the PESETAresearch project. EUR 24093 EN-2009, European Commission, Joint ResearchCentre, Institute for Prospective Technological Studies, EU Publications,Luxembourg, Luxembourg, 113 pp.
Clarke, M.L. and H.M. Rendell, 2006: Hindcasting extreme events: the occurrenceand expression of damaging floods and landslides in Southern Italy. LandDegradation and Development, 17(4), 365-380.
Collier, P., V. Elliot, H. Hegre, A. Hoeffler, M. Reynal-Querol, and N. Sambanis, 2003:Breaking the Conflict Trap: Civil War and Development Policy. World Bank,Washington, DC.
Corominas, J., 2005: Impacto sobre los riesgos naturales de origen climático:inestabilidad de laderas. In: Proyecto ECCE. Evaluación Preliminar de losimpactos en España por efecto del Cambio Climático [Moreno, J.M. (ed.)].Ministerio de Medio Ambiente, Madrid, Spain, pp. 549-579.
Costa, M.H. and G.F. Pires, 2010: Effects of Amazon and Central Brazil deforestationscenarios on the duration of the dry season in the arc of deforestation.International Journal of Climatology, 30(13), 1970-1979.
Costanza, R. and J. Farley. 2007. Ecological economics of coastal disasters:Introduction to the Special Issue. Ecological Economics, 63, 249-253.
Chapter 4 Changes in Impacts of Climate Extremes: Human Systems and Ecosystems

278
Costello, L., 2007: Going bush: the implications of urban-rural migration.Geographical Research, 45, 85-94.
Costello, L., 2009: Urban-rural migration: housing availability and affordability.Australian Geographer, 40, 219-233.
CRED, 2010: EM-DAT: The OFDA/CRED International Disaster Data Base. Centre forResearch on the Epidemiology of Disasters, Université Catholique de Louvain,Louvain, Belgium, www.emdat.be/Database/.
Crichton, D., 2007: What can cities do to increase resilience? PhilosophicalTransactions of the Royal Society A, 365(1860), 2731-2739.
Crompton, R.P. and K.J. McAneney, 2008: Normalised Australian insured losses frommeteorological hazards: 1967-2006. Environmental Science and Policy, 11,371-378.
Crompton, R.P., K.J. McAneney, and K. Chen, 2010: Influence of location, population,and climate on building damage and fatalities due to Australian bushfire:1925–2009. Weather, Climate, and Society, 2, 300-310.
Crompton, R., R.A. Pielke Jr., and J. McAneney, 2011: Emergence timescales fordetection of anthropogenic climate change in US tropical cyclone loss data.Environmental Research Letters, 6(1), doi:10.1088/1748-9326/6/1/014003.
Crosta, G.B., H. Chen, and C.F. Lee, 2004: Replay of the 1987 Val Pola Landslide,Italian Alps. Geomorphology, 60(2, 3), 127-146.
Crowards, T., 2000: Comparative Vulnerability to Natural Disasters in the Caribbean.Staff Working Paper No. 1/00, Caribbean Development Bank, Charleston, SC, 21pp.
Crozier, M.J., 2010: Deciphering the effect of climate change on landslide activity: Areview. Geomorphology, 124(3-4), 260-267, doi:10.1016/j.geomorph.2010.04.009.
Cruz, A., 2005: NaTech disasters: a review of practices, lessons learned and futureresearch needs. Paper presented at the 5th Annual IIASA-DPRI Forum,Integrated Disaster Risk Management: Innovations in Science and Policy,Beijing, China, 14-18 September 2005, 10 pp.
Cruz, R.V., H. Harasawa, M. Lal, S. Wu, Y. Anokhin, B. Punsalmaa, Y. Honda, M. Jafari,C. Li and N. Huu Ninh, 2007: Asia. In: Climate Change 2007: Impacts, Adaptationand Vulnerability. Contribution of Working Group II to the Fourth AssessmentReport of the Intergovernmental Panel on Climate Change [Parry, M.L., O.F.Canziani, J.P. Palutikof, P.J. van der Linden and C.E. Hanson (eds.)]. CambridgeUniversity Press, Cambridge, UK, pp. 469-506.
Cummins, J., and O. Mahul, 2009: Catastrophe Risk Financing in DevelopingCountries: Principles for Public Intervention. World Bank, Washington, DC.
Cuny, F.C., 1983: Disasters and Development. Oxford University Press, Oxford, UK,278 pp.
Curriero, F.C., J.A. Patz, J.B. Rose, and S. Lele, 2001: The association between extremeprecipitation and waterborne disease outbreaks in the United States, 1948-1994. American Journal of Public Health, 91(8), 1194-1199, doi:10.2105/AJPH.91.8.1194.
Cutter, S. and C. Emrich, 2005: Are natural hazards and disaster losses in the U.S.increasing? EOS, 86(41), 381-396.
Cutter, S.L. and C.T. Emrich, 2006: Moral hazard, social catastrophe: the changingface of vulnerability along the hurricane coasts. Annals of the AmericanAcademy of Political and Social Science, 604, 102-112.
Cutter, S.L. and C. Finch, 2008: Temporal and spatial changes in social vulnerabilityto natural hazards. Proceedings of the National Academy of Sciences, 105(7),2301-2306.
Cutter, S.L., L. Barnes, M. Berry, C. Burton, E. Evans, E. Tate, and J. Webb, 2008: Aplace-based model for understanding community resilience to natural disasters.Global Environmental Change, 18, 598-606.
D’Almeida, C., C.J. Vorosmarty, G.C. Hurtt, J.A. Marengo, S.L. Dingman, and B.D.Keim, 2007: The effects of deforestation on the hydrological cycle in Amazonia:a review on scale and resolution. International Journal of Climatology, 27,633-648.
Dao, H. and P. Peduzzi, 2004: Global evaluation of human risk and vulnerability tonatural hazards In: Proceedings of ENVIROINFO 2004, 18th InternationalConference Informatics for Environmental Protection, Vol. 1, CERN, Geneva,Switzerland, 21-23 October 2004, Sh@ring, Editions du Tricorne, Geneva,Switzerland, pp. 435-446.
Dasgupta, S., B. Laplante, S. Murray, and D. Wheeler, 2009: Sea-Level Rise and StormSurges: A Comparative Analysis of Impacts in Developing Countries. PolicyResearch Working Paper 4901, World Bank Development Research Group,Environment and Energy Team, Washington, DC, 41 pp.
Dash, S., R. Jenamani, S. Kalsi, and S. Panda, 2007: Some evidence of climate changein twentieth-century India, Climatic Change, 85, 299-321.
Davis, R.E, P.C. Knappenberger, P.J. Michaels, and W.M. Novicoff, 2003: Changingheat-related mortality in the United States. Environmental Health Perspectives,111, 1712-1718.
Dawson, R. J., J.W. Hall, P.D. Bates, and R.J. Nicholls, 2005: Quantified analysis of theprobability of flooding in the Thames Estuary under imaginable worst-case sealevel rise scenarios. International Journal of Water Resources Development,21(4), 577-591, doi:10.1080/07900620500258380.
Dawson, R.J., M.E. Dickson, R.J. Nicholls, J.W. Hall, M.J.A. Walkden, P.K. Stansby, M.Mokrech, J. Richards, J. Zhou, J. Milligan, A. Jordan, S. Pearson, J. Rees, P.D. Bates,S. Koukoulas, and A.R. Watkinson, 2009: Integrated analysis of risks of coastalflooding and cliff erosion under scenarios of long term change. ClimaticChange, 95, 249-288.
de Bruin, K., R.B.Dellink, A.Ruijs, L. Bolwidt, A. vanBuuren, J. Graveland, R.S.deGroot, P.J.Kuikman, S. Reinhard, R.P. Roetter, V.C. Tassone, A. Verhagen, andE.C. van Ierland, 2009: Adapting to climate change in The Netherlands: aninventory of climate adaptation options and ranking of alternatives. ClimaticChange, 95(1-2), 23-45.
de Wit, M. and J. Stankiewicz, 2006: Changes in water supply across Africa withpredicted climate change. Science, 311, 1917-1921.
DEFRA, 2004: Scientific and Technical Aspects of Climate Change, including Impactsand Adaptation and Associated Costs. Department for Environment, Food andRural Affairs, London, UK, 19 pp., www.newforestnpa.gov.uk/__data/assets/pdf_file/0016/20473/152-07_annex_3_climate_change.pdf.
DEFRA, 2006: The UK’s Fourth National Communication under the United NationsFramework Convention on Climate Change. United Kingdom Department forEnvironment, Food and Rural Affairs, London, UK, 135 pp., unfccc.int/resource/docs/natc/uknc4.pdf.
Delpla, I., A.-V. Jung, E. Baures, M. Clement, and O. Thomas, 2009: Impacts of climatechange on surface water quality in relation to drinking water production.Environment International, 35(8), 1225-1233.
Deschênes, O. and M. Greenstone, 2007: The economic impacts of climate change:Evidence from agricultural output and random fluctuations in weather. TheAmerican Economic Review, 97(1), 354-385.
Devoy, R.J.N., 2008: Coastal vulnerability and the implications of sea-level rise forIreland. Journal of Coastal Research, 24(2), 325-341.
DHS, 2009: January 2009 Heatwave in Victoria: an Assessment of Health Impacts.Victorian Govt. Department of Human Services, Melbourne, Australia, 16 pp.
Dodman, D. and D. Satterthwaite, 2008: Institutional capacity, climate changeadaptation and the urban poor. Institute of Development Studies Bulletin,39(4), 67-74.
Donat, M.G., G.C. Leckebusch, J.G. Pinto, and U. Ulbrich, 2010: European storminessand associated circulation weather types: future changes deduced from a multi-model ensemble of GCM simulations. Climate Research, 42, 27-43.
Donat, M.G., G.C. Leckebusch, S. Wild, and U. Ulbrich, 2011: Future changes inEuropean winter storm losses and extreme wind speeds inferred from GCM andRCM multi-model simulations. Natural Hazards and Earth System Sciences, 11,1351-1370.
Dorland, C., R.S.J. Tol, and J.P. Palutikof, 1999: Vulnerability of the Netherlands andNorthwest Europe to storm damage under climate change. Climatic Change,43, 513-535.
Douglas, I., 2009: Climate change, flooding and food security in south Asia, FoodSecurity, 1(2), 127-136.
Douglas, I., K. Alam, M. Maghenda, Y. Mcdonnell, L. Mclean, and J. Campbell, 2008:Unjust waters: climate change, flooding and the urban poor in Africa,Environment and Urbanization, 20 (1), 187-205.
Downton, M. and R.A. Pielke, Jr., 2005: How accurate are disaster loss data? Thecase of U.S. flood damage. Natural Hazards, 352, 211-228.
Chapter 4Changes in Impacts of Climate Extremes: Human Systems and Ecosystems

279
Downton, M.W., J.Z.B. Miller, and R.A. Pielke, 2005: Reanalysis of US NationalWeather Service flood loss database. Natural Hazards Review, 6, 13-22.
Dregne, H.E., 1986: Desertification of arid lands. In: Physics of Desertification [El-Baz,F. and M.H.A. Hassan (eds.)]. Martinus Nijhoff, Dordrecht, The Netherlands, pp.4-34.
DSD,1994: Barbados Declaration. A/CONF.167/9,I, Annex I. Report of the GlobalConference on the Sustainable Development of Small Island Developing States,Bridgetown, Barbados, 25 April-6 May 1994, United Nations Division forSustainable Development, Department of Economic and Social Affairs, NewYork, NY, USA, 77 pp., islands.unep.ch/dbardecl.htm.
Eakin, C.M., J. A. Morgan, S. F. Heron, T. B. Smith, G. Liu, et al., 2010: Caribbean coralsin crisis: record thermal stress, bleaching, and mortality in 2005. Public Libraryof Science ONE, 5(11), e13969, doi:10.1371/journal.pone.0013969.
Easterling, W. and M. Apps, 2005: Assessing the consequences of climate change forfood and forest resources: A view from the IPCC. Climate Change, 70, 165-189.
Easterling, W.E., P.K. Aggarwal, P. Batima, K.M. Brander, L. Erda, S.M. Howden, A.Kirilenko, J. Morton, J.-F. Soussana, J. Schmidhuber, and F.N. Tubiello, 2007: Food,fibre and forest products. In: Climate Change 2007: Impacts, Adaptation andVulnerability. Contribution of Working Group II to the Fourth Assessment Reportof the Intergovernmental Panel on Climate Change [Parry, M.L., O.F. Canziani,J.P. Palutikof, P.J. van der Linden and C.E. Hanson (eds.)]. Cambridge UniversityPress, Cambridge, UK, pp. 273-313.
Ebersole, B.A., J.J. Westerink, S. Bunya, J.C. Dietrich, and M.A. Cialone, 2010:Development of storm surge which led to flooding in St. Bernard Polder duringHurricane Katrina. Ocean Engineering, 37, 91-103.
Ebi, K.L. and G.A. Meehl, 2007: The Heat is On: Climate Change & Heatwaves in theMidwest. Pew Center on Global Climate Change, Arlington, VA, 14 pp.,www.pewclimate.org/docUploads/Regional-Impacts-Midwest.pdf.
Ebi, K.L., J. Balbus, P.L. Kinney, E. Lipp, D. Mills, M.S. O’Neill, and M. Wilson, 2008:Effects of global change on human health. In: Analyses of the Effects of GlobalChange on Human Health and Welfare and Human Systems [Gamble, J.L.(ed.)]. A Report by the U.S. Climate Change Science Program and theSubcommittee on Global Change Research. U.S. Environmental ProtectionAgency, Washington, DC, pp. 2-1 to 2-78.
ECA, 2009: Shaping Climate-Resilient Development: A Framework for Decision-Making Study. Report of the Economics of Climate Adaptation Working Group,New York, NY, 159 pp.
ECLAC, 2003: Handbook for Estimating the Socio-economic and EnvironmentalEffects of Disasters. LC/MEX/G.5, LC/L 1874, Economic Commission for LatinAmerica and the Caribbean, Santiago, Chile, 354 pp., www.undp.org/cpr/disred/documents/publications/eclac_handbook.pdf.
EEA, 2004: Impacts of Europe’s changing climate. An indicator-based assessment.EEA Report No. 2/2004, European Environmental Agency, Copenhagen,Denmark, 100 pp.
EEA, 2008: Impacts of Europe’s changing climate- 2008 indicator-based assessment.EEA Report No.4/2008, European Environmental Agency, Copenhagen,Denmark, 19 pp., doi:10.2800/48117.
EEA, 2009: Regional Climate Change and Adaptation: The Alps Facing the Challengeof Changing Water Resources. EEA Report No. 8, European EnvironmentalAgency, Copenhagen, Denmark, 143 pp.
Ehmer, P. and E. Heymann, 2008: Climate change and tourism: Where will the journeylead? Deutsche Bank Research, Frankfurt am Main, Germany, 28 pp.
Ellson, R.W., J.W. Milliman, and R.B. Roberts, 1984: Measuring the regional economiceffects of earthquakes and earthquake predictions. Journal of Regional Science,24(4), 559-579.
Elsasser, H. and R. Bürki, 2002: Climate change as a threat to tourism in the Alps.Climate Research, 20, 253-257.
Emanuel, K., 2005: Increasing destructiveness of tropical cyclones over the past 30years. Nature, 436(7051), 686-688.
Endfield, G.H. and I.F. Tejedo, 2006: Decades of drought, years of hunger: archivalinvestigations of multiple year droughts in late colonial Chihuahua. ClimaticChange, 75(4), 391-419, doi:10.1007/s10584-006-3492-7.
Endlicher, W., G. Jendritzky, J. Fischer, and J.-P. Redlich, 2008: Heat waves, urbanclimate and human health. In Urban Ecology [Marzluff, J.M., E. Shulenberger, W.Endlicher, M. Alberti, G. Bradley, C. Ryan, U. Simon, and C. ZumBrunnen (eds.)].Springer, New York, NY, pp. 269-278.
Engelthaler, D.M., D.G. Mosley, J.E. Cheek, C.E. Levy, K.K. Komatsu, P. Ettestad, T.Davis, D.T. Tanda, L. Miller, J.W. Frampton, R. Porter, and R.T. Bryan, 1999:Climatic and environmental patterns associated with hantavirus pulmonarysyndrome, Four Corners region, United States. Emerging Infectious Diseases,5(1), 87-94.
Eriksen, S.H., K. Brown, and P.M. Kelly, 2005: The dynamics of vulnerability: locatingcoping strategies in Kenya and Tanzania. Geographical Journal, 171, 287-305.
Esteban-Talaya, A., F. López Palomeque, and E. Aguiló Pérez, 2005: Impacts in thetouristic sector. In: A Preliminary Assessment of the Impacts in Spain due to theEffect of Climate Change [Moreno, J.M. (ed.)]. Ministry of Environment, Madrid,Spain, pp. 653-690.
Eurostat, 2010: Ageing in the European Union: where exactly? Rural areas are losingthe young generation quicker than urban areas. Eurostat Statistics in Focus,26/2010, Eurostat, European Commission, Luxembourg, 16 pp.
Evans, B. and M. Webster, 2008: Adapting to Climate Change in Europe and CentralAsia. Background Paper on Water Supply and Sanitation. World BankSustainable Development Department, Europe and Central Asia Region,Washington, DC, 34 pp.
Evans, E.P., R. Ashley, J.W. Hall, E.C. Penning-Rowsell, A. Saul, P.B. Sayers, C.R. Thorne,and A. Watkinson, 2004. Foresight Flood and Coastal Defence Project: ScientificSummary: Volume I, Future risks and their drivers. Office of Science andTechnology, London, UK, 366 pp., www.bis.gov.uk/foresight/our-work/projects/published-projects/flood-and-coastal-defence/project-outputs/volume-1.
Faccio, S.D., 2003: Effects of ice storm-created gaps on forest breeding bird communitiesin central Vermont. Forest Ecology and Management, 186(1-3), 133-145.
Fankhauser, S., J.B. Smith, and R.S.J. Tol, 1999. Weathering climate change: somesimple rules to guide adaptation decisions. Ecological Economics, 30(1), 67-78.
FAO, 2008: The State of Food Insecurity in the World 2008, High food prices and foodsecurity – threats and opportunities. Food and Agriculture Organization of theUnited Nations, Rome, Italy, 56 pp.
FAO, 2009: The State of Agricultural Commodity Markets 2009. Food and AgricultureOrganization of the United Nations, Rome, Italy, 63 pp.
Fallon, P. and R. Betts. 2010: Climate impacts on European agriculture and watermanagement in the context of adaptation and mitigation – the importance ofan integrated approach. Science of Total Environment, 408, 5667-5687.
Fengqing, J., Z. Cheng, M. Guijin, H. Ruji, and M. Qingxia, 2005: Magnification offlood disasters and its relation to regional precipitation and local humanactivities since the 1980s in Xinxiang, Northwestern China. Natural Hazards,36, 307-330.
Few, R., 2003: Flooding, vulnerability and coping strategies: local responses to aglobal threat. Progress in Development Studies, 3(43), 43-58.
Few, R., M. Ahern, F. Matthies, and S. Kovats, 2004: Floods, Health and ClimateChange: A Strategic Review. Working Paper 63, Tyndall Centre for ClimateChange Research, University of East Anglia, Norwich, UK, 138 pp.
Feyen, L., J.I. Barredo, and R. Dankers, 2009: Implications of global warming andurban land use change on flooding in Europe. Water and urban developmentparadigms – towards an integration of engineering. In: Design andManagement Approaches [Feyen, J., K. Shannon, and M. Neville (eds.)]. CRCPress, Boca Raton, FL, pp. 217-225.
Field, C.B., L.D. Mortsch, M. Brklacich, D.L. Forbes, P. Kovacs, J.A. Patz, S.W. Running,and M.J. Scott, 2007: North America. In: Climate Change 2007: Impacts,Adaptation and Vulnerability. Contribution of Working Group II to the FourthAssessment Report of the Intergovernmental Panel on Climate Change [Parry,M.L., O.F. Canziani, J.P. Palutikof, P.J. van der Linden and C.E. Hanson (eds.)].Cambridge University Press, Cambridge, UK, pp. 617-652.
Field, R.D., G.R. Van Der Werf, and S.S.P. Shen, 2009: Human amplification ofdrought-induced biomass burning in Indonesia since 1960. Nature Geoscience,2, 185-188.
Chapter 4 Changes in Impacts of Climate Extremes: Human Systems and Ecosystems

280
Fink, A., T. Brücher, A. Krüger, G. Leckebusch, J. Pinto, and U. Ulbrich, 2004: The 2003European summer heatwaves and drought – synoptic diagnosis and impacts.Weather, 59, 209-216.
Fischlin, A., G.F. Midgley, J.T. Price, R. Leemans, B. Gopal, C. Turley, M.D.A. Rounsevell,O.P. Dube, J. Tarazona, and A.A. Velichko, 2007: Ecosystems, their properties,goods, and services. In: Climate Change 2007: Impacts, Adaptation andVulnerability. Contribution of Working Group II to the Fourth Assessment Reportof the Intergovernmental Panel on Climate Change [Parry, M.L., O.F. Canziani,J.P. Palutikof, P.J. van der Linden and C.E. Hanson (eds.)]. Cambridge UniversityPress, Cambridge, UK, pp. 211-272.
FitzGerald, D.M., M.S. Fenster, B.A. Argow, and I.V. Buynevich, 2008: Coastal impactsdue to sea-level rise, Annual Review of Earth and Planetary Sciences, 36(1),601-647.
Folke, C., S.R. Carpenter, T. Elmquist, L.H. Gunderson, C.S. Holling, and B.H. Walker,2002: Resilience and sustainable development: Building adaptive capacity in aworld of transformations. Ambio, 31, 437-440.
Folke, C., S. Carpenter, B. Walker, M. Scheffer, T. Elmqvist, L. Gunderson, and C.S. Holling,2004: Regime shifts, resilience, and biodiversity in ecosystem management.Annual Review of Ecology, Evolution, and Systematics, 35, 557-581.
Fouillet, A, G. Rey, V. Wagner, K. Laaidi, P. Empereur-Bissonnet, A. Le Tertre, P.Frayssinet, P. Bessemoulin, F. Laurent, P. De Crouy-Chanel, E. Jougla, D. Hémon,2008: Has the impact of heat waves on mortality changed in France since theEuropean heat wave of summer 2003? A study of the 2006 heat wave.International Journal of Epidemiology, 37(2), 309-317.
Fowler, H.J., C.G. Kilsby, and P.E. O’Connell, 2003: Modeling the impacts of climaticchange and variability on the reliability, resilience, and vulnerability of a waterresource system. Water Resources Research, 39(8), 1222-1232.
Fowler, H.J., C.G. Kilsby, and J. Stunell, 2007: Modelling the impacts of projectedfuture climate change on water resources in north-west England. Hydrologyand Earth System Sciences, 11(3), 1115-1124.
Frazier, T.G., N. Wood, B. Yarnal, and D.H. Bauer, 2010: Influence of potential sea levelrise on societal vulnerability to hurricane storm-surge hazards, SarasotaCounty, Florida. Applied Geography, 30(4), 490-505, doi:10.1016/j.apgeog.2010.05.005.
Freeman, P.K., 2000: Estimating chronic risk from natural disasters in developingcountries: A case study in Honduras. Presented at the Annual Bank Conferenceon Development Economics – Europe Development Thinking at the Millennium,Paris, France, 26-28June, 2000, 10 pp.
Freeman, P.K., L. Martin, R. Mechler, K. Warner, with P. Hausman, 2002: Catastrophesand Development, Integrating Natural Catastrophes into DevelopmentPlanning. World Bank Disaster Risk Management Working Paper Series No.4,World Bank, Washington, DC, 64 pp.
Frey, A.E., F. Olivera, J.L. Irish, L.M. Dunkin, J.M. Kaihatu, C.M. Ferreira, and B.L. Edge,2010: The impact of climate change on hurricane flooding inundation, populationaffected, and property damages. Journal of the American Water ResourcesAssociation, 46(5), 1049-1059.
Fritze, J., G. Blashki, S. Burke, and J. Wiseman, 2008: Hope, despair and transformation:climate change and the promotion of mental health and wellbeing.International Journal of Mental Health Systems, 2,13.
Fuhrer, J., M. Beniston, A. Fischlin, C. Frei, S. Goyette, K. Jasper, and C. Pfister, 2006:Climate risks and their impact on agriculture and forests in Switzerland.Climatic Change, 79(1-2), 79-102.
Gaddis, E., B. Miles, S. Morse, and D. Lewis, 2007: Full-cost accounting of coastaldisasters in the United States: Implications for planning and preparedness.Ecological Economics, 63, 307-318.
Ghesquiere, F., O. Mahul, M. Forni, and R. Gartley, 2006: Caribbean Catastrophe RiskInsurance Facility: A solution to the short-term liquidity needs of small islandstates in the aftermath of natural disasters. IAT03-13/3, World Bank,Washington, DC, 4 pp., siteresources.worldbank.org/PROJECTS/Resources/Catastrophicriskinsurancefacility.pdf.
Gillett, N.P., A.J. Weaver, F.W. Zwiers, and M.D. Flannigan, 2004: Detecting the effectof climate change on Canadian forest fires. Geophysical Research Letters,31(18), L18211, doi:10.1029/2004GL020876.
Githeko, A.K., S.W. Lindsay, U.E. Confalonieri, and J.A. Patz, 2000: Climate changeand vector-borne diseases: a regional analysis. Bulletin of the World HealthOrganization, 78, 1136-1147.
Gitlin, A.R., C.M. Sthultz, M.A. Bowker, S. Stumpof, K.L. Paxton, K.A. Kennedy, A.Munoz, J.K. Bailey, and T.G. Whitham, 2006: Mortality gradients within andamong dominant plant populations as barometers of ecosystem changeduring extreme drought. Conservation Biology, 20(5), 1477-1486.
Goldstein, R., 2003: A Survey of Water Use and Sustainability in the United Stateswith a Focus on Power Generation. Electric Power Research Institute, Palo Alto,CA, 64 pp.
Gössling, S. and C.M. Hall, 2006a: Tourism and Global Environmental Change.Ecological, Social, Economic and Political Interrelationships. Routledge, London,UK, 330 pp.
Gössling, S. and C.M. Hall, 2006b: Uncertainties in predicting tourist flows underscenarios of climate change. Climatic Change, 79(3-4), 163-173.
Gowdy, J., 2007: Toward an experimental foundation for benefit-cost analysis.Ecological Economics, 63, 649-655.
Granier, A., M. Reichstein, N. Bréda, I.A. Janssens, E. Falge, P. Ciais, T. Grünwald, M.Aubinet, P. Berbigier, C. Bernhofer, N. Buchmann, O. Facini, G. Grassi, B.Heinesch, H. Ilvesniemi, P. Keronen, A. Knohlc, B. Köstner, F. Lagergren, A.Lindroth, B. Longdoz, D. Loustau, J. Mateusq, L. Montagnanir, C. Nyst, E. Moors,D. Papale, M. Peiffer, K. Pilegaard, G. Pita, J. Pumpanen, S. Rambal, C. Rebmann,A. Rodrigues, G. Seufert, J. Tenhunen, T. Vesala, and Q. Wang, 2007: Evidence forsoil water control on carbon and water dynamics in European forests duringthe extremely dry year: 2003. Agricultural and Forest Meteorology, 143(1-2),123-145.
Griffith, G.P., E.A. Fulton, and A.J. Richardson, 2011: Effects of fishing andacidification-related benthic mortality on the southeast Australian marineecosystem. Global Change Biology, 17(10), 3058-3074, doi:10.1111/j.1365-2486.2011.02453.x.
Grothmann, T. and A. Patt, 2005: Adaptive capacity and human cognition: Theprocess of individual adaptation to climate change. Global EnvironmentalChange, Part A: Human and Policy Dimensions, 3(15), 199-213.
Guha-Sapir, D., F. Vos, R. Below, with S. Ponserre, 2011: Annual Disaster StatisticalReview 2010: The numbers and trends. Centre for Research on theEpidemiology of Disasters, Université Catholique de Louvain, Brussels, Belgium,42 pp.,cred.be/sites/default/files/ADSR_2010.pdf.
Guimaraes, P., F.L. Hefner, and D.P. Woodward, 1993: Wealth and income effects ofnatural disasters: An econometric analysis of Hurricane Hugo. Review ofRegional Studies, 23, 97-114.
Guo, Y., J. Zhang, L. Zhang, and Y. Shen, 2009: Computational investigation oftyphoon-induced storm surge in Hangzhou Bay, China. Estuarine, Coastal andShelf Science, 85, 530-553.
Haeberli, W., A. Kääb, D. Vonder Mühll, and P. Teysseire, 2001: Prevention ofoutburst floods from periglacial lakes at Grubengletscher, Valais, Swiss Alps.Journal of Glaciology, 47, 111-122.
Haines, A., R.S. Kovats, D. Campbell-Lendrum, and C. Corvalan, 2006: Climate changeand human health: impacts, vulnerability, and mitigation. The Lancet,367,2101-2109.
Hall, J.W., E.P. Evans, E.C. Penning-Rowsell, P.B. Sayers, C.R. Thorne, and A.J. Saul,2003: Quantified scenarios analysis of drivers and impacts of changing floodrisk in England and Wales: 2030-2100. Environmental Hazards, 5, 51-65.
Hall, J.W., P.B. Sayers, and R.J. Dawson, 2005: National-scale assessment of currentand future flood risk in England and Wales. Natural Hazards, 36(1-2), 147-164.
Hallegatte, S., 2007: The use of synthetic hurricane tracks in risk analysis andclimate change damage assessment. Journal of Applied Meteorology andClimatology, 46, 1956-1966.
Hallegatte, S., 2008: A roadmap to assess the economic cost of climate change withan application to hurricanes in the United States. In: Hurricanes and ClimateChange [Elsner, J.B. and T.H. Jagger (eds.)]. Springer-Verlag, Berlin andHeidelberg, Germany, pp. 361-386.
Hallegatte, S., 2009: Strategies to adapt to an uncertain climate change. GlobalEnvironmental Change, 19(2), 240-247.
Chapter 4Changes in Impacts of Climate Extremes: Human Systems and Ecosystems
281
Hallegatte, S. and P. Dumas, 2009: Can natural disasters have positiveconsequences? Investigating the role of embodied technical change. EcologicalEconomics, 68, 777-786.
Hallegatte, S. and M. Ghil, 2007: Endogenous Business Cycles and the EconomicResponse to Exogenous Shocks. Working Papers 2007.20, Fondazione EniEnrico Mattei, Milan, Italy, 20 pp.
Hallegatte, S., J.C. Hourcade, and P. Dumas, 2007: Why economic dynamics matterin assessing climate change damages: illustration on extreme events. EcologicalEconomics, 62, 330-340.
Hallegatte, S., F. Henriet, A. Patwardhan, K. Narayanan, S. Ghosh, S. Karmakar, U.Patnaik, A. Abhayankar, S. Pohit, J. Corfee-Morlot, C. Herweijer, N. Ranger, S.Bhattacharya, M. Bachu, S. Priya, K. Dhore, F. Rafique, P. Mathur, and N. Naville,2010: Flood Risks, Climate Change Impacts and Adaptation Benefits inMumbai: An Initial Assessment of Socio-Economic Consequences of Present andClimate Change Induced Flood Risks and of Possible Adaptation Options. OECDEnvironment Working Papers No. 27, Organisation for Economic Co-operationand Development Publishing, Paris, France, 61 pp. dx.doi.org/10.1787/5km4hv6wb434-en.
Hamilton, J.M., D.J. Maddison, and R.S.J. Tol, 2005: Climate change and internationaltourism: a simulation study. Global Environmental Change, 15, 253-266.
Handmer, J., 2003: We are all vulnerable. Australian Journal of EmergencyManagement, 18(3), 55-60.
Handmer, J. and S. Dovers, 2007: The Handbook of Disaster and Emergency Policyand Institutions. Earthscan, London, UK, 192 pp.
Handmer, J., C. Reed, and O. Percovich, 2002: Disaster Loss Assessment Guidelines.Department of Emergency Services, State of Queensland, EmergencyManagement Australia, Commonwealth Australia, 90 pp.
Handmer, J., S. O’Neil, and D. Killalea, 2010: Review of Fatalities in the February 7,2009, Bushfires. Victorian Bushfires Royal Commission, Melbourne, Australia.
Hanson, S., R. Nicholls, N. Ranger, S. Hallegatte, J. Corfee-Morlot, C. Herweijer, and J.Chateau, 2011: A global ranking of port cities with high exposure to climateextremes. Climatic Change, 104, 89-111.
Hardoy, J.E., D. Mitlin, and D. Satterthwaite, 2001: Environmental Problems in anUrbanizing World: Finding Solutions for Cities in Africa, Asia and Latin America.Earthscan, London, UK, 448 pp.
Harvey, N. and B. Caton, 2003: Coastal Management in Australia. Oxford UniversityPress, Melbourne, Australia, 342 pp.
Hashizume, M., Y. Wagatsuma, A.S. Faruque, T. Hayashi, P.R. Hunter, B.G. Armstrong,D.A. Sack, 2008: Factors determining vulnerability to diarrhoea during and aftersevere floods in Bangladesh. Journal of Water and Health, 6(3), 323-332.
Hatfield, J.L., 2010: Climate impacts on agriculture in the United States: The value ofpast observations. In: Handbook of Climate Change and Agroecosystems:Impact, Adaptation and Mitigation [Hillel, D. and C. Rosenzweig(eds.)]. ImperialCollege Press, London, UK, pp. 239-253.
Hatfield, J.L., K.J. Boote, P. Fay, L. Hahn, C. Izaurralde, B.A. Kimball, T. Mader, J.Morgan, D. Ort, W. Polley, A. Thomson, and D. Wolfe, 2008: Agriculture. In: TheEffects of Climate Change on Agriculture, Land Resources, Water Resources, andBiodiversity in the United States. A report by the U.S. Climate Change ScienceProgram and the Subcommittee on Global Change Research, Washington, DC,pp. 21-74.
Hatfield, J.L., K.J. Boote, B.A. Kimball, L. Ziska, R.C. Izaurralde, D. Ort, A.M. Thomson,and D.A. Wolfe, 2011: Climate impacts on agriculture: Implications for cropproduction. Agronomy Journal, 103(2), 351-370.
Hay, J. and N. Mimura, 2010: The changing nature of extreme weather and climateevents: risks to sustainable development. Geomatics, Natural Hazards and Risk,1(1), 3-18.
Heger, M., A. Julca, and O. Paddison, 2008: Analysing the Impact of Natural Hazardsin Small Economies: The Caribbean Case. UNU/WIDER Research Paper 2008/25,The World Institute for Development Economics Research, Helsinki, Finland, 27pp.
Hein, L., M.J. Metzger, and A. Moren, 2009: Potential impacts of climate change ontourism; a case study for Spain. Current Opinion in EnvironmentalSustainability, 1, 170-178.
Hennessy, K., C. Lucas, N. Nicholls, J. Bathols, R. Suppiah, and J. Ricketts, 2006:Climate change impacts on fire-weather in south-east Australia. CSIRO Marineand Atmospheric Research, Bushfire CRC and Australia Bureau of Meteorology,Clayton South Victoria, Australia, 88 pp.
Hennessy, K., B. Fitzharris, B.C. Bates, N. Harvey, S.M. Howden, L. Hughes, J. Salinger,and R. Warrick, 2007: Australia and New Zealand. In: Climate Change 2007.Impacts, Adaptation and Vulnerability. Contribution of Working Group II to theFourth Assessment Report of the Intergovernmental Panel on Climate Change[Parry, M.L., O.F. Canziani, J.P. Palutikof, P.J. Van Der Linde, and C.E. Hanson(eds.)]. Cambridge University Press, Cambridge, UK, pp. 507-540.
Hess, J.J., J.N. Malilay, and A.J. Parkinson, 2008: Climate change: The importance ofplace. American Journal of Preventive Medicine, 35(5), 468-478.
Hilker, N., A. Badoux, and C. Hegg, 2009: The Swiss flood and landslide damagedatabase 1972–2007. Natural Hazards and Earth System Sciences, 9, 913-925.
Hinkel, J., R.J. Nicholls, A.T. Vafeidis, R.S.J. Tol, and T. Avagianou, 2010: Assessing riskof and adaptation to sea-level rise in the European Union: an application ofDIVA. Mitigation and Adaptation Strategies for Global Change, 15, 703-719.
Hirabayashi, Y. and S. Kanae, 2009: First estimate of the future global population atrisk of flooding. Hydrological Research Letters, 3, 6-9.
Hjelle, B. and G.E. Glass, 2000: Outbreak of Hantavirus infection in the Four Cornersregion of the United States in the wake of the 1997-1998 El Niño-SouthernOscillation. Journal of Infectious Diseases, 181(5), 1569-1573.
Hlavinka, P., M. Trnka, D. Semeradova, M. Dubrovsky, Z. Zalud, and M. Mozny, 2009:Effect of drought on yield variability of key crops in Czech Republic. Agriculturaland Forest Meteorology, 149, 431-442.
Hochrainer, S., and R. Mechler, 2011: Natural disaster risk in Asian megacities. Acase for risk pooling? Cities, 28(1), 53-61.
Hoes, O.A.C. 2007: Aanpak wateroverlast in polders op basis van risicobeheer. Ph.D.thesis, Delft University of Technology, Delft, The Netherlands, 188 pp.,repository.tudelft.nl/assets/uuid:69de94f9-385c-4c50-beff-8cc7b955beba/ceg_hoes_20070319.pdf.
Hoes, O., and W. Schuurmans, 2006: Flood standards or risk analyses for poldermanagement in The Netherlands. Irrigation and Drainage, 55, S113-S119.
Hoes, O.A.C., W. Schuurmans, and J. Strijker, 2005: Water systems and risk analysis.Water Science and Technology, 51, 105-112.
Hoffman, R.N., P. Dailey, S. Hopsch, R.M. Ponte, K. Quinn, E.M. Hill, and B. Zachry,2010: An estimate of increases in storm surge risk to property from sea levelrise in the first half of the twenty-first century. Weather, Climate and Society, 2,271-293.
Holling, C.S. (ed.), 1978: Adaptive environmental assessment and management.John Wiley, New York, NY, 377 pp.
Holper, P.N., S. Lucy, M. Nolan, C. Senese, and K. Hennessy, 2007: Infrastructure andClimate Change Risk Assessment for Victoria. Consultancy Report to theVictorian Government prepared by CSIRO, Maunsell Australia, and Phillips Fox,Aspendale, Victoria, Australia,84 pp.
Höppe, P. and T. Grimm, 2009: Rising natural catastrophe losses: What is the role ofclimate change? In: Economics and Management of Climate Change: Risks,Mitigation and Adaptation [Hansjürgens, B. and R. Antes (eds.)]. Springer-Verlag, Heidelberg, Germany, pp. 13-22.
Huey, C.A.D., J.J. Tewksbury, L.J. Vitt, P.E. Hertz, H.J.A. Pérez, and T. Garland, Jr., 2009:Why tropical forest lizards are vulnerable to climate warming. Proceedings ofthe Royal Society, Biology, 276, 1939-1948.
Huggel, C., W. Haeberli, A. Kaab, D. Bieri, and S. Richardson, 2004: An assessmentprocedure for glacial hazards in the Swiss Alps. Canadian Geotechnical Journal,41, 1068-1083.
Hughes, T.P., A.H. Baird, D.R. Bellwood, M. Card, S.R. Connolly, C. Folke, R. Grosberg,O. Hoegh-Guldberg, J.B.C. Jackson, J. Kleypas, J.M. Lough, P. Marshall, M.Nystrom, S.R. Palumbi, J.M. Pandolfi, B. Rosen, and J. Roughgarden, 2003:Climate change, human impacts, and the resilience of coral reefs. Science, 301,929-933.
Huigen, M.G.A. and I.C. Jens, 2006: Socio-economic impact of Super TyphoonHarurot in San Mariano, Isabela, the Philippines. World Development, 34(12),2116-2136.
Chapter 4 Changes in Impacts of Climate Extremes: Human Systems and Ecosystems

282
Huq, S., S. Kovats, H. Reid, and D. Satterthwaite, 2007: Editorial: Reducing risks to citiesfrom disasters and climate change. Environment and Urbanization, 19(1), 3-15.
Hurkman, W.J., W.H. Vensel, C.K. Tanaka, L. Whitehead, and S.B. Altenbach, 2009:Effect of high temperature on albumin and globulin accumulation in theendosperm proteome of the developing wheat grain. Journal of Cereal Science,49, 12-23.
Iglesias, A., L. Garrote, and F. Martín-Carrasco, 2009: Drought risk management inMediterranean river basins. Integrated Environmental Assessment andManagement, 5, 11-16, doi:10.1897/IEAM_2008-044.1.
Innes, J.L., 1992: Observations on the condition of beech (Fagus sylvatica L.) inBritain in 1990. Forestry, 65(1), 35-60.
IPCC, 2001: Climate Change 2001: Impacts, Adaptation and Vulnerability.Contribution of Working Group II to the Third Assessment Report of theIntergovernmental Panel on Climate Change [McCarthy, J.J., O.F. Canziani, N.A.Leary, D.J. Dokken, and K. S. White (eds.)]. Cambridge University Press,Cambridge, UK, 1032 pp.
IPCC, 2007: Climate Change 2007: Impacts, Adaptation and Vulnerability.Contribution of Working Group II to the Fourth Assessment Report of theIntergovernmental Panel on Climate Change [Parry, M.L., O.F. Canziani, J.P.Palutikof, P.J. van der Linden, and C.E. Hanson (eds.)]. Cambridge UniversityPress, Cambridge, UK, 976 pp.
IPCC, 2010: Meeting Report of the Intergovernmental Panel on Climate ChangeExpert Meeting on Detection and Attribution Related to Anthropogenic ClimateChange [Stocker, T.F., C.B. Field, D. Qin, V. Barros, G.-K. Plattner, M. Tignor, P.M.Midgley, and K.L. Ebi (eds.)]. IPCC Working Group I Technical Support Unit,University of Bern, Bern, Switzerland, 55 pp.
Irish, J.L., A.E. Frey, J.D. Rosati, F. Olivera, L.M. Dunkin, J.M. Kaihatu, C.M. Ferreira, andB.L. Edge, 2010: Potential implications of global warming and barrier islanddegradation on future hurricane inundation, property damages, and populationimpacted. Ocean & Coastal Management, 53(10), 645-657, doi:10.1016/j.ocecoaman.2010.08.001.
Jones, B.M., C.D. Arp, M.T. Jorgenson, K.M. Hinkel, J.A. Schmutz, and P.L. Flint, 2009:Increase in the rate and uniformity of coastline erosion in Arctic Alaska.Geophysical Research Letters, 36, L03503, doi:10.1029/2008GL036205.
Jones, R.N., 2004: Managing climate change risks. In: The Benefits of ClimateChange Policies: Analytical and Framework Issues [Agrawal, S. and J. Corfee-Morlot (eds.)]. Organisation for Economic Co-operation and Development,Paris, France, pp. 249-297.
Jonkman, S.N., 2007: Loss of Life Estimation in Flood Risk Assessment: Theory AndApplications. Ph.D. Thesis, Delft University of Technology, Delft, TheNetherlands, 354 pp.
Jonkman, S.N., M. Bočkarjova, M. Kok, and P. Bernardini, 2008: Integratedhydrodynamic and economic modelling of flood damage in The Netherlands.Ecological Economics, 66, 77-90.
Kahn, M.E., 2005: The death toll from natural disasters: The role of income, geographyand institutions. The Review of Economics and Statistics, 87(2), 271-284.
Kalkstein, L., S. Greene, D. Mills, and J. Samenow, 2011: An evaluation of theprogress in reducing heat-related human mortality in major U.S. cities. NaturalHazards, 56(1), 113-129, doi:10.1007/s11069-010-9552-3.
Kaplan, I.C., P.S. Levin, M. Burden, and E.A. Fulton, 2010: Fishing catch shares in theface of global change: a framework for integrating cumulative impacts andsingle species management. Canadian Journal of Fisheries and AquaticSciences, 67, 1968-1982.
Karl, T.R., J.M. Melillo, and T.C. Peterson (eds.), 2009: Global Climate Change Impactsin the United States. U.S. Global Change Research Program, CambridgeUniversity Press, New York, NY, 188 pp., downloads.globalchange.gov/usimpacts/pdfs/climate-impacts-report.pdf.
Karoly, D., 2010: The recent bushfires and extreme heat wave in southeastAustralia. Bulletin of Australian Meteorological and Oceanographical Societies,22, 10-13.
Kazama, S., T. Kono, K. Kakiuchi, and M. Sawamoto, 2009: Evaluation of flood controland inundation conservation in Cambodia using flood and economic growthmodels. Hydrological Processes, 23, 623-632.
Kellenberg, D.K. and A.M. Mobarak, 2008: Does rising income increase or decreasedamage risk from natural disasters? Journal of Urban Economics, 63(3), 788-802.
Kettlewell, P.S., R.B. Sothern, and W.L. Koukkari, 1999: U.K. wheat quality andeconomic value are dependent on the North Atlantic Oscillation. Journal ofCereal Science, 29, 205-209.
Kim, H.Y., T. Horie, H. Nakagawa, and K. Wada, 1996: Effects of elevated CO2
concentration and high temperature on growth and yield of rice. II. The effectof yield and its component of Akihikari rice. Japanese Journal of Crop Science,65, 644-651.
Kim, S., Y. Tachikawa, E. Nakakita, and K. Takara, 2009: Reconsideration of reservoiroperations under climate change: case study with Yagisawa Dam, Japan.Annual Journal of Hydraulic Engineering, JSCE, 53, 597-611.
Kim, U. and J.J. Kaluarachchi, 2009: Climate change impacts on water resources in theupper blue Nile river basin, Ethiopia. Journal of the American Water ResourcesAssociation, 45(6), 1361-1378.
Kleinen, T. and G. Petschel-Held, 2007: Integrated assessment of changes in floodingprobabilities due to climate change. Climatic Change, 81(3), 283-312.
Knowlton, K., M. Rotkin-Ellman, G. King, H.G. Margolis, D. Smith, G. Solomon, R. Trent,and P. English, 2008: The 2006 California heatwave: Impacts on hospitalizationsand emergency department visits. Environmental Health Perspectives, 117(1),61-67.
Koppe, C., G. Jendritzky, R.S. Kovats, and B. Menne, 2004: Heat Waves: Risks andResponses. Health and Global Environmental Change, Series No. 2, WorldHealth Organization, WHO Regional Office for Europe, Copenhagen, Denmark,123 pp., www.euro.who.int/__data/assets/pdf_file/0008/96965/E82629.pdf.
Korf, B., 2004: War, livelihoods and vulnerability in Sri Lanka. Development andChange, 35(2), 275-295.
Kosatsky, T., 2005: The 2003 European heatwaves. Euro Surveillance, 10(7), 148-149.Kovats, R.S. and R. Akhtar, 2008: Climate, climate change and human health in Asian
cities. Environment and Urbanization, 20(1), 165-175. Kovats, R.S. and K. Ebi, 2006: Heatwaves and public health in Europe. European
Journal of Public Health, 16(6), 592-599.Kramer, R.A. 1995. Advantages and limitations of benefit-cost analysis for evaluating
investments in natural disaster mitigation. In: Disaster Prevention forSustainable Development: Economic and Policy Issues [Munasinghe, M. and C.Clarke (eds.)]. World Bank, Washington, DC, pp. 61-76.
Kshirsagar, N., R. Shinde, and S. Mehta, 2006: Floods in Mumbai: Impact of publichealth service by hospital staff and medical students. Journal of PostgraduateMedicine, 52(4), 312.
Kumar, R., R. Venuprasad, and G.N. Atlin, 2007: Genetic analysis of rainfed lowlandrice drought tolerance under naturally-occurring stress in eastern India:Heritability and QTL effects. Field Crops Research, 103, 42-52.
Kundzewicz, Z., 2003: Water and climate – The IPCC TAR perspective. NordicHydrology, 34(5), 387-398.
Kundzewicz, Z.W. and H.-J. Schellnhuber, 2004: Floods in the IPCC TAR perspective.Natural Hazards, 31, 111-128.
Kundzewicz, Z.W., L.J. Mata, N. Arnell, P. Döll, P. Kabat, B. Jiménez, K. Miller, T. Oki,Z. Sen, and I. Shiklomanov, 2007: Freshwater resources and their management.Climate Change 2007. Impacts, Adaptation and Vulnerability. Contribution ofWorking Group II to the Fourth Assessment Report of the IntergovernmentalPanel on Climate Change [Parry, M.L., O.F. Canziani, J.P. Palutikof, P.J. van derLinden, and C.E. Hanson (eds.)]. Cambridge University Press, Cambridge, UK,pp.173-210.
Kunst, A.E., C.W.N. Looman, and J.P. Mackenbath, 1993: Outdoor air temperatureand mortality in The Netherlands: a time-series analysis. American Journal ofEpidemiology, 137, 331-341.
Kurukulasuriya, P. and R. Mendelsohn, 2008a: Crop switching as a strategy foradapting to climate change. African Journal of Agricultural and ResourceEconomics, 2(1), 105-126.
Kurukulasuriya, P. and R. Mendelsohn, 2008b: How Will Climate Change Shift Agro-Ecological Zones and Impact African Agriculture? Policy Research WorkingPaper Series 4717, World Bank, Washington, DC, 31 pp.
Chapter 4Changes in Impacts of Climate Extremes: Human Systems and Ecosystems

283
L’Hôte, Y., G. Mahé, B. Some, and J.P. Triboulet, 2002: Analysis of a Sahelian annualrainfall index from 1896 to 2000: the drought continues. Hydrological ScienceJournal, 47, 563-572.
Lal, P.N., 2010. Vulnerability to natural disasters: an economic analysis of the impactof the 2009 floods on the Fijian sugar belt. Pacific Economic Bulletin, 25(2),62-77.
Langner, J., R. Bergström, and V. Foltescu, 2005: Impact of climate change on surfaceozone and deposition of sulphur and nitrogen in Europe. AtmosphericEnvironment, 39(6), 1129-1141.
Laschewski, G. and G. Jendritzky, 2002: Effects of the thermal environment on humanhealth: an investigation of 30 years of daily mortality data from southwestGermany. Climate Research, 21, 91-103.
Lavorel, S. and W. Steffen, 2004: Cascading impacts of land use through time: theCanberra bushfire disaster. In: Global Change and the Earth System: A PlanetUnder Pressure [Steffen, W., A. Sanderson, P.D. Tyson, J. Jäger, P.A. Matson, B.Moore III, F. Oldfield, K. Richardson, H.J. Schellnhuber, B.L. Turner II, and R.J.Wasson (eds.)]. Springer-Verlag, Berlin, Germany, pp. 186-188.
Leckebusch, G.C., U. Ulbrich, L. Fröhlich, and J.G. Pinto, 2007: Property loss potentialsfor European midlatitude storms in a changing climate. Geophysical ResearchLetters, 34, L05703, doi:10.1029/2006GL027663.
Legesse, D., C. Vallet-Coulomb, and F. Gasse, 2003: Hydrological response of acatchment to climate and land use changes in Tropical Africa: case study SouthCentral Ethiopia. Journal of Hydrology, 275, 67-85.
Lehner, B., P. Doell, J. Alcamo, T. Henrichs, and F. Kaspar, 2006: Estimating the impactof global change on flood and drought risks in Europe: A continental, integratedanalysis. Climatic Change, 75(3), 273-299.
Lemke, P., J. Ren, R.B. Alley, I. Allison, J. Carrasco, G. Flato, Y. Fujii, G. Kaser, P. Mote,R.H. Thomas, and T. Zhang, 2007: Observations: Changes in snow, ice and frozenground. In: Climate Change 2007: The Physical Science Basis. Contribution ofWorking Group I to the Fourth Assessment Report of the IntergovernmentalPanel on Climate Change [Solomon, S., D. Qin, M. Manning, Z. Chen, M.Marquis, K.B. Averyt, M. Tignor and H.L. Miller (eds.)]. Cambridge UniversityPress, Cambridge, UK, pp. 337-383
Lemmen, D., F. Warren, J. Laeroix, and E. Bush (eds.), 2008: From Impacts toAdaptation: Canada in a Changing Climate 2007. Climate Change Impacts andAdaptation Division, Earth Sciences Sector, Natural Resources Canada, Ottawa,Canada, 448 pp.
Lenton, T., A. Footitt, and A. Dlugolecki, 2009: Major Tipping Points in the Earth’sClimate System and Consequences for the Insurance Sector. World WideFund for Nature, Gland, Switzerland and Allianz SE, Munich, Germany, 89pp.
Létard, V., H. Flandre, and S. Lepeltier, 2004: France and the French response to theheatwave: Lessons from a crisis. In: Information report of the Senate number195(2003-2004), Paris, France, 391 pp. (in French).
Levy, B.S. and V.W. Sidel (eds.), 2000: War and Public Health. American Public HealthAssociation, Washington DC, 436 pp.
Li, L.H., H.G. Xu, X. Chen, and S.P. Simonovic, 2010: Streamflow forecast and reservoiroperation performance assessment under climate change. Water ResourcesManagement, 24(1), 83-104.
Lim, J.H., J.H. Chun, and J.H. Shin, 2010: Global warming related dieback of evergreenconiferous forests in Korea due to high temperature and drought stress in winterseason. Proceedings of the XXIII IUFRO 2010 World Congress, 23-28 August,Seoul. The International Forestry Review, 12(5), 44-44.
Lindenmayer, D., D. Blair, L. McBurney, and S. Banks, 2010: Forest Phoenix: How AGreat Forest Recovers After Wildfire. CSIRO, Melbourne, Australia.
Lise, W. and R.S.J. Tol, 2002: Impact of climate on tourism demand. Climatic Change,55(4), 429-449.
Liu, X.P., J.Q. Zhang, D.W. Zhou, Z.S. Song, and X.T. Wuet, 2006: Study on grasslandfire risk dynamic distribution characteristic and management policy. ChineseJournal of Grassland, 28(6), 77-83 (in Chinese).
Loayza, N., O. Eduardo, R. Jamele, and L. Christiaensen, 2009: Natural Disasters andGrowth - Going Beyond the Averages. Policy Research Working Paper Series4980, World Bank, Washington, DC, 40 pp.
Lobell, D.B., M.B. Burke, C. Tebaldi, M.D. Mastrandrea, W.P. Falcon, and R.L. Naylor,2008: Prioritizing climate change adaptation needs forfood security in 2030.Science, 319, 607.
Lobell, D.B., W. Schlenker, and J. Costa-Roberts, 2011: Climate trends and global cropproduction since 1980. Science,333(6042), 616-620, doi:10.1126/science.1204531.
Love, G., A. Soares, and H. Püempel, 2010: Climate change, climate variability andtransportation. Procedia Environmental Sciences, 1, 130-145.
Loveridge, F.A., T.W. Spink, A.S. O’Brien, K.M. Briggs, and D. Butcher, 2010: Theimpact of climate and climate change on infrastructure slopes, with particularreference to southern England. Quarterly Journal of Engineering Geology andHydrogeology, 43(4), 461-472.
Lugeri, N., Z.W. Kundzewicz, E. Genovese, S. Hochrainer, and M. Radziejewski, 2010:River flood risk and adaptation in Europe – assessment of the present status.Mitigation and Adaptation Strategies for Global Change, 15(7), 621-639,doi:10.1007/s11027-009-9211-8.
Luo, Q., M.A.J. Williams, W. Bellotti, and B. Bryan, 2003: Quantitative and visualassessments of climate change impacts on South Australian wheat production.Agricultural Systems, 77, 173-186.
Lyon, B., 2003: Enhanced seasonal rainfall in northern Venezuela and the extremeevents of December 1999. Journal of Climate, 16, 2302-2306.
Maaskant, B., S.N. Jonkman, and L.M. Bouwer, 2009: Future risk of flooding: ananalysis of changes in potential loss of life in South Holland (The Netherlands).Environmental Science and Policy, 12, 157-169.
MacDonald, A.M., R.C. Calow, D.M.J. MacDonald, W.G. Darling, and B.E.O.Dochortaigh, 2009: What impact will climate change have on rural groundwatersupplies in Africa? Hydrological Sciences Journal, 54(4), 690-703.
MacDonald, G.M., 2010: Climate change and water in Southwestern North Americaspecial feature: water, climate change, and sustainability in the southwest.Proceedings of the National Academy of Sciences, 107, 21256-21262.
Magrin, G., C. Gay García, D. Cruz Choque, J.C. Giménez, A.R. Moreno, G.J. Nagy, C.Nobre, and A. Villamizar, 2007: Latin America. In: Climate Change 2007.Impacts, Adaptation and Vulnerability. Contribution of Working Group II to theFourth Assessment Report of the Intergovernmental Panel on Climate Change[Parry, M.L., O.F. Canziani, J.P. Palutikof, P.J. Van Der Linde, and C.E. Hanson(eds.)]. Cambridge University Press, Cambridge, UK, pp. 581-615.
Maloney, S.K. and C.F. Forbes, 2011: What effect will a few degrees of climatechange have on human heat balance? Implications for human activity.International Journal of Biometeorology,55(2), 147-160.
Mark, B.G. and G.O. Seltzer, 2003: Tropical glacier meltwater contribution to streamdischarge: a case study in the Cordillera Blanca, Peru. Journal of Glaciology, 49,271-281.
Markandya, A. and P. Watkiss, 2009: Potential Costs and Benefits of AdaptationOptions: A Review of Existing Literature. Technical paper prepared for the UnitedNations Framework Convention on Climate Change, UNFCCC, Bonn, Germany.
Marques, S.C., U.M. Azeiteiro, F. Martinhoa, and M.A. Pardala, 2007: Climatevariability and planktonic communities: The effect of an extreme event (severedrought) in a southern European estuary. Estuarine Coastal and Shelf Science,73(3-4), 725-734.
McClung, D.M. and Schaerer, P., 2006: The Avalanche Handbook. The MountaineersBooks, Seattle, WA, 342 pp.
McGranahan, G., D. Balk, and B. Anderson, 2007: The rising tide: assessing the risksof climate change and human settlements in low elevation coastal zones.Environment and Urbanization, 19(1), 17-37.
McGregor, G., M. Pelling, T. Wolf, and S. Gosling, 2007: The Social Impacts of HeatWaves. Science Report SC20061/SR6, Environment Agency, Bristol, UK.
McInnes, K.L., K.J.E. Walsh, G.D. Hubbert, and T. Beer, 2003: Impact of sea-level riseand storm surges on a coastal community. Natural Hazards, 30, 187-207.
McKechnie, A.E. and B.O. Wolf, 2010: Climate change increases the likelihood ofcatastrophic avian mortality events during extreme heatwaves. Biology Letters,6(2), 253-256.
McKenzie, E., B. Prasad, and A. Kaloumaira, 2005: Economic Impact of NaturalDisasters on Development in the Pacific. Volume I, South Pacific AppliedGeoscience Commission and University of the South Pacific, Suva, Fiji.
Chapter 4 Changes in Impacts of Climate Extremes: Human Systems and Ecosystems

284
McMaster, H.J., 1999: The potential impact of global warming on hail losses towinter cereal crops in New South Wales. Climatic Change, 43, 455-476.
McMichael, A.J., D.H. Campbell-Lendrum, C.F. Corvalán, K.L. Ebi, A.K. Githeko, J.D.Scheraga, and A. Woodward (eds.), 2003a: Climate Change and HumanHealth: Risks and Responses. World Health Organization, Geneva, Switzerland,322 pp.
McMichael, A., R. Woodruff, P. Whetton, K. Hennessy, N. Nicholls, S. Hales, A.Woodward, and T. Kjellstrom, 2003b: Human Health and Climate Change inOceania: A Risk Assessment 2002. Commonwealth Department of Health andAgeing, Canberra, Australia, 128 pp.
McMichael, A.J., R.E. Woodruff, and S. Hales, 2006: Climate change and humanhealth: present and future risks. The Lancet, 367, 859-869.
McMichael, A.J., P. Wilkinson, R.S. Kovats, S. Pattenden, B. Armstrong, N.Vajanapoom, E.M. Niciu, H. Mahomed, C. Kingkeow, M. Kosnik, M.S. O’Neill, I.Romieu, M. Ramirez-Aguilar, M.L. Barreto, N. Gouveia, and B. Nikiforov, 2008:International study of temperature, heat and urban mortality: the ‘ISOTHURM’project. International Journal of Epidemiology, 37, 1121-1131.
Mechler, R., 2004: Natural Disaster Risk Management and Financing Disaster Lossesin Developing Countries. Verlag Versicherungswirtsch, Karlsruhe, Germany, 235pp.
Mechler, R., 2008: From Risk to Resilience. The Cost-Benefit Analysis Methodology.Working Paper 1, Provention Consortium, Geneva, Switzerland.
Mechler, R. and Z.W. Kundzewicz, 2010: Assessing adaptation to extreme weatherevents in Europe. Mitigation and Adaptation Strategies for Global Change,15(7), 611-620.
Meehl, G.A. and C. Tebaldi, 2004: More intense, more frequent, and longer lastingheat waves in the 21st century. Science, 305(5686), 994-997.
Meizhu, C., X. Guangji, W. Shaopeng, and Z. Shaoping, 2010: High-temperaturehazards and prevention measurements for asphalt pavement. In: Proceedingsof the International Conference on Mechanic Automation and ControlEngineering (MACE), Wuhan, China, 26-28 June 2010.Institute of Electrical andElectronics Engineers, New York, NY, pp. 1341-1344, doi:10.1109/MACE.2010.5536275.
Mendelsohn, R., 2007: What causes crop failure? Climatic Change, 81(1), 61-70.Mendelsohn, R., A. Dinar, A. Dafelt, 2000: Climate Change Impacts on African
Agriculture. World Bank, Washington, DC, 25 pp., www.ceepa.co.za/Climate_Change/pdf/%285-22-01%29afrbckgrnd-impact.pdf.
Meyer, M.D., 2008: Design Standards for U.S. Transportation Infrastructure. TheImplications of Climate Change. Accession number 01104982, TransportationResearch Board of the National Academies, Washington, DC, 30 pp.,onlinepubs.trb.org/onlinepubs/sr/sr290Meyer.pdf.
Micklin, P., 2007: The Aral Sea disaster. Annual Review of Earth and PlanetarySciences, 35, 47-72.
Miller, S., R. Muir-Wood, and A. Boissonnade, 2008: An exploration of trends innormalised weather-related catastrophe losses. In: Climate Extremes andSociety [Diaz, H.F. and R.J. Murnane (eds.)]. Cambridge University Press,Cambridge, UK, pp. 225-247.
Mills, E., 2005: Insurance in a climate of change. Science, 309, 1040-1044.Mimura, N., L. Nurse, R.F. McLean, J. Agard, L. Briguglio, P. Lefale, R. Payet, and G.
Sem, 2007: Small islands. In: Climate Change 2007. Impacts, Adaptation andVulnerability. Contribution of Working Group II to the Fourth Assessment Reportof the Intergovernmental Panel on Climate Change [Parry, M.L., O.F. Canziani,J.P. Palutikof, P.J. Van Der Linde, and C.E. Hanson (eds.)]. Cambridge UniversityPress, Cambridge, UK, pp. 687-716.
Ministry for the Environment, 2008: Coastal Hazards and Climate Change. AGuidance Manual for Local Government in New Zealand. 2nd ed. Revised byRamsay, D. and R. Bell, Ministry of Agriculture and Forestry, Government of NewZealand, Wellington, New Zealand, 129 pp., mfe.govt.nz/publications/climate/coastal-hazards-climate-change-guidance-manual/coastal-hazards-climate-change-guidance-manual.pdf .
Ministry of Agriculture and Forestry, 2005: Finland’s National Strategy forAdaptation to Climate Change. Ministry of Agriculture and Forestry of Finland,Helsinki, Finland, 281 pp.
Ministry of Environment and Forest, 2005: National Adaptation Programme ofAction (NAPA), Final Report. Government of the People’s Republic ofBangladesh, Dhaka, Bangladesh.
Mirvis, V.M., 1999: Regularities of a change in the air temperature regime in Russia.In: Investigations in the Main Geophysical Observatory. Gidrometeoizdat, St.Petersburg, Russia.
Mitchell, J.K., 1998: Introduction: Hazards in changing cities. Applied Geography,18, 1-6.
Moench, M., R. Mechler, and S. Stapleton, 2007. Guidance note on the costs andbenefits of disaster risk reduction. In: UNISDR High Level Platform on DisasterRisk Reduction, Geneva, Switzerland, 4-7 June 2007. International Strategy forDisaster Reduction, Geneva, Switzerland, 29 pp.
Mohammed, A.R. and L. Tarpley, 2009: High nighttime temperatures affect riceproductivity through altered pollen germination and spikelet fertility.Agricultural and Forest Meteorology, 149, 999-1008.
Mokrech, M., R.J. Nicholls, J.A. Richards, C. Henriques, I.P. Holman, and S. Shackley,2008: Regional impact assessment of flooding under future climate andsocioeconomic scenarios for East Anglia and North West England. ClimaticChange, 90, 31-55.
Molesworth, A.M., L.E. Cuevas, S.J. Connor, A.P. Morse, and M.C. Thomson, 2003:Environmental risk and meningitis epidemics in Africa. Emerging InfectiousDiseases, 9, 1287-1293.
Moline, M.A., N.J. Karnovsky, Z. Brown, G.J. Divoky, T.K. Frazer, C.A. Jacoby, J.J.Torres, and W.R. Fraser, 2008: High latitude changes in ice dynamics and theirimpact on polar marine ecosystems. Annals of the New York Academy ofSciences, 1134, 267-319, doi:10.1196/annals.1439.010.
Molua, E.L. and C.M. Lambi, 2006: The Economic Impact of Climate Change onAgriculture in Cameroon. CEEPA Discussion Paper No. 17, Centre forEnvironmental Economics and Policy in Africa, Pretoria, South Africa, 33 pp.
Morin, E., T. Grodek, O. Dahan, G. Benito, C. Kulls, Y. Jacoby, G. Van Langenhove, M.Seely, and Y. Enzel, 2009: Flood routing and alluvial aquifer recharge along theephemeral arid Kuiseb River, Namibia. Journal of Hydrology, 368, 262-275.
Morrissey, S.A. and J.P. Reser, 2007: Natural disasters, climate change and mentalhealth considerations for rural Australia. Australian Journal of Rural Health, 15,120-125.
Morton, D.C., M.E. Roessing, A.E. Camp, and M.L. Tyrrell, 2003: Assessing theEnvironmental, Social, and Economic Impacts of Wildfire. Research Paper 001,Yale University Global Institute of Sustainable Forestry, New Haven, CT, 54 pp.
Mouillot, F., S. Rambal, and R. Joffre, 2002: Simulating climate change impacts onfire frequency and vegetation dynamics in a Mediterranean-type ecosystem.Global Change Biology, 8, 423-437.
Moulin, C., C.E. Lambert, F. Dulac, and U. Dayan, 1997: Control of atmospheric exportof dust from North Africa by the North Atlantic Oscillation. Nature, 387, 691-694.
Mozumder, P., E. Flugman, and T. Randhir, 2011: Adaptation behavior in the face ofglobal climate change: Survey responses from experts and decision makersserving the Florida Keys. Ocean & Coastal Management, 54(1), 37-44,doi:10.1016/j.ocecoaman.2010.10.008.
Muller, C., W. Cramer, W.L. Hare, and H. Lotze-Campen, 2011: Climate change risksfor African agriculture. Proceedings of the National Academy of Sciences, 108,4313-4315.
Munich Re, 2011: TOPICS GEO, Natural catastrophes 2010, Analyses, assessments,positions. Munich Reinsurance Company, Munich, Germany,www.munichre.com/publications/302-06735_en.pdf
Narita, D., R.S.J. Tol, and D. Anthoff, 2009: Damage costs of climate change throughintensification of tropical cyclone activities: an application of FUND. ClimateResearch, 39, 87-97.
Narita, D., R.S.J. Tol, and D. Anthoff, 2010: Economic costs of extratropical stormsunder climate change: an application of FUND. Journal of EnvironmentalPlanning and Management, 53, 371-384.
NCDC, 2005: State of the Climate: Hurricanes & Tropical Storms for Annual 2005.National Oceanic and Atmospheric Administration, National Climatic DataCenter, Washington, DC, 7 pp., www.ncdc.noaa.gov/sotc/tropical-cyclones/2005/13.
Chapter 4Changes in Impacts of Climate Extremes: Human Systems and Ecosystems

285
NCDC, 2011: State of the Climate: Global Hazards for December 2010. NationalOceanic and Atmospheric Administration, National Climatic Data Center,Washington, DC, lwf.ncdc.noaa.gov/sotc/hazards/2010/12.
Neria, Y., A. Nandi, and S. Galea, 2008. Post-traumatic stress disorder followingdisasters: a systematic review. Psychological Medicine, 38, 467-480.
Neumayer, E. and F. Barthel, 2011: Normalizing economic loss from natural disasters:a global analysis. Global Environmental Change, 22(1), 13-24.
Neumayer, E. and T. Plümper, 2007: The gendered nature of natural disasters: Theimpact of catastrophic events on the gender gap in life expectancy, 1981-2002.Annals of the Association of American Geographers, 97(3), 551-566.
New, M., 2002: Climate change and water resources in the southwestern Cape,South Africa. South African Journal of Science, 98, 369-373.
Niall, S. and K. Walsh, 2005: The impact of climate change on hailstorms insoutheastern Australia. International Journal of Climatology, 25, 1933-1952.
Nicholls, R.J., P.P. Wong, V.R. Burkett, J.O. Codignotto, J.E. Hay, R.F. McLean, S.Ragoonaden, and C.D. Woodroffe, 2007: Coastal systems and low-lying areas.In: Climate Change 2007. Impacts, Adaptation and Vulnerability. Contribution ofWorking Group II to the Fourth Assessment Report of the IntergovernmentalPanel on Climate Change [Parry, M.L., O.F. Canziani, J.P. Palutikof, P.J. van derLinden, and C.E. Hanson (eds.)]. Cambridge University Press, Cambridge, UK, pp.315-356.
Nicholls, R.J., S. Hanson, C. Herweijer, N. Patmore, S. Hallegatte, J. Corfee-Morlot, J.Château, and R. Muir-Wood, 2008: Ranking Port Cities With High Exposure AndVulnerability to Climate Extremes: Exposure Estimates. OECD ENV/WKP 2007-1, Organisation for Economic Co-operation and Development, Paris, France, 62pp.
Nicholson, S.E., X. Yin, and M.B. Ba, 2000: On the feasibility of using a lake waterbalance model to infer rainfall: An example from Lake Victoria. HydrologicalSciences Journal, 45, 75-95.
Nilsson, C., I. Stjerquist, L. Bärring, P. Schlyter, A.M. Jönsson, and H. Samuelson, 2004:Recorded storm damage in Swedish forests 1901-2000. Forest Ecology andManagement, 199, 165-173.
Nkomo, J.C. and G. Bernard, 2006: Estimating and Comparing Costs and Benefits ofAdaptation Projects: Case Studies in South Africa and The Gambia. AIACCProject No. AF 47, Assessments of Impacts and Adaptations to Climate Change,International START Secretariat, Washington, DC, 137 pp.
Nordhaus, W.D., 2010: The economics of hurricanes and implications of globalwarming. Climate Change Economics, 1, 1-20.
Nordhaus, W.D. and J. Boyer, 2000: Warming the World: Economic Models of GlobalWarming. MIT Press, Cambridge, MA, 232 pp.
Nöthiger, C. and H. Elsasser, 2004: Natural hazards and tourism: new findings onthe European Alps. Mountain Research and Development, 24(1), 24-27.
Noy, I., 2009: The macroeconomic consequences of disasters. Journal of DevelopmentEconomics, 88(2), 221-231.
NRC, 2008: Potential Impacts of Climate Change on U.S. Transportation. NationalResearch Council, Transportation Research Board Special Report 290, NationalAcademy of Sciences, Washington, DC.
NWS, 2011: National Weather Service Natural Hazard Statistics. National Oceanicand Atmospheric Administration, National Weather Service, Office of Climate,Water, and Weather Services, Silver Spring, MD, www.nws.noaa.gov/om/hazstats.shtml.
OCDESC, 2007: National Hazardscape Report. Officials Committee for Domestic andExternal Security Coordination, Department of the Prime Minister and Cabinet,Wellington, New Zealand, 139 pp.
OECD-FAO, 2008: OECD-FAO Agricultural Outlook 2008-2017, Highlights.Organisation for EconomicCo-operation and Development and Food and Agriculture Organization, Paris,France, 72 pp., www.fao.org/es/ESC/common/ecg/550/en/AgOut2017E.pdf.
Oh, C.H. and R. Reuveny, 2010: Climatic natural disasters, political risk, andinternational trade. Global Environmental Change, 20, 243-254.
Ojeda, J. and L. Donnelly, 2006: Landslides in Colombia and their Impact on Townsand Cities. IAEG2006 Paper 112, Geological Society of London, London, UK, 13pp., iaeg.info/iaeg2006/papers/iaeg_112.pdf.
Okuyama, Y. and S. Sahin, 2009: Impact Estimation of Disasters: A Global Aggregatefor 1960 to 2007. World Bank Policy Research Working Paper 4963, World Bank,Washington, DC, 40 pp.
Opdam, P. and D. Wascher, 2004: Climate change meets habitat fragmentation: linkinglandscape and biogeographical scale levels in research and conservation.Biological Conservation, 117, 285-297.
Osman-Elasha, B., M. Medany, I. Niang-Diop, T. Nyong, R. Tabo, and C. Vogel, 2006:Impacts, Vulnerability and Adaptation to Climate Change in Africa. Backgroundpaper for the African Workshop on Adaptation, Implementation of Decision1/CP.10 of the UNFCCC Convention, Accra, Ghana, 21-23 September 2006,United Nations Framework Convention on Climate Change, Bonn, Germany, 54 pp.
Otero, R.C. and R.Z. Marti, 1995. The impacts of natural disasters on developingeconomies: Implications for the international development and disaster community.In: Disaster Prevention for Sustainable Development: Economic and Policy Issues[Munasinghe, M. and C. Clarke (eds.)]. World Bank, Washington, DC, pp.11-40.
Oxfam, 2007: Adapting to Climate Change. What is Needed in Poor Countries andWho Should Pay? Oxfam Briefing Paper 104, Oxfam International, Oxford, UK,47 pp.
PACJA, 2009: The Economic Cost of Climate Change in Africa. The Pan AfricanClimate Justice Alliance, Nairobi, Kenya, 49 pp.
Pagiola, S., K. von Ritter, and J. Bishop, 2004: Assessing the Economic Value ofEcosystem Conservation. World Bank Environment Department Paper No.101,World Bank, Washington, DC, 58 pp.
Palecki, M.A., S.A. Changnon, and K.E. Kunkel, 2001: The nature and impacts of theJuly 1999 heatwave in the midwestern United States: Learning from the lessonsof 1995. Bulletin of the American Meteorological Society, 82(7), 1353-1368.
Pandey, S., D.D. Behura, R. Villano, and D. Naik, 2000: Economic Costs of Droughtand Farmers’ Coping Mechanisms: A Study of Rainfed Rice Systems in EasternIndia. IRRI Discussion Paper Series 39, International Rice Research Institute, LosBanos, Philippines, 35 pp.
Park, J.H., L. Duan, B. Kim, M.J. Mitchell, and H. Shibata, 2010: Potential effectsof climate change and variability on watershed biogeochemical processes andwater quality in Northeast Asia. Environment International, 36(2), 212-225.
Parmenter, R., E. Yadav, C. Parmenter, P. Ettestad, and K. Gage,1999: Incidence ofplague associated with increased winter-spring precipitation in New Mexico.American Journal of Tropical Medicine and Hygiene, 61(5), 814-821.
Parmesan, C., T.L. Root, and M.R. Willig, 2000: Impacts of extreme weather andclimate on terrestrial biota. Bulletin of the American Meteorological Society,81, 443-450.
Parry, M.L., O.F. Canziani, J.P. Palutikof and co-authors, 2007. Technical summary. ClimateChange 2007. Impacts, Adaptation and Vulnerability. Contribution of WorkingGroup II to the Fourth Assessment Report of the Intergovernmental Panel onClimate Change [Parry, M.L., O.F. Canziani, J.P. Palutikof, P.J. Van Der Linde, and C.E.Hanson (eds.)]. Cambridge University Press, Cambridge, UK, pp. 23-78.
Parry, M., N. Arnell, P. Berry, D. Dodman, S. Fankhauser, C. Hope, S. Kovats, R.Nichollas, D. Satterthwaite, R. Tiffin, and R. Wheeler, 2009: Assessing the Costsof Adaptation to Climate Change: A review of the UNFCCC and other recentestimates. International Institute for Environment and Development andGrantham Institute for Climate Change, London, UK, 111 pp.
Pascal, M., K. Laaidi, M. Ledrans, E. Baffert, C. Caserio-Schönemann, A. Le Tertre, J.Manach, S. Medina, J. Rudant, and P. Empereur-Bissonnet, 2006: France’s heathealth watch warning system. International Journal of Biometeorology, 50,144-153.
Patt, A.G., M. Tadross, P. Nussbaumer, K. Asante, M. Metzger, J. Rafael, A. Goujon, andG. Brundrit, 2010: Estimating least-developed countries’ vulnerability to climate-related extreme events over the next 50 years. Proceedings of the NationalAcademy of Sciences, 107(4), 1333-1337.
Pearce, D.W., W.R. Cline, A.N. Achanta, S.R. Fankhauser, R.K. Pachauri, R.S.J. Tol, andP. Vellinga, 1996: The social costs of climate change: Greenhouse damage andthe benefits of control. In: Intergovernmental Panel on Climate Change. WorkingGroup III. Climate Change 1995: Economic and Social Dimensions of ClimateChange [Bruce, J.P., H. Yi, and E.F. Haites (eds.)]. Cambridge University Press,Cambridge, UK, pp. 179-224.
Chapter 4 Changes in Impacts of Climate Extremes: Human Systems and Ecosystems

286
Pearce, G., A.B. Mullan, M.J. Salinger, T.W. Opperman, D. Woods, and J.R. Moore, 2005:Impact of Climate Change on Long-Term Fire Danger. Research Report Number50, New Zealand Fire Service Commission, Wellington, New Zealand, 75 pp.
Peduzzi, P., H. Dao, C. Herold, and F. Mouton, 2009: Assessing global exposure andvulnerability towards natural hazards: the Disaster Risk Index. Natural Hazardsand Earth System Sciences, 9, 1149-1159.
Peduzzi, P., B. Chatenoux, H. Dao, C. Herold, and G. Giuliani, 2011: Preview GlobalRisk Data Platform. UNEP/GRID and UNISDR, Geneva, Switzerland,preview.grid.unep.ch/index.php?preview=tools&cat=1&lang=eng.
Pelling, M. and J.I. Uitto, 2001: Small island developing states: natural disastervulnerability and global change. Global Environmental Change Part B:Environmental Hazards, 3(2), 49-62.
Pelling, M., A. Özerdem, and S. Barakat, 2002: The macro-economic impact ofdisasters. Progress in Development Studies, 2(4), 283-305.
Perry, A., 2003: Impacts of climate change on tourism in the Mediterranean. In:Climate Change in the Mediterranean: socio-economic perspectives of impacts,vulnerability and adaptation [Gioponi, C., M. Schechter, and E. Elgar (eds.)].Edward Elgar Publishing, Cheltenham, UK, pp. 279-289.
Petley, D.N., G.J. Hearn, A. Hart, N.J. Rosser, S.A. Dunning, K. Oven, and W.A. Mitchell,2007: Trends in landslide occurrence in Nepal. Natural Hazards, 43(1), 23-44,doi:10.1007/s11069-006-9100-3.
Phillips, O.L., L. Aragao, S.L. Lewis, J.B. Fisher, J. Lloyd, G. Lopez-Gonzalez, Y. Malhi, A.Monteagudo, J. Peacock, and C.A. Quesada, 2009: Drought sensitivity of theAmazon rainforest. Science, 323, 1344-1347.
Pielke Jr., R.A. 2007: Future economic damage from tropical cyclones: sensitivitiesto societal and climate changes. Philosophical Transactions of the Royal SocietyA, 365, 2717-2729.
Pielke Jr., R.A. and Downton, M.W., 2000: Precipitation and damaging floods: trendsin the United States, 1932-1997. Journal of Climate, 13(20), 3625-3637.
Pielke Jr., R.A., J. Rubiera, C. Landsea, M.L. Fernandez, and R. Klein, 2003: Hurricanevulnerability in Latin America and the Caribbean: normalizeddamage and loss potentials. Natural Hazards Review, 4, 101-114.
Pielke Jr., R.A., S. Agrawala, L.M. Bouwer, I. Burton, S. Changnon, M.H. Glantz, W.H.Hooke, R.J.T. Klein, K. Kunkel, D. Mileti, D. Sarewitz, E.L. Thompkins, N. Stehr, andH. von Storch, 2005: Clarifying the attribution of recent disaster losses: aresponse to Epstein and McCarthy. Bulletin of the American MeteorologicalSociety, 86, 1481-1483.
Pielke Jr., R.A., J. Gratz, C.W. Landsea, D. Collins, M. Saunders, and R. Musulin, 2008:Normalized hurricane damages in the United States: 1900-2005. NaturalHazards Review, 9, 29-42.
Pomeranets, K.S., 2005: Three Centuries of Floods in St-Petersburg. Iskusstvo, St.Petersburg, Russia, 214 pp.
Pompe, J.J. and J.R. Rinehart, 2008: Mitigating damage costs from hurricane strikesalong the southeastern U.S. Coast: A role for insurance markets. Ocean &Coastal Management, 51(12), 782-788.
Power, S.A., 1994: Temporal trends in twig growth of Fagus sylvatica L and theirrelationships with environmental factors. Forestry,67(1), 13-30.
Prasad, P.V.V., K.J. Boote, L.H. Allen, Jr., J.E. Sheehy, and J.M.G. Thomas, 2006: Species,ecotype and cultivar differences in spikelet fertility and harvest index of rice inresponse to high temperature stress. Field Crops Research, 95, 398-411.
Pulhin, J., M. Tapia, and R. Perez, 2010: Integrating disaster risk reduction and climatechange adaptation: Initiatives and challenges in the Philippines. ClimateChange Adaptation and Disaster Risk Reduction: An Asian Perspective.Community, Environment and Disaster Risk Management, 5, 217-235.
Quarantelli, E.L. (ed.), 1998: What is a Disaster? Perspectives on the Question.Routledge, London, UK, 312 pp.
Quinn, W.H., D.O. Zopf, K.S. Short, R.T.W. Kuo Yang, 1978: Historical trends andstatistics of the Southern Oscillation, El Niño, and Indonesian droughts. FisheryBulletin, 76, 663-678.
Rachold, V., H. Lantuit, N. Couture, and W. Pollard (eds.), 2005: Arctic Coastal Dynamics.Report of the 5th International Workshop, McGill University, Montreal, Canada,13-16 October 2004.Reports on Polar and Marine Research 506, Alfred WegenerInstitute for Polar and Marine Research, Bremerhaven, Germany, 131 pp.
Raddatz, C., 2009: The Wrath of God: Macroeconomic Costs of Natural Disasters.Policy Research Working Paper 5039, Development Research Group,Macroeconomics and Growth Team, World Bank, Washington, DC, 35 pp.
Radeloff, V.C., R.B. Hammer, S.I. Stewart, J.S. Fried, S.S. Holcomb, and J.F. Mckeefry,2005: The wildland–urban interface in the United States. EcologicalApplications, 15(3), 799-805.
Raghavan, S. and S. Rajesh, 2003: Trends in tropical cyclone impact: a study inAndhra Pradesh, India. Bulletin of the American Meteorological Society, 84,635-644.
Ranger, N., S. Hallegatte, S. Bhattacharya, M. Bachu, S. Priya, K. Dhore, F. Rafique, P.Mathur, N. Naville, F. Henriet, C. Herweijer, S. Pohit, and J. Corfee-Morlot, 2011:An assessment of the potential impact of climate change on flood risk inMumbai. Climatic Change, 104, 139-167.
Raschky, P.A. 2008: Institutions and the losses from natural disasters. NaturalHazards Earth Systems Science, 8, 627-634.
Rasmussen, T.N., 2004: Macroeconomic Implications of Natural Disasters in theCaribbean. IMF Working Papers WP/04/224, International Monetary Fund,Washington, DC.
Ready, R. and S. Navrud, 2006: International benefit transfer methods and validitytests. Ecological Economics, 60, 429-434.
Reason, C.J.C. and A. Keibel, 2004: Tropical cyclone Eline and its unusual penetrationand impacts over the Southern African mainland. Weather Forecast, 19, 789-805.
Reason, C.J.C., S. Hachigonta, and R.F. Phaladi, 2005: Interannual variability in rainyseason characteristics over the Limpopo region of southern Africa. InternationalJournal of Climatology, 25, 1835-1853.
Rebetez, M. and M. Dobbertin, 2004: Climate change may already threaten Scotspine stands in the Swiss Alps. Theoretical and Applied Climatology, 79, 1-9.
Rehfeldt, G.E., N.L. Crookston, M.V. Warwell, and J.S. Evans, 2006: Empirical analysesof plant-climate relationships for the western United States. InternationalJournal of Plant Sciences, 167(6), 1123-1150.
Reid, H., L. Sahlén, J. MacGregor, and J. Stage, 2007: The economic impact of climatechange in Namibia: How climate change will affect the contribution ofNamibia’s natural resources to its economy. Environmental EconomicsProgramme Discussion Paper 07-02, International Institute for Environment andDevelopment, London, UK, 46 pp.
Reid, W.V., H.A. Mooney, A. Cropper, D. Capistrano, S.R. Carpenter, K. Chopra, P.Dasgupta, T. Dietz, A.K. Duraiappah, R. Hassan, R. Kasperson, R. Leemans, R.M.May, A.J. McMichael, P. Pingali, C. Samper, R. Scholes, R.T. Watson, A.H. Zakri, Z.Shidong, N.J. Ash, E. Bennett, P. Kumar, M.J. Lee, C. Raudsepp-Hearne, H. Simons,J. Thonell, and M.B. Zurek (eds.), 2005: Ecosystems and Human Well-being:Synthesis. Island Press, Washington, DC, 155 pp.
Reilly, J. and D. Schimmelpfennig, 2000: Irreversibility, uncertainty, and learning: por-traits of adaptation to long term climate change. Climatic Change, 45(1), 253-278.
Revi, A., 2008: Climate change risk: an adaptation and mitigation agenda for Indiancities. Environment and Urbanization, 20(1), 207-229, doi:10.1177/0956247808089157.
Revich, B., 2008: Climate Change Impact on Public Health in the Russian Arctic.United Nations in the Russian Federation, Moscow, Russia, 24 pp.
Rey, G., A. Fouillet, É. Jougla, and D. Hémon, 2007: Heat waves, ordinary temperaturefluctuations and mortality in France since 1971. Population (English Edition),62, 457-485, doi:10.3917/pope.703.0457,cairn.info/revue-population-english-2007-3-page-457.htm.
Rich, P.M., D.D. Breshears, and A.B. White, 2008: Phenology of mixed woody-herbaceous ecosystems following extreme events: net and differentialresponses. Ecology, 89(2), 342-352.
Richard, Y., N. Fauchereau, I. Poccard, M. Rouault, and S. Trzaska, 2001: 20th centurydroughts in Southern Africa: spatial and temporal variability, teleconnectionswith oceanic and atmospheric conditions. International Journal of Climatology,21, 873-885.
Rico, M., G. Benito, A.R. Salgueiro, A. Díez-Herrero, and H. Pereira, 2008: Reportedtailings dam failures. A review of the European incidents in the worldwidecontext. Journal of Hazardous Materials, 152, 846-852.
Chapter 4Changes in Impacts of Climate Extremes: Human Systems and Ecosystems

287
Rignot, E., M. Koppes, and I. Velicogna, 2010: Rapid submarine melting of thecalving faces of West Greenland glaciers. Nature Geoscience, 3, 187-191,doi:10.1038/ngeo765.
Rittmaster, R., W. Adamowicz, B. Amiro, and R.T. Pelletier, 2006: Economic analysisof health effects from forest fires. Canadian Journal of Forest Research, 36(4),868-877.
Rizwan, A.M., L. Dennis, and C. Liu, 2008: A review on the generation, determination,and mitigation of urban heat island. Journal of Environmental Sciences, 20(1),120-128.
Rodell, M., I. Velicogna, and J. Famiglietti, 2009: Satellite-based estimates ofgroundwater depletion in India. Nature, 460, 999-1002.
Rodriguez-Oreggia, E., A. de la Fuente, R. de la Torre, H. Moreno, and C. Rodriguez,2010: The Impact of Natural Disasters on Human Development and Poverty atthe Municipal Level in Mexico. CID Working Paper No. 43, Center forInternational Development at Harvard University, Cambridge, MA, USA,34 pp.
Rogers, K. and T. Ralph (eds.), 2010: Floodplain Wetland Biota in the Murry-DarlingBasin: Water and Habitat Requirements. CSIRO Publishing, Collingwood,Victoria, Australia, 348 pp.
Rose, A., 2007: Economic resilience to natural and man-made disasters: Multidisciplinaryorigins and contextual dimensions. Environmental Hazards, 7(4), 383-398.
Rosenzweig, C. and M.L. Parry, 1994: Potential impact of climate change on worldfood supply. Nature, 367, 133-138.
Rosenzweig, C., F.N. Tubiello, R. Goldberg, E. Mills, and J. Bloomfield, 2002:Increased crop damage in the US from excess precipitation under climatechange. Global Environmental Change, 12, 197-202.
Rosenzweig, C., G. Casassa, D.J. Karoly, A. Imeson, C. Liu, A. Menzel, S. Rawlins, T.L.Root, B. Seguin, and P. Tryjanowski, 2007: Assessment of observed changes andresponses in natural and managed systems. In: Climate Change 2007. Impacts,Adaptation and Vulnerability. Contribution of Working Group II to the FourthAssessment Report of the Intergovernmental Panel on Climate Change [Parry,M.L., O.F. Canziani, J.P.Palutikof, P.J. Van Der Linde, and C.E. Hanson (eds.)].Cambridge University Press, Cambridge, UK, pp. 79-131.
Roshydromet, 2005: Strategic Prediction for the Period of up to 2010—2015 ofClimate Change Expected in Russia and Its Impact on Sectors of the RussianNational Economy. Federal Service for Hydrometeorology and EnvironmentalMonitoring (Roshydromet), Moscow, Russia, 24pp.
Roshydromet, 2008: Assessment Report on Climate Change and Its Impacts on theTerritory of the Russian Federation. Federal Service for Hydrometeorology andEnvironmental Monitoring (Roshydromet),Vol.II, Climate Change Impacts,RIHMI-WDC, Obninsk, Kaluga Region, Russia, 288pp.
Rübbelke, D. and S. Vogele, 2011: Impacts of climate change on European criticalinfrastructures: The case of the power sector. Environmental Science & Policy,14, 53-63.
Saenz, R., R.A. Bissell, and F. Paniagua, 1995: Post-disaster malaria in Costa Rica.Prehospital Disaster Medicine, 10(3), 154-160.
Sanderson, M.G., C.D. Jones, W.J. Collins, C.E. Johnson, and R.G. Derwent, 2003:Effect of climate change on isoprene emissions and surface ozone levels.Geophysical Research Letters, 30(18), 1936, doi:10.1029/2003GL017642.
Satterthwaite, D., 2008: Climate Change and Urbanization: Effects andImplications for Urban Governance. Paper presented at the United NationsExpert Meeting on Population Distribution, Urbanization, Internal Migrationand Development, New York, NY, 21-23 January 2008, United NationsPopulation Division, New York, NY, 29 pp., un.org/esa/population/meetings/EGM_PopDist/P16_Satterthwaite.pdf.
Satterthwaite, D., S. Huq, M. Pelling, H. Reid, and P. Romero-Lankao, 2007:Adapting to Climate Change in Urban Areas: The Possibilities and Constraints inLow- and Middle-income Nations. Human Settlements Working Paper Series,Climate Change and Cities No.1, International Institute for Environment andDevelopment, London, UK, 107 pp., pubs.iied.org/pdfs/10549IIED.pdf.
Savelieva, N.I., I.P. Semiletov, G.E. Weller, and L.N. Vasilevskaya, 2004: Climatechange in the northern Asia in the second half of the 20th century. PacificOceanography, 2(1-2), 74-84.
Schär, C. and G. Jendritzky, 2004: Climate change: Hot news from summer 2003.Nature, 432, 559-560.
Schär, C., P.L. Vidale, D. Luthi, C. Frei, C. Haberli, M.A. Liniger, and C. Appenzeller,2004: The role of increasing temperature variability in European summerheatwaves. Nature, 427, 332-336.
Scheffer, M., S. Carpenter, J.A. Foley, C. Folke, and B. Walker, 2001: Catastrophicshifts in ecosystems. Nature, 413, 591-596.
Schelhaas, M.J., G.J. Nabuurs, and A. Schuck, 2003: Natural disturbances in theEuropean forests in the 19th and 20th centuries. Global Change Biology, 9(11),1620-1633.
Schlenker, W. and D. Lobell, 2010: Robust negative impacts of climate change onAfrican agriculture. Environmental Research Letters, 5(1), doi:10.1088/1748-9326/5/1/014010.
Schlenker, W. and M.J. Roberts, 2009: Nonlinear temperature effects indicate severedamages to U.S. crop yields under climate change. Proceedings of the NationalAcademy of Sciences, 106, 15594-15598.
Schmid, D., I. Lederer, P. Much, A. Pichler, and F. Allerberger, 2005: Outbreak ofnorovirus infection associated with contaminated flood water, Salzburg, 2005.Eurosurveillance, 10(24), E050616.
Schmidt, S., C. Kemfert, and E. Faust, 2009: Simulation of Economic Losses fromTropical Cyclones in the Years 2015 and 2050: The Effects of AnthropogenicClimate Change and Growing Wealth. Discussion paper 914, German Institutefor Economic Research, Berlin, Germany, 29 pp.
Schneebeli, M., M. Laternser and W. Ammann, 1997: Destructive snow avalanches andclimate change in the Swiss Alps. Eclogae Geologicae Helvetiae, 90, 457-461.
Schneider, F., A. Buehn, and C.E. Montenegro, 2010. Shadow Economies All over theWorld: New Estimates for 162 Countries from 1999 to 2007. Policy ResearchWorking Paper 5356, World Bank Development Research Group, Poverty andInequality Team and Europe and Central Asia Region, Human DevelopmentEconomics Unit, Washington, DC, 52 pp. www-wds.worldbank.org/external/default/WDSContentServer/IW3P/IB/2010/10/14/000158349_20101014160704/Rendered/PDF/WPS5356.pdf.
Schneider, S.H., W.E. Easterling, and L.O. Mearns, 2000: Adaptation: Sensitivity tonatural variability, agent assumptions and dynamic climate changes. ClimaticChange, 45, 203-221.
Scholes, R.J. and R. Biggs (eds.), 2004: Ecosystem Services in Southern Africa: ARegional Assessment. A contribution to the Millennium Ecosystem Assessment,CSIR, Pretoria, South Africa, 76 pp., www.icp-confluence-sadc.org/sites/default/files/SAfMA_Regional_Report_-_final.pdf.
Schreider, S.Y., D.I. Smith, and A.J. Jakeman, 2000: Climate change impacts on urbanflooding. Climatic Change, 47, 91-115.
Schulze, R., J. Meigh, and M. Horan, 2001: Present and potential future vulnerabilityof eastern and southern Africa’s hydrology and water resources. South AfricanJournal of Science, 97, 150-160.
Schwierz, C., P. Köllner-Heck, E. Zenklusen Mutter, D.N. Bresch, P.L. Vidale, M. Wild,and C. Schär, 2010: Modelling European winter wind storm losses in currentand future climate. Climatic Change, 101, 485-514.
Scott, D., G. McBoyle, B. Mills, and A. Minogue, 2006: Climate change and thesustainability of ski-based tourism in eastern North America. Journal ofSustainable Tourism, 14(4), 367-375
Scott, D., B. Amelung, S. Becken, J.P. Ceron, G. Dubois, S. Gossling, P. Peeters, and M.C.Simpson, 2008: Climate Change and Tourism: Responding to Global Challenges.United Nations World Tourism Organization, Madrid, Spain, 256 pp.
Semyonov, V.A. and A.A. Korshunov, 2006: Floods on the Russian rivers in the late 20thcentury and the early 21st century. Issues of Geography and Geo-ecology, 5, 6-12.
Sénat. 2004. France and the French face the canicule: The lessons of a crisis.Information Report no. 195, Sénat, Paris, France, pp. 59-62 (in French),www.senat.fr/rap/r03-195/r03-19510.html.
Seo, N. and R. Mendelsohn, 2008: An analysis of crop choice: Adapting to climatechange in Latin American farms. Ecological Economics, 67, 109-116.
Shankman, D., B. D. Keim, and J. Song, 2006: Flood frequency in China’s Poyang LakeRegion: trends and teleconnections. International Journal of Climatology, 26,1255-1266.
Chapter 4 Changes in Impacts of Climate Extremes: Human Systems and Ecosystems

288
Shen, C., W.-C. Wang, Z. Hao, and W. Gong, 2008: Characteristics of anomalousprecipitation events over eastern China during the past five centuries. ClimateDynamics, 31(4), 463-476, doi:10.1007/s00382-007-0323-0.
Sherstyukov, A.B., 2009: Climate Change and Its Impact in the Russian PermafrostZone. RIHMI-WDC, Obninsk, Russia, 127 pp.
Skidmore, M. and H. Toya, 2002: Do natural disasters promote long-run growth?Economic Inquiry, 40(4), 664-687.
Skylas, D.J., S.J. Cordwell, P.G. Hains, M.R. Larsen, D.J. Basseal, B.J. Walsh, C.Blumenthal, W. Rathmell, L. Copeland, and C.W. Wrigley, 2002: Heat shock ofwheat during grain filling: proteins associated with heat-intolerance. Journal ofCereal Science, 35, 175-188.
Smit, B., O. Pilifosova, I. Burton, B. Challenger, S. Huq, R. Klein, and G. Yohe, 2001:Adaptation to climate change in the context of sustainable development andequity. In: Climate Change 2001: Impacts, Adaptation, and Vulnerability.Contribution of Working Group II to the Third Assessment Report of theIntergovernmental Panel on Climate Change [McCarthy, J.J., O.F. Canziani, N.A.Leary, D.J. Dokken, and K.S. White (eds.)]. Cambridge University Press,Cambridge, UK, pp. 879-906.
Smith, D.E, S.B. Raper, S. Zerbini, and A. Sánchez-Arcilla (eds.), 2000: Sea LevelChange and Coastal Processes: Implications for Europe. Proceedings of theClimate change and Sea level research in Europe: State of the art and futureresearch needs Conference, Mataro, Spain, April 1997. Office for OfficialPublications of the European Communities, Luxembourg, 247 pp.
Smith, O., 2006: Trends in Transportation Maintenance Related to Climate Change.Paper presented to the Climate Change Workshop, Center for Transportationand Environment, Washington, DC, 29 March, 2006.
Smyth, A.W., G. Altay, G. Deodatis, M. Erdik, G. Franco, P. Gulkan, H. Kunreuther, H.Lus, E. Mete, N. Seeber, and O. Yuzugullu, 2004: Probabilistic benefit-cost analysisfor earthquake damage mitigation: Evaluating measures for apartment housesin Turkey. Earthquake Spectra, 20(1), 171-203.
Spranger, M., 2008: Special nature of disaster risk in megacities. In: NaturalCatastrophe Risk Insurance Mechanisms for Asia and the Pacific, Tokyo, Japan,4-5 November 2008. Munich Reinsurance Company, Munich, Germany, 11 pp.
Stedman, J.R., 2004: The predicted number of air pollution related deaths in the UKduring the August 2003 heatwave. Atmospheric Environment, 38, 1083-1085.
Steffen, W., G. Love, and P.H. Whetton, 2006: Approaches to defining dangerousclimate change: an Australian perspective. In: Avoiding Dangerous ClimateChange [Schellnhuber, H.J., W. Cramer, N. Nakicenovic, T. Wigley, and G. Yohe(eds.)]. Cambridge University Press, Cambridge, UK, 392 pp.
Steiger, R., 2010: The impact of climate change on ski season length andsnowmaking requirements in Tyrol, Austria. Climate Research, 43, 251-262.
Stern, N., 2007: The Economics of Climate Change: The Stern Review. CambridgeUniversity Press, Cambridge, UK.
Stewart, I.D., 2011. A systematic review and scientific critique of methodology in modernurban heat island literature. International Journal of Climatology, 31(2), 200-217.
Stirling, I. and C.L. Parkinson, 2006: Possible effects of climate warming on selectedpopulations of polar bears in the Canadian Arctic. Arctic, 59(3), 261-275.
Stone, D.A. and M.R. Allen, 2005: The end-to-end attribution problem: from emissionsto impacts. Climatic Change, 71, 303-318.
Stott, P.A., D.A. Stone, and M.R. Allen, 2004: Human contribution to the Europeanheatwave of 2003. Nature, 432, 610-614.
Straneo, F., G.S. Hamilton, D.A. Sutherland, L.A. Stearns, F. Davidson, M.O. Hammill,G.B. Stenson and A. Rosing-Asvid, 2010: Rapid circulation of warm subtropicalwaters in a major glacial fjord in East Greenland. Nature Geoscience, 3, 182-186, doi:10.1038/ngeo764.
Stribley, G.H. and M.R. Ashmore, 2002: Quantitative changes in twig growth patternof young woodland beech (Fagus sylvatica L.) in relation to climate and ozonepollution over 10 years. Forest Ecology and Management, 157(1-3), 191-204.
Sturm, M., C. Racine, and K. Tape, 2001: Climate change: Increasing shrub abundancein the Arctic. Nature, 411, 546-547.
Su, H. and G.X. Liu, 2004: Elementary analyses on the progress of grassland firedisaster information management technique. Grassland of China, 26(3), 69-71(in Chinese).
Suzuki, T., 2009: Estimation of inundation damage caused by global warming inthree major bays and western parts of Japan. Global Environmental Research,14(2), 237-246 (in Japanese).
Swenson, S. and J. Wahr, 2009: Monitoring the water balance of Lake Victoria, EastAfrica, from space. Journal of Hydrology, 370, 163-176.
SWIPA, 2011: SWIPA 2011 Assessment Executive Summary: Snow, Water, Ice andPermafrost in the Arctic. Snow, Water, Ice and Permafrost in the Arctic (SWIPA),Arctic Monitoring and Assessment Programme Secretariat, Oslo, Norway, 15pp,amap.no/swipa/SWIPA2011ExecutiveSummaryV2.pdf.
Swiss Re, 2009: The Effects of Climate Change: An Increase in Coastal Flood Damagein Northern Europe. Focus Report, Swiss Reinsurance Company, Zurich,Switzerland, 4 pp., media.swissre.com/documents/the_effects_of_climate_change_an_increase_in_coastal_flood_damage_in_northern_europe.pdf.
Swiss Re, 2010: Natural Catastrophes and Man-Made Disasters in 2009:Catastrophe Claims Few Victims, Insured Losses Fall. Sigma, No 1/2010, SwissReinsurance Company, Zurich, Switzerland, 36 pp.
Swiss Re, 2011: Natural Catastrophes and Man-Made Disasters in 2010: A Year ofDevastating and Costly Events. Sigma, No 1/2011, Swiss Reinsurance Company,Zurich, Switzerland, 36 pp.
Takahashi, T., H. Nakagawa, Y. Satofuka, and K. Kawaike, 2001: Flood and sedimentdisasters triggered by 1999 rainfall in Venezuela; a river restoration plan for analluvial fan. Journal of Natural Disaster Science, 23(2), 65-82.
Takara, K., S. Kim, Y. Tachikawa, and E. Nakita, 2009: Assessing climate changeimpact on water resources in the Tone River Basin, Japan, using super-high-resolution atmospheric model output. Journal of Disaster Research, 4(1),12-23.
Tallis, H.M. and P. Kareiva, 2006: Shaping global environmental decisions usingsocio-ecological models. Trends in Ecology & Evolution, 21(10), 562-568.
Tan, J., Y. Zheng, X. Tang, C. Gup, L. Li, G. Song, X. Zhen, D. Yuan, A. Kalkstein, and F.Li, 2010: The urban heat island and its impact on heat waves and human healthin Shanghai. Journal of Biometeorology, 54(1),
Tape, K., M. Sturm, and C. Racine, 2006: The evidence for shrub expansion inNorthern Alaska and the Pan-Arctic. Global Change Biology, 12, 686-702.
TEEB, 2009: The Economics of Ecosystems and Biodiversity for National andInternational Policy Makers – Summary: responding to the value of nature. TheEconomics of Ecosystems and Biodiversity, UNEP, Geneva, Switzerland, 39 pp.
Thibault, K.M. and J.H. Brown, 2008: Impact of an extreme climatic event oncommunity assembly. Proceedings of the National Academy of Sciences,105(9), 3410-3415.
Thomas, M.F. and M.B. Thorp, 2003: Palaeohydrological reconstructions for tropicalAfrica – evidence and problems. In: Palaeohydrology: Understanding GlobalChange [Benito, G. and K.J. Gregory (eds.)]. John Wiley and Sons, Chichester, UK,pp. 167-192.
Thonicke, K. and W. Cramer, 2006: Long-term trends in vegetation dynamics andforest fires in Brandenburg (Germany) under a changing climate. NaturalHazards, 38, 283-300.
Thornton, P.K., P.G. Jones, T. Owiyo, R.L. Kruska, M. Herrero, P. Kristjanson, A.Notenbaert, N. Bekele, and A. Omolo, with contributions from V. Orindi, B.Otiende, A. Ochieng, S. Bhadwal, K. Anantram, S. Nair, V. Kumar, and U. Kulkar,2006: Mapping Climate Vulnerability and Poverty in Africa. ILRI Report to theDepartment for International Development, International Livestock ResearchInstitute, Nairobi, Kenya, 171 pp.
Tian, X, T. Matsui, S. Li, M. Yoshimoto, K. Kobaysai, and T. Hasegawa. 2010: Heat-induced floret sterility of hybrid rice (Oryza sativa L.) cultivars under humid andlow wind conditions in the field of Jainghan basin, China. Plant ProductionScience, 13(3), 243-251.
Tol, R.S.J., 1995: The damage costs of climate change: Toward more comprehensivecalculations. Environmental and Resource Economics, 5, 353-374.
Tol, R.S.J., 2001: Estimates of the damage costs of climate change. Environmentaland Resource Economics, 21, 47-73.
Tol, R.S.J. and F.P.M. Leek, 1999: Economic analysis of natural disasters. In: Climate,Change and Risk. [Downing, T.E., A.A. Olsthoorn, and R.S.J. Tol (eds.)].Routledge, London, UK, pp. 308-327.
Chapter 4Changes in Impacts of Climate Extremes: Human Systems and Ecosystems

289
Toole, M.J., 1997: Communicable diseases and disease control. In: The Public HealthConsequences of Disasters. [Noji, E.K. (ed.)]. Oxford University Press, New York,NY, pp. 79-100.
Toya, H. and M. Skidmore, 2007: Economic development and the impacts of naturaldisasters. Economics Letters, 94, 20-25.
Trenberth, K.E., P.D. Jones, P. Ambenje, R. Bojariu, D. Easterling, A. Klein Tank, D.Parker, F. Rahimzadeh, J.A. Renwick, M. Rusticucci, B. Soden and P. Zhai, 2007:Observations: Surface and atmospheric climate change. In: Climate Change2007: The Physical Science Basis. Contribution of Working Group I to the FourthAssessment Report of the Intergovernmental Panel on Climate Change[Solomon, S., D. Qin, M. Manning, Z. Chen, M. Marquis, K.B. Averyt, M. Tignor, andH.L. Miller (eds.)]. Cambridge University Press, Cambridge, UK, pp. 237-336.
Trewin, B. and H. Vermont, 2010. Changes in the frequency of record temperaturesin Australia, 1957-2009. Australian Meteorological and Oceanographic Journal,60, 113-119.
Truong, G., A.E. Palm, and F. Felber, 2006: Recent invasion of the mountain birchBetula pubescens ssp. tortuosa above the treeline due to climate change:genetic and ecological study in northern Sweden. Journal of EvolutionaryBiology, 20(1), 369-380.
Tsubo, M., S. Fukai, J. Basnayake, M. Ouk, 2009: Frequency of occurrence of variousdrought types and its impact on performance of photoperiod-sensitive andinsensitive rice genotypes in rainfed lowland conditions in Cambodia. FieldCrops Research, 113, 287-296.
U.S. Census Bureau, 2010: Coastline Population Trends in the United States: 1960to 2008. U.S. Department of Commerce, Economics and StatisticsAdministration, U.S. Census Bureau, Washington, DC, 27 pp., www.census.gov/prod/2010pubs/p25-1139.pdf.
UN-HABITAT, 2008: State of the World’s Cities 2008/2009: Harmonious Cities. UnitedNations Human Settlements Programme, Earthscan, London, UK, 259 pp.
UNCTAD, 2009: Multi-year Expert Meeting on Transport and Trade Facilitation:Maritime Transport and the Climate Change Challenge, 16-18 February 2009.Summary of Proceedings, UNCTAD/SDTE/TLB/2009/1, UN Conference on Tradeand Development, Geneva, Switzerland, 47 pp.
UNDP, 2004: Reducing Disaster Risk: A Challenge for Development. United NationsDevelopment Programme, Bureau for Crisis Prevention and Recovery, NewYork, NY, 146 pp.
UNDP, 2007: Fighting Climate Change: Human Solidarity in a Divided World [Watkins,K. (ed.)]. Human Development Report 2007/2008 of the United NationsDevelopment Programme, Palgrave Macmillan, Basingstoke, UK, 384 pp.
UNECE, 2009: Self-Made Cities: In search of sustainable solutions for informalsettlements in the United Nations Economic Commission for Europe region.United Nations Economic Commission for Europe, United Nations, Geneva,Switzerland, 113 pp.
UNFCCC, 1992: United Nations Framework Convention on Climate Change. UnitedNations, FCCC/INFORMAL/84 GE.05-62220 (E) 200705, Secretariat of theUnited Nations Framework Convention on Climate Change, Bonn, Germany, 24pp., unfccc.int/resource/docs/convkp/conveng.pdf.
UNFCCC, 2007: Investment and Financial Flows to Address Climate Change.Secretariat of the United Nations Framework Convention on Climate Change,Bonn, Germany, 272 pp.
UNHCR, 2010: 2009 Global Trends: Refugees, Asylum-seekers, Returnees, InternallyDisplaced and Stateless Persons. United Nations High Commissioner forRefugees, Division of Programme Support and Management, Geneva,Switzerland, 29 pp.
UNISDR, 2005: Framework for Action 2005-2015. Building the Resilience of Nationsand Communities to Disasters. United Nations International Strategy forDisaster Reduction, Geneva, Switzerland, 22 pp., http://www.unisdr.org/2005/wcdr/intergover/official-doc/L-docs/Hyogo-declaration-english.pdf.
UNISDR, 2009, Global Assessment Report on Disaster Risk Reduction: Risk andPoverty in a Changing Climate – Invest Today for a Safer Tomorrow. United NationsInternational Strategy for Disaster Reduction Secretariat, Geneva, Switzerland,Oriental Press, Manama, Kingdom of Bahrain, 207 pp., www.preventionweb.net/english/hyogo/gar/report/index.php?id=1130&pid:34&pih:2.
UNISDR, 2011: Global Assessment Report on Disaster Risk Reduction: RevealingRisk, Redefining Development. United Nations International Strategy forDisaster Reduction Secretariat, Geneva, Switzerland, Information Press, Oxford,UK, 178 pp.
UNWTO, 2003. Tourism, Peace, and Sustainable Development for Africa: Luanda,Angola, 29-30 May 2003. United Nations World Tourism Organization, Madrid,Spain, 276 pp.
Usbeck, T., T. Wohlgemuth, M. Dobbertin, C. Pfister, A. Bürgi, and M. Rebetez, 2010:Increasing storm damage to forests in Switzerland from 1858 to 2007.Agricultural and Forest Meteorology, 150, 47-55.
Uyarra, M.C., I.M. Côté, J.A. Gill, R.T.T. Tinch, D. Viner, and A.R. Watkinson, 2005:Island-specific preferences of tourists for environmental features: implicationsof climate change for tourism-dependent states. Environmental Conservation,32(1), 11-19.
van der Veen, A., 2004: Disasters and economic damage: macro, meso and microapproaches. Disaster Prevention and Management, 13(4), 274-279.
van der Werf, G.R., J. Dempewolf, S.N. Trigg, J.T. Randerson, P.S. Kasibhatla, L. Giglio,D. Murdiyarso, W. Peters, D.C. Morton, G.J. Collatz, A.J. Dolman, and R.S. DeFries,2008: Climate regulation of fire emissions and deforestation in equatorial Asia.Proceeding of the National Academy of Sciences, 105(51), 20350-20355.
Vanacker, V., M. Vanderschaeghe, G. Govers, E. Willems, J. Poesen, J. Deckers, and B.De Bievre, 2003: Linking hydrological, infinite slope stability and land use changemodels through GIS for assessing the impact of deforestation on landslidesusceptibility in High Andean watersheds. Geomorphology, 52, 299-315.
Vandentorren, S., P. Bretin, A. Zeghnoun, L. Mandereau-Bruno, A. Croisier, C.Cochet, J. Ribéron, I. Siberan, B. Declercq, and M. Ledrans, 2003: August 2003heat wave in France: risk factors for death of elderly people living at home.European Journal of Public Health, 16(6), 583-591.
Vanham, D., E. Fleischhacker, and W. Rauch, 2009: Impact of an extreme dry and hotsummer on water supply security in an alpine region. Water Science andTechnology, 59(3), 469-477.
Veijalainen, N., E. Lotsari, P. Alho, B. Vehviläinen, and J. Käyhkö, 2010: National scaleassessment of climate change impacts on flooding in Finland. Journal ofHydrology, 391(3-4), 333-350.
Venton, C., and P. Venton, 2004: Disaster Preparedness Programmes in India: A CostBenefit Analysis. Network Paper 49, Humanitarian Practice Network atOverseas Development Institute, London, UK, 21 pp., odihpn.org/documents/networkpaper049.pdf.
Verschuren, D., K.R. Laird, and B.F. Cumming, 2000: Rainfall and drought in equatorialeast Africa during the past 1,100 years. Nature, 403, 410-414.
Victorian Bushfires Royal Commission, 2010: The 2009 Victorian BushfiresRoyal Commission Final Report. State Government of Victoria, Melbourne,Australia, 42 pp., royalcommission.vic.gov.au/Commission-Reports/Final-Report.
Villalba, R. and T.T. Veblen, 1997: Regional patterns of tree population agestructures in northern Patagonia: climatic and disturbance influences. Journal ofEcology, 85, 113-124.
Villers, L. and I. Trejo, 2004: Evaluación de la vulnerabilidad en los sistemas forestales.Cambio Climático. In: Una Visión desde México [Martínez, J. and A. FernándezBremauntz (eds.)]. Secretaría de Medio Ambiente y Recursos NaturalesandInstituto Nacional de Ecologia, Tlalpan, Mexico, pp. 239-254.
Voigt, T., H.-M. Füssel, I. Gärtner-Roer, C. Huggel, M. Zemp, and C. Marty, 2010:Impacts of Climate Change On Snow, Ice, and Permafrost in Europe: ObservedTrends, Future Projections, and Socio-Economic Relevance. ETC/ACC TechnicalPaper 2010/13, The European Topic Centre on Air and Climate Change,Bilthoven, The Netherlands, 117 pp.
Vörösmarty, C.J., 2002: Global change, the water cycle, and our search for MaunaLoa. Hydrological Processes, 16, 135-139, doi:10.1002/hyp.527.
Vörösmarty, C.J., E.M. Douglas, P.A. Green, and C. Revenga, 2005: Geospatial indicatorsof emerging water stress: an application to Africa. Ambio, 34, 230-236.
Vos, F., J. Rodriguez, R. Below, and D. Guha-Sapir, 2010: Annual Disaster StatisticalReview 2009: The Numbers and Trends. Centre for Research on theEpidemiology of Disasters, Université Catholique de Louvain, Brussels, Belgium,38 pp.
Chapter 4 Changes in Impacts of Climate Extremes: Human Systems and Ecosystems

290
Wamsley, T.V., M.A. Cialone, J.M. Smith, J.H. Atkinson, and J.D. Rosati, 2010: Thepotential of wetlands in reducing storm surge. Ocean Engineering, 37, 59-68.
Wang, J.X.L. and J.K. Angell, 1999: Air Stagnation Climatology for the United States(1948-1998). NOAA/Air Resources Laboratory ATLAS, No.1, Silver Spring, MD,73 pp.
Wardekker, J.A., A. de Jong, J.M. Knoop, and J.P. van der Sluijs, 2010: Operationalisinga resilience approach to adapting an urban delta to uncertain climate changes.Technological Forecasting & Social Change, 77, 987-998.
Washington, R. and A. Preston, 2006: Extreme wet years over southern Africa: roleof Indian Ocean Sea surface temperatures. Journal of Geophysical Research,111, D15104, doi:10./029/2005 JD006724.
Washington, R., M. Harrison, and D. Conway, 2004: African Climate Report. Reportcommissioned by the UK Government to review African climate science, policyand options for action, UK Department for Environment Food and Rural Affairsand the Department for International Development, London, UK, 45 pp.
West, C.T. and D.G. Lenze, 1994: Modeling the regional impact of natural disasterand recovery: A general framework and an application to Hurricane Andrew.International Regional Science Review, 17(2), 121-150.
West, J.J., M.J. Small, and H. Dowlatabadi, 2001: Storms, investor decisions, and theeconomic impacts of sea level rise. Climatic Change, 48, 317-342.
Westerling, A.L. and B.P. Bryant, 2008: Climate change and wildfire in California.Climatic Change, 87, 231-249.
Westerling, A.L., H.G. Hidalgo, D.R. Cayan, and T.W. Swetnam, 2006: Warming andearlier spring increases western U.S. forest wildfire activity. Science, 313, 940-943.
Wheeler T.R., P.Q. Craufurd, R.H. Ellis, J.R. Porter, and P.V. Vara Prasad, 2000:Temperature variability and the yield of annual crops. Agriculture, Ecosystemsand Environment, 82, 159-167.
Whitehead, P.G., R.L. Wilby, R.W. Battarbee, M. Kernan, and A.J. Wade, 2009: Areview of the potential impacts of climate change on surface water quality.Hydrological Sciences Journal, 54(1), 101-123.
WHO, 2003: The Health Impacts of 2003 Summer Heat-Waves. Briefing note for thedelegations of the fifty-third session of the World Health Organization RegionalCommittee for Europe, Vienna, Austria, 8-11 September 2003, WHO RegionalCommittee for Europe, Copenhagen, Denmark, 12 pp.
WHO/UNICEF, 2000: Global Water Supply and Sanitation Assessment: 2000 Report.World Health Organization, Geneva, 87 pp., who.int/entity/water_sanitation_health/monitoring/jmp2000.pdf.
Widawsky, D.A., and J.C. O’Toole, 1990: Prioritizing the rice biotechnology researchagenda for Eastern India. Rockefeller Foundation Press, New York, NY, 86 pp.
Wilbanks, T.J., P. Romero Lankao, M. Bao, F. Berkhout, S. Cairncross, J.-P. Ceron, M.Kapshe, R. Muir-Wood and R. Zapata-Marti, 2007: Industry, settlement andsociety. In: Climate Change 2007: Impacts, Adaptation and Vulnerability.Contribution of Working Group II to the Fourth Assessment Report of theIntergovernmental Panel on Climate Change [Parry, M.L., O.F. Canziani, J.P.Palutikof, P.J. van der Linden, and C.E. Hanson (eds.)]. Cambridge UniversityPress, Cambridge, UK, pp. 357-390.
Wilbanks, T., V. Bhatt, D. Bilello, S. Bull, J. Ekmann, W. Horak, J. Huang, M. Levine, M.Sale, D. Schmalzer, and M. Scott, 2008. Effects of Climate Change on EnergyProduction and Use in the United States. U.S. Climate Change Science ProgramSynthesis and Assessment Product 4.5, Report by the U.S. Climate ChangeScience Program and the Subcommittee on Global Change Research,Washington, DC, 84 pp.
Wilby, R.L., 2003: Past and projected trends in London’s urban heat island. Weather,58, 251-260.
Wilby, R.L., 2007: A review of climate change impacts on the built environment. BuiltEnvironment, 33(1), 31-45.
Wildavsky, A. 1988: Searching for Safety. Transaction Books, New Brunswick, NJ,253 pp.
Wiley, J.W. and J.M. Wunderle, Jr., 1994: The effects of hurricanes on birds, with specialreference to Caribbean islands. Bird Conservation International, 3, 319-349.
Wisner, B., P. Blaikie, T. Cannon, and I. Davis, 2004: At Risk: Natural Hazards, People’sVulnerability and Disasters. Routledge, London, UK, 471 pp.
Woodruff, R.E., S. Hales, C. Butler, and A.J. McMichael, 2005: Climate Change HealthImpacts in Australia: Effects of Dramatic CO2 Emission Reductions. AustralianConservation Foundation and the Australian Medical Association, Canberra,Australia, 44 pp.
Woodworth, P.L., J.M. Gregory, and R.J. Nicholls, 2005: Long term sea level changesand their impacts. In: The Global Coastal Ocean: Multiscale InterdisciplinaryProcesses [Robinson, A.R. and K.H. Brink (eds.)]. Harvard University Press,Cambridge, MA, pp. 715-753.
World Bank, 2000: Cities, Seas and Storms: Managing Change in Pacific IslandEconomies. Volume IV, Adapting to Climate Change, Papua New Guinea andPacific Islands Country Unit, International Bank for Reconstruction andDevelopment/World Bank, Washington, DC, 48 pp., web.worldbank.org/WBSITE/EXTERNAL/COUNTRIES/EASTASIAPACIFICEXT/PACIFICISLAND-SEXTN/0,,contentMDK:20218394~pagePK:141137~piPK:217854~theSitePK:441883,00.html.
World Bank, 2006: Clean Energy and Development: Towards an InvestmentFramework. World Bank, Washington, DC, 146 pp.
World Bank, 2007: Disasters, Climate Change, and Economic Development in Sub-Saharan Africa: Lessons and Future Directions. Evaluation Brief 3, IndependentEvaluation Group, World Bank, Washington, DC, 31 pp.
World Bank, 2010: Economics of Adaptation to Climate Change: Synthesis Report.World Bank, Washington, DC, 101 pp.
World Bank and UN, 2010: Natural Hazards, UnNatural Disasters: The Economicsof Effective Prevention. International Bank for Reconstruction and Development/World Bank, Washington, DC, 254 pp., gfdrr.org/gfdrr/nhud-home.
Xiao, F. and Z. Xiao, 2010: Characteristics of tropical cyclones in China and theirimpacts analysis. Natural Hazards, 54, 827-837
Yee, E.L., H. Palacio, R.L. Atmar, U. Shah, C. Kilborn, M. Faul, T.E. Gavagan, R.D.Feigin, J. Versalovic, and F.H. Neill, 2007: Widespread outbreak of norovirusgastroenteritis among evacuees of Hurricane Katrina residing in a large“megashelter” in Houston, Texas: lessons learned for prevention. ClinicalInfectious Diseases, 44, 1032-1039.
Yezer, A.M. and C.B. Rubin, 1987: The Local Economic Effects of Natural Disasters.National Hazard Research, George Washington University, Washington, DC.
Yohe, G., J. Neumann, and H. Ameden, 1995: Assessing the economic cost ofgreenhouse induced sea level rise: Methods and applications in support of anational survey. Journal of Environmental Economics and Management, 29,S78-S97.
Yohe, G., J. Neumann, P. Marshall, and H. Ameden, 1996: The economic cost ofgreenhouse induced sea level rise in the United States. Climatic Change, 32,387-410.
Yu, G., Z. Schwartz, and J.E. Walsh, 2009: A weather-resolving index for assessing theimpact of climate change on tourism related climate resources. ClimaticChange, 95, 551-573.
Zebisch, M., T. Grothmann, D. Schröter, C. Hasse, U. Fritsch, and W. Cramer, 2005:Climate change in Germany–Vulnerability and adaptation of climate sensitivesectors. Report commissioned by the Federal Environmental Agency, Germany(UFOPLAN 201 41 253), Potsdam Institute of Climate Impact Research,Potsdam, Germany, 205 pp.
Zhang, J.Q., D.W. Zhou, Z.S. Song, and Z.J. Tong, 2006: A new perception on riskassessment and risk assessment of grassland fire disaster. Journal of BasicScience and Engineering, 14, 56-62 (in Chinese).
Zhang, Q., L. Wu, and Q. Liu, 2009: Tropical cyclone damages in China: 1983-2006.Bulletin of the American Meteorological Society, 90, 489-495.
Zimmerman, R. and C. Faris, 2010: Infrastructure impacts and adaptation challenges.In: Annals of the New York Academy of Sciences. 2010. Blackwell PublishingInc., New York, NY, pp. 63-86.
Chapter 4Changes in Impacts of Climate Extremes: Human Systems and Ecosystems


![PROJECTED CHANGES IN SNOWFALL EXTREMES AND …...Ashfaq et al., 2013]. However, occurrences of extreme low and high snowfall years, which typically have the biggest impacts on society](https://static.fdocuments.net/doc/165x107/5f60541292248c5ea905c89c/projected-changes-in-snowfall-extremes-and-ashfaq-et-al-2013-however-occurrences.jpg)

![1 - Climate Change: New Dimensions in Disaster Risk ... · 1.2.2.1, 1.3.1.1, 1.3.1.2, Box 1-2, Box 1-3, 1.4.2] Management of the risk associated with climate extremes, extreme impacts,](https://static.fdocuments.net/doc/165x107/6046c117ea891014866d4d0b/1-climate-change-new-dimensions-in-disaster-risk-1221-1311-1312.jpg)