4. Case Study:; Chinese Eel · PDF fileCase Study: Chinese Eel Exports. 4.1 Introduction. ......
13
49 4. Case Study: Chinese Eel Exports 4.1 Introduction While currently the high price of eels is stealing the headlines in Japan – the country with the highest consumption of eels – a more significant problem is food safety issues related to im- ported eels. More than 90 per cent of live and processed eel imports in Japan come from China. Ever since malachite green 19 was detected in eels imported from China in 2003, among other incidents (see Chapter 3), there has been a renewed focus on the safety of imported food, especially from China. In 2003, antibiotics were found in processed eels imported from China. This is a violation of the Food Safety Act in Japan, and in- spections were ordered. As a result, the volume of imports from China dropped significantly. In 2004, some signs of recovery were seen, but in August 2005 malachite green was found in eels imported from China, and this has led to inspections monitoring eels imported from Guangdong province, the main cultured eel production site in China, and this caused a temporary halt in all imports from Guangdong. In June 2006, the MHLW adopted the positive list system. Eel imports from China increased in the first half of 2006 to avoid the risk of bans imposed under the new system but in the latter half of 2006 import volumes tumbled. Around the same time in 2006, the media widely reported on the questionable safety of eels imported from China. 20 Box 4.1 Preparation for the Japanese Positive List System In preparing for the transition to a positive list system in Japan, the Ministry of Commerce of the People’s Republic of China (PRC) and the China Chamber of Commerce of Foodstuffs and Native Produce produced a risk assessment of Chinese ag- ricultural and food exports to Japan. 21 The assessment report analyzed the impact of the Japanese positive list system on 11 products (green onions, tea leaves, live and processed eels, matsutake mushrooms, shiitake mushrooms and others) and grouped them into four different categories based on the like- 19 Malachite green is a synthetic antibacterial drug. This substance has been banned from food in the United States since 1981 and in the EU since 2002. Similarly, Japan bans the use of this substance in food. 20 Since 2002, eels imported from China have committed a number of violations. First, it was the detection of antibiotics in eels, followed by detection of malachite green. China has strengthened its domestic effort to improve food safety by certifying eel culture ponds and processing factories, but problems persist to date. 21 See www.china-embassy.or.jp/jpn//jmhzs/t254123.htm (in Japanese). lihoood of violating Japanese food safety requirements. Ac- cording to this report, live and processed eels were classified as products at most risk. Nonetheless, the imports of eels from China increased a little in 2006, mainly reflecting the rush to export eels from China before implementation of the positive list in June. Also, the demand cycle of eel consumption in Japan contributed to this. The high demand season for eels is from April to July and by August the demand subsides. China is the largest eel-producing country in the world. Since the opening of her economy, China has steadily increased pro- duction of both freshwater and marine products (see Figure 4.1). Japan has been the largest export market for Chinese seafood products, accounting for about one-fifth of total exports, fol- lowed by the United States and the EU (see Figure 4.2). Eels ac- count for about 8 per cent of aquatic product exports from China (see Table 4.1). Japan consumes the largest amount of eels in the world, ac- counting for 70 per cent of global consumption (Japan Times, 2012). At its peak in 2000, Japan consumed 160,000 tons of eels but in 2011 the shipment volume of eels declined to 56,000 tons in the face of rising eel prices. 22 22 From the Eel Growers Association, www.wbs.ne.jp/bt/nichimanren/ yousyoku.html Figure 4.1: Production of seafood products in China, 1978–2010 0 1,000 2,000 3,000 4,000 5,000 6,000 marine product freshwater product 1980 1978 1982 1984 1986 1988 1990 1992 1994 1996 1998 2000 2002 2004 2006 2008 2010 Source: Ministry of Agriculture (China) (2009)
Transcript of 4. Case Study:; Chinese Eel · PDF fileCase Study: Chinese Eel Exports. 4.1 Introduction. ......

49
4. Case Study: Chinese Eel Exports
4.1 Introduction
While currently the high price of eels is stealing the headlines in Japan – the country with the highest consumption of eels – a more significant problem is food safety issues related to im-ported eels. More than 90 per cent of live and processed eel imports in Japan come from China. Ever since malachite green19 was detected in eels imported from China in 2003, among other incidents (see Chapter 3), there has been a renewed focus on the safety of imported food, especially from China.
In 2003, antibiotics were found in processed eels imported from China. This is a violation of the Food Safety Act in Japan, and in-spections were ordered. As a result, the volume of imports from China dropped significantly. In 2004, some signs of recovery were seen, but in August 2005 malachite green was found in eels imported from China, and this has led to inspections monitoring eels imported from Guangdong province, the main cultured eel production site in China, and this caused a temporary halt in all imports from Guangdong. In June 2006, the MHLW adopted the positive list system. Eel imports from China increased in the first half of 2006 to avoid the risk of bans imposed under the new system but in the latter half of 2006 import volumes tumbled. Around the same time in 2006, the media widely reported on the questionable safety of eels imported from China.20
Box 4.1 Preparation for the Japanese Positive List System
In preparing for the transition to a positive list system in Japan, the Ministry of Commerce of the People’s Republic of China (PRC) and the China Chamber of Commerce of Foodstuffs and Native Produce produced a risk assessment of Chinese ag-ricultural and food exports to Japan.21 The assessment report analyzed the impact of the Japanese positive list system on 11 products (green onions, tea leaves, live and processed eels, matsutake mushrooms, shiitake mushrooms and others) and grouped them into four different categories based on the like-
19 Malachite green is a synthetic antibacterial drug. This substance has been banned from food in the United States since 1981 and in the EU since 2002. Similarly, Japan bans the use of this substance in food.20 Since 2002, eels imported from China have committed a number of violations. First, it was the detection of antibiotics in eels, followed by detection of malachite green. China has strengthened its domestic effort to improve food safety by certifying eel culture ponds and processing factories, but problems persist to date.21 See www.china-embassy.or.jp/jpn//jmhzs/t254123.htm (in Japanese).
lihoood of violating Japanese food safety requirements. Ac-cording to this report, live and processed eels were classified as products at most risk. Nonetheless, the imports of eels from China increased a little in 2006, mainly reflecting the rush to export eels from China before implementation of the positive list in June. Also, the demand cycle of eel consumption in Japan contributed to this. The high demand season for eels is from April to July and by August the demand subsides.
China is the largest eel-producing country in the world. Since the opening of her economy, China has steadily increased pro-duction of both freshwater and marine products (see Figure 4.1). Japan has been the largest export market for Chinese seafood products, accounting for about one-fifth of total exports, fol-lowed by the United States and the EU (see Figure 4.2). Eels ac-count for about 8 per cent of aquatic product exports from China (see Table 4.1).
Japan consumes the largest amount of eels in the world, ac-counting for 70 per cent of global consumption (Japan Times, 2012). At its peak in 2000, Japan consumed 160,000 tons of eels but in 2011 the shipment volume of eels declined to 56,000 tons in the face of rising eel prices.22
22 From the Eel Growers Association, www.wbs.ne.jp/bt/nichimanren/yousyoku.html
Figure 4.1: Production of seafood products in China, 1978–2010
0
1,000
2,000
3,000
4,000
5,000
6,000
marine product freshwater product
19801978
19821984
19861988
19901992
19941996
19982000
20022004
20062008
2010
Source: Ministry of Agriculture (China) (2009)

50 Regional Trade Standards Compliance Report - East Asia 2013
This case study focuses on live and processed eel exports from China and analyzes the factors associated with rejections of these products at Japanese ports. In the following sections, we examine trends in trade in these products; document causes of the rejections at Japanese ports by the MHLW; provide over-
views of policies implemented by Japan and China to secure the safety of these products; and analyze conditions currently fac-ing cultured eel producers and processors in China.
4.2 Trends in trade in live and processed eels
4.2.1 Trends in exports of live eels from China
Trends in live eel exports in terms of volume and unit prices from 2008 to the first half of 2012 are shown in Table 4.2. Since 2008, live eel exports from China have been decreasing. In 2008, China exported 14,369 tons of live eels to Japan, but the amount has decreased to less than one-third in 2012 (although the figure is only for the first half of 2012). The main cause of this decline in exports is the short supply of leptocephali (eel fry). In general, eels used for food consumption are either Japanese eels (Anguilla japonica) or European eels (Anguilla anguilla). The eel market is fairly unstable, influenced greatly by changes in natural conditions and the overfishing of lepto-cephali. This results in wide fluctuations in eel prices. Although in the past eel prices have seen several steep rises, the year 2012 witnessed the most significant price rise. This instability is caused by the lack of a cost-effective way to artificially incu-bate eels and secure enough leptocephali. To arrest the rapid decline of the European eel, the leptocephalus of the European eel has been designated as a protected species under the Con-vention on International Trade in Endangered Species of Wild Fauna and Flora (the Washington Convention) in 2007 following an EU proposal. Because of this, trade in the European eel has been highly restricted and this in turn led to higher demand for Japanese eels, leading to higher prices. Accompanying the de-crease in volume, the unit price of eels has been rising. In 2008, the unit price was $12.65. By 2012, the unit price had more than trebled to US$44.58.
The top destination for live eel exports from China is Japan. The share exported to Japan was 66.1 per cent in 2009. Even though the overall volume is decreasing, the proportion of ex-ports destined for Japan increased to 85.9 per cent in the first half of 2012. The reason for this increase in the Japanese share of the exports is the rising prices in the Japanese market. The unit price for the Japanese market was $13.41 in 2009, but this has increased to $47.81 in 2012. The other major export markets are Hong Kong (China) and Republic of Korea. These three mar-
Figure 4.2: Main export markets for Chinese seafood products in 2010 (volume base)
Japan
19%
US
17%
EU
16%
Republic ofKorea13%
ASEAN
11%
Hong Kong, China 4%
Taiwan Province of China 3%
Russian Federation 3%
others
14%
Source: Bureau of Fisheries Ministry of Agriculture (China), various years
Table 4.1: Main fish and seafood products exported from China in 2010
Items
Percentage in total export
value of sea-food products
Amount
(10,000 tons)
Value
(US$100 million)
Shrimp 16.3 21.61 15.36
Shellfish 12.3 26.07 11.58
Tilapia 10.7 32.28 10.06
Eel 8.4 4.52 7.9
Pseudosciaena crocea
2.2 5.01 2.07
Others 50.1 134.81 47.24
Total 100.0 224.3 94.21
Source: Bureau of Fisheries Ministry of Agriculture (China), various years
Table 4.2: Trends in Chinese live eel exports, 2008–2012 (first half)
Importer
2008 2009 2010 2011 2012
volume (tons)
unit price (US$/ton)
volume (tons)
unit price (US$/ton)
volume (tons)
unit price (US$/ton)
volume (tons)
unit price (US$/ton)
volume (tons)
unit price (US$/ton)
Total 14,369 12.65 10,591 11.37 8,672 15.69 5,107 27.66 2,052 44.58
Japan 9,982 14.23 7,002 13.41 6,116 18.13 4,270 30.33 1,763 47.81
Hong Kong, China 1,956 7.45 1,759 7.98 1,203 10.92 632 17.70 253 25.20
Republic of Korea 2,431 10.53 1,809 6.86 1,353 8.92 203 13.60 13 29.80
Note: Data are the aggregation of volumes from January to December. For 2011, the data are from January to November, and for 2012, from January to June.
Source: Department of Foreign Trade, PRC Ministry of Commerce
51
kets account for almost all of the exports of live eels from China. However, the Republic of Korea has been unable to import live eels from China since May 2011 because the prices offered in its market were lower than those prevailing in the other markets.
4.2.2 Trends in exports of processed eels from China
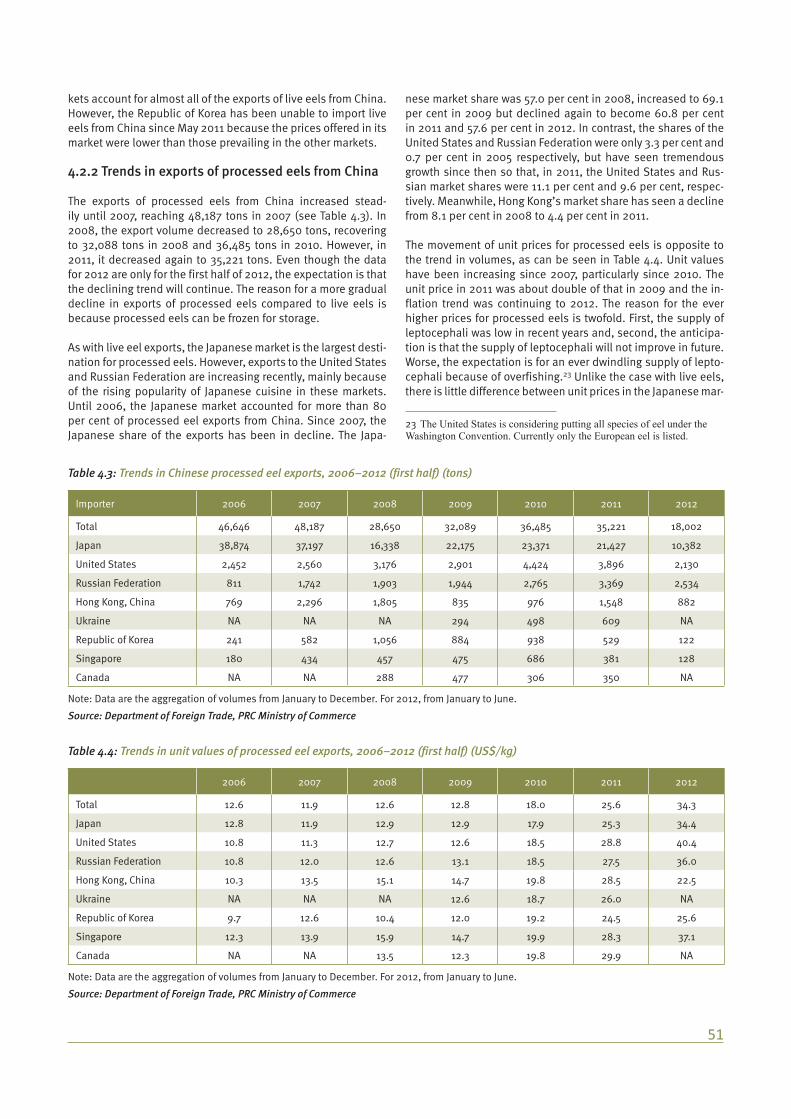
The exports of processed eels from China increased stead-ily until 2007, reaching 48,187 tons in 2007 (see Table 4.3). In 2008, the export volume decreased to 28,650 tons, recovering to 32,088 tons in 2008 and 36,485 tons in 2010. However, in 2011, it decreased again to 35,221 tons. Even though the data for 2012 are only for the first half of 2012, the expectation is that the declining trend will continue. The reason for a more gradual decline in exports of processed eels compared to live eels is because processed eels can be frozen for storage.
As with live eel exports, the Japanese market is the largest desti-nation for processed eels. However, exports to the United States and Russian Federation are increasing recently, mainly because of the rising popularity of Japanese cuisine in these markets. Until 2006, the Japanese market accounted for more than 80 per cent of processed eel exports from China. Since 2007, the Japanese share of the exports has been in decline. The Japa-
nese market share was 57.0 per cent in 2008, increased to 69.1 per cent in 2009 but declined again to become 60.8 per cent in 2011 and 57.6 per cent in 2012. In contrast, the shares of the United States and Russian Federation were only 3.3 per cent and 0.7 per cent in 2005 respectively, but have seen tremendous growth since then so that, in 2011, the United States and Rus-sian market shares were 11.1 per cent and 9.6 per cent, respec-tively. Meanwhile, Hong Kong’s market share has seen a decline from 8.1 per cent in 2008 to 4.4 per cent in 2011.
The movement of unit prices for processed eels is opposite to the trend in volumes, as can be seen in Table 4.4. Unit values have been increasing since 2007, particularly since 2010. The unit price in 2011 was about double of that in 2009 and the in-flation trend was continuing to 2012. The reason for the ever higher prices for processed eels is twofold. First, the supply of leptocephali was low in recent years and, second, the anticipa-tion is that the supply of leptocephali will not improve in future. Worse, the expectation is for an ever dwindling supply of lepto-cephali because of overfishing.23 Unlike the case with live eels, there is little difference between unit prices in the Japanese mar-
23 The United States is considering putting all species of eel under the Washington Convention. Currently only the European eel is listed.
Table 4.3: Trends in Chinese processed eel exports, 2006–2012 (first half) (tons)
Importer 2006 2007 2008 2009 2010 2011 2012
Total 46,646 48,187 28,650 32,089 36,485 35,221 18,002
Japan 38,874 37,197 16,338 22,175 23,371 21,427 10,382
United States 2,452 2,560 3,176 2,901 4,424 3,896 2,130
Russian Federation 811 1,742 1,903 1,944 2,765 3,369 2,534
Hong Kong, China 769 2,296 1,805 835 976 1,548 882
Ukraine NA NA NA 294 498 609 NA
Republic of Korea 241 582 1,056 884 938 529 122
Singapore 180 434 457 475 686 381 128
Canada NA NA 288 477 306 350 NA
Note: Data are the aggregation of volumes from January to December. For 2012, from January to June.
Source: Department of Foreign Trade, PRC Ministry of Commerce
Table 4.4: Trends in unit values of processed eel exports, 2006–2012 (first half) (US$/kg)
2006 2007 2008 2009 2010 2011 2012
Total 12.6 11.9 12.6 12.8 18.0 25.6 34.3
Japan 12.8 11.9 12.9 12.9 17.9 25.3 34.4
United States 10.8 11.3 12.7 12.6 18.5 28.8 40.4
Russian Federation 10.8 12.0 12.6 13.1 18.5 27.5 36.0
Hong Kong, China 10.3 13.5 15.1 14.7 19.8 28.5 22.5
Ukraine NA NA NA 12.6 18.7 26.0 NA
Republic of Korea 9.7 12.6 10.4 12.0 19.2 24.5 25.6
Singapore 12.3 13.9 15.9 14.7 19.9 28.3 37.1
Canada NA NA 13.5 12.3 19.8 29.9 NA
Note: Data are the aggregation of volumes from January to December. For 2012, from January to June.
Source: Department of Foreign Trade, PRC Ministry of Commerce

52 Regional Trade Standards Compliance Report - East Asia 2013
ket and elsewhere. This is because the costs associated with maintaining the food safety and quality of processed eels does not differ significantly across markets. In addition, processed eels destined for the Japanese market use both Japanese and European eels.
4.3 Import rejections by Japan and underlying reasons for rejectionsThe purpose of this section is to analyze past cases of import rejections in an attempt to uncover the underlying reasons for such rejections and food safety violations. A particular focus will be on the analysis of live and processed eels exported from China to Japan. The Japanese MHLW publicises on its website information on imported shipments in violation of food safety regulation detected through regular inspections at various en-try ports.24 The information provided by the MHLW includes the reasons why food safety violations occurred, firms responsible for production, and importing firms. Based on these data, we analyze at which stage of production the violations were prob-ably caused.
Table 4.5 lists the number of import rejections of fish and fish-ery products reported by the MHLW between 2006 and 2010. It shows that China experienced the most rejections throughout the period. However, China is also the largest trading partner of Japan and, as a consequence, Japan imports large quantities of products including fish and fishery products from China. Fig-ure 2.1 above displays the number of rejections scaled by the amount of imports. Using this measure shows that imported fishery products from China do not face rejections as frequently as those from Viet Nam and the Philippines. Nonetheless, the frequency of rejection is higher compared to Indonesia, Repub-lic of Korea, and Thailand.
24 See www.mhlw.go.jp/english/topics/importedfoods/index.html.
4.3.1 Live eels
Since June 2006, there have been 39 violations associated with live eel imports from China to Japan with 23 import rejections in 2006 alone. The number of rejections was reduced to 10 in 2007, and since then only a handful of cases have been found. Within the last six years, detections of malachite green have been the major reason for rejections. Other causes include de-tections of furazolidone (AOZ), dicofol and endosulfan. In some cases, the reasons for rejections include mixing live eels with accumulated malachite green among those without; residues of these drugs and chemicals in the soils where culture ponds are located; use of eels with accumulated malachite green as feed; and runoffs of agricultural chemicals into culture ponds (see Mori, Nabeshima and Yamada (2013) for details).
Leucomalachite green is created when a living being metabo-lises malachite green, which is a synthetic antibacterial agent. Malachite green has been used as a dyestuff and anti-mould agent for ornamental fish. It is also used in forensic science, mainly for detection of latent blood. In Japan, malachite green in cultured seafood and foodstuffs is banned by the Pharma-ceutical Affairs Law. A study conducted by the Food Safety Com-mittee of Japan in November 2005 on the effects of malachite green and leucomalachite green on human health revealed no conclusive evidence for cancer risks associated with these sub-stances. However, similar experiments on rodents suggest that these substances could be carcinogenic and genotoxic. Also, the recommendation was that it is not appropriate to set an ac-ceptable daily intake (ADI) for malachite green and leucomala-chite green.
In China, malachite green was included on the “list of banned drugs and chemicals for the use in animals mainly as food con-sumption” in May 2002. After this inclusion, the use of mala-chite green was completely banned. However, the cases involv-ing leucomalachite green do not seem to stop. In the United States and the EU, the carcinogenic potential of malachite green
Table 4.5: Number of Japanese import rejections of fish and fishery products, 2006–2010
Country 2006 2007 2008 2009 2010 Average
Brunei Darussalam 0 0 0 0 0 0
Cambodia 0 0 0 0 0 0
China 179 154 82 81 110 121
Hong Kong, China 0 1 1 1 2 1
Indonesia 18 47 20 8 17 22
Republic of Korea 9 23 27 13 25 19
Lao PDR 0 0 0 0 0 0
Malaysia 1 1 0 2 0 1
Myanmar 1 0 0 0 0 0
Philippines 10 9 24 11 4 12
Singapore 0 0 0 0 0 0
Thailand 49 39 38 47 38 42
Viet Nam 117 147 60 57 83 93
Source: UNIDO dataset and analysis, based on Japanese MHLW data

53
was identified as early as the 1970s. The United States banned its use for food in 1981 and the EU (along with Norway) in 2002.
Endosulfan is a chlorine-based agricultural chemical, used mainly as an insecticide and anti-mould agent. This chemical is effective on a wide range of insects and its superior bioaccumu-lation characteristics produce long-lasting effects. This in turn makes its use controversial. Because of its toxicity to human health, the use of this chemical was negotiated under the Stock-holm Convention in April 2011 and ratified. The ban will take ef-fect in 2012, but many countries including the United States and the EU have already banned its use. The MHLW reported that the detection of endosulfan in live eels imported from China came from the agricultural runoffs containing endosulfan from nearby farms pouring into culture ponds.
Dicofol is a pesticide (especially effective on red spider mites) closely related to DDT (dichlorodiphenyltrichloroethane). Fura-zolidone is a synthetic antibiotic. Even though it is an effective antibiotic, it has been identified as a possible carcinogenic and this prompted the United States Food and Drug Administration (FDA) to ban its use in 1991.
4.3.2 Processed eels
Between the second half of 2006 and the first half of 2012, Japa-nese authorities rejected 50 shipments of processed eels from China, half of them because of the detection of leucomalachite green. Other cases of rejections involved detections of coliform (seven cases), enrofloxacin (seven cases), and three cases with furazolidone (there were several cases with multiple violations). So, even for processed eels, violations due to leucomalachite green are the most frequent. In addition to these chemical resi-dues, there were seven cases with coliform violations related to the sanitary conditions of the factories. Enrofloxacin is an anti-biotic mainly used for domestic animals (such as pigs and rab-bits). Reported side effects of enrofloxacin include skin rashes and vomiting. In Japan, the use of enrofloxacin as a food addi-tive is prohibited.
Based on publicly available data,25 the reasons for leucomala-chite green violations are: accidental inclusion of products that were rejected by prior inspections; accidental inclusion of live eels that have been inspected on behalf of other farms; lefto-vers from the previous year; lack of proper management at the eel culture farm; accidental inclusion of eels destined for the Chinese market; soil contamination by malachite green; soil contaminations by other drugs and chemicals; and storing eels to regulate shipment volumes.
4.3.3 Summary
From looking at the rejection data made public by the MHLW, the reasons for food safety violations of live and processed eels originate mainly at the eel culture farm. The predominant rea-son for violations for live and processed eels is the detection of chemicals such as malachite green that are prohibited in food. This could be caused by the shortage of leptocephali. Since completely artificial breeding of eels is still impossible, eel cul-
25 See information from the MHLW available at www.mhlw.go.jp/topics/yunyu/tp0130-1ae.html.
ture firms need to rely on a steady supply of leptocephali. How-ever, in recent years, these have been in short supply, prompt-ing firms to make sure that as many as possible of them grow. This in turn leads to excessive use of medicines and chemicals. Relative to this, violations (such as coliform) caused at the fac-tory or in transit are few in number. In addition, there are several cases where agricultural chemicals have spilled over into ponds where eels are cultured. In the next section, we focus our atten-tion on quality control at the eel culture farm.
4.4 Eel production in China
4.4.1 Moving locations of main production sites
From the 1970s to the 1990s live eels imported by Japan mainly came from Taiwan Province of China. But with rapid economic development in Taiwan Province of China and associated ap-preciation in land prices in Taiwan Province of China, many eel culture farms were converted to other uses. In addition, manu-facturing facilities that sprung up near eel culture farms caused severe water pollution. At the same time, with the opening of China to the global market, China has become an attractive place for eel culture because of abundant cheap land available for eel culture, suitable climate conditions, and ease of exports from China. Gradually the centre of eel culture has moved from Taiwan Province of China to mainland China.
In the 2000s, those Taiwanese eel culture farmers chose Guang-dong province as the favourite place for relocation of their activi-ties. Guangdong province is located in the coastal area of China. Especially important was the existence of the mouth of the Pearl River there, where the leptocephali swim up from the ocean into the river. This meant that leptocephali could be caught and eel culture ponds could be established along with processing fac-tories. The agglomeration of eel industries appeared in Shunde, located in the western part of the Pearl River Delta (PRD). How-ever, with the rapid economic growth of Shunde, the concentra-tion of eel culture ponds has shifted to Taishan, farther west-ward in the Pearl River Delta in search of cheap abundant land.
4.4.2 The characteristics of eel production in China
In the latter half of the 2000s, eel production spread from Guang-dong and Fujian provinces to Shandong and Jiangxi provinces. In China, it is mostly firms that are involved in eel industries, rather than farmers. However, in some areas, large farmers with enough financial resources operate eel culture ponds. Culturing or processing eels requires substantial capital and smallholder famers cannot enter this industry in China.
Two of the main producing regions, Guangdong and Fujian, dif-fer in their characteristics. Guangdong province mainly rears Japanese eels. In contrast, Fujian province specialises in Euro-pean eels. Because Guangdong province produces Japanese eels, their products (live and processed eels) are mainly des-tined for the Japanese market. The necessary technologies for eel culture and processing came from Taiwan Province of China. Since the reason for relocation of production from Taiwan Prov-ince of China to mainland China was lack of available land in Taiwan Province of China, the land areas for eel culture oper-
54 Regional Trade Standards Compliance Report - East Asia 2013
ated by Taiwanese firms are fairly large in Guangdong province. As their products are for the Japanese market, the unit prices of their products are also high. About 70 per cent of eel indus-try firms in Guangdong specialise in exports. The remaining 30 per cent or so produce mainly for the Chinese domestic market. Since Guangdong province is subtropical with warm tempera-tures throughout the year, culture ponds are located outdoors.
By contrast, Fujian province specialises in European eels, which are not marketed widely in Japan, so firms there do not export live eels to Japan but instead focus on processed eel exports. There are a number of small to medium firms culturing lepto-cephalus in Fujian and many firms export to the United States, Russian Federation and the EU. Also, more firms produce for the Chinese domestic market than is the case in Guangdong prov-ince. Because the distance between Taiwan Province of China and Fujian is small, some Taiwanese firms also established their operations in Fujian. However, since the late 2000s, Chinese firms with ample financial resources have entered the industry. Since the average temperature in Fujian is lower than in Guang-dong, eel culture is mainly done indoors.
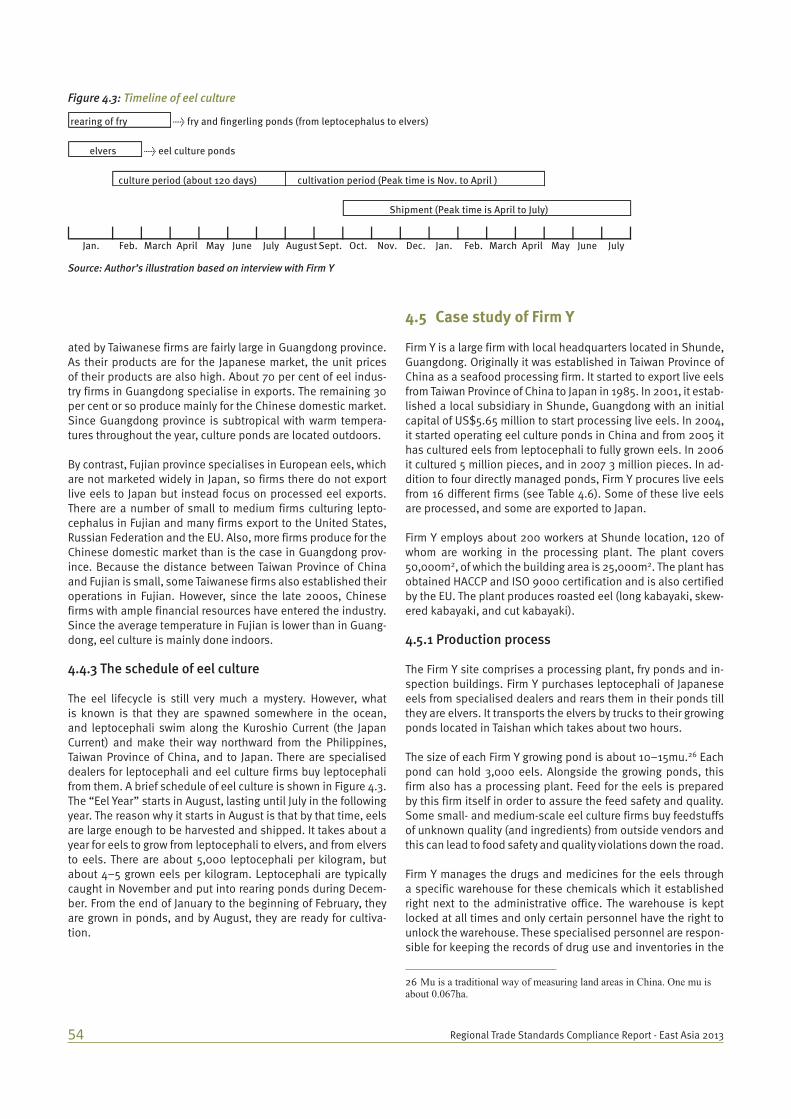
4.4.3 The schedule of eel culture
The eel lifecycle is still very much a mystery. However, what is known is that they are spawned somewhere in the ocean, and leptocephali swim along the Kuroshio Current (the Japan Current) and make their way northward from the Philippines, Taiwan Province of China, and to Japan. There are specialised dealers for leptocephali and eel culture firms buy leptocephali from them. A brief schedule of eel culture is shown in Figure 4.3. The “Eel Year” starts in August, lasting until July in the following year. The reason why it starts in August is that by that time, eels are large enough to be harvested and shipped. It takes about a year for eels to grow from leptocephali to elvers, and from elvers to eels. There are about 5,000 leptocephali per kilogram, but about 4–5 grown eels per kilogram. Leptocephali are typically caught in November and put into rearing ponds during Decem-ber. From the end of January to the beginning of February, they are grown in ponds, and by August, they are ready for cultiva-tion.
4.5 Case study of Firm Y
Firm Y is a large firm with local headquarters located in Shunde, Guangdong. Originally it was established in Taiwan Province of China as a seafood processing firm. It started to export live eels from Taiwan Province of China to Japan in 1985. In 2001, it estab-lished a local subsidiary in Shunde, Guangdong with an initial capital of US$5.65 million to start processing live eels. In 2004, it started operating eel culture ponds in China and from 2005 it has cultured eels from leptocephali to fully grown eels. In 2006 it cultured 5 million pieces, and in 2007 3 million pieces. In ad-dition to four directly managed ponds, Firm Y procures live eels from 16 different firms (see Table 4.6). Some of these live eels are processed, and some are exported to Japan.
Firm Y employs about 200 workers at Shunde location, 120 of whom are working in the processing plant. The plant covers 50,000m2, of which the building area is 25,000m2. The plant has obtained HACCP and ISO 9000 certification and is also certified by the EU. The plant produces roasted eel (long kabayaki, skew-ered kabayaki, and cut kabayaki).
4.5.1 Production process
The Firm Y site comprises a processing plant, fry ponds and in-spection buildings. Firm Y purchases leptocephali of Japanese eels from specialised dealers and rears them in their ponds till they are elvers. It transports the elvers by trucks to their growing ponds located in Taishan which takes about two hours.
The size of each Firm Y growing pond is about 10–15mu.26 Each pond can hold 3,000 eels. Alongside the growing ponds, this firm also has a processing plant. Feed for the eels is prepared by this firm itself in order to assure the feed safety and quality. Some small- and medium-scale eel culture firms buy feedstuffs of unknown quality (and ingredients) from outside vendors and this can lead to food safety and quality violations down the road.
Firm Y manages the drugs and medicines for the eels through a specific warehouse for these chemicals which it established right next to the administrative office. The warehouse is kept locked at all times and only certain personnel have the right to unlock the warehouse. These specialised personnel are respon-sible for keeping the records of drug use and inventories in the
26 Mu is a traditional way of measuring land areas in China. One mu is about 0.067ha.
Figure 4.3: Timeline of eel culture
rearing of fry → fry and fingerling ponds (from leptocephalus to elvers)
→ eel culture ponds
Jan. Feb. March April May June July August Sept. Oct. Nov. Dec. Jan. Feb. March April May June July
culture period (about 120 days) cultivation period (Peak time is Nov. to April )
Shipment (Peak time is April to July)
elvers
Source: Author’s illustration based on interview with Firm Y

55
Table 4.6: Basic characteristics of eel culture of firms dealing with Firm Y
Location Size of ponds Annual output Number of fry ponds
(10,000m2) (tons) (10,000 pieces)
Firm 1 Zhongshan City 75.4 500 220
Firm 2 Taishan City Doushan Township 60.0 750 200~300
Firm 3 Taishan City Doushan Township 66.6 1,100 400~500
Firm 4 Taishan City Doushan Township 22.0 300 200
Firm 5 Shunde District Lundun Township 20.0 200 80~100
Firm 6 Shunde District Lundun Township 8.9 150 50
Firm 7 Taishan City Doushan Township 70.0 2,000 800
Firm 8 Shunde District Junan Township 16.8 150 50~62
Directly managed pond 1 Sanshui City 35.0 500 20
Firm 9 Taishan City Chonglou Township 21.4 200 80
Firm 10 Taishan City Duanfen Township 53.2 800 300
Firm 11 Taishan City Doushan Township 20.0 200 80
Firm 12 Shunde District 33.3 500 200
Firm 13 Taishan City Haiyan Township 53.3 370 150
Directly managed pond 2 Enping City Hengbei Township 30.0 200 75
Directly managed pond 3 Enping City Hengbei Township 23.0 200 75
Firm 14 Taishan City Chixi Township 40.0 700 200
Directly managed pond 4 Taishan City 23.0 300 130
Firm 15 Zhongshan City Minzhong Township 25.0 500 200
Firm 16 Taishan City Wencun Township 26.0 550 150
Source: Author’s compilation based on interview with Firm Y
firm’s tailor-made electronic system in order to establish drug use traceability. Firm Y also hires security guards to safeguard the chemical warehouse and eel ponds to prevent thefts. Ac-cording to the managers of Firm Y, a large firm such as this can invest in the facilities and processes necessary to control eel quality and safety. However, smaller firms may not have enough resources for these investments, and their quality control falls short of export quality. Many of these smaller firms, thus, con-centrate on the Chinese domestic market instead.
One of the main concerns when raising eels is the outbreak of diseases. Diseases tend to occur from spring to fall when tem-perature fluctuations are more volatile.
Exports of live eels from Firm Y are based on eels raised in their own ponds where the quality of eels can be assured and traced. Firm Y procures eels from outside growers for processed eel ex-ports. There are 16 firms that Firm Y procures eels from. They are all located in the PRD region. The capacity of their ponds is 35.82 million pieces of leptocephalus. Firm Y provides technical assistance to these outside growers. The main assistance is in the use of feeds: what kind of feeds to buy; from where to buy the feeds; the timing of feeding; and the amount of feeding. This kind of technical assistance to outside growers is necessary to ensure eel quality.
4.5.2 Manufacture and export of processed eels
Table 4.7 lists the typical steps associated with eel processing. When Firm Y prepares eels for processing, the first thing it does is to check the eels for agricultural chemicals, drug residues and the existence of heavy metals. They do this voluntarily to ensure that the quality of eels used for inputs meets the safety regula-tions of the export market. After eels pass the inspection, they are cut, cleansed, and charcoal-broiled. After the initial broil-ing, taste inspection is conducted to check for flavour, smell, texture, and aesthetic qualities (four human senses). After this taste inspection, the eels are steamed and broiled again.27 This point marks the end of primary eel processing. Depending on customer requests, the firm also provides secondary process-ing which involves cutting processed eels suitable for sushi and Unaju (eel bowl), and Uzaku (eel and cucumber salad). Custom-ers typically requesting secondary processing include grocery stores, Gyudon chains,28 and convenience stores.
The processed eels are then vacuum-sealed, frozen, and packed in a box. Once these boxes are loaded onto trucks, they go through Shunde Government Export Quarantine on their own site and are exported from Shunde port to Japan via Hong Kong
27 This is a typical preparation method for the Kanto region of Japan. In the Kansai region, eels are prepared without steaming.28 Gyudon, literally beef bowl, is a very popular Japanese dish. It can be found in many Japanese restaurants and some fast food chains specialise exclusively in it.

56 Regional Trade Standards Compliance Report - East Asia 2013
(China). Live eels are transported from Taishan to Guangzhou Airport and from there exported by air to Narita Airport in Tokyo. Those destined for Nagoya or Kansai Airports are exported from Guangzhou Airport via Shanghai Airport.
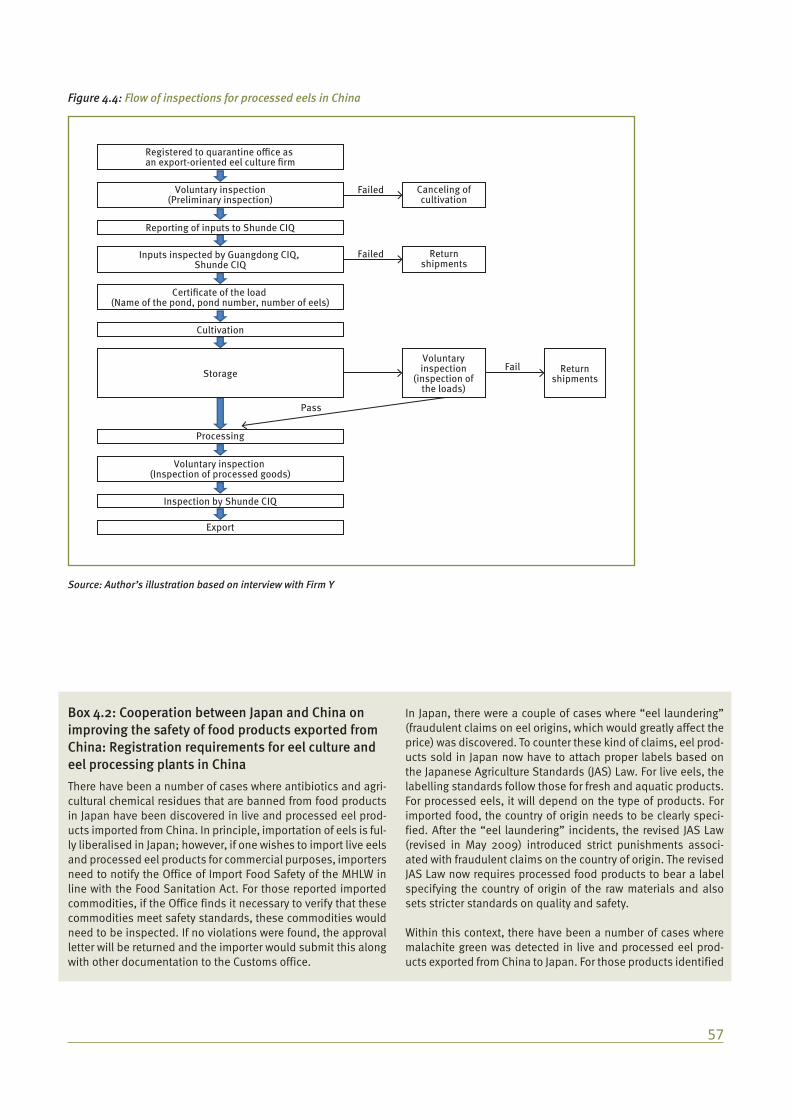
4.5.3 Inspections of eels
Figure 4.4 shows the flow of inspections along the production line for processed eel products by Firm Y. Growing ponds listed in Table 4.6 were registered as “growing ponds for exports” at
Guangdong China Inspection and Quarantine Service (CIQ). Firm Y conducts sample inspections of eels from outside growers. Once these eels pass inspection, Firm Y buys them and reports them to Shunde CIQ, where their processing factory is located, as inputs into goods for export. If eels do not pass Firm Y’s in-spection, Firm Y may cancel cultivation of eels from that pond, or purchase these eels for products destined for the Chinese market or to sell them to eel traders. The inspection standards at this stage are based on the standards of Guangdong CIQ but modified by Firm Y.
Table 4.7: Steps in eel processing
Stages Processes Location
1
culture
purchase of fry
Shunde2 rearing of fry (in-house facility)
3 culturing of elvers (vertical buckets, 150 pieces/bucket)
4 transfer of elvers to own ponds (own trucks)Taishan
5 cultivation (from own ponds)
6
input procurement
transfer of adult eels from ponds to factory (own truck)
Shunde
7 purchase of adult eels from outside growers (trucks of logistics firms)
8 storage in vertical buckets (for one day, removal of mud, weighing, cutting tails)
9 inspection voluntary inspection for agricultural chemicals, drugs, heavy metals (two days)
10
primary processing
cutting of eels, cleansing
11 butterflied and skewered
12 charcoal-broiled
13 check temperature of meat
14 check for taste
15 steam
16 kabayaki (additional broiling)
17 rapid freeze (50 minutes)
18
(secondary processing)
defrost
19 cut based on customer orders
20 vacuum-sealed
21 inspection
22 rapid freeze (120 minutes)
23 inspection metals inspection
24
shipping
sorting
25 sorting by lot (5kg, typically 43 pieces)
26 boxing, labelling
27 loading onto trucks
28 record and photograph the shipment
29
export
China Export quarantine
30 To Hong Kong, China (from Shunde to Hong Kong takes one day, ships every Friday) Hong Kong, China31 loaded into containers
32 arrival at Japan (from Shunde to Japan takes 6 days, arriving on Thursdays) Japan
Source: Author’s illustration based on interview with Firm Y
57
Figure 4.4: Flow of inspections for processed eels in China
Failed Canceling ofcultivation
Returnshipments
Voluntaryinspection
(inspection ofthe loads)
Returnshipments
Failed
Fail
Pass
Registered to quarantine office as an export-oriented eel culture firm
Voluntary inspection(Preliminary inspection)
Reporting of inputs to Shunde CIQ
Inputs inspected by Guangdong CIQ, Shunde CIQ
Certificate of the load (Name of the pond, pond number, number of eels)
Cultivation
Storage
Processing
Voluntary inspection (Inspection of processed goods)
Inspection by Shunde CIQ
Export
Source: Author’s illustration based on interview with Firm Y
Box 4.2: Cooperation between Japan and China on improving the safety of food products exported from China: Registration requirements for eel culture and eel processing plants in ChinaThere have been a number of cases where antibiotics and agri-cultural chemical residues that are banned from food products in Japan have been discovered in live and processed eel prod-ucts imported from China. In principle, importation of eels is ful-ly liberalised in Japan; however, if one wishes to import live eels and processed eel products for commercial purposes, importers need to notify the Office of Import Food Safety of the MHLW in line with the Food Sanitation Act. For those reported imported commodities, if the Office finds it necessary to verify that these commodities meet safety standards, these commodities would need to be inspected. If no violations were found, the approval letter will be returned and the importer would submit this along with other documentation to the Customs office.
In Japan, there were a couple of cases where “eel laundering” (fraudulent claims on eel origins, which would greatly affect the price) was discovered. To counter these kind of claims, eel prod-ucts sold in Japan now have to attach proper labels based on the Japanese Agriculture Standards (JAS) Law. For live eels, the labelling standards follow those for fresh and aquatic products. For processed eels, it will depend on the type of products. For imported food, the country of origin needs to be clearly speci-fied. After the “eel laundering” incidents, the revised JAS Law (revised in May 2009) introduced strict punishments associ-ated with fraudulent claims on the country of origin. The revised JAS Law now requires processed food products to bear a label specifying the country of origin of the raw materials and also sets stricter standards on quality and safety.
Within this context, there have been a number of cases where malachite green was detected in live and processed eel prod-ucts exported from China to Japan. For those products identified

58 Regional Trade Standards Compliance Report - East Asia 2013
as containing malachite green, the MHLW conducts “ordered in-spections” based on the provisions of Paragraph 3, Article 26 of the Food Sanitation Law. In addition, processed eel products (roasted eels and processed eel liver products) detected as containing enrofloxacin are also subject to ordered inspections. Because the volume of eel product exports to Japan plummeted after these incidents, the Chinese government launched a reg-istration system to certify eel-growing ponds and processing plants to prevent the use of malachite green in the entire eel production for exports.
In contrast, for inspections for the agricultural chemical resi-dues oxolinic acid (mainly used as antibiotics) and sulfameth-azine (growth-enhancing chemicals), if the following conditions are met, the agreement between China and Japan is that these products do not need to go through ordered inspections. The conditions are that the raw materials (live eels) must come from registered eel-growing ponds; products must be processed in registered processing firms; and, for oxolinic acid, must be certi-fied by the CIQs.
In 2012, there were 86 registered eel culture firms for live eels in China, of which 66 are located in Guangdong and 13 are in Fujian. There are 382 firms registered as eel culture firms exclu-sively for processing and 55 processing plants are registered in China.
After this, there are random sampling inspections of eels by Guangdong and Shunde CIQs. If the eels pass inspection, then Firm Y initiates the export process by obtaining the certificates and starting cultivation of the cultured eels. Once the eels ar-rive at the processing factory in Shunde by truck, they are sorted according to size. At this stage, Firm Y conducts further inspec-tions. If eels purchased from outside growers fail inspection, they are returned to the growers. If eels grown in ponds man-aged by Firm Y fail, they are directed to eel products meant for the Chinese domestic market or sold to eel traders. Those that pass inspection will be processed for export.
During the processing stage, Firm Y conducts inspections as noted in Table 4.7. The main focus of inspection during this stage is on metals detection. Once products pass all these in-spections, they go through final inspections by Shunde CIQ, which has jurisdiction over the port of Shunde, from where this firm exports. The export inspection is conducted by Shunde CIQ officials within Firm Y’s facility. The inspection of live eels for export is conducted by Taishan CIQ, where the growing ponds are located.
4.5.4 Inspection of growing ponds by the Chinese government
The CIQ inspections are conducted at three different stages: before purchase; at the time of purchase; and at the time of ex-port. CIQs also conduct additional random inspections on the management and chemical usage of registered growing ponds
for live and processed eels destined for the Japanese market. The standards adopted by CIQs for each inspection are listed in Table 4.8.
Table 4.8: Products inspected by CIQs
1. Before purchase
Inspections for residual synthetic antibacterial drugs (HPLC method)
Sulfonamide 100ppb
Oxolinic acid 10ppb
Enrofloxacin 20ppb
Malachite green 2ppb
Leucomalachite green 2ppb
Furazolidone 0.5ppb
Semicarbazide 0.5ppb
(Monitoring inspection: CP: 0.3ppb; CIP: 20ppb; NOR: 20ppb)
Inspections for heavy metals (AAS method)
Mercury 300ppb
Cadmium 50ppb
Once these inspections have been passed, eels can be ordered.
2. At the time of purchase
Inspections for residual synthetic antibacterial drugs (HPLC method)
Oxolinic acid 10ppb
Enrofloxacin 20ppb
Malachite green 2ppb
Leucomalachite green 2ppb
Furazolidone 0.5ppb
Semicarbazide 0.5ppb
Furaltadone 0.5ppb
Nitrofurantoin 0.5ppb
Monitoring inspection
Sulfonamide 100ppb
Oxolinic acid 10ppb
Chloramphenicol 0.3ppb
Ciprofloxacin 20ppb
Norfloxacin 20ppb
Endosulfan 2ppb
Inspections for heavy metals (AAS method)
Mercury 300ppb
Cadmium 50ppb
Once these inspections have been passed, eels can be exported to Japan

59
4.5.5 Investments in inspection and testing infra-structure
Since 2005, Firm Y has strengthened its own inspection capabil-ity. There are two reasons why Firm Y has invested in doing this. First, the costs of inspection by outside vendors have increased substantially and this made it economical for Firm Y to own its own testing equipment. Second, by having in-house testing fa-cilities, Firm Y can offer inspection services to other firms, gen-erating additional cash flow. Firm Y has invested in creating a specialised room for inspections, purchased necessary testing equipment and hired specialist personnel.
Firm Y had enough financial resources to invest in its own test-ing facility. However, only a handful of eel-related firms have sufficient means to purchase rather expensive equipment. The price of some equipment is as high as US$1 million. Firm Y owns testing equipment that even Shunde District AQSIQ does not possess.
In the inspection room, Firm Y possesses testing equipment for chloramphenicol, for various metals, for malachite green, and for AOZ (oxazolidone), as well as liquid chromatography equip-ment (purchased in April 2006) and gas chromatography equip-ment (purchased in October 2006). In addition to purchasing testing equipment, Firm Y also strengthened its internal inspec-tion routine to check for micro-organisms (such as coli form, staphylococcus, salmonella), water quality and chemical resi-dues.
4.5.6 Traceability
Firm Y has created an electronic system which makes the pro-cessing history and inspection results available to potential buyers and governments within and outside China. In this sys-tem, a user can input an inspection number and it will produce the history of processing carried out. The production lot number is 15 digits, composed of the pond number; eel grower number; production management number; and the date of production.
In addition to this, Firm Y also publishes the history of drug us-age on their website. Users can input the drug record number and find the name of the drug used in the pond where the eels came from; the dosage of drug applied; and the date of usage. By using these two systems, users can search the records on water use in the growing ponds, drug usage, feed records and preserved samples by production lot.
4.5.7 The causes of residues of agricultural chemicals and drugs
Japanese import rejections of live and processed eels peaked in 2006 and have decreased since then. In addition to official MHLW reports on the reasons for the rejections (mainly pres-ence of prohibited chemicals), the authors also interviewed the CEO of Firm Y about the possible causes of chemical residues in eels. During the interview, seven possible causes were identi-fied.
First is impatience on the part of eel growers. It takes a certain period of time for eels to metabolise drugs and growers should therefore wait for a set time after drugs were applied before releasing eels into ponds. But some growers do not wait long enough and release eels prematurely into ponds, leading to drug residue problems.
Secondly, some growers do not know how to apply drugs appro-priately. Some growers give too much drugs, which eels cannot metabolise so the drug starts to accumulate in their bodies.
Third, application of inappropriate feeds and drugs such as those containing malachite green continues. In addition, some feeds circulating in the market may contain inappropriate ingre-dients.
Fourth, water contamination of eel ponds can occur when ty-phoons hit the region. Guangdong and Fujian provinces are reg-ularly hit by typhoons. Severe rainfall and associated floods can cause water from agricultural fields, irrigation, ponds for shrimp and other fish to run into eel ponds. These waters could contain substances that are prohibited in eels.
Fifth is the problem of soil contamination. Some eel growers ro-tate the type of seafood for culture, especially when leptocepha-li are hard to get. Some of the eel growers are shifting to shrimp and blowfish culture. In addition, rich farmers sometimes oper-ate a seafood culture business on the side, and determine what to grow depending on the market price movements of various seafoods. When a farmer grows shrimp, the typical length of the contract with the buyer is for two to three years. Because cultured shrimp is mainly for the Chinese domestic market, the quality control and management of the ponds are not as strict as for exported eels. Various kinds of drugs and chemicals could be used and they could accumulate in the soil. When these ponds are converted into eel-growing ponds, problems associ-ated with contaminated soils could arise.
Sixth, there is a problem of mixing eels from different produc-ers. Many small and medium firms grow eels for the Chinese domestic market. Some firms buy these eels and mix them with eels meant for export.
3. At the time of export
Inspections for residual synthetic antibacterial drugs (HPLC method)
Oxolinic acid 10ppb
Enrofloxacin 20ppb
Malachite green 2ppb
Leucomalachite green 2ppb
Furazolidone 0.5ppb
Semicarbazide 0.5ppb
Furaltadone 0.5ppb
Nitrofurantoin 0.5ppb
Inspections for residual synthetic antibacterial drugs (GC method)
Endosulfan 2ppb
Note: HPLC is high performance liquid chromatography; AAS is atomic absorption spectrometry; GC is gas chromatography; ppb denotes parts per billion.
Source: Author’s compilation based on interview with Firm Y

60 Regional Trade Standards Compliance Report - East Asia 2013
Finally, the problem with a lack of proper management of ag-ricultural chemicals and drugs persists. Even though the laws concerning management of agricultural chemicals and drugs are enacted and regulations are updated, enforcement of these laws and regulations is still wanting. On the production side, the problem of usage of copy-products and inferior products still exists. At the distribution and retail stage, there are a num-ber of cases when these chemicals and drugs are sold to those sectors prohibited from using them and, in some cases, mixing of other materials and products. On the user’s side, there are still a number of growers who do not understand the proper us-age of these chemicals and drugs. As for malachite green, even though it is now banned in China, it can still be purchased quite freely from small agricultural shops or over the internet. The Chi-nese government is now considering revising the “Regulations on Pesticide Administration” (Promulgated by Decree No. 216 of the State Council of the People’s Republic of China on May 8, 1997, amended in accordance with the Decision of the State Council on Amending the Regulations on Pesticide Administra-tion on November 29, 2001). The revision would mandate sell-ers of agricultural chemicals and drugs to keep sales records and conduct inspection of these chemicals; it would require a licence to sell agricultural chemicals and drugs; and it would mandate sellers of these drugs and chemicals to properly edu-cate the buyers.
4.6 Case study of Firm T
Firm T is a middleman with investors from Taiwan Province of China, located in Taixi, the western part of the Pearl River Delta. Their main line of business is the sale and purchase of eels for processing. The firm originally moved from Taiwan Province of China to Shunde in 2002. As the growing ponds were migrating towards Taixi, the firm also moved their local headquarters to Taixi four years ago. Firm T purchases cultured eels from growers in Taixi, sorts them according to size, and sells them to process-ing firms. There are ten firms like Firm T in Taixi. Of these ten firms, five (including Firm T) specialise in eels for processing.
Of these five firms, only Firm T is a foreign-invested firm and the rest are domestically owned firms.
In 2012, leptocephali were in a short supply and their price increased from 3RMB to 45RMB. Reflecting the rising prices of leptocephali, the price of eels that Firm T buys also increased to 45–50RMB per piece in 2012 compared with only 12–13RMB per piece in 2011. Typically middlemen can make about 3RMB/kg profit, but in 2012 the expectation is that profit will be almost zero. The amount of eels for processing that Firm T handles has not changed significantly between 2011 (600–700 tons) and the first half of 2012 (200–300 tons), but it has declined compared to 2010.
4.6.1 Distribution of eels
Figure 4.5 shows the various routes associated with distribution of eels in China. Specialised firms catch leptocephali and sell these to eel growers. Large firms typically grow leptocephali into elvers in different growing ponds from where the elvers become fully grown eels. Small and medium firms typically grow lepto-cephali and elvers in the same location.
Large processing firms typically are vertically integrated and have their own growing ponds. Once cultivation is complete, eels are exported as live eels or sent to processing plants for further processing. In addition to eels from their own ponds, large firms also purchase from other ponds through middle-men. Small and medium processing firms do not typically own growing ponds; they rely exclusively on middlemen for eels to process and sell them to the Chinese domestic market.
4.6.2 The quality control problem from the perspec-tive of middlemen
Firm T purchases eels from eel growers and transports these eels to processing plants using their own trucks. Typically, the time taken from purchase to delivery of eels to processing plant is less than nine hours. This is to keep the eels fresh. Since op-erating and managing growing ponds is costly, only a handful
Figure 4.5: Distribution routes for live and processed eels in China
Overseas (excl.Japan)
China
Culture Distribution Processing Markets
Registered eel growers registered processing plants
Japan
Verticallyintegrated ponds
large firms
independentponds
middlemen
small and mediumfirms
unregistered eel growers unregistered processing plants
Source: Author, based on interviews with local firms

61
of processing firms own growing ponds. While these large inte-grated firms take quality control matters into their own hands, small and medium firms rely on middlemen to control eel qual-ity. As traders, they need to ensure that they can deal with a large quantity of eels. At the same time, the ability to secure enough high-quality eels is also important. At this point, if pro-cessed eels are rejected at the ports of importing countries, the responsibility (including liability) lies on the shoulders of the traders, not on the processing firms. Processing firms will dis-continue business with traders who supplied lower-quality eels. Even though processing firms purchase eels from outside grow-ers, they do not provide any technical assistance to those grow-ers. It is the traders who need to ensure that eels grown in these ponds are of high quality and, in a sense, traders face most risk. Because of this and to secure enough high-quality eels, these traders provide essential information to eel growers. However, even with the best of intentions, when eel production is low or there are high costs and prices, these traders may be forced to purchase lower-quality eels. This in turn could lead to rejections at the ports of importing countries down the road.
4.7 Conclusions and policy implications
The purpose of this case study is to shed light on the underlying reasons for rejections of live and processed eels exported from China to Japan. Using publicly available data from the Japanese MHLW and field surveys in China, we examined possible causes and suggest the following conclusions:
First, the analysis of MHLW data reveals that rejections of live and processed eels were mainly caused by detections of mala-chite green in eels. Other reasons for rejections are also related to the use of drugs in eel-growing ponds. Because of this, the most fruitful remedial actions can be taken at the eel-growing ponds, especially regarding proper management of drugs and chemicals. This is especially so for processing firms and inde-pendent eel culture firms.
For processed eels, there were a number of cases with coliform detections. Improvements in sanitary conditions at the process-ing plants are essential to weed out this kind of problem.
Large firms tend to be vertically integrated and they manage and operate their own growing ponds. However, directly managed ponds cannot supply enough eels and even large firms need to rely on traders to obtain additional inputs from independent eel growers. By doing so, the processing firms cannot directly man-age and ensure the quality of eels. The responsibility for this quality control is shifted to traders and this can be a source of problems down the road and needs to be addressed. However, changes in business practices are hard if not impossible to im-plement through policy.
Instead, policies should focus on providing technical assistance to independent eel growers so that they understand and can fully implement quality control. Similar kinds of training can be offered to traders. Funding for this kind of activity could be mo-bilized by the eel grower association locally to could cover the cost of technicians and/or advisers who would be stationed in Taixi to provide technical assistance to small- and medium-sized growers. In addition, agricultural chemicals and drugs could be managed by independent operators who can keep track of us-age of these chemicals by individual growers.
Even if the system of quality control is strengthened in the eel-growing industry, if basic inputs such as drugs and other chemi-cals are mislabelled or product imitations are widely available, then the whole effort could be for naught. For this reason, tougher enforcement of product imitations, especially feeds and agricultural chemicals and drugs, is essential.
Finally to raise awareness of the importance of quality control, an “eel-growing manual” could be produced and distributed to small and medium firms and traders, along with requiring each eel grower to post a schedule of proper drug application on their sites.