4. BACKGROUND THEORY
17
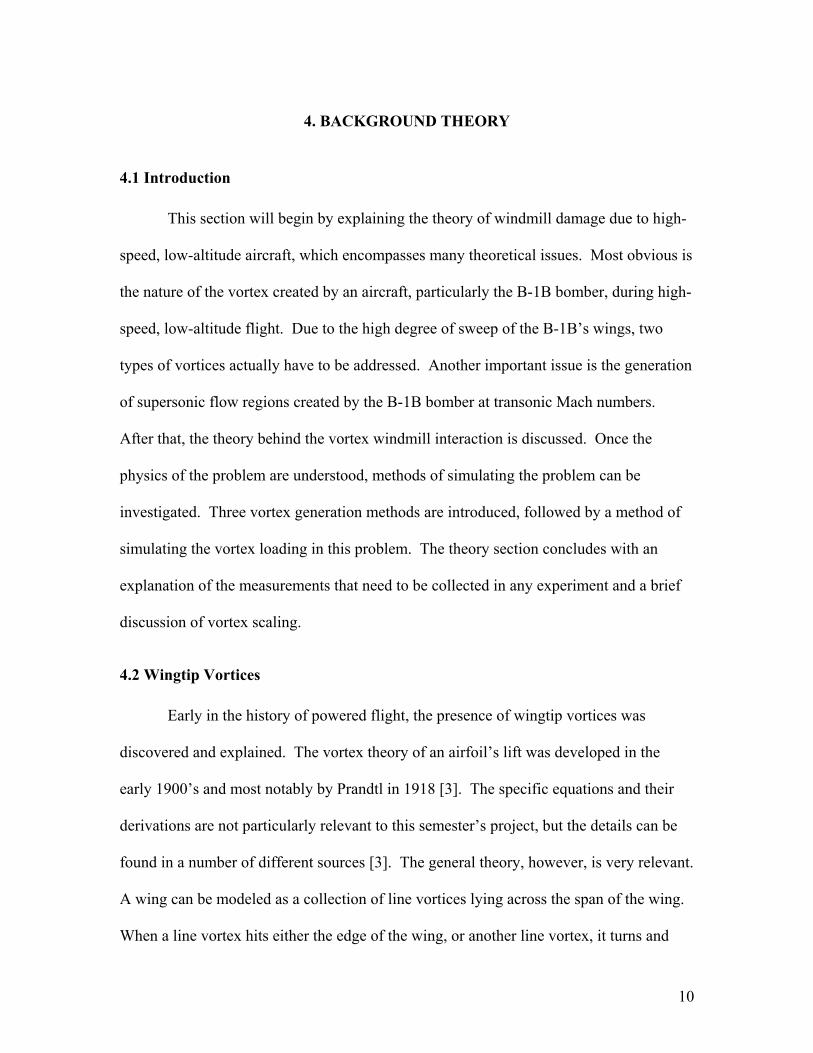
10 4. BACKGROUND THEORY 4.1 Introduction This section will begin by explaining the theory of windmill damage due to high- speed, low-altitude aircraft, which encompasses many theoretical issues. Most obvious is the nature of the vortex created by an aircraft, particularly the B-1B bomber, during high- speed, low-altitude flight. Due to the high degree of sweep of the B-1B’s wings, two types of vortices actually have to be addressed. Another important issue is the generation of supersonic flow regions created by the B-1B bomber at transonic Mach numbers. After that, the theory behind the vortex windmill interaction is discussed. Once the physics of the problem are understood, methods of simulating the problem can be investigated. Three vortex generation methods are introduced, followed by a method of simulating the vortex loading in this problem. The theory section concludes with an explanation of the measurements that need to be collected in any experiment and a brief discussion of vortex scaling. 4.2 Wingtip Vortices Early in the history of powered flight, the presence of wingtip vortices was discovered and explained. The vortex theory of an airfoil’s lift was developed in the early 1900’s and most notably by Prandtl in 1918 [3]. The specific equations and their derivations are not particularly relevant to this semester’s project, but the details can be found in a number of different sources [3]. The general theory, however, is very relevant. A wing can be modeled as a collection of line vortices lying across the span of the wing. When a line vortex hits either the edge of the wing, or another line vortex, it turns and
Transcript of 4. BACKGROUND THEORY
10
4. BACKGROUND THEORY
4.1 Introduction This section will begin by explaining the theory of windmill damage due to high-
speed, low-altitude aircraft, which encompasses many theoretical issues. Most obvious is
the nature of the vortex created by an aircraft, particularly the B-1B bomber, during high-
speed, low-altitude flight. Due to the high degree of sweep of the B-1B’s wings, two
types of vortices actually have to be addressed. Another important issue is the generation
of supersonic flow regions created by the B-1B bomber at transonic Mach numbers.
After that, the theory behind the vortex windmill interaction is discussed. Once the
physics of the problem are understood, methods of simulating the problem can be
investigated. Three vortex generation methods are introduced, followed by a method of
simulating the vortex loading in this problem. The theory section concludes with an
explanation of the measurements that need to be collected in any experiment and a brief
discussion of vortex scaling.
4.2 Wingtip Vortices Early in the history of powered flight, the presence of wingtip vortices was
discovered and explained. The vortex theory of an airfoil’s lift was developed in the
early 1900’s and most notably by Prandtl in 1918 [3]. The specific equations and their
derivations are not particularly relevant to this semester’s project, but the details can be
found in a number of different sources [3]. The general theory, however, is very relevant.
A wing can be modeled as a collection of line vortices lying across the span of the wing.
When a line vortex hits either the edge of the wing, or another line vortex, it turns and

11
propagates downstream. The vortices from each side of the wing merge and create a
single pair of wingtip vortices slightly downstream of the trailing edge as seen in figure
4.1. Prandtl’s lifting line theory is an excellent approximation for conventional subsonic
aircraft, but the theory involves some assumptions. One is a low sweep angle and
another is that the air is incompressible. Neither assumption is true for a B-1B bomber
flying at a speed of approximately Mach 0.7 – 0.9. At those transonic Mach numbers, the
bomber’s wings will be swept back at an angle of about 67º and the air is certainly not
incompressible [3]. Modifications to the Prandtl theory have somewhat accounted for
these problems. The Prandtl theory can predict the presence and strength of wingtip
vortices to an extent, but it is not capable of fully explaining the wake of the B-1B
bomber [4].
Figure 4.1: Diagram of a pair of wingtip vortices shed off a conventional wing [2]
4.3 Leading Edge Vortices One of the clearest examples of a leading edge vortex is air flow over a delta wing.
An excellent diagram of this type of vortex can be seen in figure 4.2(a) [3]. In addition, a
12
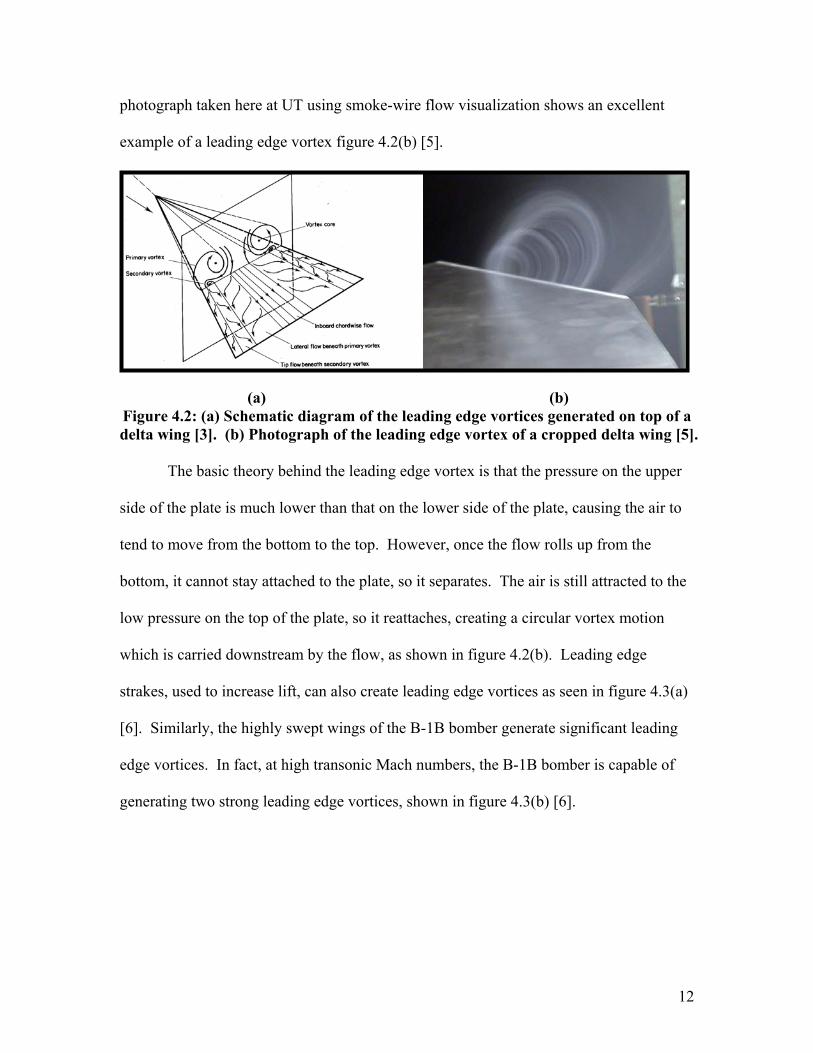
photograph taken here at UT using smoke-wire flow visualization shows an excellent
example of a leading edge vortex figure 4.2(b) [5].
(a) (b) Figure 4.2: (a) Schematic diagram of the leading edge vortices generated on top of a delta wing [3]. (b) Photograph of the leading edge vortex of a cropped delta wing [5].
The basic theory behind the leading edge vortex is that the pressure on the upper
side of the plate is much lower than that on the lower side of the plate, causing the air to
tend to move from the bottom to the top. However, once the flow rolls up from the
bottom, it cannot stay attached to the plate, so it separates. The air is still attracted to the
low pressure on the top of the plate, so it reattaches, creating a circular vortex motion
which is carried downstream by the flow, as shown in figure 4.2(b). Leading edge
strakes, used to increase lift, can also create leading edge vortices as seen in figure 4.3(a)
[6]. Similarly, the highly swept wings of the B-1B bomber generate significant leading
edge vortices. In fact, at high transonic Mach numbers, the B-1B bomber is capable of
generating two strong leading edge vortices, shown in figure 4.3(b) [6].

13
(a) (b)
Figure 4.3: (a) Vortices caused by the leading edge strakes of an F-16 [6]. (b) Diagram of the leading edge vortices on a B-1 bomber at high transonic speeds [6].
Another issue related to the generation of leading edge vortices is vortex
interaction. Because of the presence of wingtip vortices and possibly two leading edge
vortices, vortex interaction could drastically change the character of the vortex or vortices
shed from the B-1B bomber. In a declaration written in defense of the US Air Force
regarding the issue of vortex-windmill interaction, Dr. Skujins states that the leading edge
vortex would actually increase the rate at which the vortex dissipated [7]. Unfortunately,
he gives no reference to support that assertion. In contrast, a reference found by this
group seems to contradict his statement, showing that vortices turning in the same
direction will tend to move closer to one another and possibly even merge, as shown in
figure 4.4 [8]. Although figure 4.4 only shows the interaction of wingtip vortices, the
report goes on to state that leading edge vortices behave similarly.

14
Figure 4.4: Diagram of the merging of two wingtip vortices [8].
Despite this possible inconsistency, the numbers that were obtained by Dr.
Skujins in the Air Force Report were verified by Dr. Stearman and are being used to
characterize the vortex. The analysis appears to be a good one, but it was made in 1979,
before the B-1B was even built. A better analysis of the vortex would be preferable, but
not absolutely necessary.
4.4 Supersonic Damage Although the B-1B bomber is incapable of supersonic speeds at the altitudes
being investigated in this project, it can fly at rather high transonic speeds [7]. Figure 4.5
shows how supersonic flow disturbances, even at transonic airspeeds, can have very
significant effects far away from the aircraft. In figure 4.5 the F-14 fighter is creating

15
winds of over 50 mph on the ocean’s surface at an altitude of about 100 ft, which is an
altitude of about three wingspans (38 ft. span) [2].
Figure 4.5: Supersonic flow disturbances around an F-14A over the ocean [1].
Similar supersonic flow regions have been seen on the B-1A bomber, which is very
similar to the B-1B. This indicates that the B-1B could also produce strong transonic
pressure disturbances three wingspans below the aircraft. For the B-1B, an altitude of
three wingspans is 237 ft. (79 ft. span), which is near the 300 ft. at which the bombers are
supposed to fly in West Texas [2]. Dr. Stearman has also heard of an Israeli Defense
Force raid over Lebanon in which fighters were able to cause significant damage with
shock waves without dropping any bombs [2]. Since this investigation is far too difficult
to attempt to experimentally reproduce, the investigation was limited to a literature search
to find the reference Dr. Stearman is looking for.

16
4.5 Momentum Transfer to the Windmill The main goal of this project is to design and conduct an experiment that will
show the effect of a vortex on a windmill. All the explorations of the nature of the vortex
are important, but the critical assumption of the investigation is that vortices from the B-
1B bomber are coming into contact with windmills. Even Dr. Skujins’ declaration for the
US Air Force admits that a vortex with a 47 mph maximum core velocity could likely be
present at the height of the windmill [7]. Additional research could adjust that number
somewhat, but the most important question that remains is what the effect of the vortex
on the windmill is.
This topic is one that apparently has not been experimentally researched before.
In fact, no papers appear to have been written on the topic at all. A good possible
theoretical explanation is given in Dr. Stearman’s second declaration [4]. When a vortex
is shed off of an aircraft’s wing, whether it is a wingtip or leading edge vortex, it
descends towards the ground and weakens. At ground level the vortex is certainly very
weak, but at the height of the windmill (~40 ft), the vortex can be quite strong [7]. The
windmill is designed to face the prevailing wind, so when the bottom of the vortex
descends and comes into contact with the windmill, the windmill will turn to face that
wind (figure 4.6). That wind could be around 47 mph, maybe higher, causing the
windmill to spin very fast. As the center of the vortex descends to the same height as the
center of the rotor disk, the bottom of the disk is pushed towards the support structure
while the top of the disk is pushed away from the support structure. This results in a
powerful moment being exerted on the rotor disk (figure 4.7a). As the vortex descends

17
further, the top of the vortex becomes the dominant wind, causing the windmill to spin
about its yaw axis 180 degrees to face it (figure 4.7b).
(a) (b) Figure 4.6: (a) Windmill in still air before descent of vortex and (b) rotation of
windmill to meet initial vortex flow direction [4].
(a) (b) Figure 4.7: (a) A moment is exerted on the rotor disk when the vortex is at the same height as the windmill rotation axis. (b) The windmill rapidly rotates 180° to meet
final vortex flow direction [4].
Dr. Skujins correctly notes that wind gusts in excess of 47 mph occur 9 to 12
times each year in West Texas, and concludes that the vortices from the B-1B would
18
cause no more damage than the natural wind gusts [7]. However, this conclusion ignores
two key issues. The first is that the vortex core diameter is approximately equal to the
diameter of the rotor disk, meaning that the rotor disk sees 47 mph in opposite directions
at the two points farthest away from its center. In contrast, wind gusts are very
unidirectional. A wind gust would push nearly uniformly on the rotor disk and would not
cause much of a bending moment. A vortex may be able to cause a large bending
moment. The second issue is that Mr. Young has witnessed the windmill yawing very
quickly as predicted. The windmill is rigidly oriented toward a 47 mph wind when the
wind suddenly changes direction. A natural gust would have little chance of reproducing
that effect. Furthermore, it should be noted that the windmill is probably not designed to
withstand these loads, so it is very difficult to predict the windmill’s response outside of
direct observation. This is the fundamental motivation of the project.
4.6 Vortex Generation Probably the greatest challenge in this problem is the generation of a suitable
vortex. Vortex generation is certainly not difficult, but the constraints of this problem
make standard vortex generation methods and the facilities available at UT mostly
unsuitable. The methods considered so far have been inserting wings of various shapes
into the flow of a wind tunnel, using a Vornado® fan, and placing the windmill in the
wake of a fan, propeller, or rotor disk being driven by the flow in a wind tunnel. The
following paragraphs will describe the different methods in greater detail
19
4.6.1 Conventional Wing Vortices Placing different types of wings in a wind tunnel will almost always generate
some type of vortex. The conventional wing and the delta wing were explained
previously in sections 4.2 and 4.3. Theses vortices can be easily generated in a wind
tunnel and result in very well defined vortices. Another method that has been very
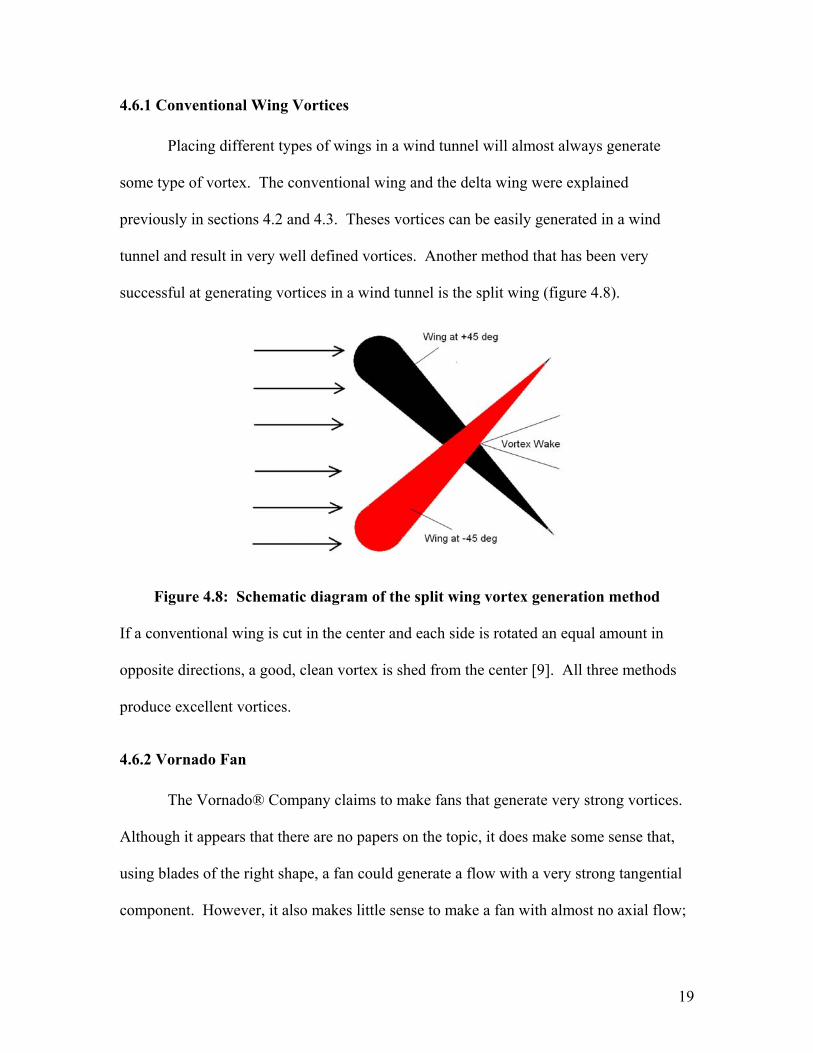
successful at generating vortices in a wind tunnel is the split wing (figure 4.8).
Figure 4.8: Schematic diagram of the split wing vortex generation method
If a conventional wing is cut in the center and each side is rotated an equal amount in
opposite directions, a good, clean vortex is shed from the center [9]. All three methods
produce excellent vortices.
4.6.2 Vornado Fan The Vornado® Company claims to make fans that generate very strong vortices.
Although it appears that there are no papers on the topic, it does make some sense that,
using blades of the right shape, a fan could generate a flow with a very strong tangential
component. However, it also makes little sense to make a fan with almost no axial flow;

20
that would defeat the purpose of a fan. To determine the feasibility of the Vornado fan,
flow visualization was performed and is discussed in section 5.2.
4.6.3 Propeller Wake The final vortex generation method being considered was found in a paper
studying the wake behind a wind turbine in a wind tunnel. A particle image velocimetry
(PIV) flow measurement and numerical analyses both indicated that when a propeller is
placed in a wind tunnel and driven by the flow, there is very little axial flow in the wake
[10]. Furthermore, the 3-D numerical result seems to indicate a very strong wake vortex
as shown in figure 4.9. The flow is very complex, however, and is discussed in greater
detail in section 5.2.
Figure 4.9: Numerical simulation of the wake behind a turbine disk in a wind tunnel [10].

21
4.7 Vortex Simulation While vortex generation is certainly the best way to simulate the loading
condition on Mr. Young’s windmill, it is an extremely challenging and complex problem.
Problems such as outer flow, vortex scaling, and complex flow are difficult to overcome.
An alternative to vortex generation could be vortex simulation. In the problem being
examined, the axis of rotation of the vortex is very long compared to the windmill.
Therefore, the velocity profile experienced by the windmill is almost entirely 2-
dimensional (figure 4.10a). If the velocity profile could be approximated, the loading of
the windmill should be approximated.
4.7.1 Simple Duct The simplest way to simulate the loading of a windmill would be to approximate
the vortex velocity profile with a rectangular impulse (figure 4.10a). This could be easily
accomplished by ducting the rectangular outlet of a centrifugal fan (figure 4.10b)
(a) (b) Figure 4.10: (a) Diagram comparing 2-D vortex velocity profile and theoretical
velocity profile of a ducted fan. (b) Simple duct for the outlet of a centrifugal fan

22
The velocity profile in figure 4.10a is based on an inviscid and incompressible analysis,
which is not completely accurate. The flow is almost entirely incompressible, but some
viscous effects are present. However, viscous effects are typically not important very far
outside of the boundary layer. Therefore, the exit velocity of the duct should be very
similar to that shown in figure 4.10a, as long as the boundary layer remains attached
inside the duct. Upon exiting the duct, the flow should experience even greater shear
effects as it contacts the still air, rounding out the corners of the velocity profile even
more. This effect might actually make the ducted fan approximate the vortex even better,
but must be investigated in detail before an experiment is conducted.
4.7.2 Complex Duct It might be desirable to replicate the velocity profile of a vortex better than a
simple duct can. The simple rectangular impulse in figure 4.9a could be replaced by a
stepped velocity profile (figure 4.10a). To accomplish this, the duct could be modified to
divert the flow as shown in figure 4.10b.
(a) (b) Figure 4.11: (a) Diagram comparing 2-D vortex velocity profile and stepped
velocity profile of a ducted fan. (b) Complex duct for the outlet of a centrifugal fan
23
As for the simple duct, an inviscid and incompressible analysis was used to predict the
velocity profile for the duct geometry shown in figure 4.10. Predicted velocities can be
calculated by incompressible conservation of mass.
Although the velocity profile in figure 4.10a appears to match the vortex velocity
profile very well, it should be noted that it is only a schematic diagram. The sharp edges
of the velocity profile will change due to shear effects and separation is still an important
issue. In addition, the vortex velocity profile is not scaled. Therefore, the 25%-50%-
25% geometry shown in figure 4.10b may not be ideal. A better simulation could be
accomplished by plotting the correctly scaled vortex velocity profile and adjusting the
duct geometry for the best approximation. The ratios of input area to output area for each
section will determine the exit velocities, while the exit areas of each section will
determine the widths of each step in the velocity profile.
4.8 Measurements Most of the damage done to the windmills was done to the windmills themselves
rather than the lower structural trusses as shown previously in figures 2.1 and 2.2.
Furthermore, the damage seems particularly focused on the horizontal shaft connecting
the rotor disk to the tail, and the vertical shaft connecting the entire windmill to the
support structure. A close examination of the photographs of the broken windmill also
shows blade damage as well, so it might seem necessary to also instrument the blades.
However, Dr. Stearman believes that the blade damage was most likely caused by the
blades striking support structure (figure 4.12a). On the model windmill, the diameter of
the rotor disk is too small to contact the support structure, so blade damage is not
predicted in the experiment (figure 4.12b). Therefore, the most important parameter is

24
the bending moment applied to the horizontal shaft. It’s that moment that causes the
lower part of the rotor disk to contact the support structure (figure 4.7a).
(a) (b) Figure 4.12: (a) Schematic diagram of the rotor disk of Mr. Young’s windmill contacting support structure when being acted on by a moment as described in section 4.5. (b) Photograph showing that model rotor disk cannot contact the
support structure.
Bending moments can be calculated from measured flexural strains. If a beam or
rod is in pure bending, it is very easy to calculate. A formula to relate strain to moment
can be found in any mechanics of solids text [11]. The loading of the circular shafts of
the windmill is slightly more complicated, but the dominant mode should be pure
bending. Determining the moments should be possible.
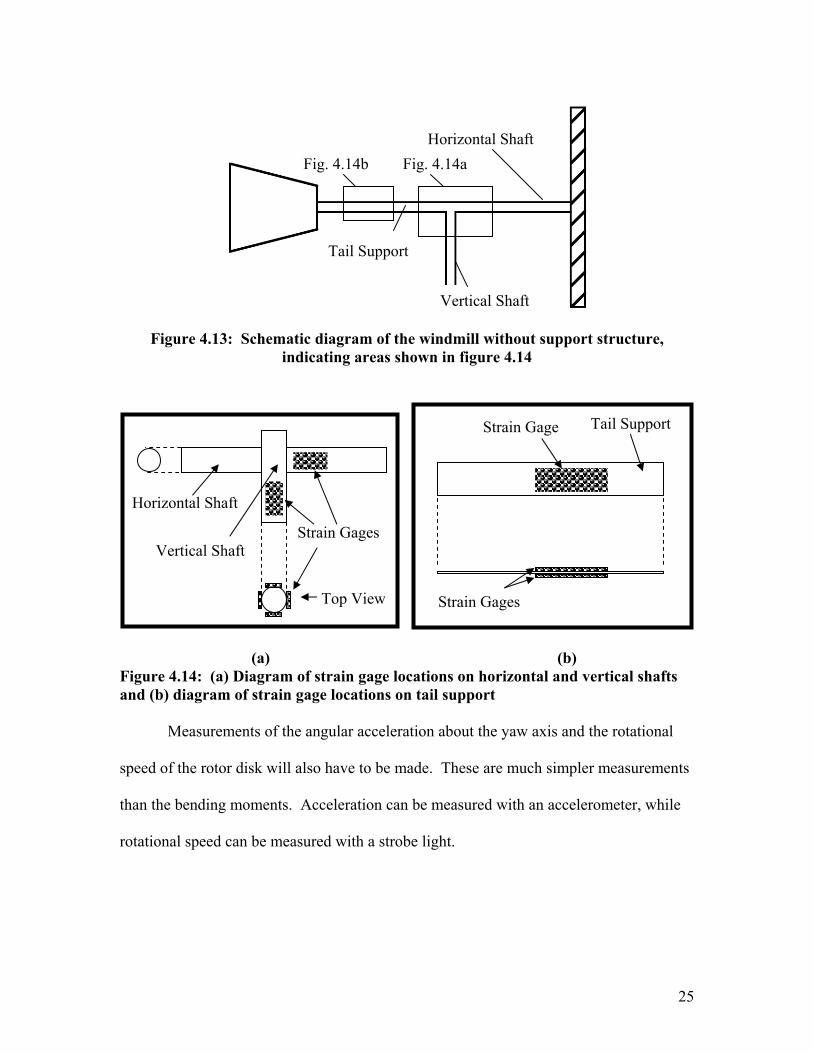
A diagram of the model windmill with parts of interest labeled is shown in figure
4.13, below. Strains positioned around each shaft, 90º from each other, will be measured
to try to determine the bending moments. The strains on the horizontal and vertical shafts
will be measured by four strain gages, positioned as shown in figure 4.14a. On the
experimental model, the structure connecting the tail to the windmill is a slender beam, so
two strain gages positioned as shown in figure 4.14b will be sufficient.
Rotor disk in contact with support structure
25
Figure 4.13: Schematic diagram of the windmill without support structure, indicating areas shown in figure 4.14
(a) (b) Figure 4.14: (a) Diagram of strain gage locations on horizontal and vertical shafts and (b) diagram of strain gage locations on tail support Measurements of the angular acceleration about the yaw axis and the rotational
speed of the rotor disk will also have to be made. These are much simpler measurements
than the bending moments. Acceleration can be measured with an accelerometer, while
rotational speed can be measured with a strobe light.
Top View
Strain Gages
Horizontal Shaft
Vertical Shaft
Strain Gages
Strain Gage Tail Support
Horizontal Shaft
Vertical Shaft
Tail Support
Fig. 4.14aFig. 4.14b

26
4.9 Scaling The final theoretical issue relating to the experiment is scaling. As stated before,
the most critical issue of scaling is matching the diameter of the rotor disk and the
diameter of the core of the vortex. To create the maximum moment, the vortex core
diameter must be equal to the diameter of the rotor disk.
Two parameters that are very important to the study of windmills in general are
chord Reynold’s number (Re) and tip speed ratio (λ). They will be defined as follows
[10]:
ν
cVcore=Re (4.1)
coreVRωλ = (4.2)
where
Vcore = Vortex core velocity, c = mean chord of the rotor blades ν = kinematic viscosity ω = rotational speed of windmill rotor R = radius of windmill rotor
Some papers have found that in relation to windmills, Re effects are not nearly as
important as λ effects [10]. Therefore, Re will be recorded, but the experimental study
will most likely be based on varying and determining the effect of λ on the loading of the
windmill.