Comparison of machine learning methods for estimating case ...

35UK Economic Outlook July 2017
4 – A machine learning approach to estimating current GDP growth1
Key points• Businesses and policy makers need
to keep a constant watch on the UK economy. However, the ONS’s preliminary estimate of GDP growth isreleasedwithasignificantlagandcan often be materially different to laterfinalestimatesofGDPgrowth.This creates the need for alternative indicators of current economic activity.
• Nowcasting models can meet this need by utilising frequently released information to assess current economic activity. They are used across the globe, most notably by central banks in advance of the release ofofficialGDPstatistics.Overcertainperiods in the UK such models have been able to outperform preliminary GDP estimates.
• To provide an earlier estimate of GDP in the UK we have built our own nowcasting model utilising machine learning techniques. Our analysis shows that output indices used by the ONS when forming their preliminary estimatearestrongpredictorsoffinalGDP. However, the inclusion of other indicators, such as house prices, materially improves our ability to predict movements in GDP.
IntroductionWhat is the state of the UK economy right now? Is it expanding or shrinking and by how much? These are questions thatofficialGDPstatisticstrytoanswer,but they take time to be published – can we obtain a quicker answer using other data sources?
In this article we explain the importance of having a timely view of the state of the UK economy for both businesses and policy makers and review methods available to do this. We then describe the analysis that we have undertaken to understand the relationships between frequently released economic indicators and GDP, building our own model which “nowcasts” UK GDP growth.
We use our nowcasting model to estimate GDP growth for the second quarter of 2017, in advance of the preliminary ONS estimate being published later in July, and discuss what this means for businesses and policy makers.
The discussion is structured as follows:
Section 4.1 What is the need for a timely view on the state of the economy?
Section 4.2 The use and performance of nowcasting models
Section 4.3 Using machine learning to estimate current GDP growth
Section 4.4 Our estimate for UK GDP growth in Q2 2017
Section 4.5 Summary and conclusions.
• Our nowcasting model suggests that GDP growth in the second quarter of 2017 will continue to be sluggish at around 0.3% relative to the previous quarter. This is up very slightly from theONSestimateof0.2%inthefirstquarter of 2017 due to somewhat stronger growth in the services sector, offset in part by contracting industrial production and construction sector output.Thismeansthatthefirsthalfof 2017 represents the weakest two consecutive quarters of UK GDP growth since 2012 during the Eurozone crisis.
• Nowcasting models can also be used in a variety of policy and business contexts. For example, in predicting sectoralGVA,industrysalesorfirmrevenues. Such wide applicability allows policy makers and businesses to understand the present better, so that they can plan more effectively for the future.
1 This article was written by Sam Hinds, Lucy Rimmington, Hugh Dance, Jonathan Gillham, Andrew Sentance and John Hawksworth of PwC’s economics practice.

36 UK Economic Outlook July 2017
4.1 – What is the need for a timely view on the state of the economy?
Both businesses and policy makers need to keep a constant watch on the UK economy. Businesses need a timely and accurate read out to make effective decisions day-to-day and policy makers need to understand what the economy is doing so that they can make the most informed economic policy decisions. This need for information becomes even more important during a period of heightened economic uncertainty, as we are now experiencing since the UK’s decision to leave the EU in June 2016 (see Figure 4.1).
Growth in GDP is often relied upon to gauge the current state of the economy, but calculating GDP involves intensive data gathering and processing, meaning there is a lag between the completion of a quarter and knowing how the economy has performed (see Figure 4.2). In the UK such a lag is comparatively short with the ONS releasing its preliminary estimate of GDP just under a month after a given quarter - quicker than any of the other G73.Nonethelessthereisstillasignificantamount of time where businesses andfinancialmarketsdonothave acomprehensiveofficialviewofthecurrent state of the economy (bearing in mind that, immediately before the preliminary ONS release, the latest availableofficialGDPdatarelatesto a period 4-7 months earlier).
2 This index is a widely used measure of economic uncertainty (for the UK and other major economies) produced by a team of US academic economists. See their website here for more details: http://www.policyuncertainty.com/index.html
3 Bean (2016) “Independent review of UK economic Statistics”, P.18 Seehere:https://www.gov.uk/government/uploads/system/uploads/attachment_data/file/507081/2904936_Bean_Review_Web_Accessible.pdf
Figure 4.1 – Economic policy uncertainty in the UK2
0
200
400
600
800
1000
1200
20172015201320112009200720052003200119991997
Source: Economic Policy Uncertainty
Figure 4.2 – Timeline of the preliminary ONS GDP data release
Source: ONS, PwC
Time
Lag
ONS preliminary estimate of GDP
Month 1 Month 2 Month 3 Month 4
Quarter
Figure 4.3 – Preliminary and latest estimates of UK GDP growth (QoQ)
-3.0
-2.0
-1.0
0
1.0
2.0
2016201420122010200820062004200220001998199619941992
GDP
grow
th (%
QoQ
)
ONS preliminary estimate ONS latest estimate
Source: ONS, PwC

37UK Economic Outlook July 2017
The ONS produces its preliminary estimate of GDP growth using actual datafromthefirsttwomonthsofaquarter and forecasts for the third month. The ONS estimates that, at the time of the preliminary release, it has approximately 45% of actual data available4. As more data become available, initial GDP estimates are revised many times and, as a result, finalGDPestimatescanbemateriallydifferent to those in preliminary releases (see Figures 4.3 and 4.4).
4 ONS (2016) “Methods and Sources”, See here: http://webarchive.nationalarchives.gov.uk/20160105160709/ http:/www.ons.gov.uk/ons/guide-method/method-quality/specific/economy/output-measure-of-gdp/methods-and-sources/index.html
We can see from Figure 4.4 that revisions to preliminary ONS GDP growth estimates were relatively large before and particularlyduringthefinancialcrisis.This was one motivation for central banks to develop alternative indicators of current economic activity using nowcasting models as described in Section 4.2 below.
Sincethefinancialcrisis,theeconomicenvironment has become less volatile and the average revision between the preliminary and latest ONS GDP growth estimatehasfallensignificantlytoanaverage of just under 0.2 percentage points, as Figure 4.4 shows.
Figure 4.4 – The absolute size of revisions to UK GDP growth
Sources: ONS, PwC
0.0
0.2
0.4
0.6
0.8
1.0
1.2
1.4
Q12017
Q12016
Q12015
Q12014
Q12013
Q12012
Q12011
Q12010
Q12009
Q12008
Q12007
Q12006
Q12005
Q12004
Q12003
Q12002
Q12001
Q12000
Q11999
Q11998
Q11997
Q11996
Q11995
Q11994
Q11993
Q11992
Abso
lute
siz
e of
revi
sion
(% Q
oQ g
row
th)
Pre-crisis Avg Post-crisis Avg 08-09 Avg
Nonetheless, there is still a case for developing nowcasting models that are more timely than preliminary ONS GDP growth estimates, provided that there isnosignificantlossofaccuracyintheprocess. This is what we have aimed to do in developing our own nowcasting model as described later in the article. First, however, we review the use and performance of other nowcasting models.
38 UK Economic Outlook July 2017
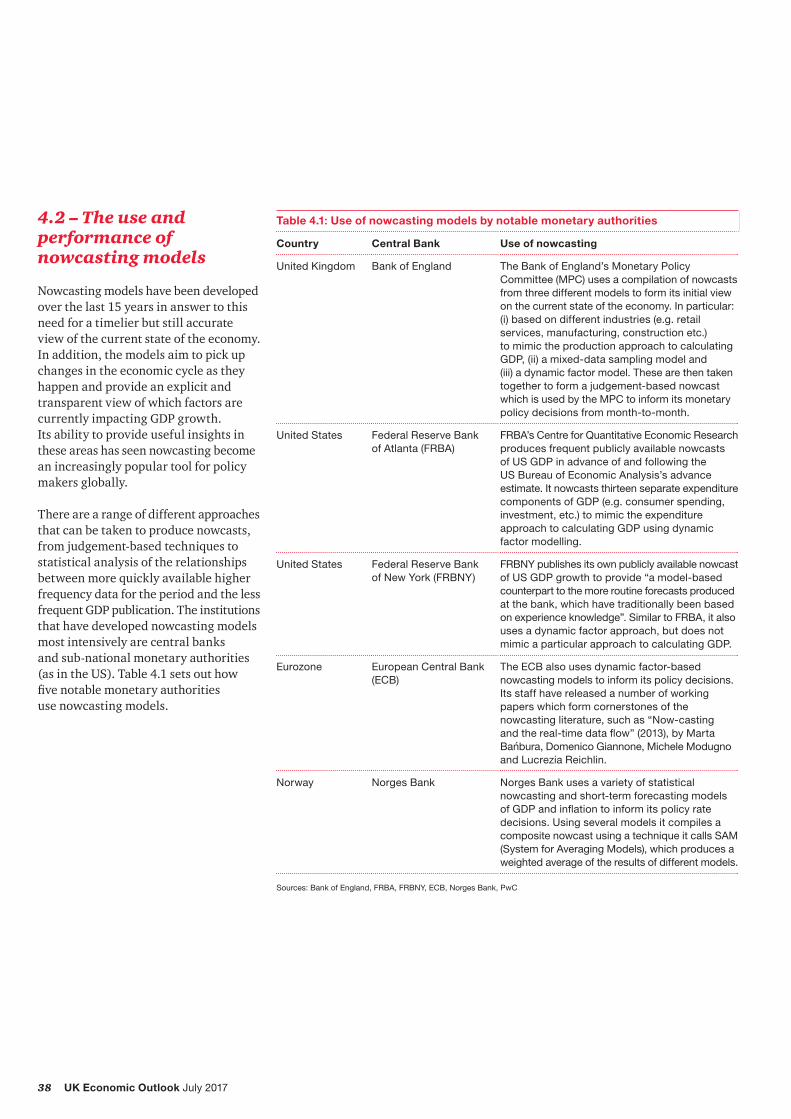
4.2 – The use and performance of nowcasting models
Nowcasting models have been developed over the last 15 years in answer to this need for a timelier but still accurate view of the current state of the economy. In addition, the models aim to pick up changes in the economic cycle as they happen and provide an explicit and transparent view of which factors are currently impacting GDP growth. Its ability to provide useful insights in these areas has seen nowcasting become an increasingly popular tool for policy makers globally.
There are a range of different approaches that can be taken to produce nowcasts, from judgement-based techniques to statistical analysis of the relationships between more quickly available higher frequency data for the period and the less frequent GDP publication. The institutions that have developed nowcasting models most intensively are central banks and sub-national monetary authorities (as in the US). Table 4.1 sets out how fivenotablemonetaryauthorities use nowcasting models.
Table 4.1: Use of nowcasting models by notable monetary authorities
Country Central Bank Use of nowcasting
United Kingdom Bank of England The Bank of England’s Monetary Policy Committee (MPC) uses a compilation of nowcasts from three different models to form its initial view on the current state of the economy. In particular: (i) based on different industries (e.g. retail services, manufacturing, construction etc.) to mimic the production approach to calculating GDP, (ii) a mixed-data sampling model and (iii) a dynamic factor model. These are then taken together to form a judgement-based nowcast which is used by the MPC to inform its monetary policy decisions from month-to-month.
United States Federal Reserve Bank of Atlanta (FRBA)
FRBA’s Centre for Quantitative Economic Research produces frequent publicly available nowcasts of US GDP in advance of and following the US Bureau of Economic Analysis’s advance estimate. It nowcasts thirteen separate expenditure components of GDP (e.g. consumer spending, investment, etc.) to mimic the expenditure approach to calculating GDP using dynamic factor modelling.
United States Federal Reserve Bank of New York (FRBNY)
FRBNY publishes its own publicly available nowcast of US GDP growth to provide “a model-based counterpart to the more routine forecasts produced at the bank, which have traditionally been based on experience knowledge”. Similar to FRBA, it also uses a dynamic factor approach, but does not mimic a particular approach to calculating GDP.
Eurozone European Central Bank (ECB)
The ECB also uses dynamic factor-based nowcasting models to inform its policy decisions. Its staff have released a number of working papers which form cornerstones of the nowcasting literature, such as “Now-casting and the real-time data flow” (2013), by Marta Bańbura, Domenico Giannone, Michele Modugno and Lucrezia Reichlin.
Norway Norges Bank Norges Bank uses a variety of statistical nowcasting and short-term forecasting models of GDP and inflation to inform its policy rate decisions. Using several models it compiles a composite nowcast using a technique it calls SAM (System for Averaging Models), which produces a weighted average of the results of different models.
Sources: Bank of England, FRBA, FRBNY, ECB, Norges Bank, PwC

39UK Economic Outlook July 2017
In the UK, in addition to public bodies, research organisations such as the National Institute for Economic and Social Research (NIESR), private consultancies and investment banks also produce nowcasts of UK GDP.
Nowcasting techniques have also been used in several different contexts in addition to predicting movements in GDP, as described in Box 4.1.
Box 4.1 – Other applications of nowcasting
Nowcasting techniques provide a general framework for trying to predict the current level of a data point which is released infrequently orwithasignificantlag.
In the UK there are a number of sectoral or industry statistics that are usuallyreleasedwithasignificantlag by the ONS and nowcasting can beusedtoestimatesuchfiguresbefore they are released to help “bridge the gap” between the completion of a time period and the release of data. The ONS is currently exploring the potential for this, having consulted on nowcasting methods to approximate public service productivity estimates and having produced its own nowcasts of household income throughout 2016.
The Economic Statistics Centre of Excellence (ESCOE) in association with the ONS has also recently begun work to nowcast regional estimates of Gross Value Added (GVA).
Its aim is to (i) “produce and disseminate timely model-based quarterly regional estimates of nominal GVA to the same timetable as the UK’s first estimates of quarterly GVA for the UK as a whole” and (ii) “produce historical quarterly estimates of regional GVA, if feasible, at greater levels of regional and sectoral levels of disaggregation”. Such data would greatly improve the ability to analyse sub-national economic impacts of particular events or policies.
Nowcasting can also be used to exploit so-called “Big Data” to predict sectoral statistics. This is something that has been investigated by Hyunyoung Choi and Hal Varian of Google who have used search trends to predict monthly automobile sales in the US (see Choi and Varian (2009) for more information). Use of such innovative data could be taken potentially further, helping businesses to understand their sales, revenues and other KPI’s on a much more frequent basis than ever before.

40 UK Economic Outlook July 2017
Figure 4.5 – Performance of UK nowcasting models
Relative topreliminary GDP
0.0
0.1
0.2
0.3
0.4
0.5
0.6
Bank of England, 2014(2004 Q1 - 2013 Q4)
ONS preliminary estimate(2001 Q2 - 2008 Q4)
Mitchell, 2009(2001 Q2 - 2008 Q4)
NIESR, 2009(2001 Q2 - 2008 Q4)
Relative tofinal GDP
RMSE
(% Q
oQ)
Sources: Mitchell (2009), Bank of England (2017), ONS, PwC
So, how accurate are nowcasting models at predicting current GDP growth in the UK? Evidence for the UK is somewhat limited, but Figure 4.5 summarises the relative performance of models from a selection of three sources: NIESR, Professor James Mitchell of Warwick Business School (who surveyed alternative nowcasting approaches in 2009) and the Bank of England5. Furthermore, the performance of NIESR and Mitchell’s nowcasts are compared to the ONS’s preliminary estimate (which for this purpose is treated as a forecast of the finalGDPestimate).Suchacomparisonis not made for the Bank of England’s figureasitsnowcastingmodelsarecalibrated to predict preliminary ratherthanfinalestimatesofGDP.
The performance of each model is based upon information available before the ONS preliminary data release and is summarised by each model’s Root Mean Squared Error (RMSE) - a standard measure used to evaluate predictive power. The RMSE is typically larger than the average size of the gap between the model’s prediction and actual GDP growth, but is a more reliable measure which helps select models with a lower likelihood of occasional extreme misses. This explains why the RMSE for the ONS is somewhat larger than the average forecast error over the same period.
Perhaps surprisingly, both NIESR and Mitchell’s nowcasts outperform the ONS preliminaryestimateinpredictingfinalGDP. NIESR’s model performs particularly well with a RMSE of 0.29%. However, as we noted above, the ONS preliminary estimates have improved considerably sincethefinancialcrisis(asshowninFigure 4.4) and it remains to be seen if these models could outperform the ONS today.
5 Figures for NIESR are quoted in the same paper as those of Mitchell – Mitchell (2009) “Where are we now? The UK recession and nowcasting GDP growth using statistical models”, National Institute Economic Review, No. 209 July 2009
6 Castle, J.L., Hendry, D.F. and Kitov, O.I. (2013) “Forecasting and Nowcasting macroeconomic variables: A methodological Overview”, University of Oxford Dept. of Economics Discussion paper Series, No. 674, September 2013
We also note that the Bank of England’s ability to nowcast is also impressive with a RMSE of around 0.3%. However, comparison should not be drawn between its RMSE and that of NIESR or Mitchell as RMSEs are only comparable when they consider the same variable (i.e.finalorpreliminaryGDP)overthesame time period. The Bank of England’s figurediffersfromtheothersinboththese respects. RMSEs depend upon on how volatile GDP was in a given period. This explains why, during a period of volatile growth such as 2007-2008, estimates of current GDP growth become more inaccurate (for example in 2007-08 the RMSE for the ONS preliminary estimate increased to 0.62%).
RMSEs of around 0.3% may seem fairly large to some, but it is important to note that the factors that drive growth in different periods materially alter as the economy evolves and the shocks affecting it change. So being able to predict GDP growth with an RMSE of 0.3% is relatively impressive (recall the average error is smaller than the RMSE and likely to be around 0.2-0.25%).
Overall, the evidence suggests that nowcasting models can provide a broadly similar degree of accuracy to the ONS preliminary estimates of GDP growth, despite the nowcasting estimates being more timely. Academic research also shows that the nowcasts represent a significantimprovementonstandardstatistical forecasting models that only make use of past data, in some cases at least halving the size of the RMSE6.
41UK Economic Outlook July 2017
7 For more details please see Zou and Hastie (2005) “Regularization and Variable Selection via the Elastic Net”, Journal of the Royal Statistical Society. Series B (Statistical Methodology), Vol 67, No. 2
8 For example, the IMF has recently applied the Elastic Net methodology to nowcast Lebanese GDP (see: IMF (2016) “Seeing in the dark: A Machine-Learning Approach to nowcasting in Lebanon” for more details) and has shown that this outperforms another prevalent machine-learning technique known as ‘Random Forests’ in terms of predictive power. The Deutsche Bundesbank also recently published a working paper titled “Macroeconomic now- and forecasting based on the factor error correction model using targeted mixed frequency indicators” which uses Elastic Net and associated methods to nowcast German GDP.
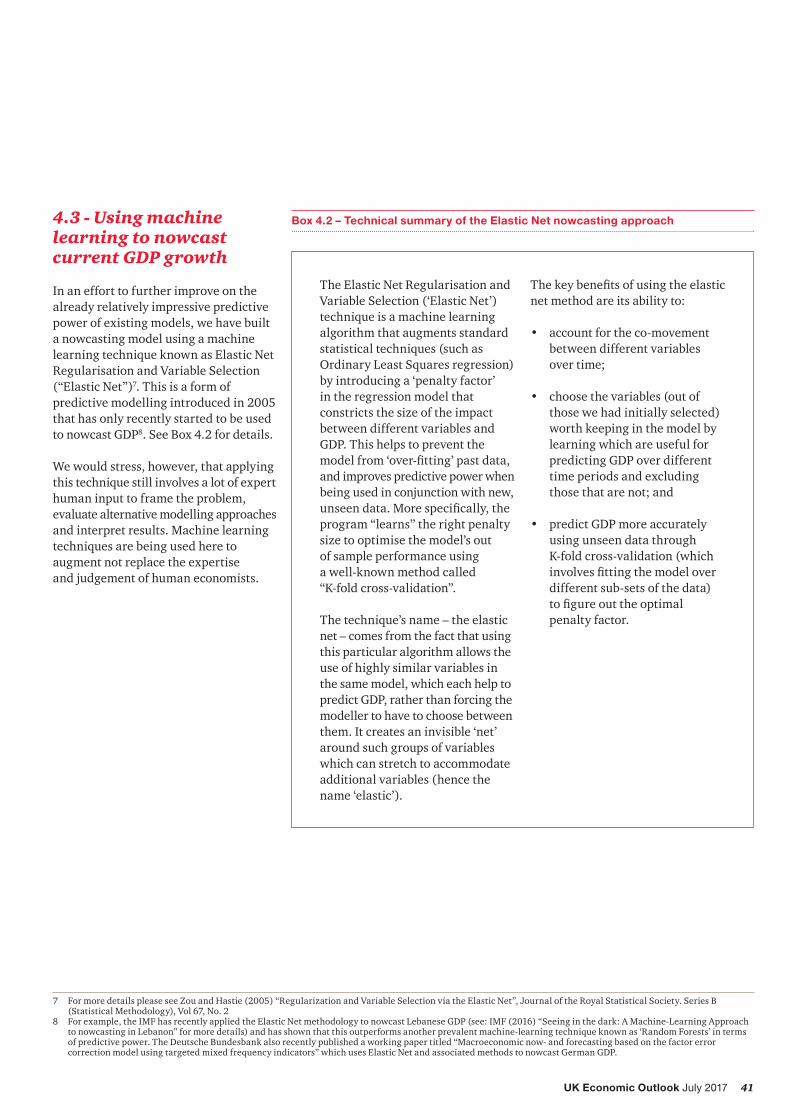
Box 4.2 – Technical summary of the Elastic Net nowcasting approach
The Elastic Net Regularisation and Variable Selection (‘Elastic Net’) technique is a machine learning algorithm that augments standard statistical techniques (such as Ordinary Least Squares regression) by introducing a ‘penalty factor’ in the regression model that constricts the size of the impact between different variables and GDP. This helps to prevent the modelfrom‘over-fitting’pastdata,and improves predictive power when being used in conjunction with new, unseendata.Morespecifically,theprogram “learns” the right penalty size to optimise the model’s out of sample performance using a well-known method called “K-fold cross-validation”.
The technique’s name – the elastic net – comes from the fact that using this particular algorithm allows the use of highly similar variables in the same model, which each help to predict GDP, rather than forcing the modeller to have to choose between them. It creates an invisible ‘net’ around such groups of variables which can stretch to accommodate additional variables (hence the name ‘elastic’).
Thekeybenefitsofusingtheelasticnet method are its ability to:
• account for the co-movement between different variables over time;
• choose the variables (out of those we had initially selected) worth keeping in the model by learning which are useful for predicting GDP over different time periods and excluding those that are not; and
• predict GDP more accurately using unseen data through K-fold cross-validation (which involvesfittingthemodeloverdifferent sub-sets of the data) tofigureouttheoptimalpenalty factor.
4.3 - Using machine learning to nowcast current GDP growth
In an effort to further improve on the already relatively impressive predictive power of existing models, we have built a nowcasting model using a machine learning technique known as Elastic Net Regularisation and Variable Selection (“Elastic Net”)7. This is a form of predictive modelling introduced in 2005 that has only recently started to be used to nowcast GDP8. See Box 4.2 for details.
We would stress, however, that applying this technique still involves a lot of expert human input to frame the problem, evaluate alternative modelling approaches and interpret results. Machine learning techniques are being used here to augment not replace the expertise and judgement of human economists.

42 UK Economic Outlook July 2017
To determine which variables should be considered in our analysis we have looked to mirror the make-up of the UK economy. As the services sector now accounts for almost 80% of UK GDP, we have included a number of services-focused variables. We have then complemented this with other indicators to account for the production side of the economy and “softer” indicators such as consumer andindustrialconfidencetocapturechanges in GDP which occur as a result of expectations. A full list of the variables we considered is set out in Table 4.29.
We have tested our nowcasting model over the past four years using the data that would have been available at the end of each quarter (i.e. around a month in advance of the ONS preliminary estimates)10.
As shown in Figure 4.6, our model performs well over this period: it is able to pick up changes in the direction of actual GDP growth correctly 94% of the time with an RMSE of 0.18%. Indeed, 55% of the nowcasts from this model were within 0.1% of the actual GDP growth value over this four year test period.
9 Variables have been adjusted to a constant price base and de-seasonalised where required.10 To test our model in the most robust and realistic way, for each quarter between 2013 Q2 and 2017 Q1 we re-estimated our model and utilised the most up-to-date
information that would have been available at each point in time to predict GDP growth in that quarter (i.e. only making a “one-step ahead” prediction).
Table 4.2: Variables considered in our analysis
Variable(s) Source
• Services index
• Industrial production index
• Manufacturing index
• Construction index
• Claimant count
• Working days lost to industrial action (000’s)
• Retail sales index
• Consumer price index
• Value of exports – balance of payments basis
• Value of imports – balance of payments basis
• Unemployment rate
ONS
• 3 month average LIBOR
• Average unsecured lending rate on credit cards (banks and building societies)
• UK mortgage standard variable rate
• Average unsecured lending rate on £10k loans (banks and building societies)
• UK base rate
• British Sterling effective exchange rate index
• Monthly average gold price against Sterling
Bank of England
• Value of VAT receipts
• Value of corporate tax receipts
HMRC
• Below capacity utilisation survey CBI
• Services PMI survey
• Manufacturing PMI survey
• Construction PMI survey
CIPS/Markit
• House Price index Nationwide
• Consumer confidence indicator
• Industrial confidence indicator
European Commission
• Brent Crude Oil Price Thomson Reuters Eikon
Source: PwC

43UK Economic Outlook July 2017
This improves on the commonly referenced Reuters Poll of Forecasters as our model has both a smaller RMSE and an improved ability to pick up changes in the direction of GDP growth. Furthermore, our model is only marginally worse than the ONS preliminary estimate itself, which has an average RMSE of 0.16% over this period as a predictor of the latest available GDP estimates after later revisions. This is despite the fact that the ONS estimate is based on more available data as it is released around a month later than the effective date at which our nowcasts were made in this test exercise.
Figure 4.6 – Performance of our nowcasting model
PwC nowcast ONS latest GDP estimate Reuters Poll (Median)
0.000
0.002
0.004
0.006
0.008
0.010
0.012
Q12017
Q42016
Q32016
Q22016
Q12016
Q42015
Q32015
Q22015
Q12015
Q42014
Q32014
Q22014
Q12014
Q42013
Q32013
Q22013
GDP
grow
th (%
QoQ
)
Sources: ONS, Thomson Reuters Eikon, PwC
However, we recognise that there are two quarters where there were relatively large variances between our nowcast model estimates and the latest available ONS GDP estimates:
• Q2 2013. Our model under-estimated GDP growth in this period because inthefinalmonthofthequartertherewas a larger increase in key variables (notably the ONS services index) than expected when the nowcast would have been made. Unfortunately the impact of a one-off ‘surprise’ like this is a general limitation of any nowcasting model.
• Q1 2016. Our model over-estimated GDP growth in this period because it did not incorporate movements in net trade expenditure and other factors such as inventories that led to a downward revision in estimated growth in this quarter much later in December 2016 and February 2017 (from 0.4% initially to 0.2% in the latest ONS estimates for growth in this quarter).
To arrive at our preferred model specificationforeachtimeperiodweapplythe Elastic Net algorithm, which analyses the predictive power of each variable. If a given variable, taken together with the others, does not add to the predictive power of the model, the algorithm ‘shrinks’ the size of the impact that such a variable has on the nowcast to zero – effectively excluding it from the model.

44 UK Economic Outlook July 2017
Figure 4.7 – Top 5 variables that impact our nowcasts over the past 4 years
ONS Services Index ONS Industrial Production Index ONS Construction Index
5
4
3
2
1
Q12017
Q42016
Q32016
Q22016
Q12016
Q42015
Q32015
Q22015
Q12015
Q42014
Q32014
Q22014
Q12014
Q42013
Q32013
Q22013
Nationwide House Price Index ONS Manufacturing IndexONS Retail Sales Index
Source: PwC
Performing this procedure over different periods gives us a different mix of important variables over time. This allows us to understand which indicators become more or less important at different times for estimating current GDP growth. Figure 4.7 shows the rank of the top 5 variables included in our model each quarter based on the absolute strength of the estimated relationship they have with GDP.
The ONS services output and industrial production indices are consistently most strongly associated with movements in GDP growth. Construction and manufacturing indices also play a prominent role, being ranked third and fourth over time11. Having a lesser, but still important impact, are two indicators that capture other factors: the ONS retail sales index and the Nationwide House Price index12. A discussion of these variables and their estimated average relationship with GDP is set out in Table 4.3.
11 It is important to note that it is consistent to include multiple similar variables in the model, as the elastic net algorithm is able to make use of the useful, predictive information in each series – if any – without their co-movement being a problem (as explained in Box 4.2).

45UK Economic Outlook July 2017
The estimated relationships represent the average percentage point change in GDP growth that our model associates with a one percent increase in a given indicator13. For example, our model estimates that, on average from 2013-2016, a one percent increase in the ONS services index would be associated with a 0.6 percentage point increase in GDP growth.
We think that this analysis is important for two reasons: (i) it allows businesses and policy makers to gain further clarity on which indicators and announcements matter most when trying to understand the current level of GDP growth; and (ii) it allows us to give a more precise estimate of what GDP growth is at any given point in time.
Table 4.3: Discussion of key variables which impact our nowcasts
Variable Estimated relationship with GDP growth
Discussion
ONS Services index
0.60 This is a monthly indicator of output growth in the services sector, which is the dominant element in total GDP and so, as expected, has the highest weight in our nowcasting model.
ONS Industrial production index
0.13 The ONS Industrial production index is another monthly indicator of output growth but has a smaller weight in our nowcast as it does in total GDP.
ONS Manufacturing index
0.04 Typically a modeller might discard the ONS Manufacturing output index and only use the Industrial production index in compiling a nowcast, since there is a high degree of overlap between the two variables. However, elastic net regularisation allows the model to learn whether there is any residual usefulness to allowing Manufacturing and Industrial production to predict GDP simultaneously and our testing shows that there is.
ONS Construction index
0.03 The ONS Construction index is a quarterly indicator of output growth in the construction sector14. As expected, this is positively associated with GDP growth.
Nationwide House Price Index
0.02 House price growth tends to be associated with GDP growth as increases in house prices stimulate confidence and consumer spending by increasing effective wealth. Rises in house prices also stimulate construction output.
ONS Retail sales index
0.02 The ONS Retail sales index measures changes in the volume of retail sales per month and is available on a relatively timely basis compared to other service sector data. This would be expected to be positively associated with GDP growth.
Other variables
<0.01 Other different variables are included in our model over different time periods, but of these the factor that has the most persistent and largest impact is the number of people claiming unemployment benefits. As you would expect, the relationship it has with GDP is negative.
Sources: Bank of England, FRBA, FRBNY, ECB, Norges Bank, PwC
12 WhilenotfeaturedinFigure4.9,thenumberofpeopleclaimingunemploymentbenefits(i.e.theClaimantCount)alsohadalargeimpact,butmarginallylowerthanthe impact of retail sales or the Nationwide House Price index. This is particularly noteworthy as the Claimant Count represents the variable which tends to have the strongest negative relationship to GDP rather than the positive relationships associated with the other indicators listed in Figure 4.9.
13 Such relationships are presented as an average over 2013Q2-2017Q114 The ONS also has a monthly construction index, but this has only been available from 2010 onwards, whereas the quarterly version of the indicator has been available
since 1997. We used both when building our model, but found the longer dataset that we could use with the quarterly dataset allowed us to nowcast more accurately.
46 UK Economic Outlook July 2017
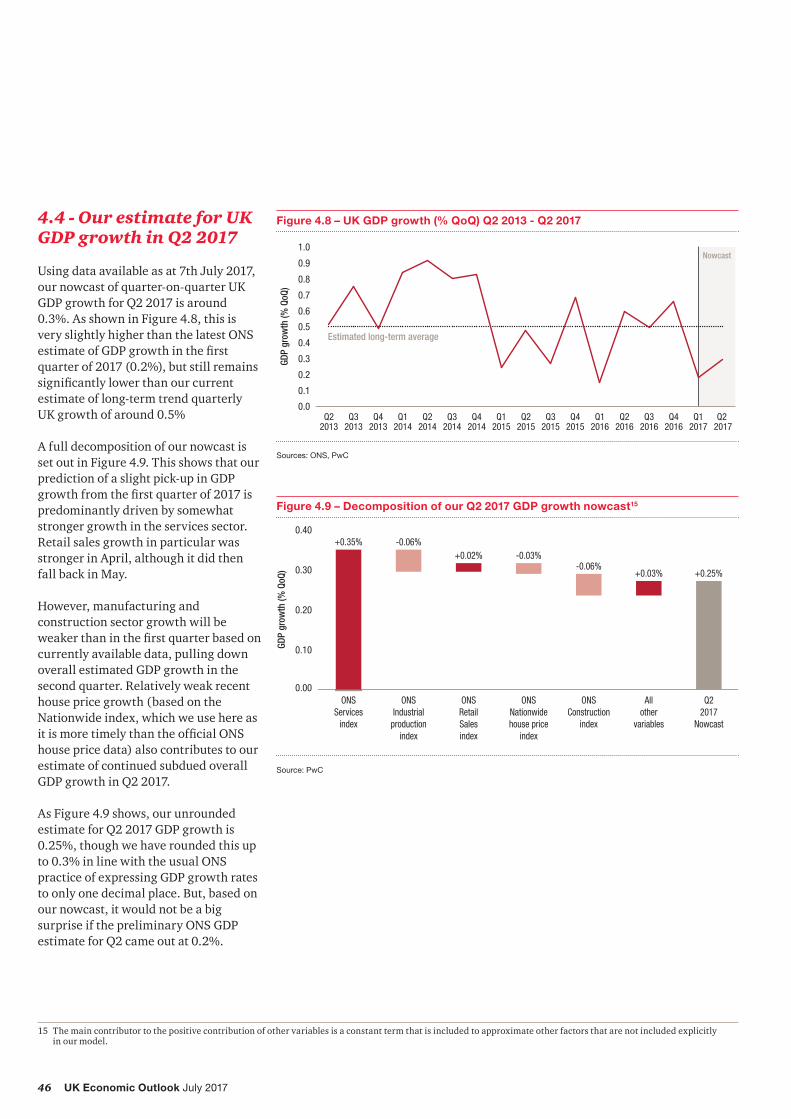
4.4 - Our estimate for UK GDP growth in Q2 2017
Using data available as at 7th July 2017, our nowcast of quarter-on-quarter UK GDP growth for Q2 2017 is around 0.3%. As shown in Figure 4.8, this is very slightly higher than the latest ONS estimateofGDPgrowthinthefirstquarter of 2017 (0.2%), but still remains significantlylowerthanourcurrentestimate of long-term trend quarterly UK growth of around 0.5%
A full decomposition of our nowcast is set out in Figure 4.9. This shows that our prediction of a slight pick-up in GDP growthfromthefirstquarterof2017ispredominantly driven by somewhat stronger growth in the services sector. Retail sales growth in particular was stronger in April, although it did then fall back in May.
However, manufacturing and construction sector growth will be weakerthaninthefirstquarterbasedoncurrently available data, pulling down overall estimated GDP growth in the second quarter. Relatively weak recent house price growth (based on the Nationwide index, which we use here as itismoretimelythantheofficialONShouse price data) also contributes to our estimate of continued subdued overall GDP growth in Q2 2017.
As Figure 4.9 shows, our unrounded estimate for Q2 2017 GDP growth is 0.25%, though we have rounded this up to 0.3% in line with the usual ONS practice of expressing GDP growth rates to only one decimal place. But, based on our nowcast, it would not be a big surprise if the preliminary ONS GDP estimate for Q2 came out at 0.2%.
Figure 4.8 – UK GDP growth (% QoQ) Q2 2013 - Q2 2017
0.0
0.1
0.2
0.3
0.4
0.5
0.6
0.7
0.8
0.9
1.0
Q2 2017
Q12017
Q42016
Q32016
Q22016
Q12016
Q42015
Q32015
Q22015
Q12015
Q42014
Q32014
Q22014
Q12014
Q42013
Q32013
Q22013
Nowcast
Estimated long-term average
GDP
grow
th (%
QoQ
)
Sources: ONS, PwC
Figure 4.9 – Decomposition of our Q2 2017 GDP growth nowcast15
0.00
0.10
0.20
0.30
0.40
Q22017
Nowcast
Allother
variables
ONSConstruction
index
ONSNationwidehouse price
index
ONSRetailSalesindex
ONSIndustrial
productionindex
ONSServices
index
GDP
grow
th (%
QoQ
)
+0.35%
+0.03% +0.25%
-0.06%+0.02% -0.03%
-0.06%
Source: PwC
15 The main contributor to the positive contribution of other variables is a constant term that is included to approximate other factors that are not included explicitly in our model.
47UK Economic Outlook July 2017
In summary, Q2 2017 growth may be slightlyhigherthaninthefirstquarter,but still some way below long-term trend. As discussed in Section 2 above, we expect this relatively sluggish growth to continue for some time given ongoing uncertainty relating to the Brexit negotiations and the squeeze on real consumer spending power from higherinflationlinkedtotheweaknessof the pound since the EU referendum last year.
4.5 – Summary and conclusions
With a slowing economy and relatively high levels of political uncertainty in the UK, it is important for businesses and policymakers to get an accurate understanding of the state of the economy in a timely way. We have shown that nowcasting presents an effective way to do this, using current data which is published on a more frequent basis thanofficialONSestimatesofGDP.
Using our machine-leaning-based nowcasting model we estimate that GDP growth in the second quarter of 2017 will continue to be relatively sluggish at around 0.3% on the previous quarter. This is up very slightly from 0.2% in the firstquarterof2017duetosomewhatstronger projected growth in the services sector, but still some way below estimated trend GDP growth of around 0.5% per quarter. This means that the firsthalfof2017seemslikelytoseetheweakest six months of UK GDP growth since 2012 during the Eurozone crisis.
We have focused on GDP estimates in this article, but there are also a range of other possible applications of nowcasting techniques, for example in estimating sectoral GVA and industry sales. The ability to apply nowcasting techniques to such a wide variety of different contexts makes them potentially powerful tools that can help policy makers and businesses to understand the present state of the economy and their markets better, so that they can plan more effectively for the future.

www.pwc.co.uk/economics
At PwC, our purpose is to build trust in society and solve important problems. PwC is a network of firms in 157 countries with more than 223,000 people who are committed to delivering quality in assurance, advisory and tax services. Find out more and tell us what matters to you by visiting us at www.pwc.com/UK.
This publication has been prepared for general guidance on matters of interest only, and does not constitute professional advice. You should not act upon the information contained in this publication without obtaining specific professional advice. No representation or warranty (express or implied) is given as to the accuracy or completeness of the information contained in this publication, and, to the extent permitted by law, PricewaterhouseCoopers LLP, its members, employees and agents do not accept or assume any liability, responsibility or duty of care for any consequences of you or anyone else acting, or refraining to act, in reliance on the information contained in this publication or for any decision based on it.
© 2017 PricewaterhouseCoopers LLP. All rights reserved. In this document, "PwC" refers to the UK member firm, and may sometimes refer to the PwC network. Each member firm is a separate legal entity. Please see www.pwc.com/structure for further details.
The Design Group 31955 (07/17)