4 (1994) 227-245. UK Towards integrated microliquid ... · Towards integrated microliquid handling...
19
J. Micromech. Microeng. 4 (1994) 227-245. Printed in the UK Towards integrated microliquid handling systems M Elwenspoek, T S J Lammerink, R Miyakei and J H J Ruitman MESA Research Institute, University of Twente, PO Box 217, 7500 AE Enschede, The Netherlands Received 24 July 1994, accepted for publication 4 October 1994 Abstract. In this paper we describe components for integrated microliquid handling systems such as fluid injection analysis, and first results of planar integration of components. The components discussed are channels, passive and active valves, actuators for micropumps, micromixers, microflow sensors, optical detectors, pumps and dosage systems. The dosage system described comprises a flow sensor and a pump micromachined on a single silicon wafer sandwiched between Pyrex wafers. The liquid pump is of the reciprocating type with a thermo-pneumatic actuator. The microliquid flow sensor is based on the thermal anemometer type. Both pump and flow sensor are realized in a 3 inch (100)- Si wafer using a KOH bulk etch from both sides of the wafer. The dosing system allows accurate dosing of liquid in the wl regime and can easily be integrated with components as mixers and detectors to microliquid handling systems. A new concept for micromixing of liquids is introduced and its feasibility is demonstrated. The mixer allows fast mixing of small amounts of two liquids and it is applicable to microliquid handling systems. The,mixer has a channel for the liquid, an inlet port for the reagent, and a mixing area, the bottom of which has 400 micronozzles (15 pm xi5 Nm). Through these nozzles, a reagent is injected into the sample liquid, making many microplumes. These plumes speed up mixing by diffusion over a short distance. 1. Introduction Based on recent development of components for microliq- uid handling (cf Gravesen et al [I] and van de Pol et al [2.3] for recent overviews) there is a growing interest in the research on microliquid handling systems (MLHS) such as chemical analysis systems, e.g. fluid injection analysis (FIA), see e.g. (4-1 I] and electrophoresis systems [12-141, microdosage systems [15-16], systems for counting red blood cells [17] and others [18-221. The basic components in liquid handling systems are tubes (in MLHS: channels [23,24]), passive [ZS-271 and active [2844] valves, actua- tors for active valves and pumps [4549], flow sensors e.g. [50-701, reaction chambers, filters [71.72] and mixers [73]. Pumps (mainly membrane pumps [27,48,74-811, but other principles have been suggested as well [29,82-%I), pas- sive and active valves are the first systems that have been realized. They comprise several of these elements (actua- tors, channels, valves). Examples of all these components have been demonstrated in the past. few years, and for the realization of MLHS which are more complex than pumps, all components exits. Here we describe work performed in the micromechanics group at MESA on valves, microp- umps, mixers, detectors and dosage systems and we discuss t On leave from: Mechanical Engineering Research Laboratory, Hitachi Ltd, 502 Kandatsu. Tsuchiun 300, Japan. 0960-1317/94/040227+19519.50 8 1994 IOP Publishing LM a few possibilities to i n t e p t e these and other components into more complex systems. 2. History of micropumps in Twente The work on pumps has some tradition in the microme- chanics group at the University of Twente. The research was initiated by Jan Smits, who now is with the University of Boston, at the beginning of the eighties. His work re- sulted in a peristaltic pump comprising three active valves in line, see figure 1. Each valve consists of a camber with inlet and outlet both covered by a flexible membrane. By deflecting the membrane an underpressure is generated. The actuation is piezoelectric: the membranes are made from two piezoelectric discs. If a potential difference is applied over this pair, one of the discs expands and the other one shrinks with the result that the membrane bends. Smits’ work was published not before Transducers ’89 [29], two years after the follow-up of this work was presented at Eurosensors 87 by van Lintel, van de Pol and Bouwstra [U]. Smits’ pump is able to pump 100 pVmin without pressure difference between inlet and outlet, when a voltage of 80 V i s supplied to the actuator. The pumping rate drops to zero at a pressure difference of 60 cm water. The pump rate is maximal at an actuation frequency of 15 Hz, and the pump ceases to pump at a frequency above 50 Hz. 227
Transcript of 4 (1994) 227-245. UK Towards integrated microliquid ... · Towards integrated microliquid handling...

J. Micromech. Microeng. 4 (1994) 227-245. Printed in the UK
Towards integrated microliquid handling systems
M Elwenspoek, T S J Lammerink, R Miyakei and J H J Ruitman
MESA Research Institute, University of Twente, PO Box 217, 7500 AE Enschede, The Netherlands
Received 24 July 1994, accepted for publication 4 October 1994
Abstract. In this paper we describe components for integrated microliquid handling systems such as fluid injection analysis, and first results of planar integration of components. The components discussed are channels, passive and active valves, actuators for micropumps, micromixers, microflow sensors, optical detectors, pumps and dosage systems. The dosage system described comprises a flow sensor and a pump micromachined on a single silicon wafer sandwiched between Pyrex wafers. The liquid pump is of the reciprocating type with a thermo-pneumatic actuator. The microliquid flow sensor is based on the thermal anemometer type. Both pump and flow sensor are realized in a 3 inch (100)- Si wafer using a KOH bulk etch from both sides of the wafer. The dosing system allows accurate dosing of liquid in the wl regime and can easily be integrated with components as mixers and detectors to microliquid handling systems.
A new concept for micromixing of liquids is introduced and its feasibility is demonstrated. The mixer allows fast mixing of small amounts of two liquids and it is applicable to microliquid handling systems. The,mixer has a channel for the liquid, an inlet port for t h e reagent, and a mixing area, the bottom of which has 400 micronozzles (15 p m x i 5 Nm). Through these nozzles, a reagent is injected into the sample liquid, making many microplumes. These plumes speed up mixing by diffusion over a short distance.
1. Introduction
Based on recent development of components for microliq- uid handling (cf Gravesen et al [I] and van de Pol et al [2.3] for recent overviews) there is a growing interest in the research on microliquid handling systems (MLHS) such as chemical analysis systems, e.g. fluid injection analysis (FIA), see e.g. (4-1 I] and electrophoresis systems [12-141, microdosage systems [15-16], systems for counting red blood cells [17] and others [18-221. The basic components in liquid handling systems are tubes (in MLHS: channels [23,24]), passive [ZS-271 and active [2844] valves, actua- tors for active valves and pumps [4549], flow sensors e.g. [50-701, reaction chambers, filters [71.72] and mixers [73]. Pumps (mainly membrane pumps [27,48,74-811, but other principles have been suggested as well [29,82-%I), pas- sive and active valves are the first systems that have been realized. They comprise several of these elements (actua- tors, channels, valves). Examples of all these components have been demonstrated in the past. few years, and for the realization of MLHS which are more complex than pumps, all components exits. Here we describe work performed in the micromechanics group at MESA on valves, microp- umps, mixers, detectors and dosage systems and we discuss
t On leave from: Mechanical Engineering Research Laboratory, Hitachi Ltd, 502 Kandatsu. Tsuchiun 300, Japan.
0960-1317/94/040227+19519.50 8 1994 IOP Publishing LM
a few possibilities to in t ep te these and other components into more complex systems.
2. History of micropumps in Twente
The work on pumps has some tradition in the microme- chanics group at the University of Twente. The research was initiated by Jan Smits, who now is with the University of Boston, at the beginning of the eighties. His work re- sulted in a peristaltic pump comprising three active valves in line, see figure 1. Each valve consists of a camber with inlet and outlet both covered by a flexible membrane. By deflecting the membrane an underpressure is generated.
The actuation is piezoelectric: the membranes are made from two piezoelectric discs. If a potential difference is applied over this pair, one of the discs expands and the other one shrinks with the result that the membrane bends. Smits’ work was published not before Transducers ’89 [29], two years after the follow-up of this work was presented at Eurosensors 87 by van Lintel, van de Pol and Bouwstra [U].
Smits’ pump is able to pump 100 pVmin without pressure difference between inlet and outlet, when a voltage of 80 Vis supplied to the actuator. The pumping rate drops to zero at a pressure difference of 60 cm water. The pump rate is maximal at an actuation frequency of 15 Hz, and the pump ceases to pump at a frequency above 50 Hz.
227

M Elwenspoek et a/ 1 2 3
Figure 1. Schematic of Smits' design [29] of a peristaltic pump. The pump cycle is a s follows: membrane (1) is bent, liquid flows into the opening. This state is shown. Next, membrane (2) is bent, again liquid flows into this opening. Then membrane (1) is released, and this valve closes. During this step the liquid under membrane (1) is pushed back. In the next step membrane (3) is activated, liquid flows from the right resetvoir into the opening. Now membrane (2) is released, and after this membrane (3). Note that this pump pumps equally in both directions; it is fully symmetric.
.t Figure 2. Schematic of van Lintels membrane pump [27]. In the centre the pump chamber and the pump membrane is sketched. When the membrane bends down, the right valve opens and the left valve is forced to close; this state is shown. If the membrane is released or bends upwards, the left valve opens while the right one closes. Note that this pump is asymmetric.
The major problem with this design in our eyes was that the pump was leaky: a small pressure difference across the pump resulted in a flow through it if the actuators were not activated. This is a problem which several pump principles suffer from: electrohydrodynamic pumps [M- 861 and pumps that have diffuser nozzles [83]. Without taking additional measures these pumps are obviously not suitable for applications that prohibit any backflow of the pumped liquid such as systems for drug delivery and chemical analysis.
Having these applications in mind, we looked for a principle which makes use of check valves. This investigation led to the design described in van Lintel's paper [27], see figure 2. Based on this design a pump for medicine delivery is now being commercialized by DEBIOTECH. Van Lintel used a piezo disc glued to a glass membrane; under a voltage difference the piezo disc changes its lateral dimension which results in a bending moment in the bimorph. The original prototype was able to produce a maximum pressure of 100 cm water and had a maximum yield of around 10 pllmin at 1 Hz block wave actuation.
Mainly for aesthetic reasons van de Pol suggested in alternative for the piezoelectric actuation which he called thermopneumatic actuation [74]. Piezoelectric discs must be glued to the membrane. An alternative was to grow a thin film of ZnO on the pump membrane, but analysis showed [87] that thin film ZnO is not suitable for pump actuation because the film cannot be grown thick enough. In order to produce the energy required to produce a sufficiently large volume stroke at a given minimum
228
pressure, the piezoelectric material has to have a minimal volume,, which is much too large to be produced by thin film growth. The principle of using thermal expansion for the actuation of active valves has been described earlier by Zdeblick at Transducers '87 [28]. By heating a gas or a liquid under its vapour pressure the pressure is increased and a memhrane can be deflected. Such an actuator can be realized completely by using silicon technology--as opposed to gluing a piezoelectric disc to a membrane. This pump, when using ambient air as the expanding medium in the actuator, was able to produce a maximum, pressure of 40 cm water and had a maximum yield of around 30 pl/min. Maximum yield occurred at 1 Hz block .wave actuation. When using a Liquid-vapour equilibrium system the maximum pressure can be much larger ([881, see below).
Parallel to the development of micropumps we started work on liquid flow sensors recognizing the great demand for these sensors. From a technological point of view a simple scheme for flow sensing is the thermal one, using a central heater and thermal sensors up- and down stream, see e.g. [SO, 53,55,69]. We soon found that the process we used to fabricate the sensor structure-a SisNA-grid- shaped carrier for the heating elements and temperature sensitive resistors-was also suitable for the fabrication of the resistor that is used to heat the gas in the pump actuator. Our experience with anodic bonding and machining of Pyrex wafers that stemmed (see secAon 4) from our work on pumps was exploited also for the flow sensor. therefore the integration of the thermopneumatic pump and the flow sensor was at hand. Once having demonstrated the feasibility of integrating several functions of a MLHS on one wafer the progress is obvious: tedious and expensive assembly of microcomponents is avoided. The resulting microdosage system will be described in detail in this paper. It has been described first at MEMS '93 in Fort Lauderdale, USA [IS].
At the same workshop we described a micromixer [731. This is a key component for MLHS for chemical analysis. In practically all systems of this type, the sample must be diluted in a carrier liquid andor mixed with one or more reagents. The chemical reaction leads to a compound that has physical properties which makes their detection easy. In established FiA-systems the product often absorbs light. Mixing in microsystems is by no means trivial since the Reynolds numbers are of the order 1, and no turbulence or vortices can be induced by any means. For mixing oniy diffusion processes remain which are very slow. This will be discussed in more detail below. Typical flow velocities are of the order of 1 c d s , linear extensions of 1-10 cm, so mixing must be completed within one second or faster. The basic idea for sufficiently fast mixing in microsystems was proposed in '92 by R Miyake from Hitachi, who was then on leave at our group. He proposed to inject the sample liquid into the reagent (e.g. for a FIA) through closely spaced nozzles. Thereby the diffusion length is dramatically decreased, and mixing times of one second and less are possible. Here, the mixer is also described in detail.
Forthcoming work in our group will focus on alternative designs of pumps using cheaper materials
Towards integrated microliquid handling systems
much longer than A the flow resistance is given by the equation of Poisseuille. In case of not fully developed laminar flow, the flow resistance is much larger and, dependence on Ap, A is given by
than silicon, design of micropore filters [72], on further integration of components resulting in miCrO-FIA-SyStE", modelling of components and systems and development of design strategies for microliquid handling systems and components.
For the latter, modelling of components and systems is, of course, indispensable. We have good experience with modelling using the language of Bond Graphs, a graphical language especially suitable for modeliing lumped elements systems that have degrees of freedom in several energy domains. Unfortunately, to date this language is confined to systems control people, and neither known or appreciated by our colleagues in microsystems technology. In order to take advantage of this language one has to be skilled in using it, but once one has overcome this barrier, a graphical model of complex systems is readily composed and implemented in existing software (TUTSIM, CAMAS). The models we have developed are,, and will be, described elsewhere [87,89-911.
3. Components
3.1. Channels
Channels form the basic element of all microliquid handling systems. This applies trivially for the interconnections of components. but also for components themselves. A valve is a channel that opens and closes, mixers are assemblies of channels (or, traditionally, just a long channel), in flow sensors heat transfer in channels is observed etc. In the cases we are to study here the flow of the liquid is at small Reynolds numbers and small entrance length.
The Reynolds number is defined by (see e.g. [92])
P V S Re = - rl
with p the density of the liquid, U the mean velocity of the flowing liquid, 6 is the hydrodynamic diameter of the channel and q is the dynamic viscosity of the liquid. The hydrodynamic diameter for a channel of rectangular cross- section is given by _ .
U b A = - a f b
with a and b the side lengths of the channel. The velocity v is related to the volume flow (the 'yield') Q, by
0 = v x ab. (3)
Using (2) and (3) we have for the Reynolds number
(4)
Equation (4) is convenient for our purposes because 4, is constant throughout the pump. Typical dimensions of channels interconnecting components are 1 x 0.2 mm'. However, orifices or slits in valves that open and close may be much smaller. Note that if a >> b, the larger dimension determines Re.
The entrance length A in a channel is the length over which a parabolic velocity profile builds up. For channels
5 is a number of order 0.09, that depends weakly on the ratio a/b [93]. Again using (2) and ( I ) we find
(7a)
(7b)
for a >> b. It is seen that for A the smaller dimension dominates. Characteristic flows for micropumps are 1 pl/s, p = 1 g/cm3, q = 1 cP, and the order of the prefactor fpQ, /q ;3 IO-' cm, meaning that A 5 100 pm. Thus care must be taken for the design and modelling of valves. Other dimensions in micropumps are of the order of mm (maybe Zengele's pump [76,79,20] is an exception), accordingly entrance phenomena play a minor role.
The flow resistance, defined by the ratio of the pressure difference along a channel A p and the volume flow Q, is now given by
2fReLq Re = -.
abS' Here f Re is the friction coefficient, which depends on the shape of the channel only. For a square cross-section, f Re sz 14, and it approaches 24 for narrow slits (a >> b). A detailed discussion can be found in 1931.
Some authors reported on deviations of the flow resistance from the equations given above [23,24]. In a discussion of this problem in Gravesen's review paper [ I ] , it is stated that the results of different papers are in conflict with each other, and no firm conclusion can be drawn. For example. Urbanek [23] does not give the length of the channels he examined in his experiments. Entrance- phenomena could lead to the observed results. We observe in our own lab that contamination ofliquids by particles, the origin of which is quite unclear, occurs very often. These observations were made thanks to fine pore sieves (2.5 pm) designed and realized by van Rijn [72]. Without filtering we never would have obtained reproducible results, and if they reproduced. they were in accordance with theoretical expectations. Therefore we take these reports with some care.
A notorious problem of micromachined channels stems from the use of anisotropic etching which results in sharp corners. These are potential regions of very low flow, and therefore points where precipitation and trapping of gas bubbles is likely. Both cause serious troubles in MLHS. In the long run, therefore, it is desirable to develop alternative technologies to machine smooth channels, such as isotropic wet or dry etching. A promising
229
M Elwenspoek et a/
micromachining technology is anodic HF etching [94- 961 since this method allows a precise and reproducible geometry. Etching can be stopped just by switching off the power.
Trapped bubbles in the system greatly change the flow resistance. From our experience it i s important to be able to judge if there are bubbles in the system and to find them. This is most easily accomplished if all channels are visible. This leads to an important design rule: MLHS should be fabricated in such a way that the ducts are visible. The best method is to sandwich a micromachined silicon wafer between two glass wafers.
3.2. Valves
A critical design issue is the valve. We can distinguish active and passive valves. A passive valve is a flow dependent obstruction. In active valves an actuator and the valve function are combined in some way, an example for an active valve is seen in figure 1, in which the membrane itself has two functions: actuation and closing an orifice. Many alternative concepts for active microvalves are described in the literature l28-441.
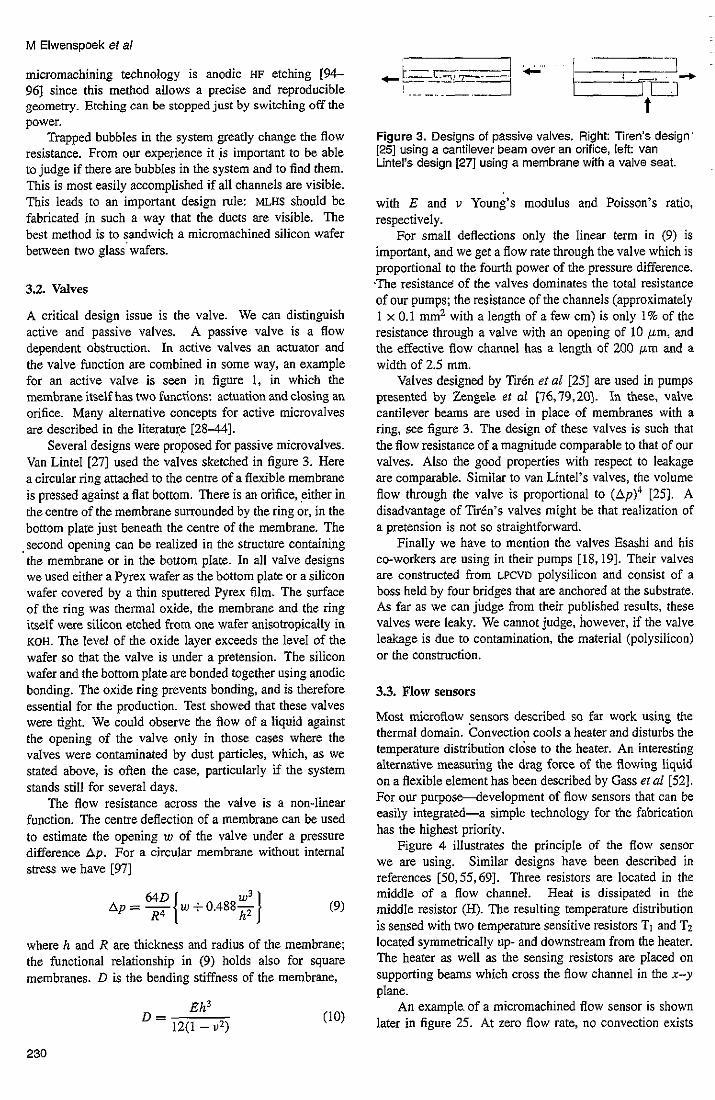
Several designs were proposed for passive microvalves. Van Lintel [27] used the valves sketched in figure 3. Here a circular ring attached to the centre of a flexible membrane is pressed against a flat bottom. There is an orifice, either in the centre of the membrane surrounded by the ring or, in the bottom plate just beneath the centre of the membrane. The second opening can be realized in the structure containing the membrane or in the bottom plate. In all valve designs we used either a Pyrex wafer as the bottom plate or a silicon wafer covered by a thin sputtered Pyrex film. The surface of the ring was thermal oxide, the membrane and the ring itself were silicon etched from one wafer anisotropically in KOH. The level of the oxide layer exceeds the level of the wafer so that the valve is under a pretension. The silicon wafer and the bottom plate are bonded together using anodic bonding. The oxide ring prevents bonding, and is therefore essential for the production. Test showed that these valves were tight. We could observe the flow of a liquid against the opening of the valve only in those cases where the valves were contaminated by dust particles, which, as we stated above, is often the case, particularly if the system stands still for several days.
The flow resistance across the valve is a non-linear function. The centre deflection of a membrane can be used to estimate the opening w of the valve under a pressure difference Ap. For a circular membrane without internal s t rss we have [97]
Ap = - (9)
where h and R are thickness and radius of the membrane; the functional relationship in (9) holds also for square membranes. D is the bending stiffness of the membrane,
(10)
L z c - 4 C"' " -3 c -- - ~ l l i
t ! . .. . - ?3
Figure 3. Designs of passive valves. Right: Tiren's design [25] using a cantilever beam over an orifice, left van Lintel's design [27] using a membrane with a valve seat.
with E and U Young's modulus and Poisson's ratio, respectively.
For small deflections only the linear term in (9) is important, and we get a flow rate through the valve which is proportional to the fourth power of the pressure difference. The resistance: of the valves dominates the total resistance of our pumps; the resistance of the channels (approximately 1 x 0.1 mm2 with a length of a few cm) is only 1% of the resistance through a valve with an opening of 10 fim, and the effective flow channel has a length of 200 pm and a width of 2.5 mm.
Valves designed by Ti rh et a1 [25] are used in pumps presented by Zengele et nl [76,79,20]. In these, valve cantilever beams are used in place of membranes with a ring, see figure 3. The design of these valves is such that the flow resistance of a magnitude comparable to that of our valves. Also the good properties with respect to leakage are comparable. Similar to van Lintel's valves, the volume flow through the valve is proportional to (Ap)' [25]. A disadvantage of TirLn's valves might be that realization of a pretension is not so straightforward.
Finally we have to mention the valves Esashi and his co-workers are using in their pumps [18,19]. Their valves are constructed from LPCVD polysilicon and consist of a boss held by four bridges that are anchored at the substrate. As far as we can judge from their published results, these valves were leaky. We cannot judge, however, if the valve leakage is due to contamination, the material (polysilicon) or the construction.
3.3. Flow sensors
Most microflow ,sensors described so far work using the thermal domain. Convection cools a heater and disturbs the temperature distribution cldse to the heater. An interesting alternative measuring the drag force of the flowing liquid on a flexible element has been described by Gass et al [521. For our purposdevelopment of flow sensors that can be easily integrated-a simple technology for the fabrication has the highest priority.
Figure 4 illustrates the principle of the flow sensor we are using. Similar designs have been described in references [50,55,69]. Three resistors are located in the middle of a flow channel. Heat is dissipated in the middle resistor (H). The resulting temperature distribution is sensed with two temperature sensitive resistors TI and TZ located symmetrically up- and downstream from the heater. The heater as well as the sensing resistors are placed on supporting beams which cross the flow channel in the x-y plane.
An example. of a micromachined flow sensor is shown later in figure 25. At zero flow rate, no convection exists
230

Towards integrated microiiquid handling systems
Figure 4. The liquid flow is measured by its influence on the temperature distribution in the sensor resulting from heat generation in the heater H. TI (upstream) and T2 (downstream) are temperature sensors.
in the flow channel, and the heat generated by the heater will be transferred only by the axial and tangential diffusion through the fluid and by the conduction through the heater and sensor support to the substrate.
This type of flow sensor can be operated in two principally different ways. In a steady state the temperature distribution can be measured, and if heat is generated by pulses, the time of flight can be measured directly. Both methods have advantages. The steady state method is advantageous if heat is transported via diffusion faster than by convection. In the consfant power mode the temperature differenceT2-Tt is an accurafe measure for the flow. In the constant femperature mode the temperature of the heater is directly measured and kept constant. The electrical power needed is a measure of the flow. In this mode the flow sensor is very fast.
The time of flight method works best in a regime of large flow velocities. In this case the shape of the heat pulse is not seriously deformed by diffusion, which leads to sharp signals.
This is an interesting aspect that will be described in greater detail in [ S I . In the static mode and the dynamic mode different combinations of the fluid properties influence the temperature profile, which are D and K , with D = K / P C the thermal diffusivity of the fluid, K t he thermal conductivity, p t he density and c the heat capacity at constant pressure. A combination of dynamic and static measurements therefore enables one to measure flow and e.g. the concentration of one of two or more components in a flowing gas. Here we concentrate on the steady state method in the constant power mode.
The model for the flow sensor is extensively described elsewhere [53]. Here only a brief description will be given. The temperature profile in the y and z direction (see figure 4) is assumed to be constant res. linear. With v the liquid velocity the temperature distribution in the middle of the channel can be approximated by:
( 1 1 ) a2T aT ax* ax
D . - - ” . - - g . D . T = O
with g = l/l:. A more exact treatment of this problem is given by van Kuijk et a1 [ S I . Equation (1) is linear in T and can be solved analytically. The temperature distribution for three different flow velocities is given in figure 5.
The temperature at the two sensor sites, upstream and downstream, the heater temperature Th and the temperature difference AT are given in figure 6.
The sensor characteristics are strongly influenced by the thermal diffusivity D of the fluid involved. The sensitivity
Figure 5. Temperature distributions in the middle of the channel as a function of t h e position x . The heater is from ‘x = -L to x = L. The cuwes characterize three typical flow velocities: a : U = 0. b: v is small enough to allow heat to diffuse to the downstream temperature sensor. c: U is too large to allow heat to diffuse to the downstream temperature sensor.
Figure 6. Temperature a t various positions as function of the flow velocity against J,, is the heater temperature, J”, Td the upstream res. downstream sensor temperature and A J the temperature difference between the downstream sensor and upstream sensor.
of the sensor S = A T j v , for small velocities ( U + 0) is given by [531:
(12)
with P the dissipated power in the heater, K the heat conductivity of the liquid, l y the channel width, x, the distance between heater and temperature sensor, I, half the channel height. Sensing water-flow with I, = 1000. &m, I, = 250 pm, K = 0.6 W h K , D = 1.4 10-7 m2/s and 10 mW dissipation in the heater we find S = 2.7 W(mm/s). For water and the actual channel geometry, the temperature difference A T has its maximum at v = 11 m d s . Iso- propanol has D = 6.96 IO-’ m2/s and a maximum AT occurs at v = 6 m d s .
The measurement results shown in figure 7 are qualitatively similar to the model results shown in figure 6. For low flow-velocities the output signal is linear with v and at a certain ‘turn-over’ flow velocity. the output signal reaches a maximum. For a reliable flow signal the sensor has to be used for flow velocities below U,,,. In
23 1
1, p s = 0.o92--xm I , K D

M Elwenspoek et a/
Figure 7. Flow-sensor output with water as liquid. With a flow channel of 1000 p m x 500 Um. a flow velocity v = 20 mmls corresponds to a volume flow of 600 fillmin. For water: K = 0.6 WlmK, D = 1.4 l O - 7 m2/s [53].
the dosing system, this counts for the momentary flow- velocity. Quantitative deviations from the model are due to approximations made in deriving equation (1 I ) and to the fact that the temperature sensors have spacial extension comparable to the distance between sensors and heater. This has bccn neglected in the model.
3.4. Micromixers
Mixing in microsystems is by no means trivial. As we have seen, the Reynolds number is small, and mixing can occur only via diffusion, which is a slow process. Diffusion times increase proportional to the square of the distance 1981,
y = L2/2dD (13)
where 2, is the diffusion coefficient of the molecules in the liquid d rcpresents the dimension of the problem. e.g. d = 2 for diffusion in two dimensions. Typically, D is of the order of IO-’ “15, leading to diffusion times of 1000 s (17 min!) if L = 1 mm, which is a typical measure for the width of a channel. Hence we looked for a micromixer that will mix fast (1 s) small volumes (of the order of 1 &I) and which is easily realized by silicon micromachining, in order to facilitate integration in complex systems.
The basic idea of the micromixer is to decrease the diffusion length required for mixing. A possible operator is illustrated in figure 8. The mixer has an area for mixing which is very flat and thin with many micro-nozzles on the bottom. During operation, first, the mixing area is filled with one liquid, and the other liquid is injected into the area through the many micro nozzles, making many microplumes. These plumes increase the contact surface. , The nozzles are positioned very closely in rows, 1 6 IO0 p m apart, reducing drastically the diffusion time. Thus, effective mixing will be performed without any additional driving pressure.
3.4.1. Feasibility test Numerical analysis of the diffusion flow was employed to check the feasibility of the concept. Figure 9 is a comparison of the mixing efficiency for two cases: (a) injection of a large single plume and (b) injection of many microplumes from micronozzles. The former case (a) may be considered as a simple junction of two liquids. The second case (b) was simulated by
232
Figure 8. Basic idea of the micromixer. The sample is injected into the reagent through many closely spaced micronozzles.
superimposing individual plumes, since the flow pattern from each nozzle is similar. 2, = 1.0 x lO-5 cm’ls was used to represent molecular diffusion in water. This value is used for all calculations in this paper. The parameter for estimating the degree of mixing is given by a percentage of the total mass injected where concentration decreases to less than 50%.
Degree of mixing = JvcddV/JvcdVx 100%
cd = c < 0.5 (14)
Here, the value of 50% is used as an index of the degree of mixing. c and cd is standardised by the initial concentration co. The total liquid is I p1 and the How rate is 4 plls. Therefore, it stops at 0.25 sec. This result in figure 9 indicates that mixing in the micromixer is 100 times faster than in case (a), comparing the time to reach a value of 40%. A 3D diagram of the concentration distribution indicates that all portions of the microplume have diffused to the next one in 1.0 sec. Hence, this analysis predicts that this mixer will finish mixing within a few seconds.
3.4.2. Design of the micromixer The main parameters for designing a micromixer are the number of micronozzles and the distance between nozzles, which determines the area of the mixer, the height of the mixing area ( h ) , the size of the micronozzles (d), and the injection flow rate of the microplumes (4).
The distance between the nozzles is set to be 100 wm. The area for mixing was determined to be 2 mm x 2 mni, which provides enough volume to mix a microliter of liquid, and allows space for 400 micronozzles.
Height ( h ) , size of nozzle (d), and injection How rate (4) are discussed using numerical analysis, since they are directly related to the diffusion flow. A finite differential method is used to simulate changes in the microplume over time [99]. The model of the flow passage is symmetrical around the axis of the micronozzle i n order to simplify to a ZD analysis (see appendix). Here, a flow with a microplume comes out through the micronozzle and expands radially.

Towards integrated microliquid handling systems
Figure 9. Feasibility test of the micro mixer.
The diffusion flow is well estimated using the centre of gravity, zg and the variance of mass diffused U [lo01
z&) = l r ( v ) c W . W V / / V c ( V , t)dV (15)
u( t ) = / (z(V) - z,?c(V, t)dV/ J( c(V, t)du (16)
where c(V. t) means the mass concentration at unit volume V, at time t, and z(V) is the height in the position of the volume V. The concentration was standardized by the initial concentration CO. u ( f ) represents the variance of mass diffused. The larger the value of z,(t), the higher the microplume is injected, which results in a good mixture in the axial direction. Likewise, when the value of U @ )
becomes larger, the microplume is dispersing more and becomes well mixed.
Simulation results The purpose of the simulation was to find optimum parameters for nozzle diameter, injection flow rate and channel height.
First, we checked the influence of the nozzle diameter d on the diffusion flow, which relates to the injection velocity. Figure 10 (upper part) shows a comparison of d = 10, 20; and 30 p m when the flow rate is 4 plls, giving mean values for injection velocity of 127 mmls (d = 10 Am), 32 m d s (d = 20 fim), and 14 mmls (d = 30 Fm). All results show similar curves for both z,(t) and u(t) for this large velocity range. The injection flow from the nozzle was found to be a laminar jet, since the Reynolds number (taking the diameter d as the representative length) is of the order of I . It is therefore assumed that a viscous force moderates the injection flow immediately after i t comes out of the nozzle. In the following analysis we chose d = 20 pm.
Next, we discuss the influence of the injection flow rate, using q = 1.0 plls, 4.0 fills, and 8.0 plls, and a
V
Figure 10. Diffusion depending on nozzle diameter (upper part), injection flow rate (centre) and height of mixing area (below).
total injection volume of 1 + I , The flow stops at 1.0 sec (1.0 plls), 0.25 sec (4 plls), and 0.125 s (8 plls). Figure 10
233
M Elwenspoek et a/
Figure 11. Fabrication of micromixer.
(middle) shows that after a given time, e.g. 1 s , the variance increases if q is larger. A quick injection speeds up the dispersion. Still, even when the flow rate g = 1 .O p.I/s, the mixing is completed quickly. Hence, we used q = 4 p l ls as the flow rate for the following simulation.
Figure I O (bottom) shows the change of variance depending on the height ( h ) , from 110 p m to 440 p.m for q = 4 plls and d = 20 p m . Here, the injection stops after 0.25 s. For the given parameter set u( t ) reaches a maximum around 300 p m .
Summarizing, a diameter of the nozzles around 20 p m , and a height of the channel into which liquid is injected of 300 pm is suggested, and a flow rate more than 4 plls is best, but the last depends on the performance of the pump.
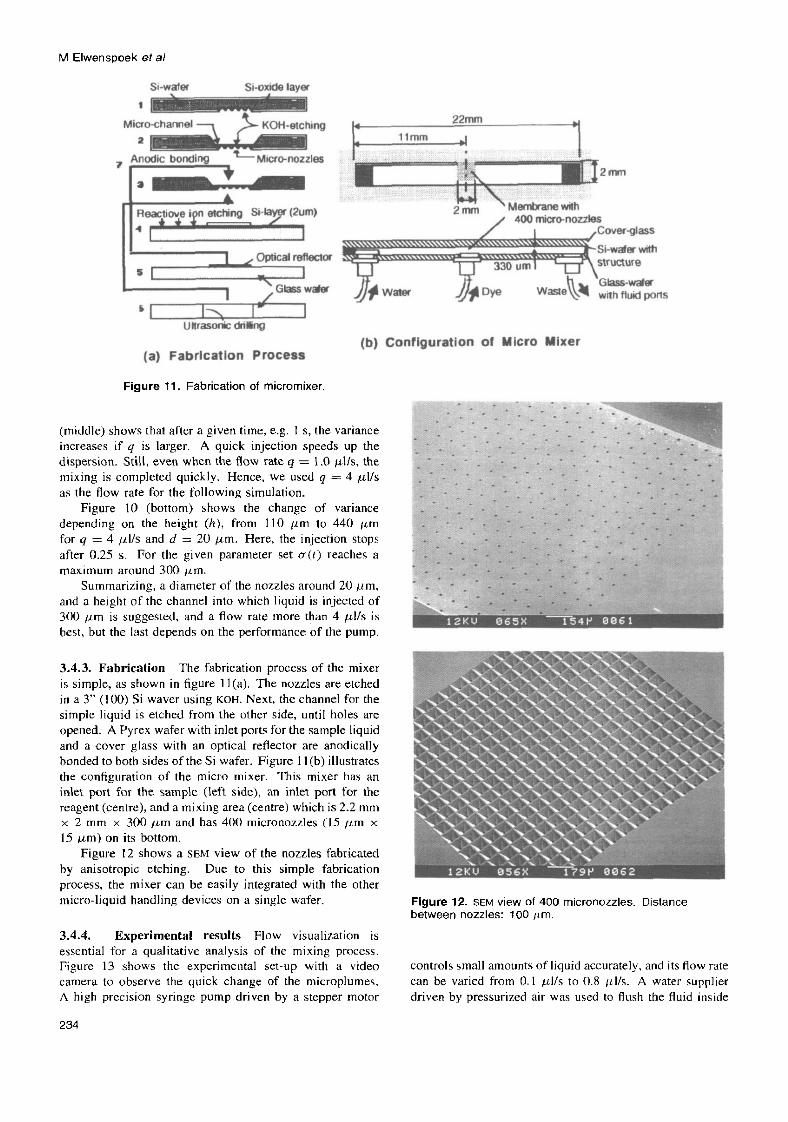
3.4.3. Fabrication The fabrication process of the mixer is simple, as shown in figure 1 I(a). The nozzles are etched in a 3” (100) Si waver using KOH. Next, the channel for the simple liquid is etched from the other side, until holes are opened. A Pyrex wafer with inlet ports for the sample liquid and a cover glass with an optical reflector are anodically bonded to both sides ofthe Si wafer. Figure 1 I(b) illustrates the configuration of the micro mixer. This mixer has an inlet port for the sample (left side), an inlet port for the reagent (centre), and a mixing area (centre) which is 2.2 mm x 2 mm x 300 y m and has 400 micronozzles (15 p m x 15 /Am) on its bottom.
Figure 12 shows a SEM view of the nozzles fabricated by anisotropic etching. Due to this simple fabrication process, the mixer can be easily integrated with the other micro-liquid handling devices on a single wafer.
3.4.4. Experimental results Flow visualization is essential for a qualitative analysis of the mixing process. Figure 13 shows the experimental set-up with a video camera to observe the quick change of the microplumes. A high precision syringe pump driven by a stepper motor
234
Figure 12. SEM view of 400 micronorzles. Distance between nozzles: 100 urn
controls small amounts of liquid accurately. and its How rate can be varied from 0.1 p l l s to 0.8 LLlls. A water supplier driven by pressurized air was used to flush the Huid inside

Towards integrated microliquid handling systems
Figure 13. Experimental set-up.
Figure 14. Microscopic view of microplumes. Successive images after 0.1 s, 0.2 s , 0.6 s and 1.2 s. Note the slow temporal development of the boundary between the whole mixing area and the surrounding water.
the mixer. Instead of a reagent, a fluorescent dye, uranine; (C20H,oOsNa2) was used because it is easily visible even at low concentrations [17].
Figure 14(a) is a microscopic view of the plumes, with a flow rate of 0.57 plls and a total of about 0.5 pl of dye. It shows that the dye diffuses into a homogeneous mixture withi,, a few secon&, after the injection stops (at around 0.9 s), as the simulation predicts. We observed that the boundary between the mixed liquid and the water remains
clearly after many minutes. This is because the diffusion time is great in this case as discussed earlier. This allows the mixing area to be treated as a micro-reaction cell.
3.5. Optical detectors
When one thinks of integrating functions for MLHS on one wafer, one should select the simplest ones first. Integration of chemical sensors seems to be more difficult than the integration of jus t an optical window to observe the colour of e.g. reaction products, from which the concentration of a certain chemical species in the sample can be deduced. Below we describe such a detector system. This type of detector was inspired by work of Verpoorte et a/ [ 1011.
An example for an alternative is described in [ lOZl . I n
of the flow channel, and additionally, planar waveguides cross the flow channel normally. Light is directed through the wave guide. The interaction of the light with the fluid
235
shav for a very long time. The boundaq can sti1l be Seen this work optical windows are integrated on top and bottom
M Elwenspoek et a/
Figure 15. Optical set-up for measurement.
(such as Raileigh and Raman scattering or fluorescence) can be observed through the windows,, Such a design circumvents the alignment problem. Here. we describe the first type of detector.
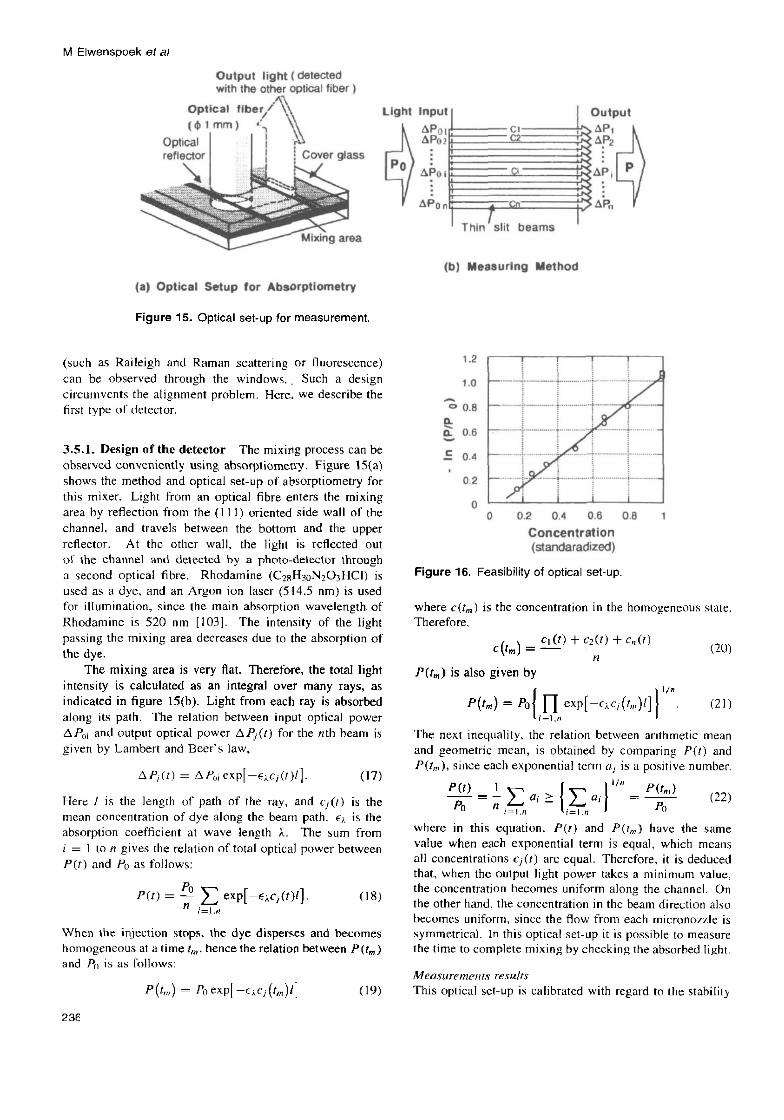
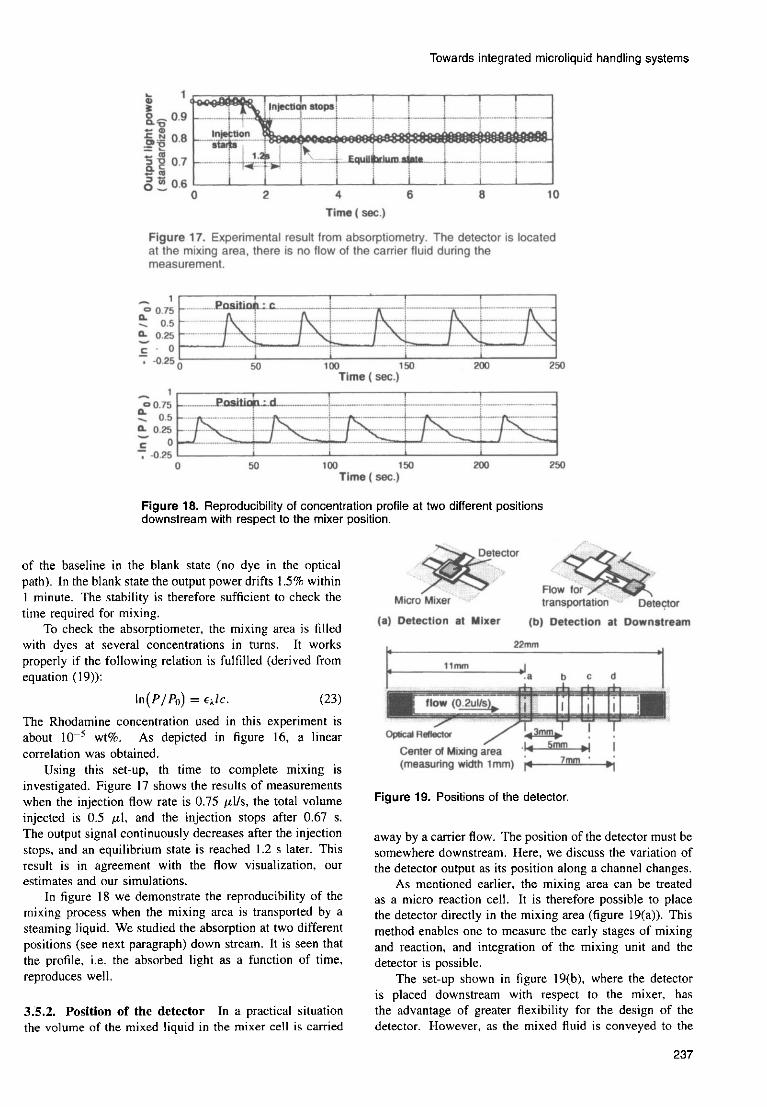
3.5.1. Design of the detector The mixing process can be observed conveniently using absorptiomerry. Figure 15(a) shows the method and optical set-up of absorptiometry for this mixer. Light from an optical fibre enters the mixing area by reflection from the (I 1 1 ) oriented side wall of the channel, and travels between the bottom and the upper reflector. At the other wall, the light is reflected out of the channel and detected by a photo-detector through a second optical fibre. Rhodamine (C2xH30N203HCI) is used as a dye, and an Argon ion laser (514.5 nm) is used for illumination, since the main absorption wavelength of Rhodamine is 520 nm [lO3]. The intensity of the light
the dye. n
Figure 16. FeaSibility Of Optical set-up.
where ~(1 , ) is the concentration in the homogeneous state. Therefore,
(20) passing t he mixing area decreases due to the absorption of
intensity is calculated as an integral over many rays, as
along its path. The relation between input optical power ;=I."
CI (1) + C Z ( f ) + C " ( f ) C ( f m ) =
The mixing area is very flat. Therefore, the tntal light
indicated in figure 15(b). Light from each ray is absorbed
p(r,,,) is also given by I / "
p(rm) = PO( H exp[-chcj(f,,r)l~l . (21)
AP,i and output optical power AP, ( f ) for the nth beam is given by Lambert and Beer's law,
A P j ( t ) = AP", exp[-~ic,(r)l].
Here I is the length of path of the ray, and c j ( t ) is the mean concentration of dye along the beam path. eh is the absorption coefficient at wave length 1, The sum from i = 1 to n gives the relation of total optical power between P ( r ) and Po as follows:
The next inequality, the relation between arithmetic mean and geometric mean, is obtained by comparing P ( 1 ) and P(t,,,), since each exponential term U, is a positive number.
(17) 1 / 3 8 P t t ) I P(fn,) (22) - = - c a; > (,E .;) = __
9 1 Po n,=I," ,=I."
where in this eqUatlOn, P ( t ) and P(1,) have the same value when each exponential term is equal, which means all concentrations c,j(t) are equal. Therefore, i t is deduced that, when the output light power takes a minimum value,
Po ( l8) the Concentration becomes uniform along the channel. On the other hand. the concentration in the beam direction also becomes uniform, since the Row from each micronozzle is symmetrical. In this optical set-up it is possible to measure the time tn complete mixing by checking the absorbed light.
Measurpmentr resulfr This optical set-up is calibrated with regard to the stability
P( I ) = - C exp[-tAc,(t)/].
When the injection stops. the dye disperses and becomes homogeneous at atime I,. hence the relation between P(I , ) and Po is as follows:
7l /=1,n
P ( a ) = P O ~ X P [ - E ~ C , ( I ~ ) ~ ] (19)
236
Towards integrated microliquid handling systems
Figure 10. Reproducibility of concentration profile at two different positions downstream with respect to the mixer position.
of the baseline in the blank state (no dye in the optical path). In the blank state the output power drifts 1.5% within I minute. The stability is therefore sufficient to check the time required for mixing.
To check the absorptiometer, the mixing area is filled with dyes at several concentrations in turns. It works properly if the following relation is fulfilled (derived from equation (19)):
in(P/Po) = € * I C . (23) The Rhodamine concentration used in this experiment is about IO-’ wt%. As depicted in figure 16, a linear correlation was obtained.
Using this set-up, th time to complete mixing is investigated. Figure 17 shows the results of measurements when the injection flow rate is 0.75 plls, the total volume injected is 0.5 pl, and the injection stops after 0.67 s. The output signal continuously decreases after the injection stops, and an equilibrium state is reached 1.2 s later. This result is in agreement with the flow visualization, our estimates and our simulations.
In figure 18 we demonstrate the reproducibility of the mixing process when the mixing area is transported by a steaming liquid. We studied the absorption at two different positions (see next paragraph) down stream. It is seen that the profile, i.e. the absorbed light as a function of time, reproduces well.
3.5.2. Position of the detector In a practical situation the volume of the mixed liquid in the mixer cell is carried
Figure 19. Positions of the detector.
away by a carrier flow. The position of the detector must be somewhere downstream. Here, we discuss the variation of the detector output as its position along a channel changes.
As mentioned earlier, the mixing area can be treated as a micro reaction cell. It is therefore possible to place the detector directly in the mixing area (figure 19(a)). This method enables one to measure the early stages of mixing and reaction, and integration of the mixing unit and the detector is possible.
The set-up shown in figure 19(b). where the detector is placed downstream with respect to the mixer, has the advantage of greater flexibility for the design of the detector. However, as the mixed fluid is conveyed to the
237

M Elwenspoek et a/
Figure 20. Deformation of the concentration profile due to streaming of the carrier fluid ( V = 0.3 ~Ils) at four positions downstream with respect to the mixer.
Figure 21. Pump principle of the thermo-pneumatic reciprocating liquid pump.
convenient if several physical domains are involved detector location, its concentration .profile is deformed by [87,89-91]. The pump is divided into three (energetically convection. This deformation .results from the parabolic coupled) sub-systems: a thermal sub-system, a pneumatic velocity profile. We observed this deformation and then sub-system and a hydraulic sub-system. checked the feasibility of this method. The thermal sub-system consists of the heater, its
As depicted in figure 13, the pair of optical fibres are mechanical support and the (ideal) gas in the air-chamber. positioned along the flow channel with and xyz-positioner. Both the gas and the support contribute to the heat Figure 19 illustrates the measurement positions, which are conduction to the substrate. The heat capacity of the the centre of the mixing area, 3 mm. 5 mm and 7 mm gas is small compared to that of the heat resistor. The from the centre. The time-dependent signal from each lumped element model of the thermal sub-system consists position is shown in figure 20 for a carrier flow rate of of heat conducting and heat capacitance elements. With about 9.2 iills. The deformation of concentration profile is the materials used for the heater and geometry of the air- clearly seen; it occurs quickly in the first ten millimetres chamber a characteristic time for heating and cooling is downstream. The peaks quickly become wider, the peak calculated: z,h = 0.05 s. This time is an important height and the slopes on either side of the maximum design issue. We found that it is important to minimize decrease. Clearly, placing the detector right at the injection the heat capacity of the carrier of the heating element and area of the mixer has the advantages of having a larger to minimize the heat conduction from the carrier to the signal and quicker response. The latter would increase the wafer package. Both are simultaneously provided by using possible measurement frequency. a silicon nitride grid suspended in the centre of the cavity.
In conclusion, we can state that the detector described We found earlier that, for example, evaporating the resistor here works properly. It is sensitive, simple and gives directly on the pump membrane will not work for a pump reproducible results. The alignment of the optical fibres for liquid because the good heat contact from the membrane with respect to the windows is a little tricky, and this may to the liquid prevents any heat transport to the gas [4h]. he a bottleneck for large scale production. In later stages This is different for gas pumps, as demonstrated by [SI]. of research one should look for possibilities to integrate The pneumatic sub-system consists of the gas in the air optical connectors i n the system. chamber i n combination with the exchange channel with
the surroundings and the (movable) pump membrane. The sub-system can he described by a 'pneumatic' characteristic 3.6. Micropumps time, which is determined by the volume of the air chamber
Since for applications of the MLHS we arc interested and the flow resistance of the exchange channel. For the mainly in the medical field and in chemical analysis, we pump described here, rp = 30 s. Since the process is non- concentrate on pumps that make use of check valves. The ' linear (the pressure drop along the channel causes a density principle ofthe reciprocating pump is shown in figure 21. It gradient in the air), this time depends on the power that has two passive valves and a pump chamber connected to a is dissipated in the actuator. The time constant given is pump membrane. The pump-actuator is thermo-pneumatic characteristic for the power regime used. Similar remarks to make large volume strokes and simultaneously large apply for the next subsystem as well. This time can he pressure build up possible. In the air-chamber. the air is designed easily to be even longer by making the air channel periodically heated by electrical dissipation in the heater longer and narrower. The channel is necessary in the first resistor. Due to the varying temperature, the air-pressure in place from a technological point of view. The air cavity the chamber will periodically deflect the pump membrane, is closed by anodic bonding, a process at 450 "C. Without which results in the transport of liquid through the pump. any leakage the pressure in the air cavity would he only
We briefly review the mmt important results of the 215 of an atmosphere. which is of course not desired. The model of the pump. As in earlier work the pump air channel also has a performance advantage: the mean is inodelled with the bond-graph method which is very pressure in the cavity. after a transient time that is governed
238

Towards integrated microliquid handling systems
4.1. Fabrication of the dosing system
The realization process of the dosing system is shown in figure 23. On a double sided polished 380 pm (100) Si wafer, alignment marks are etched, 3 pm deep cavities (RIE etch, explained later) and Si02 valve ridges are deposited and patterned (see 1,2 in figure 23). The SiOz valve ridges are used for selective bonding. Then a 1 ,urn LPCVD SiN layer is deposited and patterned to form the mechanical support for the resistors of the pump and the flow sensor resistors (see 3 in figure 23). The deposition parameters are such that there is no mechanical stress in the SiN layer. Next, the SiSN4 layer on the top surface is patterned with the mask needed to etch anisotropically the cavity beneath the heater in the air chamber of the pump, the top of the valves and the liquid channels. The latter are aligned parallel to the (110) crystal direction. The SiN support-beams across the channel (flow sensor) and the cavity (under pump heater) have a width of 40 pm and are oriented in the (100) crystal direction. The beams cross each other at a centre to centre distance of 200 pm. On the bottom surface, the SIN layer is patterned wit the mask for the liquid channels, the valves and the pump chamber. Also a photoresist mask for the via’s in the Si-wafer (e.g. needed for the ‘hole’ in the inner ridges of the valves) is applied. On the top-surface a 200 nm CrAu layer for the resistors is deposited and patterned (‘lift-off, see 4 in figure 23). The 30 nm chromium layer is applied for optimal adhesion of the Au layer. At the bottom-surface, the wafer is 40 pm deep dry etched (RIE: only the ‘via’-mask active at the bottom-surface). Now the SiN mask at the bottom-surface is made active (RIE strip of photoresist) and the wafer is etched through (see 6 in figure 23). The cross section of the liquid channels is an inverse trapezoid which is 1000 pm wide at the top and 170 pm deep. The cavities in the top Pyrex wafer (GI in figure 23) are isotropically etched in a 50% HF solution at room temperature with a sputtered silicon layer as an etch mask. The feed-through (@I = 400 pm) for the electrical contacts (in G1) and in and outlet (in G2) are made by drilling. Finally both Pyrex wafers and the structured Si wafer are anodically bonded (1000 V, 450 ”C) to each other. A cross section of the completed dosing system is given in figure 24.
The pump-heater resistor and the flow-sensor resistors are wired as shown in figure 27. Additional contacts are implemented to omit the influences of the bond-pad series- resistances on the resistance measurements. Sketches of the liquid inlet and outlet and of the electrical feed-through are given in figure 28.
The pump can be filled simply by injecting IPA in the inlet using a syringe. Filling the system with water is accomplished by first filling it with IPA and then switching over to water.
Flowsenror
Figure 22. Dose control loop. The liquid volumes moved by the pump are controlled by a flow sensor and an electronic circuit.
mainly by 7@, will be equal to the outside pressure. During a down stroke the pressure in the pump chamber will be larger, and during an up stroke smaller than the ambient pressure. In this way the pump has a sucking action. This is different from the original piezoelectric pump.
The hydraulic sub-system qonsists of the liquid (with its density and dynamic viscosity) in combination with the pump-chamber, the valves, the liquid channels, the flow sensor and the inlet and outlet tubes to the dosing system. Since the valves have non-linear characteristics (see equations (9) and (IO)), the hydraulic system cannot be described by a single ‘hydraulic’ relaxation time. However. simulations for the dosing system described here, show a hydraulic relaxation time q, in the order of 1 s. This time sets the maximum speed with which the pump can be driven.
The pump functions properly only if ?h c zp since otherwise the expanding gas would flow through the exchange channel without deflecting the membrane. T~ sets the minimum speed of the pump. The characteristic time for the actuation, i.e. the time needed to cool or heat the air chamber, must be larger or equal to the hydraulic time in order not to limit the maximum speed of the pump. This is the case in our design. The dynamics of the pump are limited by the hydraulics and not by the thermal actuation.
We note that the hydraulic relaxation time of Zengele’s pump is much smaller (10 ms, [76]). This is mainly due to the much smaller volume (capacitance) of the pump, and not to a smaller flow resistance.
The valves implemented are of the normally-closed type with a pretension, which means that the pressure changes in the air chamber have to be higher than the threshold pressure for the valves.
4. Dosing systems
For a correct and reliable dosing of a certain volume of liquid it is necessary that the yield of a pump is independent of the pressure difference over that pump. Pumps are not suitable to directly perform the dosefunction on their own. In combination with a flow sensor, and an electronic circuit it is relatively easy to control the yield (see figure 22). The signal of the flow sensor has to be integrated and the speed and accuracy of the sensor have to be sufficient in order to lead to an accurate control of the dose.
4.2. Characterization of the dosing system
First the flow sensors are characterized. This is done by forcing a flow in the forward direction through the flow sensor by means of a syringe pump. The flow sensors operate in the accurate ‘constant power’ mode. The electrical configuration for the read-out of the sensors is
239

M Elwenspoek ef a/
Figure 23. Process sequence for the dosing system.
Figure 24. Cross section of the dosing system.
Figure 25. SEM photograph of flow sensor. The channel width is 1 mm.
given in figure 29. The temperature measuring resistors R, and Rd are placed in a bridge configuration. A temperature difference between the upstream and downstream sensor i s linearly converted to a bridge-output voltage (531. The measured sensor sensitivities are in the order of 25 pVIK for a heater dissipation of 10 mW using IPA as liquid. The bridge output voltage as function of the liquid flow is given in figure 7 .
The spontaneous flow behaviour of the dosing system Is measured with help of the experimental set-up given in figure 31. If the input pressure is higher than twice the valve 'pre-pressure', liquid wil l flow through the dosing system.
240
Figure 26. Optical photograph of the Si-wafer (top face) with four dosing systems next to each other. The glass wafers are not applied yet.
Figure 27. (a) Flow sensor wiring. R,,, Rd the sensing resistors upstream res. downstream. Rh the heating resistor. Resistors U, and R2 are implemented in order to obtain a 'Cpoint' measurement avoiding parasitic series resistances. (b) Pump heater wiring; Rh covers the pump-membrane area: 7 x 7 mm2.
Figure 28. Sketch of liquid inlet and outlet (left) and of the electrical feed-trough.
When the syringe pump is programmed at a certain flow, both capillary tubes indicate the pressure difference over the dosing system.
The liquid pump i s characterized with the help of a square wave generator for the pump-heater, and a high speed digital voltage meter for measuring the flow sensor output. The results on the dynamic pump characteristics of the system are given in figure 32. For a first characterization of the pump, the pumping speed i s measured with the help of a capillary tube at zero pressure difference between the inlet and the outlet of the dosing system. Results are given in figure 33.

Towards integrated microliquid handling systems
30- t 20-
i o - -
b Gnd
Figure 29. Sensor measurement circuit for constant power mode. Nominal resistor values are: Rn = 800 Q; Ru. Rd=3300 Q; Rj, R2 =725 Q; R3, R4 =3300 Q; Rs = 100 Q [531.
F = l Hz
Figure 30. Experimental set-up for measuring the spontaneous flow and the pre-pressure of the normally closed valves.
Heater 1 -- 0
0 I 2 3 4 (sec)
Figure 31. Actuator-signal. measured liquid flow and the calculated (integration of flow) liquid dose as a function of time. The flow-sensor output is measured ever 50 ms.
4.3. Results
Static properties of the pump The passive valves are normally closed. The built-in pressure of the valves is proportional to the bending stiffness of the valve membranes.
For a dosing system described here, with 30 p m thick valve membranes we measured spontaneous flow above 0.01 atm. Below this pressure there was no flow. For a thickness of about 40 p m we measured spontaneous flow
0 5 10 15 20 25 30
v F (Hz)
,,.- Figure 32. Pump yield as function of the frequency of the pump-heater signal ( P = 2.5 W).
0 - 0 1 2 3 4 - P (w)
Figure 33. Pump yield as a function of the applied heater power.
above 0.03 atm. These values are in agreement with the expected ones.
Dynamic properties of the pump The ‘thermal‘ relaxation time is measured using the temperature dependence of the pump-heater resistor. We measured ~h - 0.1 s. With the pump-heater continuously activated, the ‘pneumatic’ relaxation is estimated from the pump-membrane displacement as a function of time: T~ = 15 s. Figure 31 shows that the pump stroke with an input power of 5.W is about 0.9 pl. From the flow sensor signal we see that the hydfaulic relaxation of the dosing system is within’l s. After a pump cycle some liquid flows back to the pump body.(see also [74]).
At low pump frequencies the hydraulic system relaxes within one cycle, so the pump make is constant and the pump yield is linear with the pump frequency (see figure 32). At higher frequencies there is not enough time for hydraulic relaxation an the yield decreases. At a fixed pump frequency, the pump speed is almost linear with the heating power P (figure 33). The offset in the curve is due to the back-flow or ‘dead’ volume of the pump. At high powers the curve saturates.
The pressure build-up of the pump is limited by the maximum pressure build-up in the actuator chamber. With a liquid-vapour equilibrium the pressure can be increased dramatically, with comparable temperature elevations. This was experimentally verified with a pump with a broken pump membrane. With sufficient input power the alcohol that now penetrates the actuation chamber boils, giving
241

M Elwenspoek e t a / Micca-ti uld
/ O m i M ?%*em Reagent
Micr-Li "id Micro Mixer msing %ysm and Reador
Figure 34. Schematic of a fluid injection analysis system.
rise to an actuation pressure large enough to pump against 113 atm.
5. Outlook for further integration
Figure 34 gives an artists impression of a fluid injection analysis (FIA) system in possibly the most simple case. A reagent and a sample are brought together in well defined amounts by using two dosage systems as described above, these liquids are mixed in a micromixer and transferred to an optical detector unit. In view of the Simple processes to realise the mixer, the integration with dosage systems is straightforward, and we hope that we shall be able to publish results of our current work on NAs soon [104].
The system shown in figure 34 is not a complete jet. First of all, the sample usually needs some pre-treatment, at least it must be filtered since small particles jam the valves. Further, precipitation would be fatal for the system. A means of cleaning (by rinsing) must be developed, and perhaps integrated. This would mean that one needs more functions on the wafer. At least, the sample carrying part should have a connection to enable rinsing; this part could consist merely of a normally closed valve or, preferentially an active valve.
We have described a concept of horizontal integration. The co-operation between the Neuchatel micromechanics group directed by N F de Rooij and Ciba Geigi led to a concept of vertical integration [ll], where the components were realized i n different wafers and stacked in order to assemble a system. The wafers were not bonded but mechanically fixed.
A third concept would be to s t m from a backplate that contains channels for the connection of components [104], similar to a printed circuit board. It is necessary then to develop standards for the inlets and outlets of the components. If this concept turns out to be successful it would offer great flexibility to built up MLHS in a simple and economically feasible way.
way, but, if successful, is perhaps the cheapest way for large scale production, since there is no need for assembly. The demonstration of the dosage system makes us optimistic.
The horizontal integration certainly is the less flexible '
Acknowledgments
The authors would like to thank Erwin Berenschot, Han Gardeniers, Dick Ekkelkamp, Rob Legenberg, Ulf Lindberg, Joost van Kuuk and Niels Tas for useful discussions and suggestions and the staff of the MESA- S&A laboratory for their help in realising the samples.
Appendix
The basic equations of this finite differential analysis are a vortex transport equation and a diffusion equation [9] . The boundary conditions for the wall are given as follows:
U = 0. (AI) In the outlet, we suppose the change of velocity in the r direction is moderate enough and the flow in the axial direction is small enough as compared to that in the r direction. For the diffusion, we suppose the change of flux is moderate enough. Therefore, we get
a% ar ar2
- 0 - =O. (A2) u , = o -- all ,
In the centre. since the flow and diffusion are symmetrical, the condition is given by
In the inlet, we suppose a Poisseuille flow profile.
References
[l] Gravesen P. Branebjerg J and Jensen 0 S 1993 Microfluidics - a review J. Micromech. Microeng. 3 168-82
[2] van der Pol F C M 1990 Micro fluid handling systems Micro Systems Technologies 90 pp 799-805
[31 van de Pol F C M 1991 Micro fluid handling systems 5th Int. Cong on Advanced Robotics (Pisa, ItulyJ pp 281-90
[4] van der Schoot B H, Jeanneret S, van den Borg A and de Rooij N F 1992 A silicon integrated miniature chemical analysis system Sensors Actuarors B6 57-60
[I Alegret S, Bartroli J, Jimenez-Jorquera C, de Valle M, Dominguez C, Esteve J and Bausells J 1992 Flow-through Ph-ISFET + reference - ISE as integrated detector in automated FIA determinations Sensors Actuators B6 555-60
[6] Shoji S, Esashi M, van der Schoot B H and de Rooij N F 1992 A study of high-pressure micropump for integrated chemical analysis systems, Sensors Acfuarors A32 335-9
171 da Garcia I. Montesinos J L, Poch M, Alonso J. Bartroli J, Ferreia I M P L V 0 and Lima J L F C 1993 Evaluation of a mathematical model to simulated dynamic response of tubular potentiometric sensors in flow-injection systems Sensors Actuators 31-38 607- 11
[SI Manz A, Graber N and Widmer H M 1990 Miniaturised total chemical analysis systems: a novel concept for chemical sensing Sensors Acruurors B1244-8
chemical analvzine svstem inteerated on a silicon wafer [9] Nakagawa S, Shoji S and Esashi M 1990 A micro -
Proc. MEMS ;go i p i9-94 1101 Moritz W. Lisdat F. van der Schoot B H. de Raoii N F. . _ I ~~ ~~.~ ,~ ~,
van den Vlekkei H H, Ligtenberg H C G and Grohmann I 1993 Flow injection analysis using pHlpF ISFET combinations for determination of very low fluoride concentrations Sensors Acluators 815-16 223-7
[ l l ] Verpoone E. Manz A, Widmer H M, van der Schoot B H and de Rooij N F 1993 A three dimensional micro flow system for a multi step chemical analysis Proc. Transducers '93 (Yokohama, Japan) pp 939-42
[I21 Lindberg U 1992 Micromechanics - fabrication process and fluid components PhD Thesis University of Uppsala
(131 Jansson M, Emmer A, Roerade J. Lindberg U and Hilk B 1992 Micro vials on a silicon wafer for sample introduction in capillary electrophoresis J. Chromatograph 626 3 1 0 4
242
Towards integrated microliquid handling systems
Active valves for microfluidics Proc MME '93 (Neucharei, Switzerland, September 7-8) pp 1 8 1 4
[36] Haji Babaei J, Huang R-S and Kwok Ch Y 1994 A new bistable microvalve using an SiO, beam as the movable part Proc. Actuator 94 (Bremen, Germany, June 15-17) PP 34-7
Benecke W 1994 A fast switching silicon valve for pneumatic control systems Proc. Actuator 94 (&men, Germany, June 15-17) pp 30-3
[3Sl Zdeblick M J, Anderson R, Janowski I, Kline-Schroder B. Christel L, Miles R and Weber W 1994 Proc. Actuator 94 (Bremen, G e m n y , June 15-17) pp 56-60
electrostatically actuated microvalve for an integrated microflow controller Proc. MEMS '94 (Oiso, Japan, January 25-8) pp 7-12
[40] Lisec T, Hoerschelman S, Quenzer H J., Wagner B and Benecke W 1994 Thermally driven microvalve with buckling behaviour for pneumatic applications Proc. MEMS '94 (Oiso, Japan, January 25-28) pp 13-7
[41] Huff M A, Gilber 1 A and Smidt M A 1993 Flow characteristics of a pressure balanced microvalve Proc. Transducers '93 (Yokohama. Japan) p 98
Electrostatically-actuated gas valve with large conductance Pmc. Transducers '93 (Yokohama, Japan)
[37] Lisec T. Hoerschelman S, Quenzer H I , Wagner B,
[391 Robertson J K and, Wise K D 1994 A nestled
[42] Shikida M, Sato K and Tanaka S 1992
PP 94-7 [43] Yanagisawa K, Kyuwano H and Tag0 A 1993 An
electromagnetically driven microvalve Proc. Transducers '93 (Yokohama. Japan) pp 102-5
electrostatically driven gas valve under high pressure conditions Proc. MEMS '94 (Oiso, Japan, January 28-28) pp 2 3 5 4 0
1451 Branebjerg J and Gravesen P 1992 A new electrostatic actuator providing improved stroke length and force Proc. MEMS '92 (Travemiinde, Germany) pp 6-1 1
Fluitman J H J I989 A thermo-pneumatic actuation principle for a microminiature pump other micromechanical devices Sensors Actuators 17 1 3 9 4 3
[47] Li J , Chaney L J, Kaviani M, Bergsuom P L and Wise K D 1991 Microactuation based on thermally-drive I,
ohase-chanee Proc. Transducers '91 (San Francisco.
1441 Shikisa M and Sato K I994 Characteristics of an
[46] van de Pol F C M. Wonnink D G I, Elwenspoek M and
[I41 Emmer A, Jansson M, Roerade J, Lindberg U and Hok B 1991 Fabrication and characterisation of a silicon microvalve Proc. 131h Inc. Symp. on Capiilaty Chromatography R Tiva del Garda
Integrated micro-liquid dosing system Pmc. MEMS '93 pp 254-9
[I61 Gass V, van der Schoot B H. Jeanneret S and de Rooij N F 1993 Micro liquid handling using a flow regulated microoumo Proc. MME '93 (Neuckatel, Switzerland,
[15] Lammerink T S J, Elwenspoek M and Fluitman J H J 1993
Septembei7-8) pp 177-SO 1171 Mivake R. Ohki H. Yamazaki I and Yabe R 1991 . _
Development of micro sheath flow chamber Proc. MEMS '91 pp 265-70
[la] Esashi M 1990 Integrated micro flow control systems Sensors Actuators A21-A23 161-7
[I91 Shoji S. Nakagawa S and Esashi M 1990 Micro-pump and sample injector for integrated chemical analysing system Sensors Actuators A21-A23 11 89-92
Richter A 1994 Application of microdiaphragm pumps in microfluid systems Proc. Actuaror 94 (Eremen, Germany, June 15-17) pp 25-9
dimensional micro integrated fluid systems (MIFS) fabricated by stereo lithography Proc. MEMS '94 (Oiso, Japan, January 25-28) pp 1-6
[22] Arquint P. Bechler B. Cologi A, de Rooij N F, Gass V, Gmunder F K, Ivorra M-T, Jeanneret S, Lorenzi G, MBusli P-A, van der Schoot B H and Walther I 1993 Microsystem technology for biological experiments in space; development of a miniature bioreactor Proc. Transducers '93 (Yokohama, Japan) pp 921-3
investigation of the temperature dependence of Poisseuille numbers in microchannel flow Proc. MME '93 (Neuchatel, Switzerland, Seprember 7-8) pp 169-72
[24] Harley J, Bau H, Zemel J N and Dominko V 1989 Fluid flow in micro and sub micron size channels Pmc.
[20] Zengele R, Geiger W, Richer M, Ulrich 1, Kluge S and
[21] Ikuta K, Hirowatiri H and Ogata Y 1994.Three
[23] Urbanek W, Zemel J N and Bau H H 1993 An
MEMS '89 pp 25-28 [251 TirBn J, TemBz L and HSk B 1989 Batch - fabricated ~.
non-reverse valve with cantilever beam manufactured by micromachining of silicon Sensors Acruators 18 389-96
valve Proc. Transducers '91 (San Francisco. June [26] Smith L and HSk B 1991 Silicon self aligned no-reverse
2&27) pp 1049-51 1271 van Lintel H T C. van de Pol F C M and Bouwstra S 1988 . _
A piezoelectric micropump based on micromachining of silicon Sensors Actuators 15 153-67
[28] Zdeblick M J, Barth J B and Angel1 J B 1987 A microminiature electric-to-fluidic valve Proc. Transducers '87 (Tokyo, Japan, June 2-5) pp 827-9
[29] Smits G J 1990 A piezoelectric micropump with three valves working perestaltically Sensors Actuators 15 203-6
[30] Ohnstein T, Fukida T, Ridley J and Bonne U 1990 Micro machined silicon microvalve Pmc. MEMS '90 pp 95-9
[31] Jerman H 1991 Electrically-activated normally-closed diavhraem valve Proc. Transducers '91 (San Francisco. USA) pp 1045-8
1321 Sato K and Shikida M 1992 Electrostatic film actuator with . . a large vertical displacement Proc. MEMS '92 (Travemiinde, Germany) pp 1-5
I331 Doring C, Grauer T, Marek J. Mettner M S. Trah H-P and Willmann M 1992 Micromachined thermoelectrically driven cantilever stmctures for fluid injection deflection Pmc. MEMS '92 (Travemiinde. Germny) pp 12-8
[34] Bosch D, Heimhofer B, Muck G, Seidel H. Thumser U and Welser W 1993 A silicon microvalve with combined electromagneticlelectrostatic actuation Sensors Actuators 37-38 684-92
[35] Schomburg, Fahrenberg J, Maas D and Rapp R 1993
kSAJ pp 103740 1481 Mizoauchi H. Ando M. Mizuno T. Tagaki T and Nakaiima - . I
N i992 Design and fabrication of light driven micropump Proc. MEMS '92 (Travemlinde, Germany) pp 31-6
Proc. MEMS '94 (Oiso, Japan) pp 188-92
1991 A micromachined flow sensor for measuring small liquid flows Pmc. Transducers '91 (San Francisco. USA.
[49] Popescu D S, Lammerink T S J and Elwenspoek M 1994
[SO] Branebjerg J, Jensen 0 S. Laursen N G and Leistico 0
J&e 24-27) pp 41-4 1511 van der Wiel A I. Linder C and de Rooii N F 1993 A . _
liquid velocity sensor based on the hot wire principle Sensors Actuators A37-A38 693-7
[52] Gass V, van der Schoot B H and de Rooij N F 1993 Nanofluid handling by micro-flow sensor based on drag-force measurements Proc. MEMS '93 (Fort Lorrderdale. USA, February 7-10) pp 173-8
1531 Lammerink T S J, Tas N, Elwenspoek M and Fluitman J H J 1993 Micro-liquid flow sensor Sensors Actuators A37-A38 45-50
measuring millilitre per minute liquid flow Sensors Actuators A33 143-53
M and Fluitman J H J Multi parameter detection in fluid flows Sensors Actuators submitted
[54] Yang C and S~eberg H 1992 Monolithic flow sensor for
[SS] van Kuijk J, Lammerink T S I, de Bree H-E, Elwenspoek
243

M Elwenspoek eta/
(561 Jouwsma W 1993 Marketing and design in flow sensing Sensors Actuators A37-A38 274-9
1571 Bouwstra S, Kemna P and Legtenberg R 1989 Thermally excited resonating membrane mass flow sensor Sensors Actuators 20 213-23
Elwenspoek M 1990 Resonating microbridge mass flow sensor Sensors Actuators A21-A24 332-5
1591 Legtenberg R, Bouwstra S and Fluitman J H J 1991 Resonating microbridge mass flow sensor with low-temperature glass bonded cap wafer Sensors Actuators A25-A27 723-7
microflowmeter with built-in self test Proc. Transducers '91 (San Francisco. USA. June 24-27) pp 400-3
[61] Esash M 1991 Micro flow sensor and integrated magnetic oxygen sensor using it Proc. Transducers '91 (San Francisco, USA, June 24-27) pp 34-7
Analytical 2D model of CMOS micromachined gas flow sensors Proc. Transducers '91 (San Francisco, USA.
[58] Bouwstra S, Legtenberg R, Tilmans H A C and
[60] Cho S T and Wise K D 1991 A high-performance
[62] Wachutga G, Leggenhager R, Moser D and Baltes H 1991
June 24-27) pp 22-5 1631 Stemme G 1987 An integrated gas flow sensor with . .
puls-modulated outputProc. Transducers '87 (Tokya, Japan. June 2-5) pp 364-7
(641 van Oudhuisden B W and Huijsing J H 1987 lntegrated flow friction sensor Proc. Transducers '87 (Tokyo, Japan) pp 368-71
1651 Tai Y-C and Muller R S 1987 Lightly doDed oolv silicon . _ bridge as an anemometer P r o p T r i n s d b ; '87 (Japan, Tokyo. June 2-5) pp 360-3
oolvimide as thermal insulator IEEE Trans. Electron [66] Stemme G 1986 A monolithic gas flow sensor with
DeGices ED-33 1470-4
High-sensitivity 2-D flow sensor with an etched thermal insulation smcture Sensors Actuators A 2 1 4 2 3 425-30
Baltes H. Moser D, Leggenhager R, Brand 0 and Jaeggi D 1991 Thermomechanical micmstructures bv CMOS and
van Oudhuisden B W and van Herwaarden A W 1990
~~~ ~~ ~~
micromachining ASME Symp. on Micro-Mhzanical Systems (Atlanta. USA) pp 1-15
1995 A micmtransducer for air flow and differential pressure sensing applications Micromachining and Micropackaging of Transducers ed C D Fung, F W Cheng, W H KO and D J Fleming (Amsterdam: Elsevier) pp 207-14
high-performance mass-flow sensor with integrated laminar flow micro channels Proc. Transducers '85 (Philadelphia) pp 361-3
panicale filter in silicon Sensors Actuators A21423 904-7
[69] Hocker G B. Johnson R G, Higashi R E and Bohrer P J
[70] Petersen K and Brown J 1985 High-precision,
1711 Kittisland G, Stemme G and Norden B 1990 A sub-micron
[72] van Rijn C and Elwenspoek M to be published [73] Miyake R, L a h e r i n k T S I, Elwenspoek M and Fluitman
J H J 1993 Micro mixer with fast diffusion Pmc. M E M f '93 (Fort Lauderdale, USA, 7-10 February)
1741 van de Pol F C M. van Lintel H T C, Elwenspoek M and . . Fluitman J H J 1990 A thermopneumatic micropump based on micro-engineering techniques Sensors Actuators A 2 1 4 2 3 198-202
[75] Esashi M 1991 Pmc. Transducers '91 (San Francisco, USA, June 2 4 2 7 ) pp 400-3
[76] Zengele R, Richter A and Sandmaier H 1992 A micromembrane pump with electrostatic actuation Proc. MEMS '92 (Travemiinde, Germany) pp 19-24
1771 Rapp R, Kadel K, Stromburg W K and Stern G 1993 Mit dem LIGA-verfahren hergestellte mikromembranpumpe Drittes Sympos. Mikmsystemtechnik (Regensburg, Germany, February 17-18) pp 123-33
(781 Rapp R, BIey P, Menz W and Schromburg W K 1993
244
Micropump fabricated with the LlGA process Proc. MEMS '93 (Fort Lariderdale, USA, February 7-10) P 123
I791 Zengele R, Richter M, Brosinger F, Richter A and Sandmaier H 1993 Performance simulation of microminiaturized membrane pump Proc. Transducers '93 (Yokohama, Japan) pp 106-9
piezoelectric micropump realized by stereolithography Pmc. Actuator 94 (Bremen, Germany, June 15-17) pp 42-5
1994 Micropump manufactured by, thermoplastic moulding Proc. MEMS '94 (Oiso, Japan, January 25-28) pp 18-21
[SZ] G Fuhr, Hagedorn R, Miiller T, Benecke W and Wagner B 1992 Pumping of water solutions in microfabricated electrohydrodynamic systems Proc. MEMS '92 (Travemiinde, Germany) pp 25-30
1831 Stemme E and Stemme G 1993 A valveless diffuserlnozzle-based fluid pump Sensors Actuators A39 159-67
[84] Bart S F, Tavrow L S. Meregany M and Lang J H 1990 Microfabricated electrohydrodynamic pumps Sensors Actuators A21423 193-7
[85] Richter A and Sandmaier H 1990 An electrohydrodynamic micropump Proc. MEMS '90 (Napa Valley, USA) pp 99-104
1991 A micromachined electrohydrodynamic (EHD) pump Sensors Actuators A29 159-68
micro-engineering techniques PhD Thesis University of Twente
[80] Dario P, Carrozza M C, Croce N and Magnami B 1994 A
[81] Biirstgens B, Bacher W, Menz W and Schromburg W K
[86] Richter A, Plettner A, Hoffmann K A and Sandmaier H
[87] van de Pol F C M 1989 A pump based on
[88] Lammerink T S J unpublished (891 van de Pol F C M, Breedveld P C and Fluitman J H J 1990
Bond-graph modelling of an electro-thermo-pneumatic micropump Technical Digesf MME '90 2nd Workhop on Micromachining. Micromechanics and Microsystems pp 19-24
Micro Pump in Tems of Bondgraphs Int. J. Modelling Simul. submitted
[91] van Kuijk J, Lammerink T S J , de Bree H-J, Elwenspoek M and Fluitman I H J 1995 Multi Parameter Detection in Fluid Flow Sensors Actintors at press
Theoretische Physik (Berlin: Hydrodyamik Akademieverlag)
(931 Shah R K and London A L 1978 Laminar Flow Forced Convection in Ducts (New York: Academic)
[94] Eijkel C J M, Bran'ebjerg J. Elwenspoek M and van de Pol F C M 190 A new technology for micromachining of silicon dopant selective HF anodic etching for the realisation of low-doped monocrystalline silicon structures Tecknicol Digest MME '90, 2nd Workshop on Micromachining, Micromechanics and Microsystems pp 175-9
F C M 1990 A new technology for micromachining of silicon dopant selective HF anodic etching for the realisation of low-doped monocrystalline silicon structures IEEE Electron Device Lett. 11 588-9
1961 Branebjerg J. Eijkel C J M, Gardenien J G E and van de Pol F C M 1991 Dopant selective HF anodic etching of silicon Proc. Micro Electro Mechanical Systems (MEMS '91) pp 221-5
1971 Timoshenko S 1959 Theom ofplates and Shell (New York:
I901 van de Pol F C M and Breedveld P C 1994 Modelling of a
[92] Landau L D and Lifshitz E M 1974 Lehrbuch de
[95] Eijkel C J M, Branebjerg J, Elwenspoek M and van de Pol
. _ I "
McGraw-Hill) 1981 Cussler E L 1984 Diffusion Mass Transfer in Fluid Svstems . _
(New York Camgridge University p;ess) pp 52-< [99] Oran E S and Botis J P 1987 Nwnericd Simulation of

Reactive Flow (New York Elsevier)
(New York Dekker) pp 205-7
Kratiger B, Widmer H M. van der Schoot B H and de Rooij N F 1992 A silicon flow cell for optical detection in miniaturised total chemical analysis systems Sensors Actuators B6 66-70
[IOO] Stemberg I C 1966 Advances in Chromatography vol 2
[ lol l Verpoorte E, Manz A, Liidi H, Bruno A E, Maystre F.
Towards integrated microliquid handling systems
[I021 Sobek D, Young A M, Gray M L and Sensturia S D 1993 A microfabricated flow chamber for optical measuements in fluids Pmc. MEMS '93 (Fort Lauderdale, USA) pp 207-12
11031 wheeler 0 H, Kaplan A A et al Organic Elecrronic Spectral Data vol 3 (New York: Interscience) p 1025
[lo41 Lammerink T S J,~ van den Berg A and Elwenspoek H, Fluitman I H I submitted to Transducers 1995
245