McGraw-Hill/Irwin © 2005 The McGraw-Hill Companies, Inc. All ...
Upload
lesley-knightCategory
view
213download
0
4- 1
McGraw Hill/Irwin Copyright © 2009 by The McGraw-Hill Companies, Inc. All rights reserved
Fundamentals of Corporate
Finance
Sixth Edition
Richard A. Brealey
Stewart C. Myers
Alan J. Marcus
Slides by
Matthew Will
Chapter 4
McGraw Hill/Irwin Copyright © 2009 by The McGraw-Hill Companies, Inc. All rights reserved
Measuring Corporate Performance
4- 2
Topics Covered Value and Value Added Measuring Profitability Measuring Efficiency Analyzing the Return on Assets: The Du Pont System Measuring Leverage Measuring Liquidity Calculating Sustainable Growth Interpreting Financial Ratios The Role of Financial Ratios–and a Final Note on
Transparency

4- 3
Value and Value AddedPepsiCo Balance Sheet (December 31, 2006) $Millions
4- 4
Value and Value Added
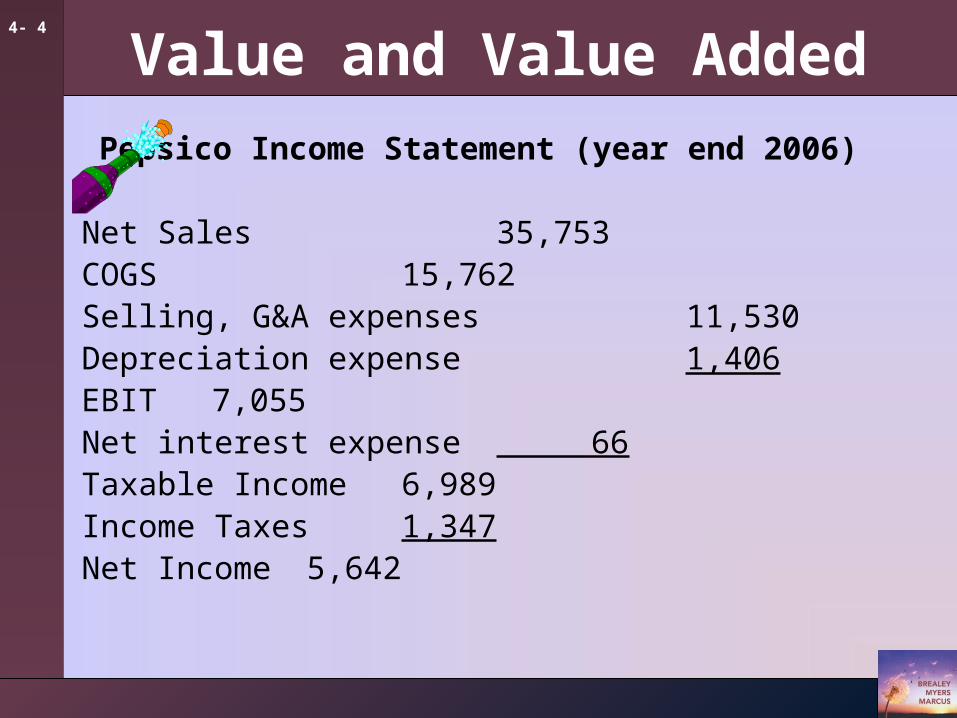
Pepsico Income Statement (year end 2006)
Net Sales 35,753COGS 15,762Selling, G&A expenses 11,530Depreciation expense 1,406EBIT 7,055Net interest expense 66Taxable Income 6,989Income Taxes 1,347Net Income 5,642

4- 5
Value and Value Added
Market Capitalization Total market value of equity, equal to share price
times number of shares outstanding.
Market Value Added Market capitalization minus book value of equity.
share)per (priceshares) (# tion CapitalizaMarket
ValueBook Equity -tion CapitalizaMarket MVA

4- 6
Value and Value Added
Stock market measures of company performance, 2006. Companies are ranked by market value added. (dollar values in millions)
4- 7
Value and Value Added
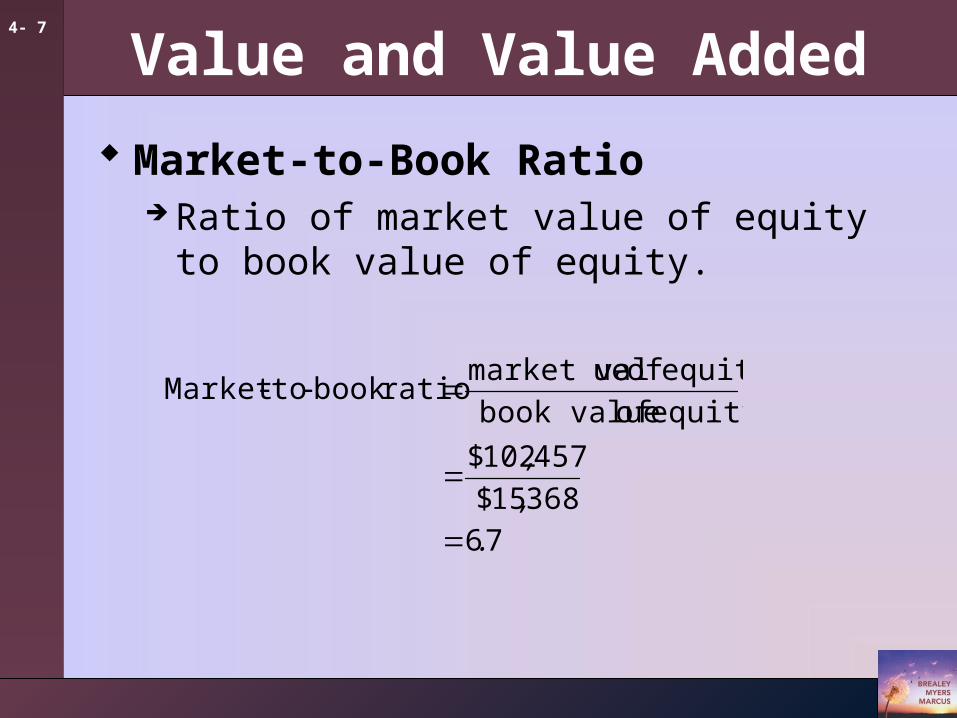
Market-to-Book Ratio Ratio of market value of equity to book value of
equity.
76
36815$
457102$
equity of book value
equity of uemarket valratiobook -to-Market
.
,
,

4- 8
Measuring Profitability
Economic Value Added (EVA) Net income minus a charge for the cost of capital
employed. Also called residual income.
Residual Income Net Dollar return after deducting the cost of
capital
Equity Equity ofCost - IncomeNet
Income Residual
EVA

4- 9
Measuring Profitability
Economic Value Added (EVA) of PepsiCo
Equity Equity ofCost - IncomeNet
Income Residual
EVA
million $4,527
14,251.095 - 5,642
Income Residual
EVA

4- 10
Measuring Profitability
Accounting measures of company performance, 2006. Companies are ranked by return on equity.
4- 11
Measuring Profitability
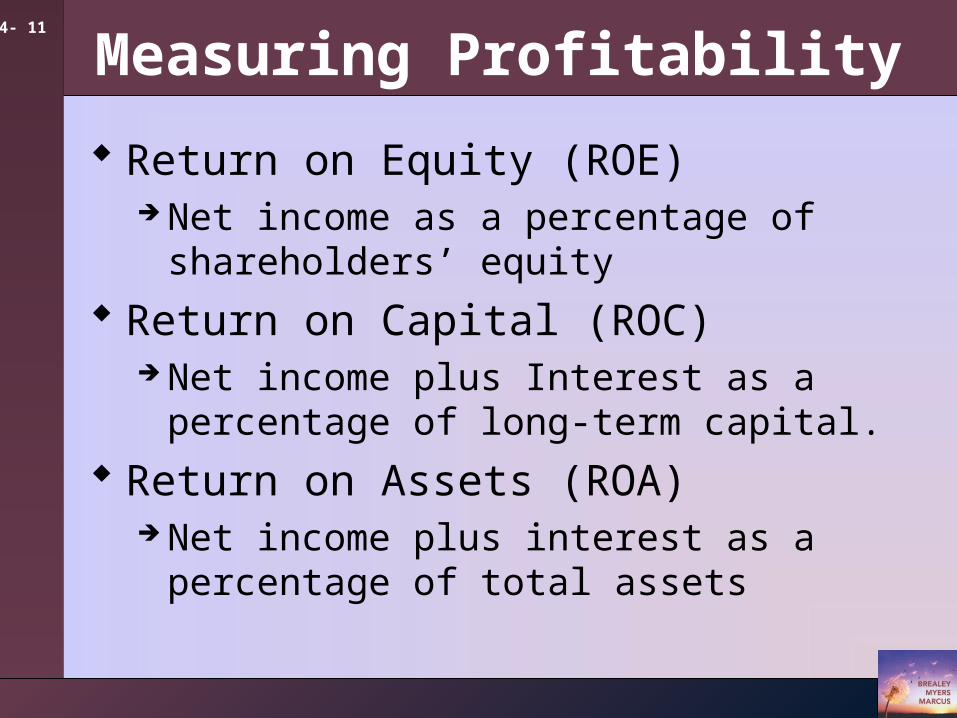
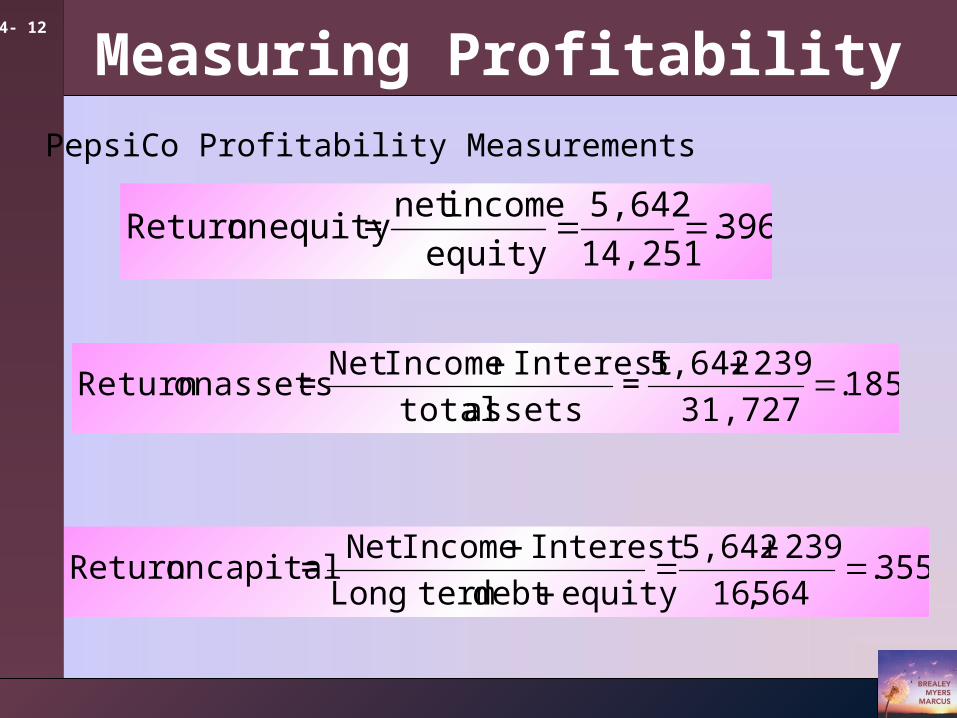
Return on Equity (ROE) Net income as a percentage of shareholders’
equity
Return on Capital (ROC) Net income plus Interest as a percentage of long-
term capital.
Return on Assets (ROA) Net income plus interest as a percentage of total
assets
4- 12
Measuring Profitability
396.14,251
5,642
equity
incomenet =equityon Return
185.31,727
2395,642=
assets total
Interest IncomeNet =assetson Return
355.564,16
2395,642
equity debt termLong
Interest IncomeNet =capitalon Return
PepsiCo Profitability Measurements
4- 13
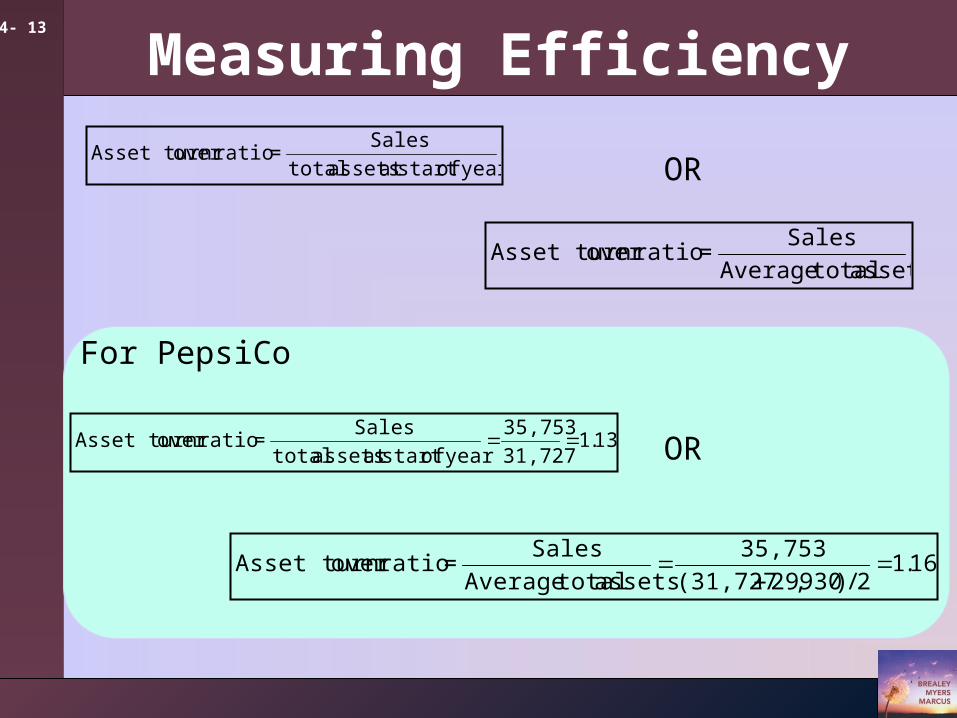
Measuring Efficiency
year ofstart at assets total
Sales=ratioover Asset turn
assets totalAverage
Sales=ratioover Asset turn
OR
13.131,727
35,753
year ofstart at assets total
Sales=ratioover Asset turn
16.12/)930,29(31,727
35,753
assets totalAverage
Sales=ratioover Asset turn
OR
For PepsiCo
4- 14
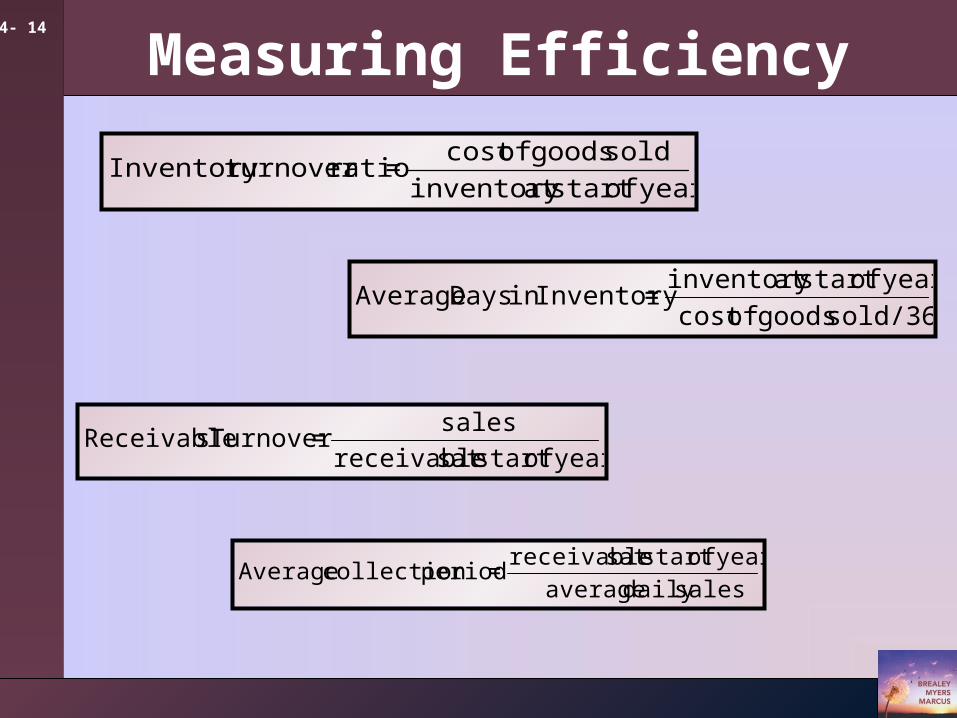
Measuring Efficiency
sold/365 goods ofcost
year ofstart at inventory =Inventoryin Days Average
year ofstart at inventory
sold goods ofcost =ratioturnover Inventory
salesdaily average
year ofstart at sreceivable=period collection Average
year ofstart at sreceivable
sales=Turnover sReceivable

4- 15
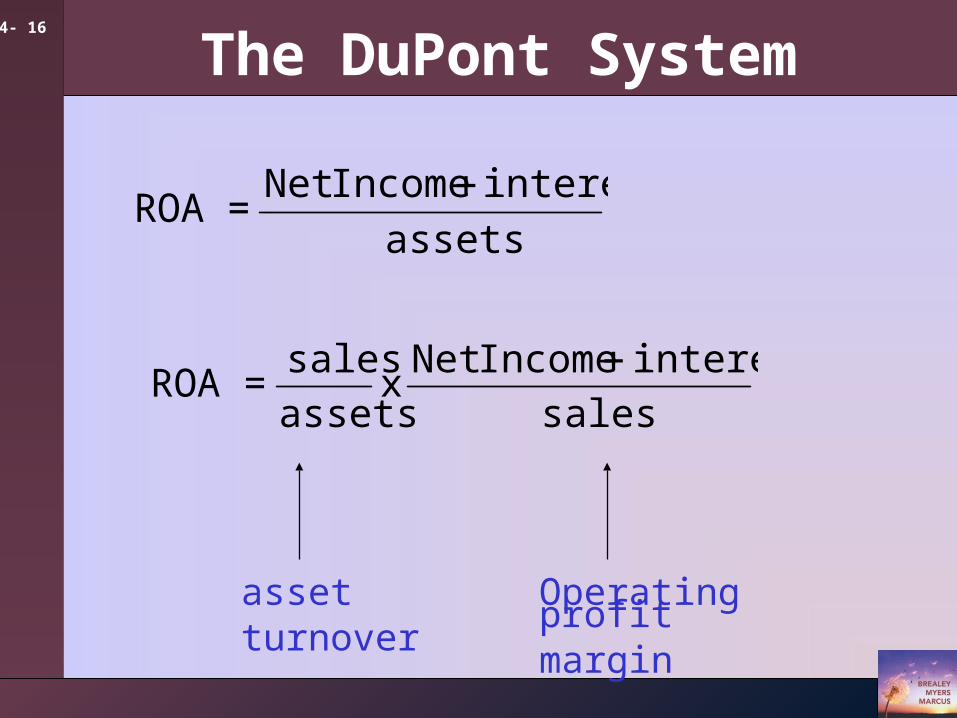
The DuPont System
A breakdown of ROE and ROA into component ratios
sales
Interest IncomeNet =MarginProfit Operating
sales
IncomeNet =MarginProfit
4- 16
The DuPont System
sales
interestIncomeNet x
assets
sales=ROA
assetturnover
Operating profitmargin
assets
interest IncomeNet =ROA

4- 17
Measuring Leverage
equity+debt termlong
debt termlong=ratiodebt termLong
equity
debt termlong=ratioequity Debt

4- 18
Measuring Leverage
Total debt ratio =total liabilities
total assets
Times interest earned =EBIT
interest payments
Cash coverage ratio =EBIT + depreciation
interest payments

4- 19
Measuring Leverage
interestIncomeNet
IncomeNet x
sales
interestIncomeNet x
assets
salesx
equity
assets=ROE
leverageratio
assetturnover
Operating profitmargin
debtburden

4- 20
Measuring Liquidity
Net working capital
to total assets ratio=
Net working capital
Total assets
Current ratio =current assets
current liabilities

4- 21
Liquidity Ratios
Cash ratio =cash + marketable securities
current liabilities
Quick ratio =cash + marketable securities + receivables
current liabilities
4- 22
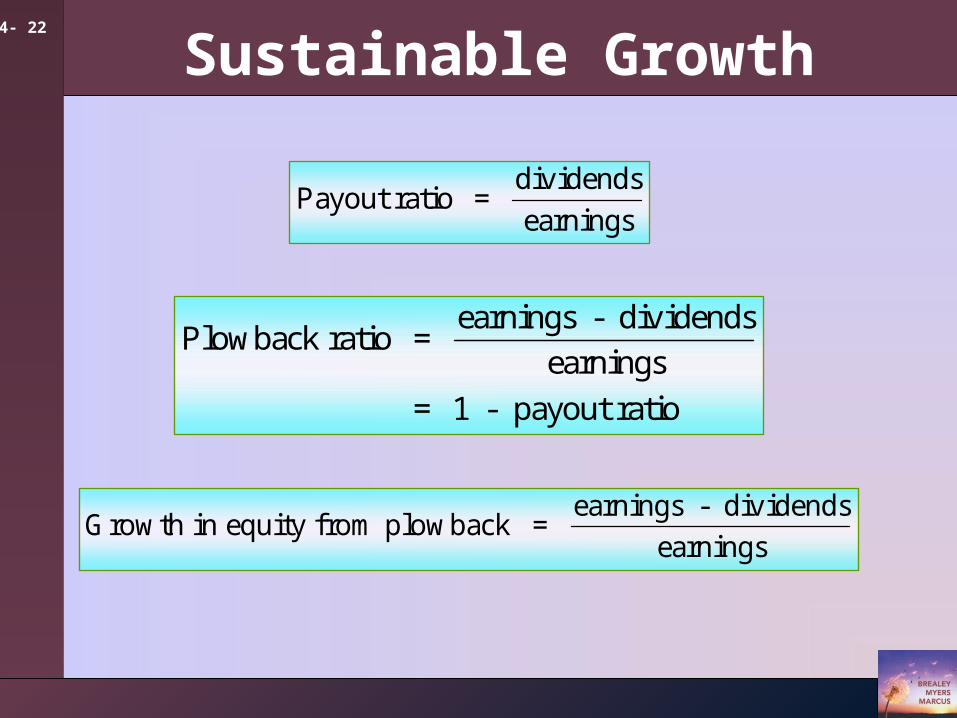
Sustainable Growth
Plowback ratio =earnings - dividends
earnings
= 1 - payout ratio
Payout ratio =dividends
earnings
Growth in equity from plowback =earnings - dividends
earnings

4- 23
Interpreting Financial Ratios
PepsiCo Ratios
4- 24
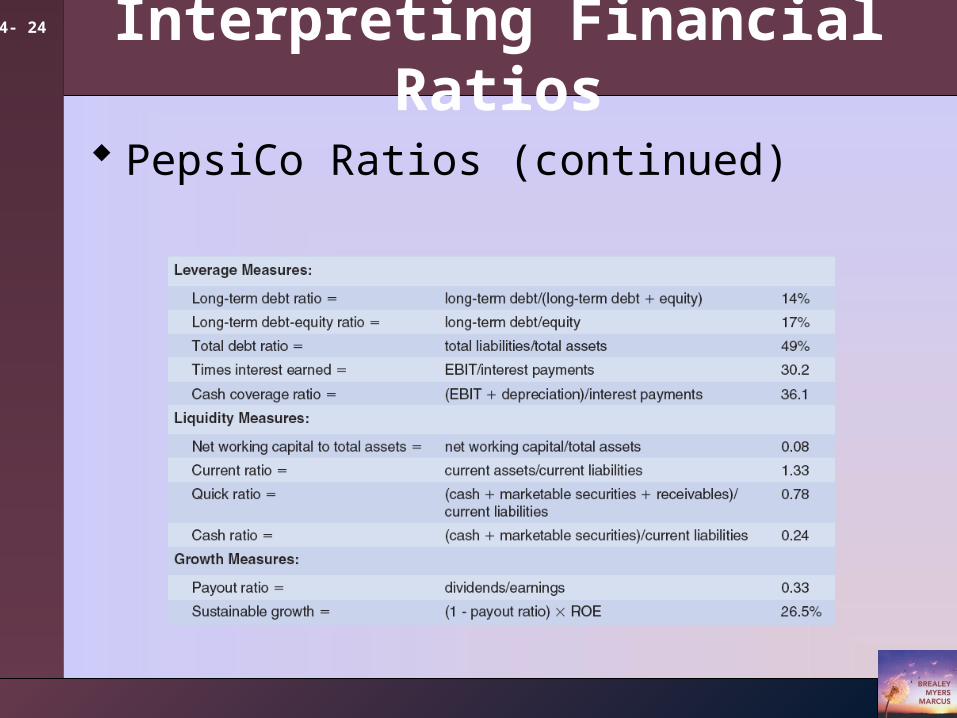
Interpreting Financial Ratios
PepsiCo Ratios (continued)
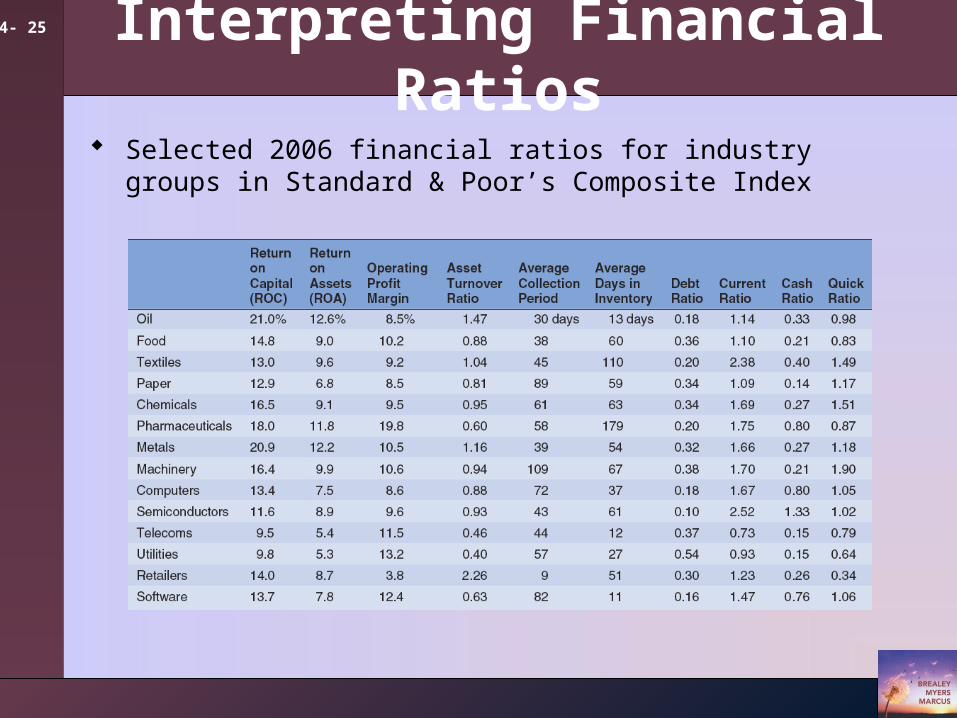
4- 25
Interpreting Financial Ratios Selected 2006 financial ratios for industry groups in Standard & Poor’s
Composite Index

4- 26
The Role of Financial Ratios

4- 27
Web Resources