
McGraw-Hill©The McGraw-Hill Companies, Inc., 2000 SUBNETTING.
date post
22-Dec-2015Category
view
213download
0
4-1
Chapter
Four
McGraw-Hill/Irwin
© 2006 The McGraw-Hill Companies, Inc., All Rights Reserved.
Describing Data: Displaying and Exploring Data
4-2
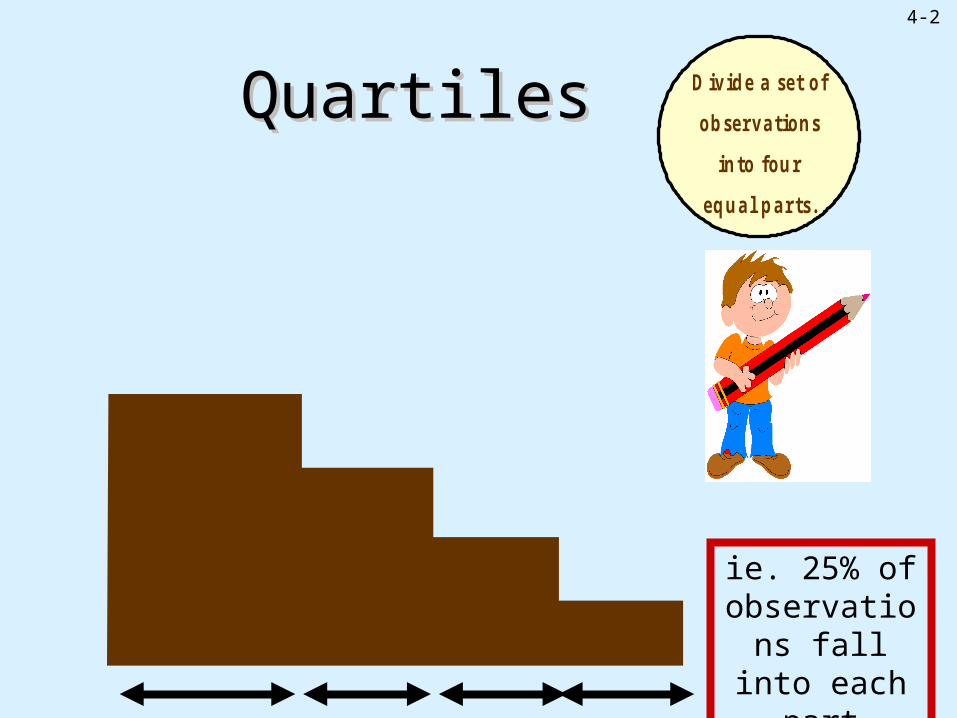
D iv id e a se t o f
o b serv a tio n s
in to fo u r
eq u a l p a rts .
QuartilesQuartiles
ie. 25% of observations fall into each
part
4-3
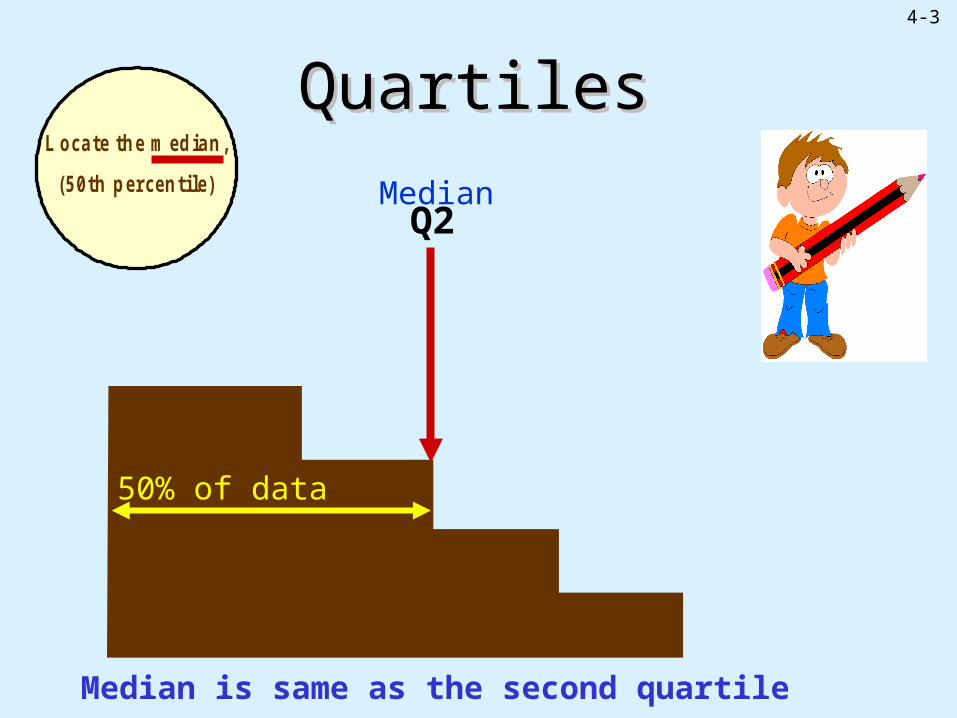
QuartilesQuartilesL o ca te th e m ed ia n ,
(5 0 th p ercen tile )
Q2Median
50% of data
Median is same as the second quartile

4-4
QuartilesQuartilesQuartilesQuartilesL o ca te th e m ed ia n ,
(5 0 th p ercen tile )
th e first q u artile
(2 5 th p ercen tile )
Quartiles (continued)
Q2Q1 Median
25% of data
50% of data
4-5
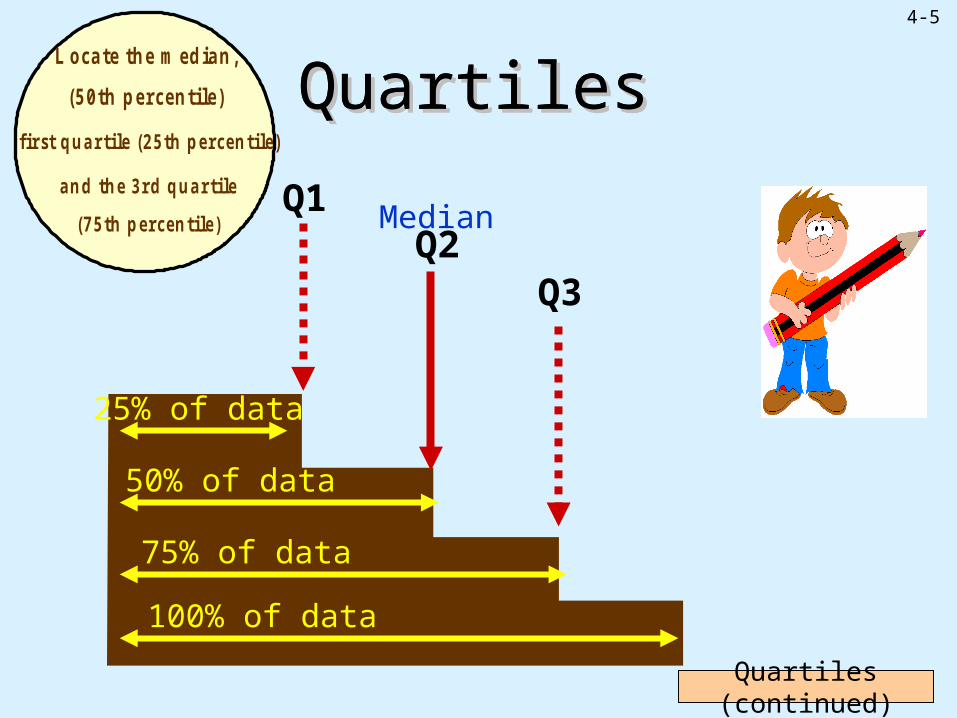
QuartilesQuartilesQuartilesQuartilesL o ca te th e m ed ia n ,
(5 0 th p ercen tile )
first q u a rtile (2 5 th p ercen tile )
a n d th e 3rd q u artile
(7 5 th p ercen tile )
Quartiles (continued)
Q3
Q1Q2
25% of data
50% of data
75% of data
100% of data
Median
4-6
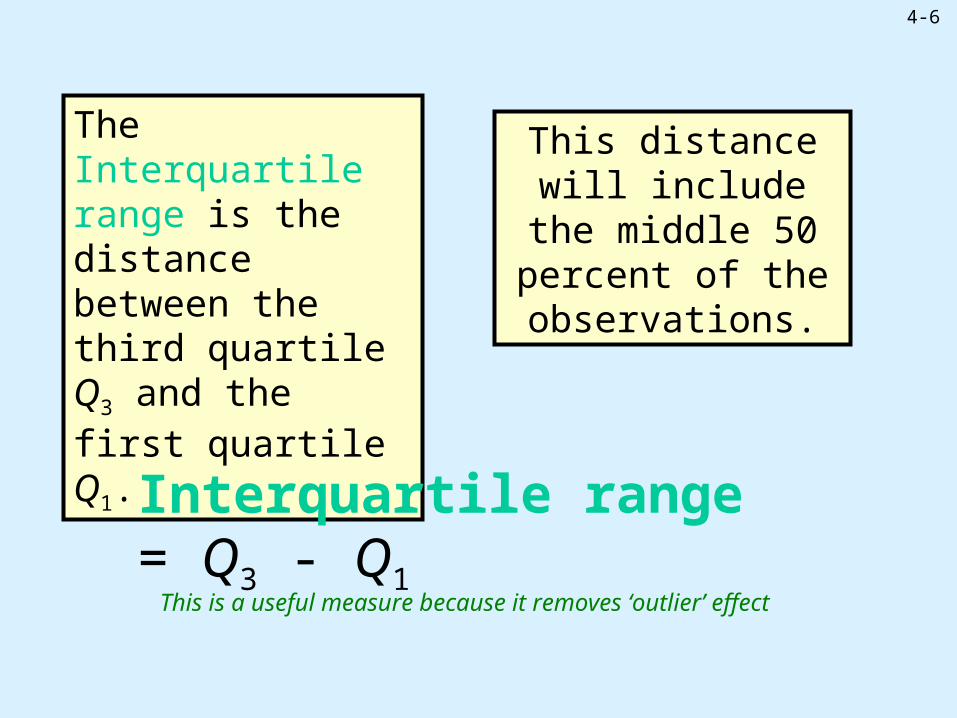
The Interquartile range is the distance between the third quartile Q3 and the first quartile Q1.
This distance will include the middle 50
percent of the observations.
Interquartile range = Q3 - Q1
This is a useful measure because it removes ‘outlier’ effect

4-7
Location of a PercentileLocation of a Percentile
P
1 0 0
w h ere
P is th e d e s ired p e rcen tile
Lp = (n+1)
n is the number of observations
Notice, if P=50, then you get Median! Remember (n+1)/2 ?
Useful for comparisons – eg. Performance in SAT of two students who took the test in different years
4-8
Exercise
• Do self-review 4-2, page 99
• Do problem #3, page 100

4-10
Skewness - measure of symmetry in a distribution
symmetric
If the tail is longer towards more positive, it is a positive skew
If the tail is longer towards zero (or more negative), it is a negative skew
4-11
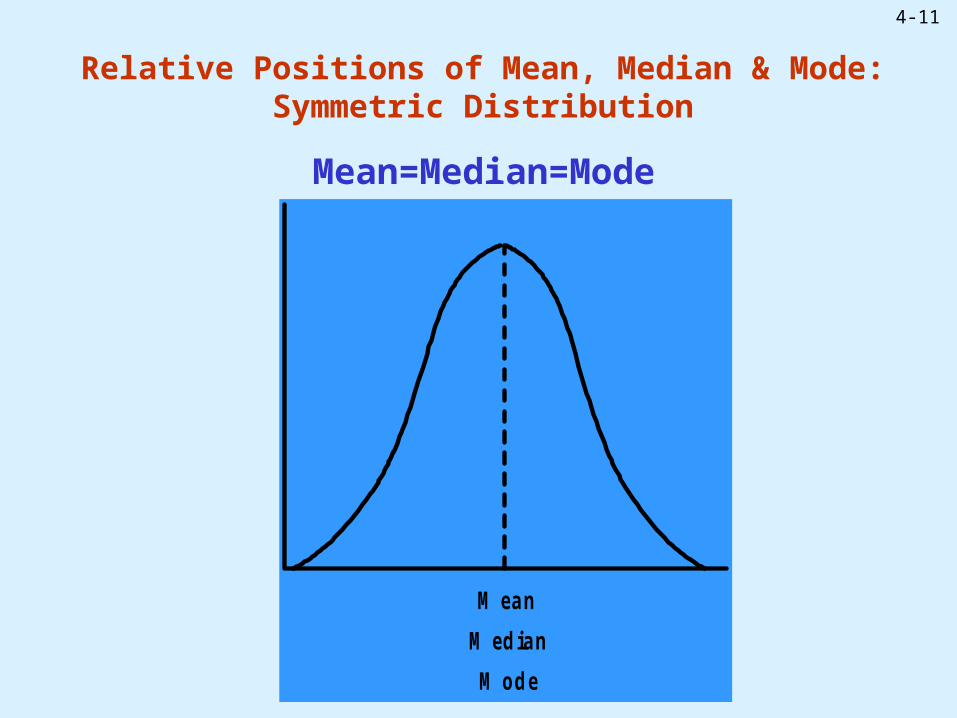
Relative Positions of Mean, Median & Mode:Symmetric Distribution
Mean=Median=Mode
M o d e
M ed ia n
M ea n
4-12
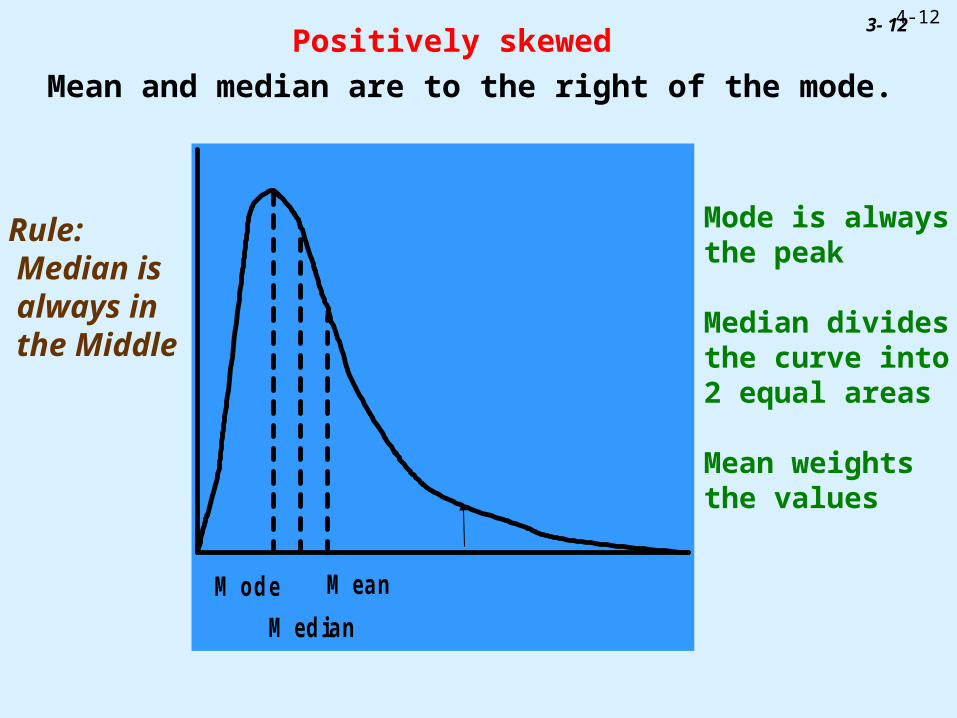
Positively skewed
Mean and median are to the right of the mode.
M o d e
M ed ia n
M ea n
3- 12
Rule: Median is always in the Middle
Mode is always the peak
Median divides the curve into 2 equal areas
Mean weights the values

4-13
Negatively Skewed
Mean and Median are to the left of the Mode.
M o d eM ea n
M ed ia n
3- 13
Rule: Median is always in the Middle

4-14
Study this example in text (Pages
69-70)
4-15
Chapter FourDescribing Data: Displaying and Describing Data: Displaying and
Exploring DataExploring Data
GOALS Accomplished in this Chapter
TWOCompute and understand the coefficient of variation and the coefficient of skewness.
ONE Develop and interpret quartiles and percentiles
Goals