3X GROWTH MODEL
61
Transcript of 3X GROWTH MODEL

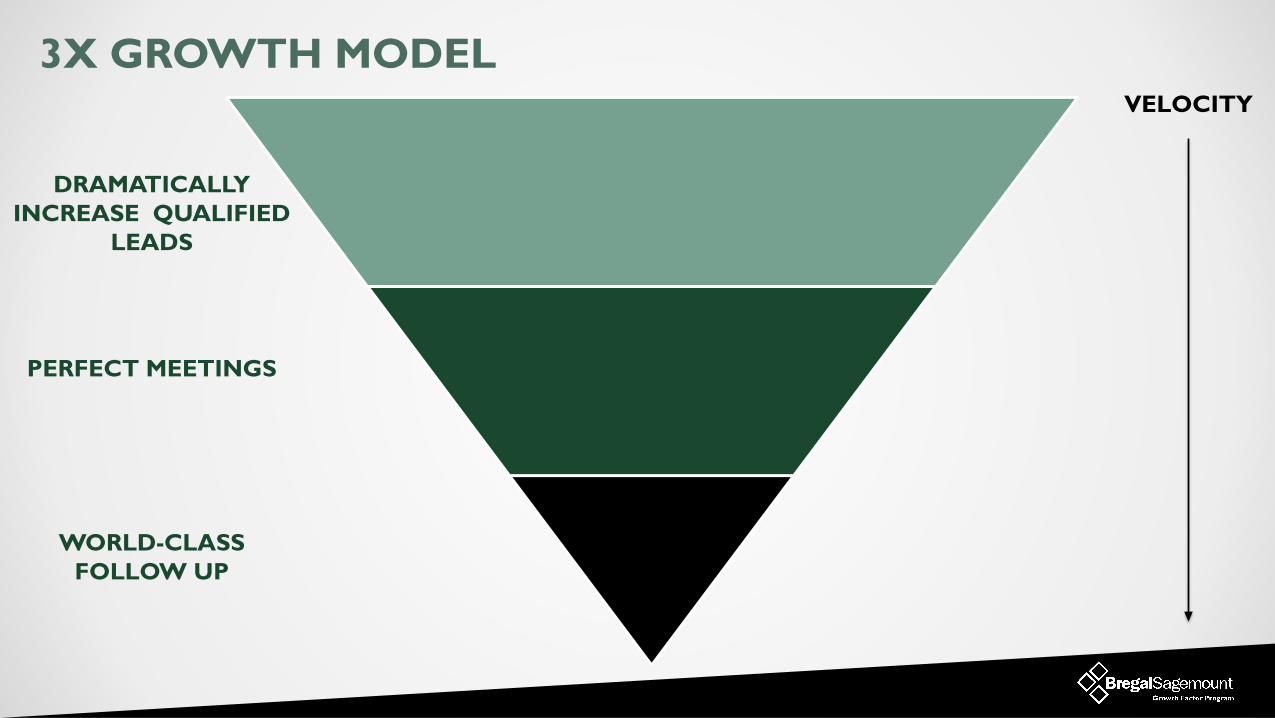
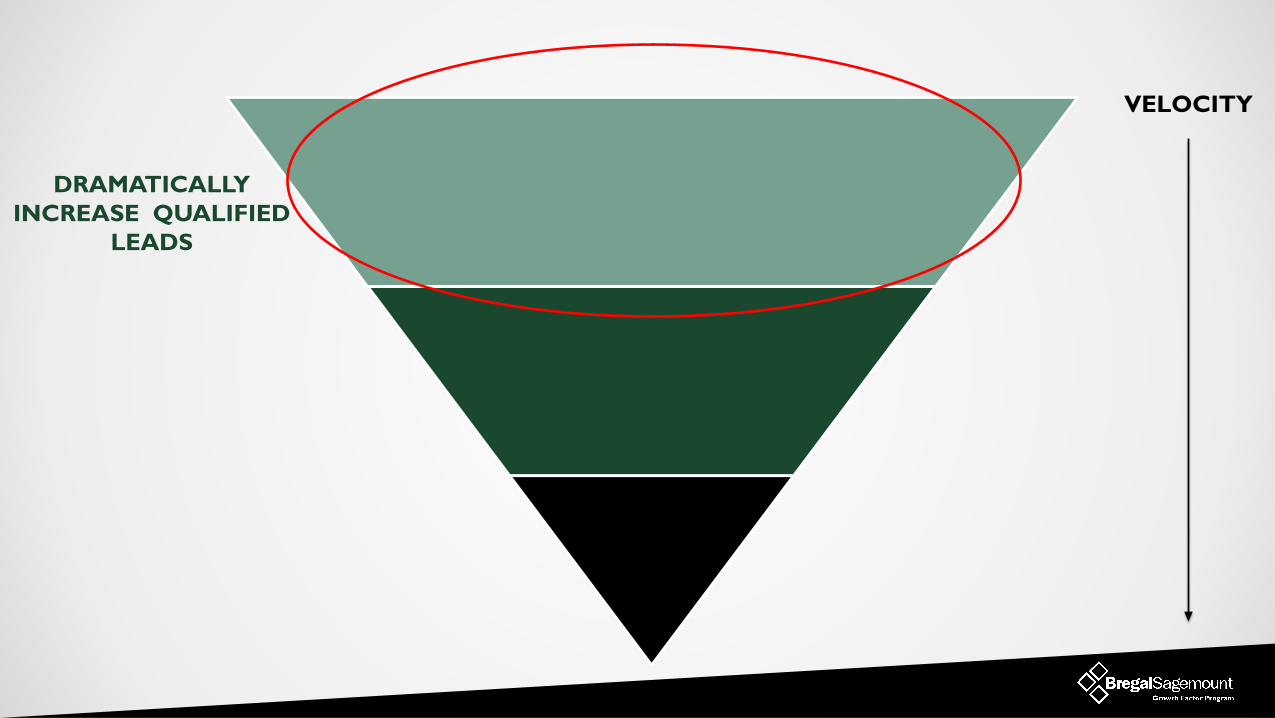
3X GROWTH MODEL
DRAMATICALLY INCREASE QUALIFIED
LEADS
PERFECT MEETINGS
WORLD-CLASS FOLLOW UP
VELOCITY

SALES VELOCITY EQUATION
SALES VELOCITY

PEOPLE
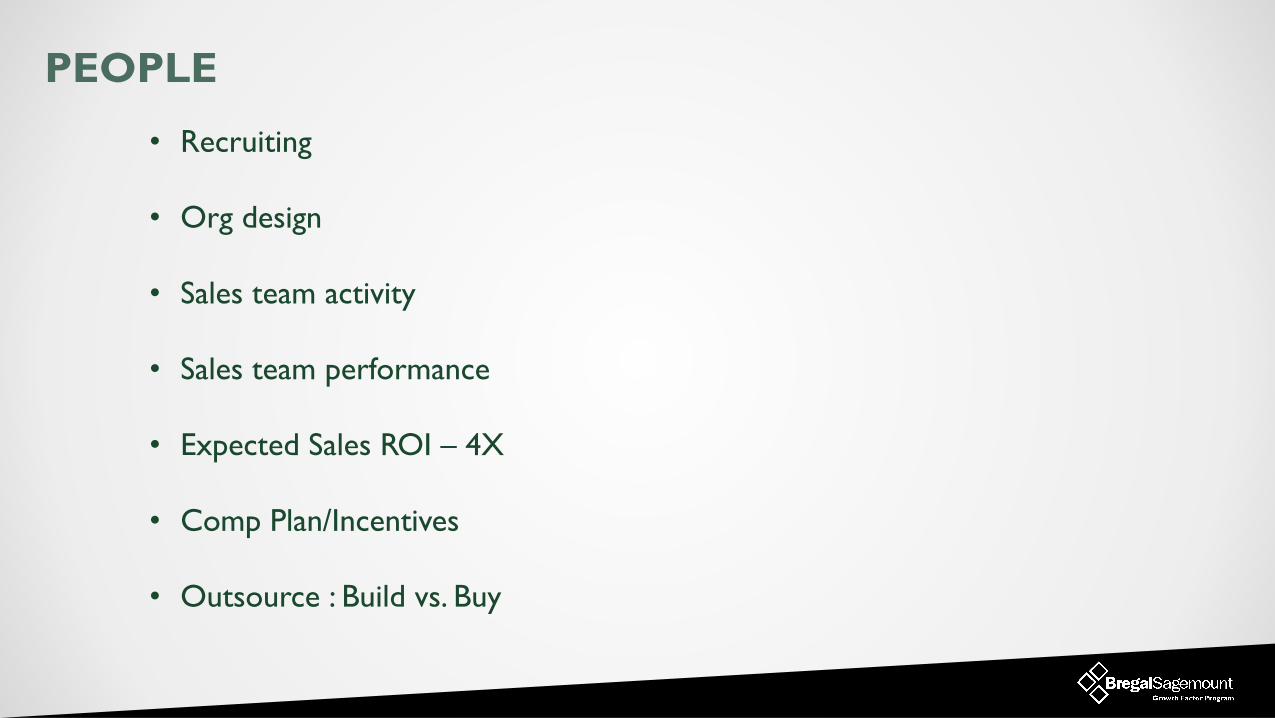
PEOPLE• Recruiting
• Org design
• Sales team activity
• Sales team performance
• Expected Sales ROI – 4X
• Comp Plan/Incentives
• Outsource : Build vs. Buy

ORIGINAL ORG DESIGN EXAMPLE

CRO
Sales
Commercial
Government
Small Business
CAM + SAM
Sales Engineers/Technical
Writers
Sales Development
Marketing
Communications
Creative
Content
Events
Partner/Channel
ENHANCED ORG DESIGN EXAMPLE

SALES PERFORMANCE – COMMERCIAL MEETINGSTEAM SALES REP DISC. MEETINGS
MONTHLY AVG.DEMOS MONTHLY
AVG.
CommercialA 4.5 2.5
CommercialB 4.9 2.8
CommercialC 11.2 1.2
CommercialD 1.2 0.5
CommercialE 2.8 1.1
CommercialTOTAL 4.9 1.6
YTD Average

SALES PERFORMANCE – GOVERNMENT MEETINGS
TEAM SALES REP DISC. MEETINGS MONTHLY AVG.
DEMOS MONTHLY AVG.
Government A 1.8 0.6
Government B 5.7 0.3
Government C 1.2 0.9
Government D 3.7 1.7
Government TOTAL 3.1 0.9YTD Average

SALES PERFORMANCE – SMALL BUSINESS MEETINGS
TEAM SALES REP DISC. MEETINGS MONTHLY AVG.
DEMOS MONTHLY AVG.
Small Business A 21.1 6.3
Small Business B 6.0 4.0
Small Business C 18.2 11.5
Small Business D 22.8 13.2
Small Business E 20.9 7.5
Small Business F 23.5 7.1
Small Business TOTAL 18.7 8.3 YTD Average

SALES PERFORMANCE - TOTAL
SALES REP TEAM Quota: Prev. 8 Quarters ARR : Past 8 Quarters % to Quota: Past 8 QuartersA Commercial $1,589,500 $536,655 34%
B Commercial $958,000 $1,063,619 111%
C Commercial $958,000 $855,940 89%
D Commercial $918,083 $276,374 30%
E Commercial $758,416 $166,058 22%
A Government/Strategic $1,800,000 $1,636,449 91%
B Government/Strategic $1,800,000 $1,004,014 56%
C Government/Strategic $900,000 $25,636 3%
D Government/Strategic $825,000 $21,706 3%
A Small Business $400,000 $330,584 83%
B Small Business $332,000 $277,668 84%
C Small Business $332,000 $243,002 73%
D Small Business $282,000 $380,562 135%
E Small Business $282,000 $315,133 112%
F Small Business $11,000 $19,810 180%
TOTAL $12,145,999 $7,153,212 59%

SALES PERFORMANCE - COMMERCIAL
SALES REP TEAM Quota: Prev. 8 Quarters ARR : Past 8 Quarters % to Quota: Past 8 QuartersA Commercial $1,589,500 $536,655 34%B Commercial $958,000 $1,063,619 111%C Commercial $958,000 $855,940 89%D Commercial $918,083 $276,374 30%E Commercial $758,416 $166,058 22%
TOTAL Commercial $5,181,999 $2,898,647 56%

SALES PERFORMANCE - GOVERNMENT
SALES REP TEAM Quota: Prev. 8 Quarters ARR : Past 8 Quarters % to Quota: Past 8 QuartersA Government/Strategic $1,800,000 $1,636,449 91%B Government/Strategic $1,800,000 $1,004,014 56%C Government/Strategic $900,000 $25,636 3%D Government/Strategic $825,000 $21,706 3%
TOTAL Government/Strategic $5,325,000 $2,687,806 50%

SALES PERFORMANCE – SMALL BUSINESS
SALES REP TEAM Quota: Prev. 8 Quarters ARR : Past 8 Quarters % to Quota: Past 8 QuartersA Small Business $400,000 $330,584 83%B Small Business $332,000 $277,668 84%C Small Business $332,000 $243,002 73%D Small Business $282,000 $380,562 135%E Small Business $282,000 $315,133 112%F Small Business $11,000 $19,810 180%G Small Business $400,000 $330,584 83%
TOTAL Small Business $1,639,000 $1,566,759 96%

SALES PERFORMANCETeam Sales Rep Tenure : Months Historical ARR Booked Avg. ARR Booked Monthly
Commercial A 144 $1,329,015 $9,229Commercial B 137 $944,366 $6,893Commercial C 42 $1,317,034 $31,358Commercial D 27 $278,720 $10,323Commercial E 22 $168,154 $7,643
Commercial Team Avg. $13,089
Government A 145 $1,770,606 $12,211Government B 138 $944,366 $25,727Government C 15 $21,706 $1,447Government D 14 $25,636 $1,831
Government Team Avg. $10,304
Small Business A 50 $389,263 $7,785Small Business B 42 $459,475 $10,940Small Business C 37 $301,913 $8,160Small Business D 36 $389,306 $10,814Small Business E 34 $335,997 $9,882Small Business F 5 $22,444 $4,489
Small Business Team Avg. $8,678
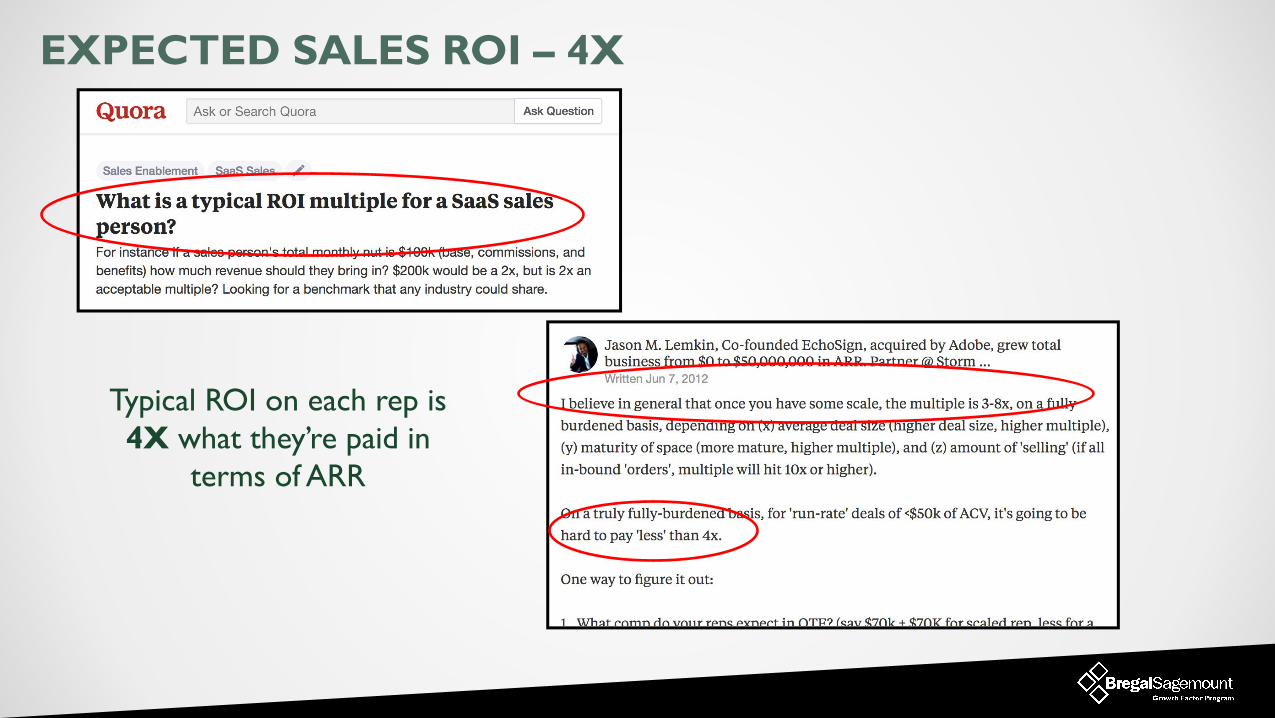
EXPECTED SALES ROI – 4X
Typical ROI on each rep is 4X what they’re paid in
terms of ARR

EXAMPLE 4X ARR TARGET
Team Sales RepTotal ARR Booked
Monthly Base Salary VariableTotal Sales
Expense
TotalARR Bookings
Run Rate4X ARR Target
Commercial A $9,229 $80,000 $18,827 $98,827 $110,748 1.12Commercial B $6,893 $80,000 $14,061 $94,061 $82,716 0.88Commercial C $31,358 $80,000 $63,970 $143,970 $376,296 2.61Commercial D $10,323 $80,000 $21,058 $101,058 $123,876 1.23Commercial E $7,643 $80,000 $15,591 $95,591 $91,716 0.96
Commercial TOTAL $13,089 $400,000 $133,507 $533,507 $785,352 1.47
Government A $12,211 $80,000 $24,910 $104,910 $146,532 1.40Government B $25,727 $80,000 $52,483 $132,483 $308,724 2.33Government C $1,447 $80,000 $2,951 $82,952 $17,364 0.21
Government D $1,831 $80,000 $3,735 $83,735 $21,972 0.26
Government TOTAL $10,304 $320,000 $84,080 $404,081 $494,592 1.22
Small Business A $7,785 $45,000 $15,881 $60,881 $93,420 1.53Small Business B $10,940 $45,000 $22,317 $67,317 $131,280 1.95Small Business C $8,160 $45,000 $16,646 $61,646 $97,920 1.59Small Business D $10,814 $45,000 $22,060 $67,060 $129,768 1.94Small Business E $9,882 $45,000 $20,159 $65,159 $118,584 1.82Small Business F $4,489 $45,000 $9,157 $54,157 $53,868 0.99
Small Business TOTAL $8,678 $270,000 $106,222 $376,222 $624,840 1.66

PROCESS

GROWTH FACTORS METHODOLOGY
1. Dramatically increase qualified leads
2. Conduct detailed call monitoring & scoring process
3. Track funnel conversions weekly by rep
4. Augment lead flow to highest converting rep (s)
DRAMATICALLY INCREASE QUALIFIED
LEADS
VELOCITY

EXAMPLE12 MONTH LEAD ANALYSIS
Unpredictable flow
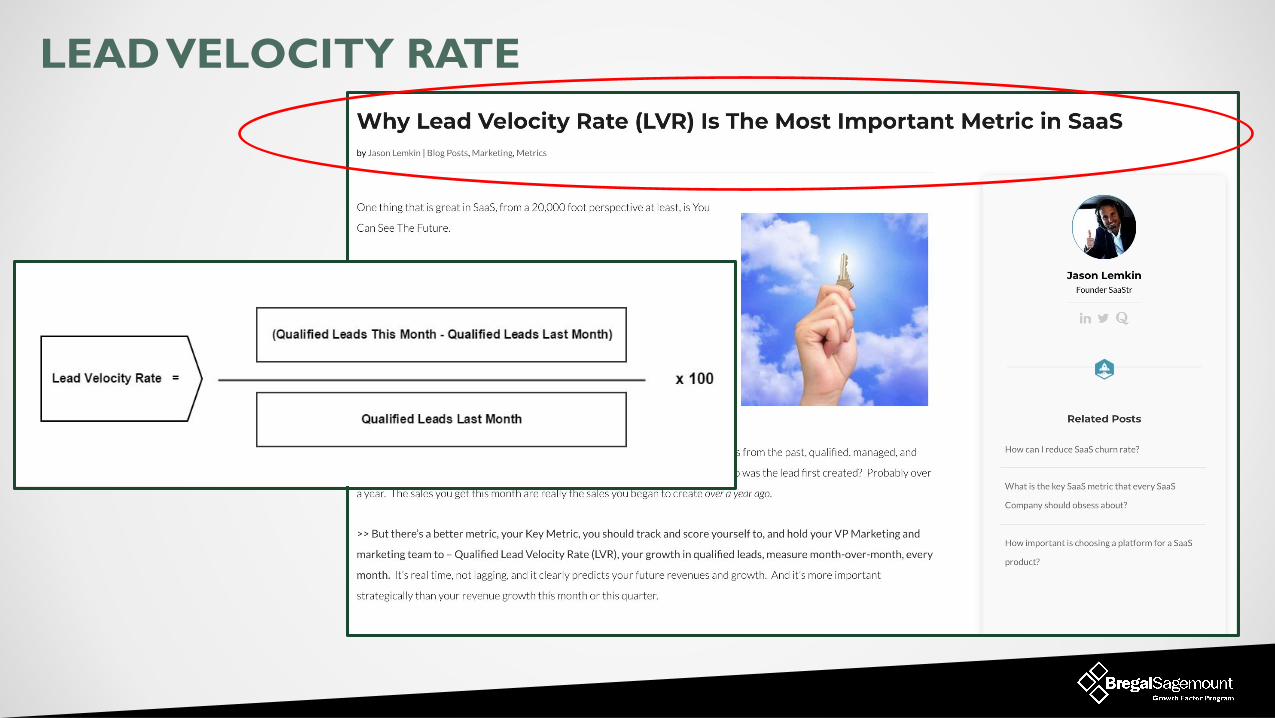
LEAD VELOCITY RATE

LEAD VELOCITY RATE“Your Key Metric, you should track and score yourself to, and hold your VP Marketing and marketing team to – Qualified Lead Velocity Rate (LVR), your growth in qualified leads, measure month-over-month, every month. It’s real time, not lagging, and it clearly predicts your future revenues and growth. And it’s more important strategically than your revenue growth this month or this quarter.
As long as you are using Qualified Leads, and you use a consistent formula and process to qualify them, you can then See The Future:” – Jason Lemkin, Co-Founder, CEO EchoSign

LEAD VELOCITY RATE EXAMPLE
3X
2X

OUTBOUND

40,000 Names
• 15 new leads per day per SDR
• 4 X 4 cadence
• 25-100 dials/day
• Manual calls/emails
• 3 Outbound SDRs
• 90 days old
TYPICAL OUTBOUND MODEL

• 15 new leads per day per SDR * 3 SDRs = 45 new leads per day
• 260 business days per year * 45 leads per day = 11,700 leads/year
• 40,000 total leads / 11,700/year = 3.41 years
TYPICAL OUTBOUND MODEL

o Manual
o Old Data (Data decay = 7% per month)
o Unpredictable Flow
o Low Velocity
o Targeting Small Deal Sizes
TYPICAL OUTBOUND MODEL - PROBLEMS

Cold CallingCold Emailing
Enterprise
Mid-Market Government
Small Business
PROPOSED OUTBOUND MODEL
Cold Calling

PREDICTABLE REVENUE
✔ Pioneered Cold Email
✔ Infinitely Scalable
✔ Data (NetProspex, DiscoverOrg, ClearBit, FullContact)
✔ Highest Velocity Cold Email Product Available
✔ Domain Protection
✔ Predictable Conversion
✔ Pay Per Hand-Off

MRP
✔ 10 Global Offices - 1,400 Employees
✔ Prelytix (Intent Data)
✔ Data (NetProspex, DiscoverOrg, ClearBit, FullContact)
✔ BANT Qualified Meetings
✔ World Class Meeting Management Process
✔ Pay Per Meeting Held

Cold Emailing
SMALL BUSINESS OUTBOUND MODEL
Cold Calling
Small Business
✔ High Velocity Emailing & Calling
✔ High Velocity Email - Outsourced to PR
✔ High Velocity Calling - In-house SDRs

ConnectAndSell
✔ 1000 dials per day per SDR

CAS MODEL - FUNNEL
SDRs Dials Conversations Meetings Scheduled Meetings Held Opportunities -# Opportunities - $ ARR Bookings - $ Closed Won - #
3 2400 317 9.5 6.6 5.6 $16,975 $4,413 1.45
3 12,000 1,585 47.5 33 28 $84,875 $22,065 7.28
3 52,000 6,868 205.8 143 121.3 $367,791 $95,615 31.53
3 624,000 82,416 2,469 1,716 1,455 $4,413,492 $1,147,380 378.3
Per Day
Per Week
Per Month
Per Year
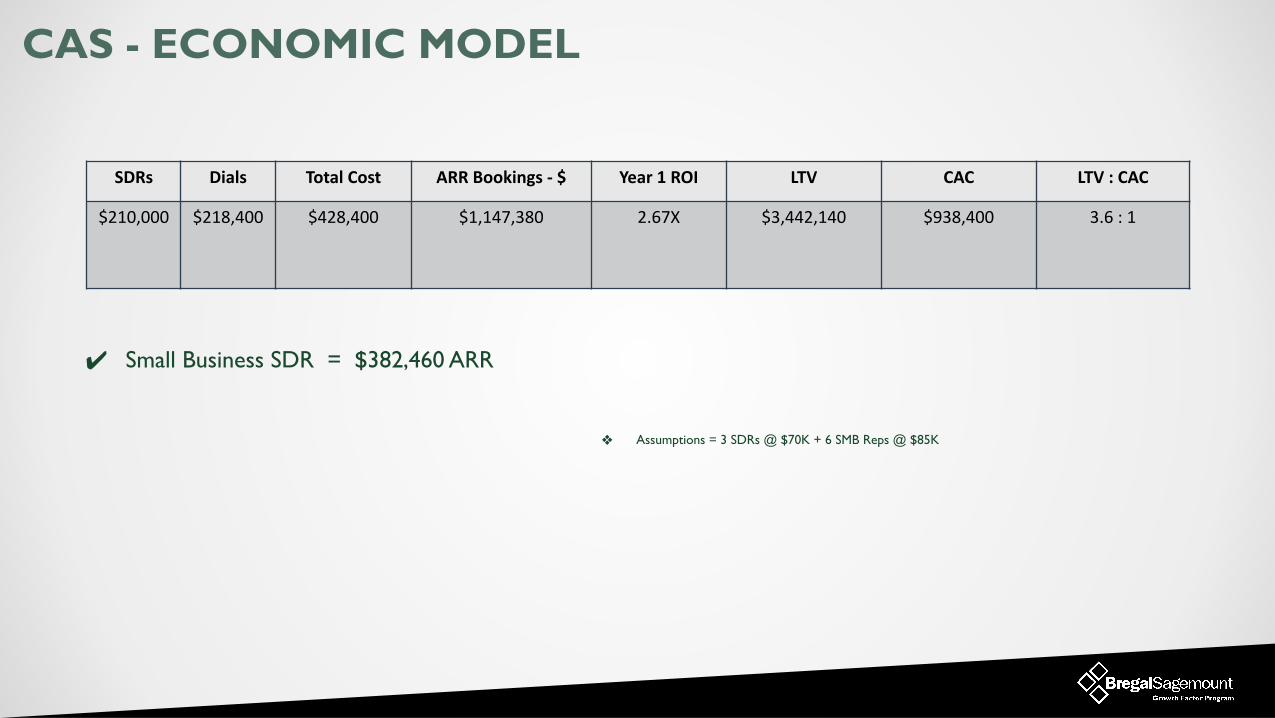
CAS - ECONOMIC MODEL
SDRs Dials Total Cost ARR Bookings - $ Year 1 ROI LTV CAC LTV : CAC
$210,000 $218,400 $428,400 $1,147,380 2.67X $3,442,140 $938,400 3.6 : 1
✔ Small Business SDR = $382,460 ARR
❖ Assumptions = 3 SDRs @ $70K + 6 SMB Reps @ $85K

INBOUND

TYPICAL INBOUND CHANNELS
o SEM o Printo Digital Ads (Pub.)o Trade showso SEOo Webinaro Facebooko Live Chato Research Reports
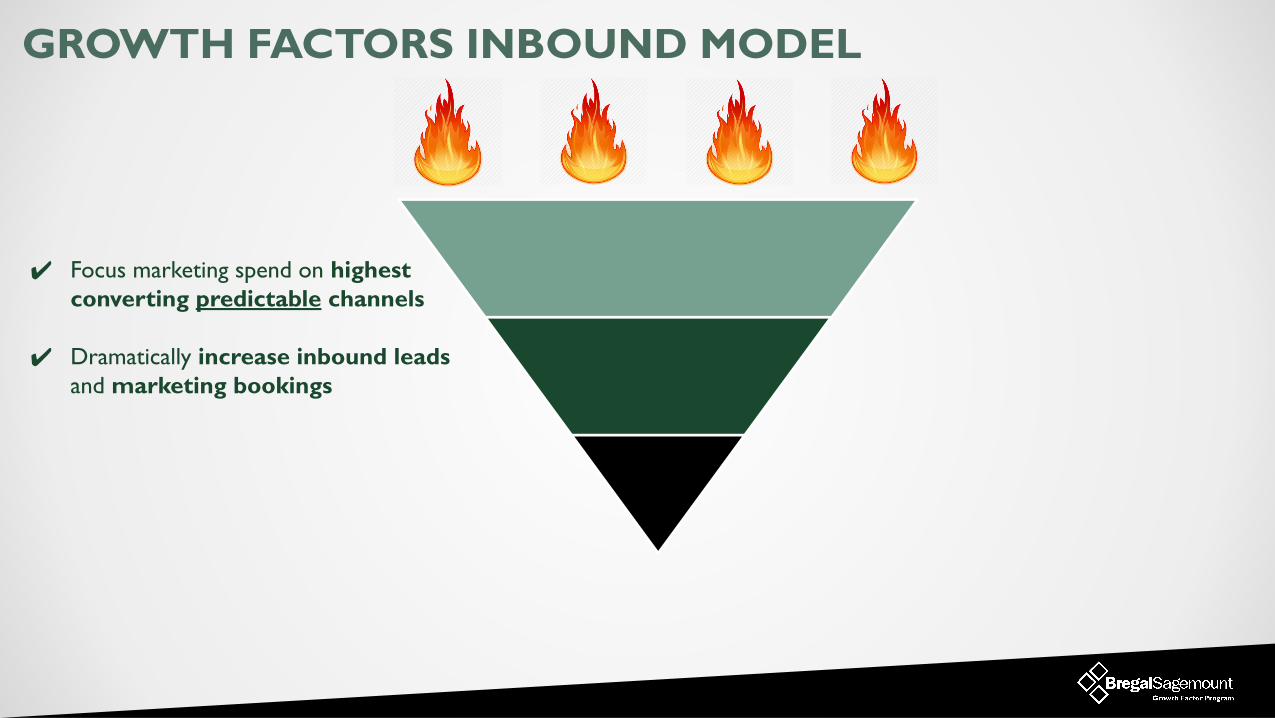
GROWTH FACTORS INBOUND MODEL
✔ Focus marketing spend on highest converting predictable channels
✔ Dramatically increase inbound leads and marketing bookings

EXAMPLE MARKETING ANALYSIS
Channel Average Monthly Spend % of Monthly Spend Opportunities Bookings
SEM (Google, Yahoo, Bing ) $23,466 13%
SEO $2,763 1%
Print (Publications) $40,655 22%
Digital (Publications) $39,591 21%
Trade Shows $58,803 32%
Research Reports $8,196 4%
Webinar $4,262 2%
Facebook Ads $3,106 2%
Purchased Lists $3,278 2%
Live Chat $2,459 1%
TOTAL $186,583
SEM Monthly avg. reduced from $29K/mo in 2016 to $16K/mo in 2018

EXAMPLE MARKETING ANALYSIS
Trade show #13
Digital Channels
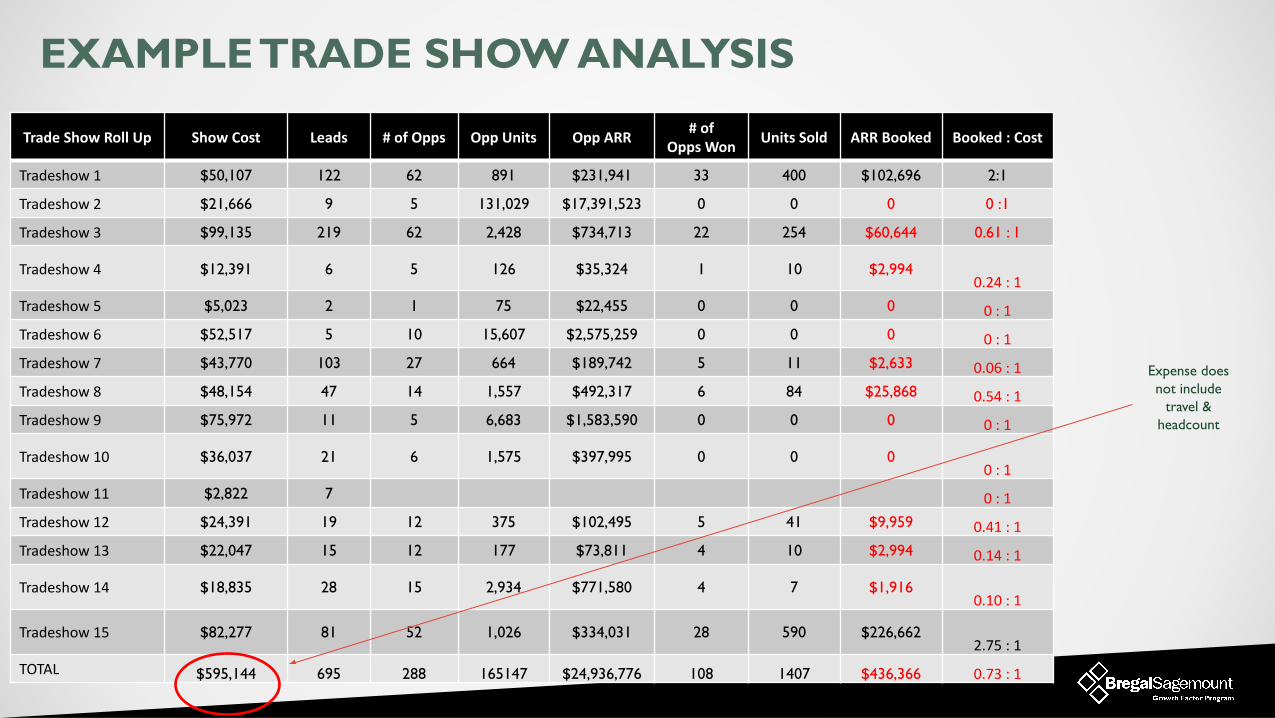
EXAMPLE TRADE SHOW ANALYSIS
Trade Show Roll Up Show Cost Leads # of Opps Opp Units Opp ARR # of
Opps Won Units Sold ARR Booked Booked : Cost
Tradeshow 1 $50,107 122 62 891 $231,941 33 400 $102,696 2:1
Tradeshow 2 $21,666 9 5 131,029 $17,391,523 0 0 0 0 :1
Tradeshow 3 $99,135 219 62 2,428 $734,713 22 254 $60,644 0.61 : 1
Tradeshow 4 $12,391 6 5 126 $35,324 1 10 $2,994 0.24 : 1
Tradeshow 5 $5,023 2 1 75 $22,455 0 0 0 0 : 1
Tradeshow 6 $52,517 5 10 15,607 $2,575,259 0 0 0 0 : 1
Tradeshow 7 $43,770 103 27 664 $189,742 5 11 $2,633 0.06 : 1
Tradeshow 8 $48,154 47 14 1,557 $492,317 6 84 $25,868 0.54 : 1
Tradeshow 9 $75,972 11 5 6,683 $1,583,590 0 0 0 0 : 1
Tradeshow 10 $36,037 21 6 1,575 $397,995 0 0 00 : 1
Tradeshow 11 $2,822 7 0 : 1
Tradeshow 12 $24,391 19 12 375 $102,495 5 41 $9,959 0.41 : 1
Tradeshow 13 $22,047 15 12 177 $73,811 4 10 $2,994 0.14 : 1
Tradeshow 14 $18,835 28 15 2,934 $771,580 4 7 $1,916 0.10 : 1
Tradeshow 15 $82,277 81 52 1,026 $334,031 28 590 $226,662 2.75 : 1
TOTAL $595,144 695 288 165147 $24,936,776 108 1407 $436,366 0.73 : 1
Expense does not include
travel & headcount

SEM
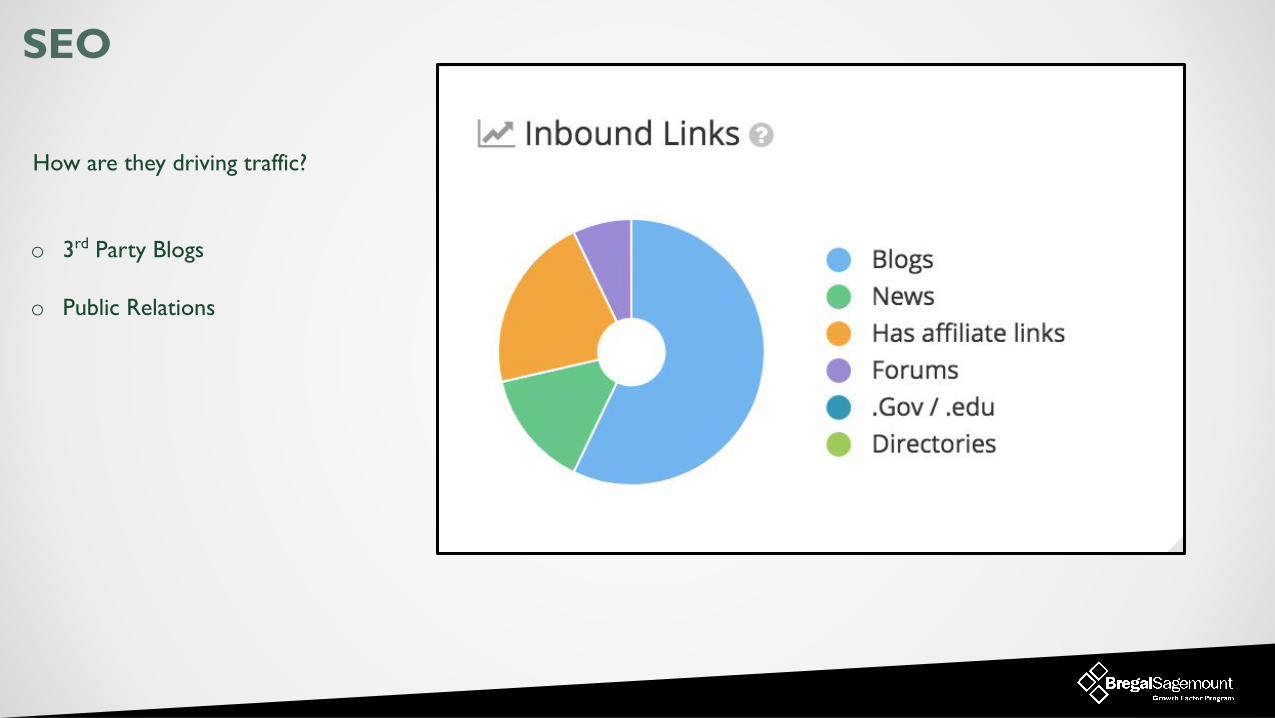
SEO
How are they driving traffic?
o 3rd Party Blogs
o Public Relations

LIVE CHAT – TYPICAL PROBLEMS
o 40% of live chat is support related, inefficient use of SDR time
o Not 24/7/365
o No designated conversation swim lanes to guide prospects
o 100% Manual from SDR

LIVE CHAT SOLUTION – DRIFT
o Chat Bot works 24/7/365
o Automatically Book Meetings For Your Sales Team
o Bots Route Conversations Based On Your Routing Rules

EXAMPLE MARKETING RECOMMENDATIONS
✔ Clearly define brand building spend vs. lead gen
✔ Reallocate funds to marketing channels that drive more qualified leads and immediate bookings
o SEM/SEO & Outbound
✔ Publications/Associations/Tradeshows can drive leads but are not typically a predictable “go to” source for active buyers at scale in comparison to Google SEM or SEO. Publications/Associations/Tradeshows = branding

TYPICAL PARTNERS / CHANNELS - PROBLEMS
o Support focused
o Not hyper-growth oriented
o Missing out on large opportunities
o Needs dedicated sales leadership & channel sales

PARTNERS / CHANNELS FRAMEWORK

3X GROWTH MODEL
PERFECT MEETINGS
VELOCITY

PERFECT MEETINGS - 7 PARTS
✔ Each part scored 0-3 ✔ Perfect Score = 21

PERFECT MEETINGS – CHEAT SHEET
PERFECT MEETINGS – INCENTIVES
✔ $25 - $100 per perfect meeting
✔ Ramp threshold
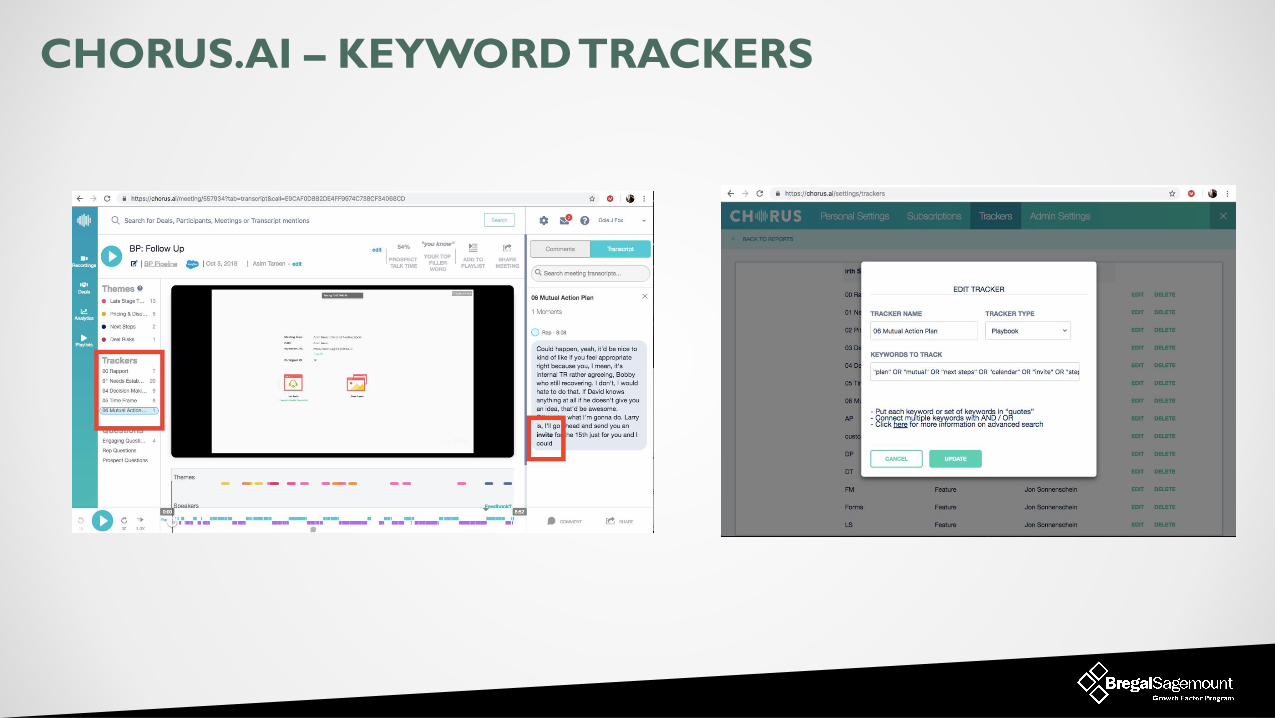
CHORUS.AI – KEYWORD TRACKERS

PERFECT MEETING - SCORING SPREADSHEET

PERFECT MEETING – WEEKLY TUNE UP

SOURCING HEROES CASE STUDY
✔ Avg. score of 10 (Spring of 18) 🡪 Avg. score of 19 (Summer of 18)
✔ 90% Increase

3X GROWTH MODEL
WORLD-CLASS FOLLOW UP
VELOCITY

WORLD-CLASS FOLLOW UP
✔ Follow up must be systematic
✔ No lead/meeting left behind
✔ Use system driven tech to follow up and increase bandwidth
• When lead/meeting volume dramatically increases, so does the required follow up

OUTREACH.IO

OUTREACH.IO – EXAMPLE
• 2014 – April 2018 = 27 Follow Up Tasks
• 2018 – April 2018 – Sept 2018 = 28 Follow Up Tasks
• Closed Won - $8,965 MRR on 9/25

MANAGING FOLLOW UP TASKS
A
BCD